Article

Sensitivity Analysis of Urban Landscape Lake Transparency Based on Machine Learning in Taiyuan City

1
College of Environmental Science and Engineering, Taiyuan University of Technology, Jinzhong 030600, China
2
State Key Laboratory of Clean and Efficient Coal Utilization, Taiyuan University of Technology, Taiyuan 030024, China
3
Coshare Energy Environment, Taiyuan 030002, China
*
Author to whom correspondence should be addressed.
Sustainability 2024, 16(16), 7026; https://doi.org/10.3390/su16167026
Submission received: 7 July 2024 / Revised: 13 August 2024 / Accepted: 14 August 2024 / Published: 16 August 2024

Abstract

:
This article addresses the challenge of maintaining water quality in urban landscape lakes in water-scarce cities using transparency as the key indicator. The sensitivity of water transparency to nine water quality parameters, including chlorophyll a and inorganic suspended solids, in 16 urban landscape lakes of the city of Taiyuan was evaluated using the Sobol and Morris sensitivity analysis methods. The results indicate that for water bodies supplied by surface water, critical factors include chlorophyll a and hydraulic retention time. For water bodies supplied by tap water, inorganic suspended solids and total phosphorus are more significant. Water bodies with a dual function of urban flood control should focus on dissolved oxygen, ammonium nitrogen, and chemical oxygen demand. Based on these findings, targeted management strategies are proposed to enhance algae management, control suspended solids input, and adjust water retention times, aiming to improve the transparency and quality of Taiyuan’s urban landscape.

Graphical Abstract

1. Introduction

Urban landscape lakes (ULLs) are cherished globally for their aesthetic and recreational value [1]. These bodies mostly provide urban water environments and recreational spaces [2,3]. Typically, they are closed or semi-closed bodies of water that are easily disturbed by human activities and have slow water flow. With the acceleration of urbanization [4], maintaining good landscape effects has become increasingly important [5,6].
Sensitivity analysis is widely applied to address water quality issues. It allows researchers to study how uncertainties in model outputs can be attributed to different sources of uncertainties in model inputs [7]. Unlike qualitative analysis, which characterizes model-output uncertainties based on empirical probability densities or confidence boundaries, sensitivity analysis aims to identify the main sources of these uncertainties [8], calculate the contributions of each parameter to the model, and provide a method to evaluate parameter influence. Sensitivity analysis has been extensively used in various fields [9,10,11,12], including complex dynamic systems [13], botany [10], environmental models, architecture [14], and hydrogeology [15].
With regard to the management of ULLs, public perception of water landscapes is mainly influenced by visual factors, such as transparency, color, and turbidity [16,17]. Transparency, often estimated by the Secchi depth, is positively correlated with public water activity choices and water quality evaluation [18]. Transparency reflects the biological, hydrological, and external environmental conditions of the water body, providing a comprehensive view of water quality. To effectively evaluate and manage ULLs, it is necessary to integrate various physical and chemical parameters; doing so, however, is challenging [19].
Machine learning algorithms have demonstrated clear advantages in addressing this challenge, as they offer more accurate predictions than traditional methods [20,21]. This helps formulate management policies to restore and maintain good water quality and aquatic ecosystems. For example, Xu et al. [22] applied the Sobol method to analyze the extent to which external conditions affected water quality and they found that the concentrations of total phosphorus (TP) and total nitrogen were closely related to the quality and flow of external water sources. Furthermore, the levels of chlorophyll a (Chl-a) are also influenced by factors such as wind speed and water temperature (T), which makes its management more complex. Similarly, Jiang et al. [23] utilized Generalized Likelihood Uncertainty Estimation uncertainty estimation and regional sensitivity analysis to model the ecological parameters of Lake Taihu, revealing that algal growth was primarily affected by hydrodynamics, light conditions, and temperature. However, in the literature, insufficient attention has been paid to ULLs, which differ from natural lakes due to their unique urban environmental characteristics [24].
Typically, ULLs are replenished by tap water, groundwater, natural surface water, rainwater, or reclaimed water [2]. In Taiyuan’s ULLs, the sources are tap water, rainwater, and surface water. Tap water, with its good quality, positively impacts water quality but it is limited by water scarcity. Surface water quality varies by function and region; it often has high turbidity, organic matter content, and algae content, especially during flood seasons, which may negatively affect the water environment if this kind of water is used directly [25]. Rainwater, as part of the natural water cycle, can positively influence transparency and reduce algae growth when there is no significant external pollution. However, rainwater that collects from roads, rooftops, and green spaces may carry oils [26], heavy metals, organic matter, and other harmful substances [27], which pose a significant threat to water quality [28]. The growing demands on urban water bodies, which are exacerbated by increasing population densities and urban development, necessitate immediate and effective management strategies to ensure sustainable water quality and ecosystem health.
This study investigates 16 artificial ULLs in Taiyuan, Shanxi Province, China, through comprehensive data collection and field surveys; it applies the Sobol and Morris sensitivity analysis methods to elucidate the interactions and independent contributions of nine water quality parameters. The insights gained from this research can inform more effective water quality management strategies not only in Taiyuan but also in other areas of the world that face similar water resource challenges.

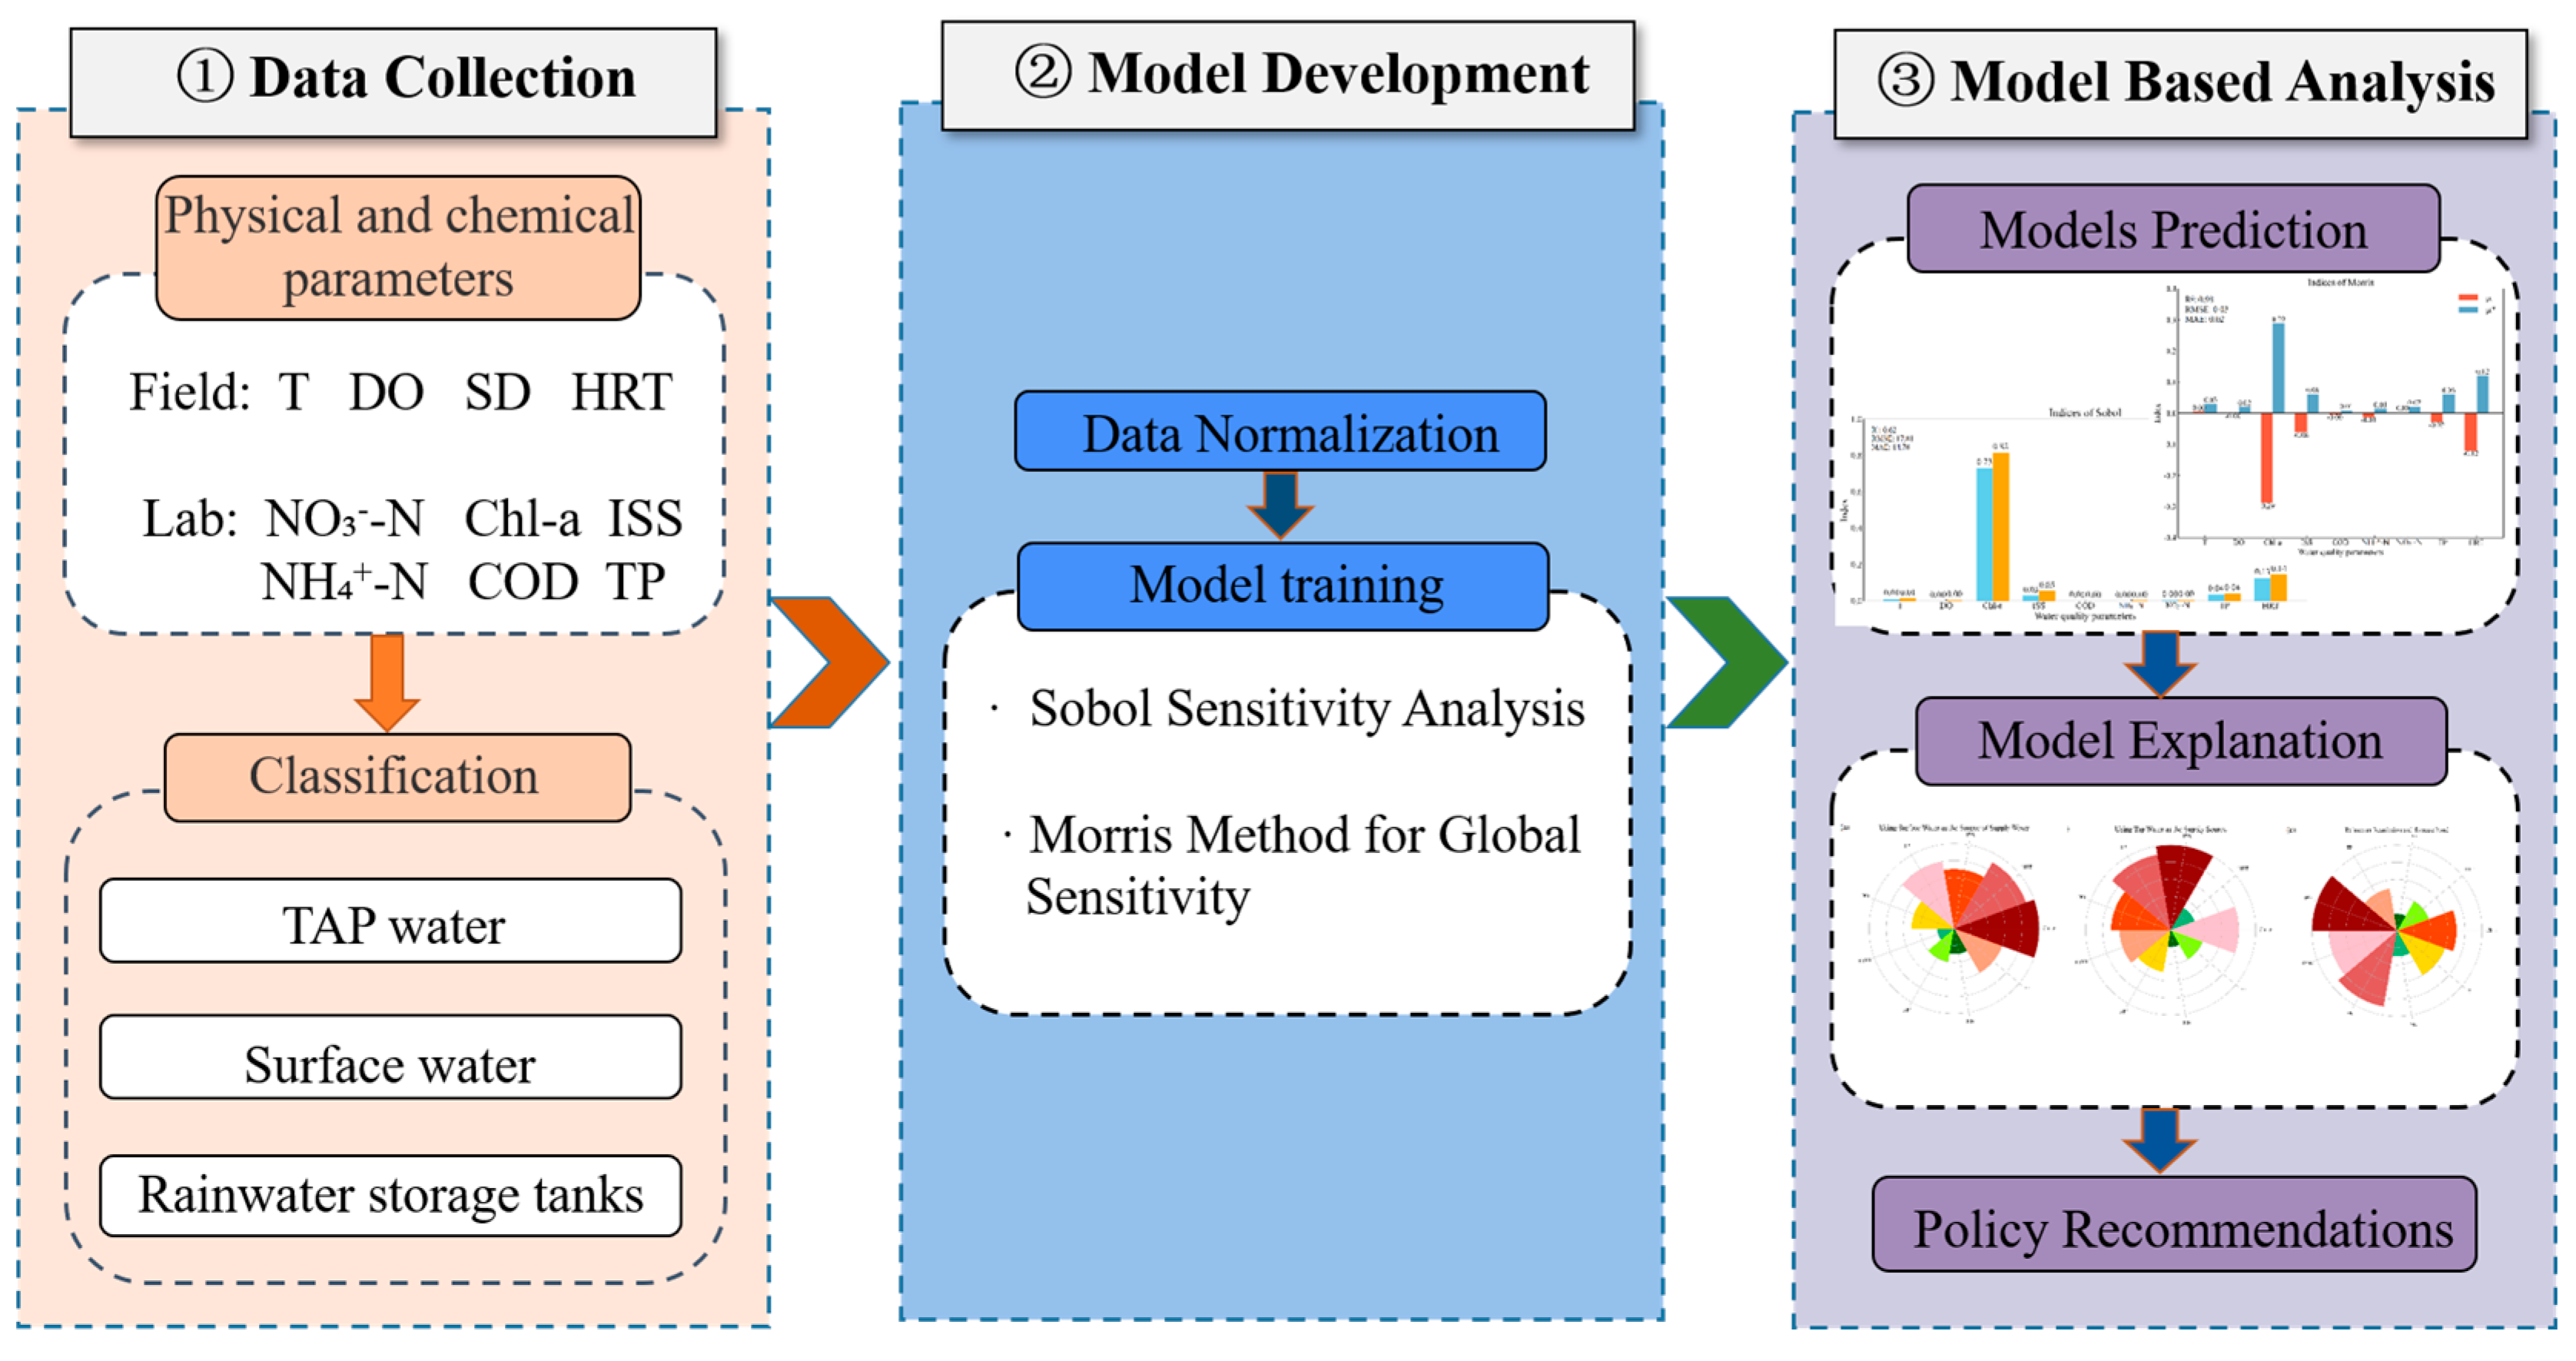
2. Materials and Methods

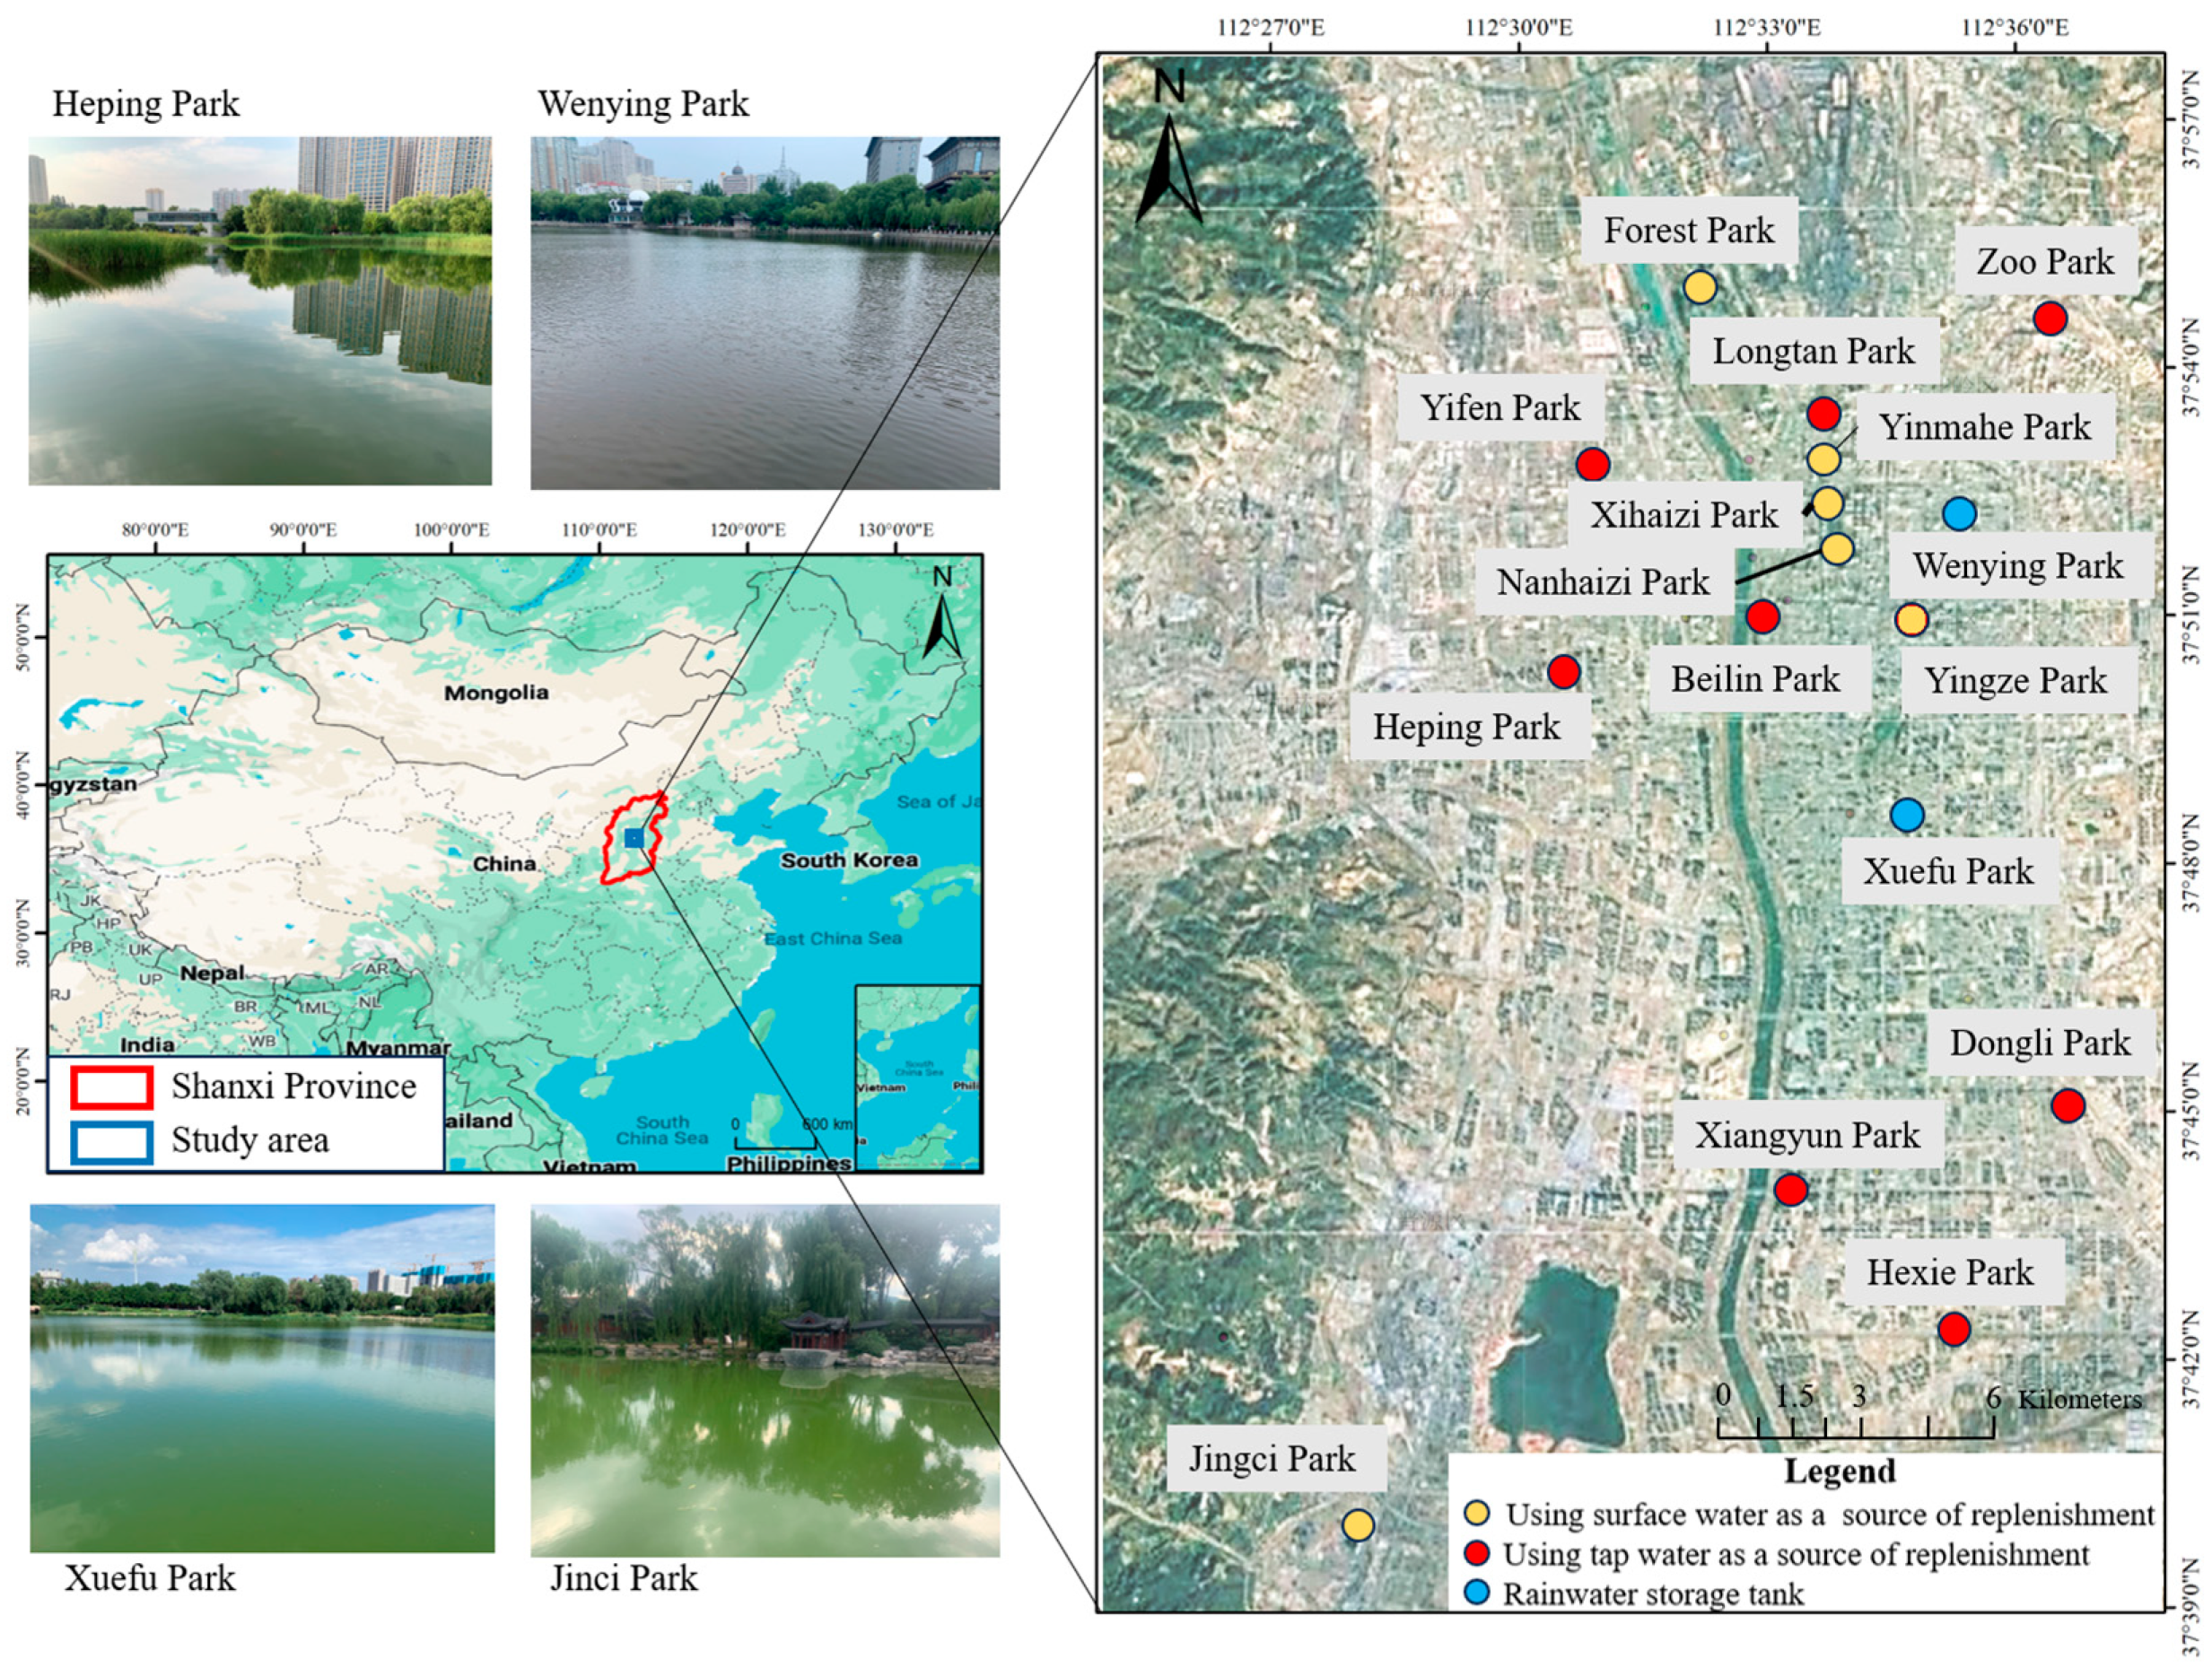
2.1. Study Area and Data Acquisition

Taiyuan, a significant city in northern China and the capital of Shanxi, is located at an elevation of 800 m, latitude 37°26′ N, and longitude 112°34′ E. It covers an area of 6964 km2. Situated on a plateau with an average altitude of about 800 m, the city has an annual precipitation of only 450 mm, indicating severe water scarcity. This is significantly lower than the average per capita water resources in Shanxi Province and the national average during the same period [24]. Such conditions present a substantial challenge for Taiyuan, especially in maintaining the cleanliness and reliability of ULLs. Thus, sustainable utilization and management of water resources are urgently needed.
From July to October 2021 and April to October 2022, this study conducted a sampling of 16 representative ULLs in Taiyuan. These water bodies varied in surface area from 0.11 to 25 ha and had an average depth of 0.6 to 3.5 m. They were categorized based on different water sources: surface water (37.5%, six water bodies, 144 data points), tap water (50%, eight water bodies, 163 data points), and rainwater storage pools for urban flood control (12.5%, two water bodies, 44 data points). The study area’s location and the sampling points are presented in Figure 1 and Table 1, respectively.
Field surveys and the latest satellite maps were analyzed to determine specific morphological characteristics of each water body, defining sampling point distribution. Detailed information on each water body’s water supply system, including water source, frequency, and volume, was collected through collaboration with local authorities and management agencies.
The analysis of water quality parameters involves five steps: (i) collecting and laboratory analyzing 353 samples from ULLs to determine physical and chemical parameters; (ii) classifying ULLs based on their water sources; (iii) normalizing data; (iv) using Sobol and Morris sensitivity analysis to assess the sensitivity of input parameters to output parameters; and (v) identifying dominant water quality factors to adjust management strategies. The methodological flowchart is shown in Figure 2.

2.2. Description of Water Quality Data

Monitoring point numbers and locations were set based on the size and shape of the water bodies. Sampling was scheduled from the 22nd to the 26th of each month, avoiding rainy days and freezing periods. In total, 1 L water samples were collected at 0.5 m below the surface from each point, with three replicates.
Key parameters such as T, dissolved oxygen (DO), and transparency were recorded at each sampling site. Samples were preserved at 4 °C for laboratory analysis, where indicators such as TP, Chl-a, inorganic suspended solids (ISS), chemical oxygen demand (COD), nitrate nitrogen (NO3-N), and ammonium nitrogen (NH4+-N) were determined according to the “Water and Wastewater Monitoring Analysis Methods”. To ensure data accuracy and reliability, each sampling point had three samples tested and their averages calculated. At each sampling site, water temperature and DO were measured using a YSI portable water quality meter, while transparency was measured using a Secchi disk. NH4+-N was measured using the Nessler reagent spectrophotometry method, NO3-N n using the ultraviolet spectrophotometry method, TP using the ammonium molybdate spectrophotometry method, Chl-a using the ethanol extraction spectrophotometry method, and ISS using the gravimetric method.

2.3. Sensitivity Analysis Model

In environmental science and water resources management, sensitivity analysis is crucial for evaluating the impact of model input parameters on model output. Sobol and Morris sensitivity analysis methods are commonly used techniques.
Sobol sensitivity analysis: a global sensitivity analysis method that uses variance decomposition to quantify the impact of input variables and their interactions with output variables. It reveals the total variance contribution of each parameter and their interactions, providing a measure of parameter influence [29]. The first-order index (S1) measures the direct contribution of a single parameter to the output, while the total effect index (ST) accounts for the parameter’s overall impact, including interactions with other parameters [30,31]. Sobol sensitivity analysis is illustrated in Figure 3.
The Morris method for global sensitivity analysis evaluates the effects of parameters by systematically varying input parameters and observing output changes. This method is straightforward and cost-effective, making it well-suited for preliminary sensitivity analysis to quickly identify key parameters. The analysis results include the mean effect (μ), indicating the average effect of parameter changes on the output, and the mean absolute deviation (μ*), reflecting the average size and consistency of parameter changes’ impact on the output [7]. An illustration of Morris’ sensitivity analysis is provided in Figure 4.
Overall, the Sobol method focuses on global sensitivity analysis, evaluating the contribution of input variables and their interactions to output variance. In contrast, the Morris method is a screening method identifying input variables significantly impacting output variance. Combining these methods provides a comprehensive understanding of model parameter influence.

2.4. Cross-Validation

Under a Random Forest model, Sobol and Morris sensitivity analyses were conducted. A 5-fold cross-validation method was employed to assess the model’s performance and stability. The dataset was divided into five subsets; in each iteration, four subsets were used for training and one for testing. This process was repeated five times, and the average score was calculated to ensure consistent model performance across different data splits, reducing partition bias. A higher average score indicates good generalization ability and stability, effectively predicting water transparency.

2.5. Data Selection

Urban water body transparency is primarily affected by algae, sediment, and debris concentrations due to their significant role in light absorption and scattering. Besides direct transparency factors like Chl-a and ISS, other water quality parameters such as DO, COD, NH4+-N, NO3-N, and TP must be considered for their indirect effects. Environmental conditions (e.g., temperature), physical and chemical states (e.g., DO, COD), and hydraulic factors (e.g., HRT) are essential for understanding water body transparency [1,2].

2.6. Data Normalization

Data normalization maps different scale data to a common range, typically [0, 1] or [−1, 1], balancing feature influence in the model and avoiding dominance by specific features. This step enhances model performance and convergence speed. Consistency in handling training and test sets is crucial. The data normalization is calculated according to Equation (1):
x n o r m a l i z e d = x x m i n x m a x x m i n
where x n o r m a l i z e d is the normalized value, x is the original data value, and x m i n and x m a x are the minimum and maximum values of the data in that dimension, respectively.

2.7. Model Evaluation

Evaluating predictive performance in machine learning involves assessing model strengths, weaknesses, applicability, and potential for broader use. Key metrics include mean absolute error (MAE) according to Equation (2), root mean square error (RMSE) according to Equation (3), and coefficient of determination (R2) according to Equation (4).
MAE indicates the average absolute value of the prediction errors. It is calculated as the mean of the absolute differences between the predicted and actual values. MAE is a commonly used performance metric and compared to RMSE, it is less sensitive to outliers. A smaller MAE indicates more accurate predictions.
M A E = 1 n i = 1 n y i y ^ i
where n is the number of samples, y i is the actual value, and y ^ i is the predicted value by the model.
RMSE is commonly used to measure the overall predictive performance of regression models. It is a statistical metric used to assess the fit of the model, particularly useful for comparing model performance across different datasets or problems. A smaller RMSE indicates that the model’s predictions are closer to the actual values, while a larger RMSE indicates greater errors.
R M S E = i = 1 n ( y i y ^ i ) 2 n
where n is the number of samples, y i is the actual value, and y ^ i is the predicted value by the model.
R 2 is a measure used to evaluate the performance of a machine learning model in fitting the data. It quantifies the extent to which the model can explain the variability observed in the original data, with values ranging from 0 to 1. An R 2 value of 0 indicates that the model does not explain the data at all, while an R2 value of 1 indicates perfect fitting of the model to the data. If the R 2 value is negative, it means that the model’s fit is worse than the fit achieved by simply using the mean of the data.
R 2 = i = 1 n x o b s , i x ¯ o b s x ¯ p r e , i x ¯ p r e i = 1 n x o b s , i x ¯ o b s 2 i = 1 n x ¯ p r e , i x ¯ p r e 2 2
where n is the number of samples, x o b s , i is the observed value of i , x ¯ o b s is the mean of the observed values, x ¯ p r e , i is the predicted value of i, and x ¯ p r e is the mean of the predicted values.

3. Results

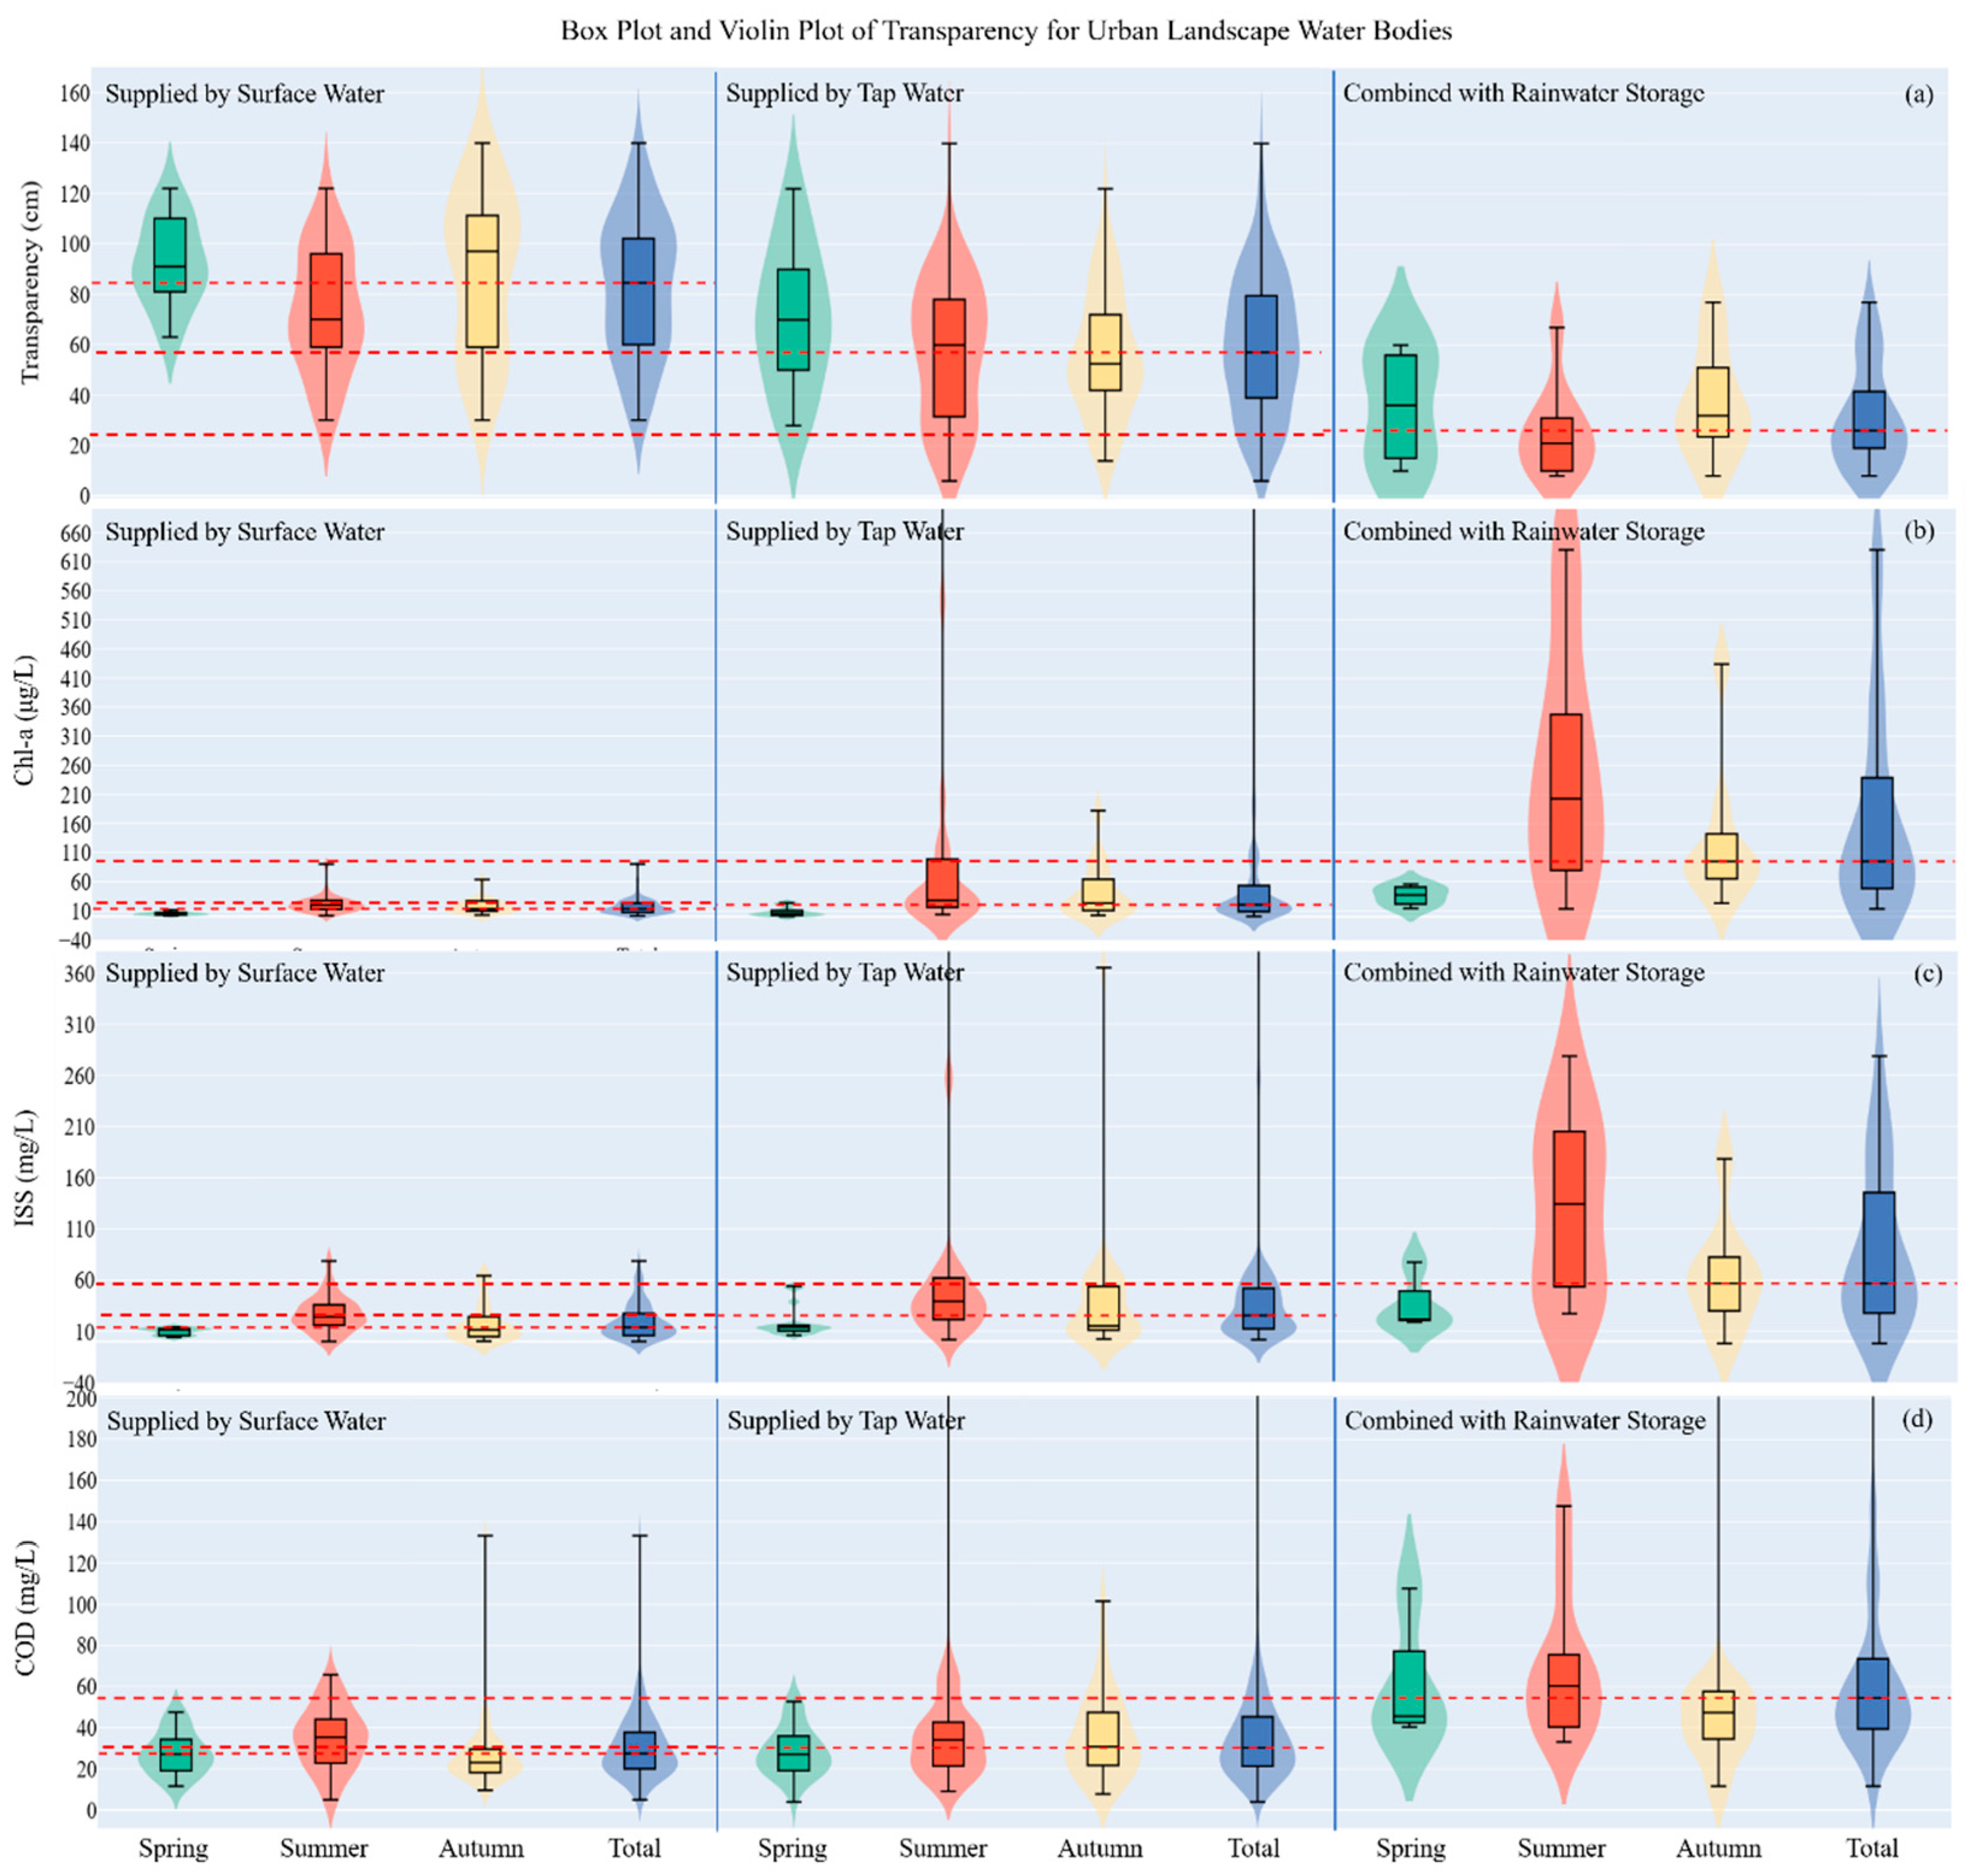
3.1. Water Quality Status

The transparency of water bodies supplemented by surface water is superior to that of ULLs supplemented by tap water and the transparency of water bodies supplemented by tap water is superior to that of ULLs with rainwater storage functions. The concentrations of Chl-a, ISS, and COD in rainwater storage bodies are higher than those in ULLs supplemented by tap water, which in turn are higher than in those in water bodies supplemented by surface water. Due to the susceptibility of rainwater storage bodies to surface runoff pollution, nutrients and pollutants tend to accumulate. Transparency is highest in spring and autumn and it is lowest in summer. ULLs supplemented by surface water exhibit the most significant seasonal variation. The concentrations of Chl-a and ISS are higher in summer than in autumn; they are also higher in autumn than in spring. The seasonal variation of COD is similar, with the highest concentration found in summer. The water quality data comparison for transparency, Chl-a, ISS, and COD in Taiyuan’s ULLs is illustrated in Figure 5.

3.2. ULLs with Surface Water as the Main Water Source

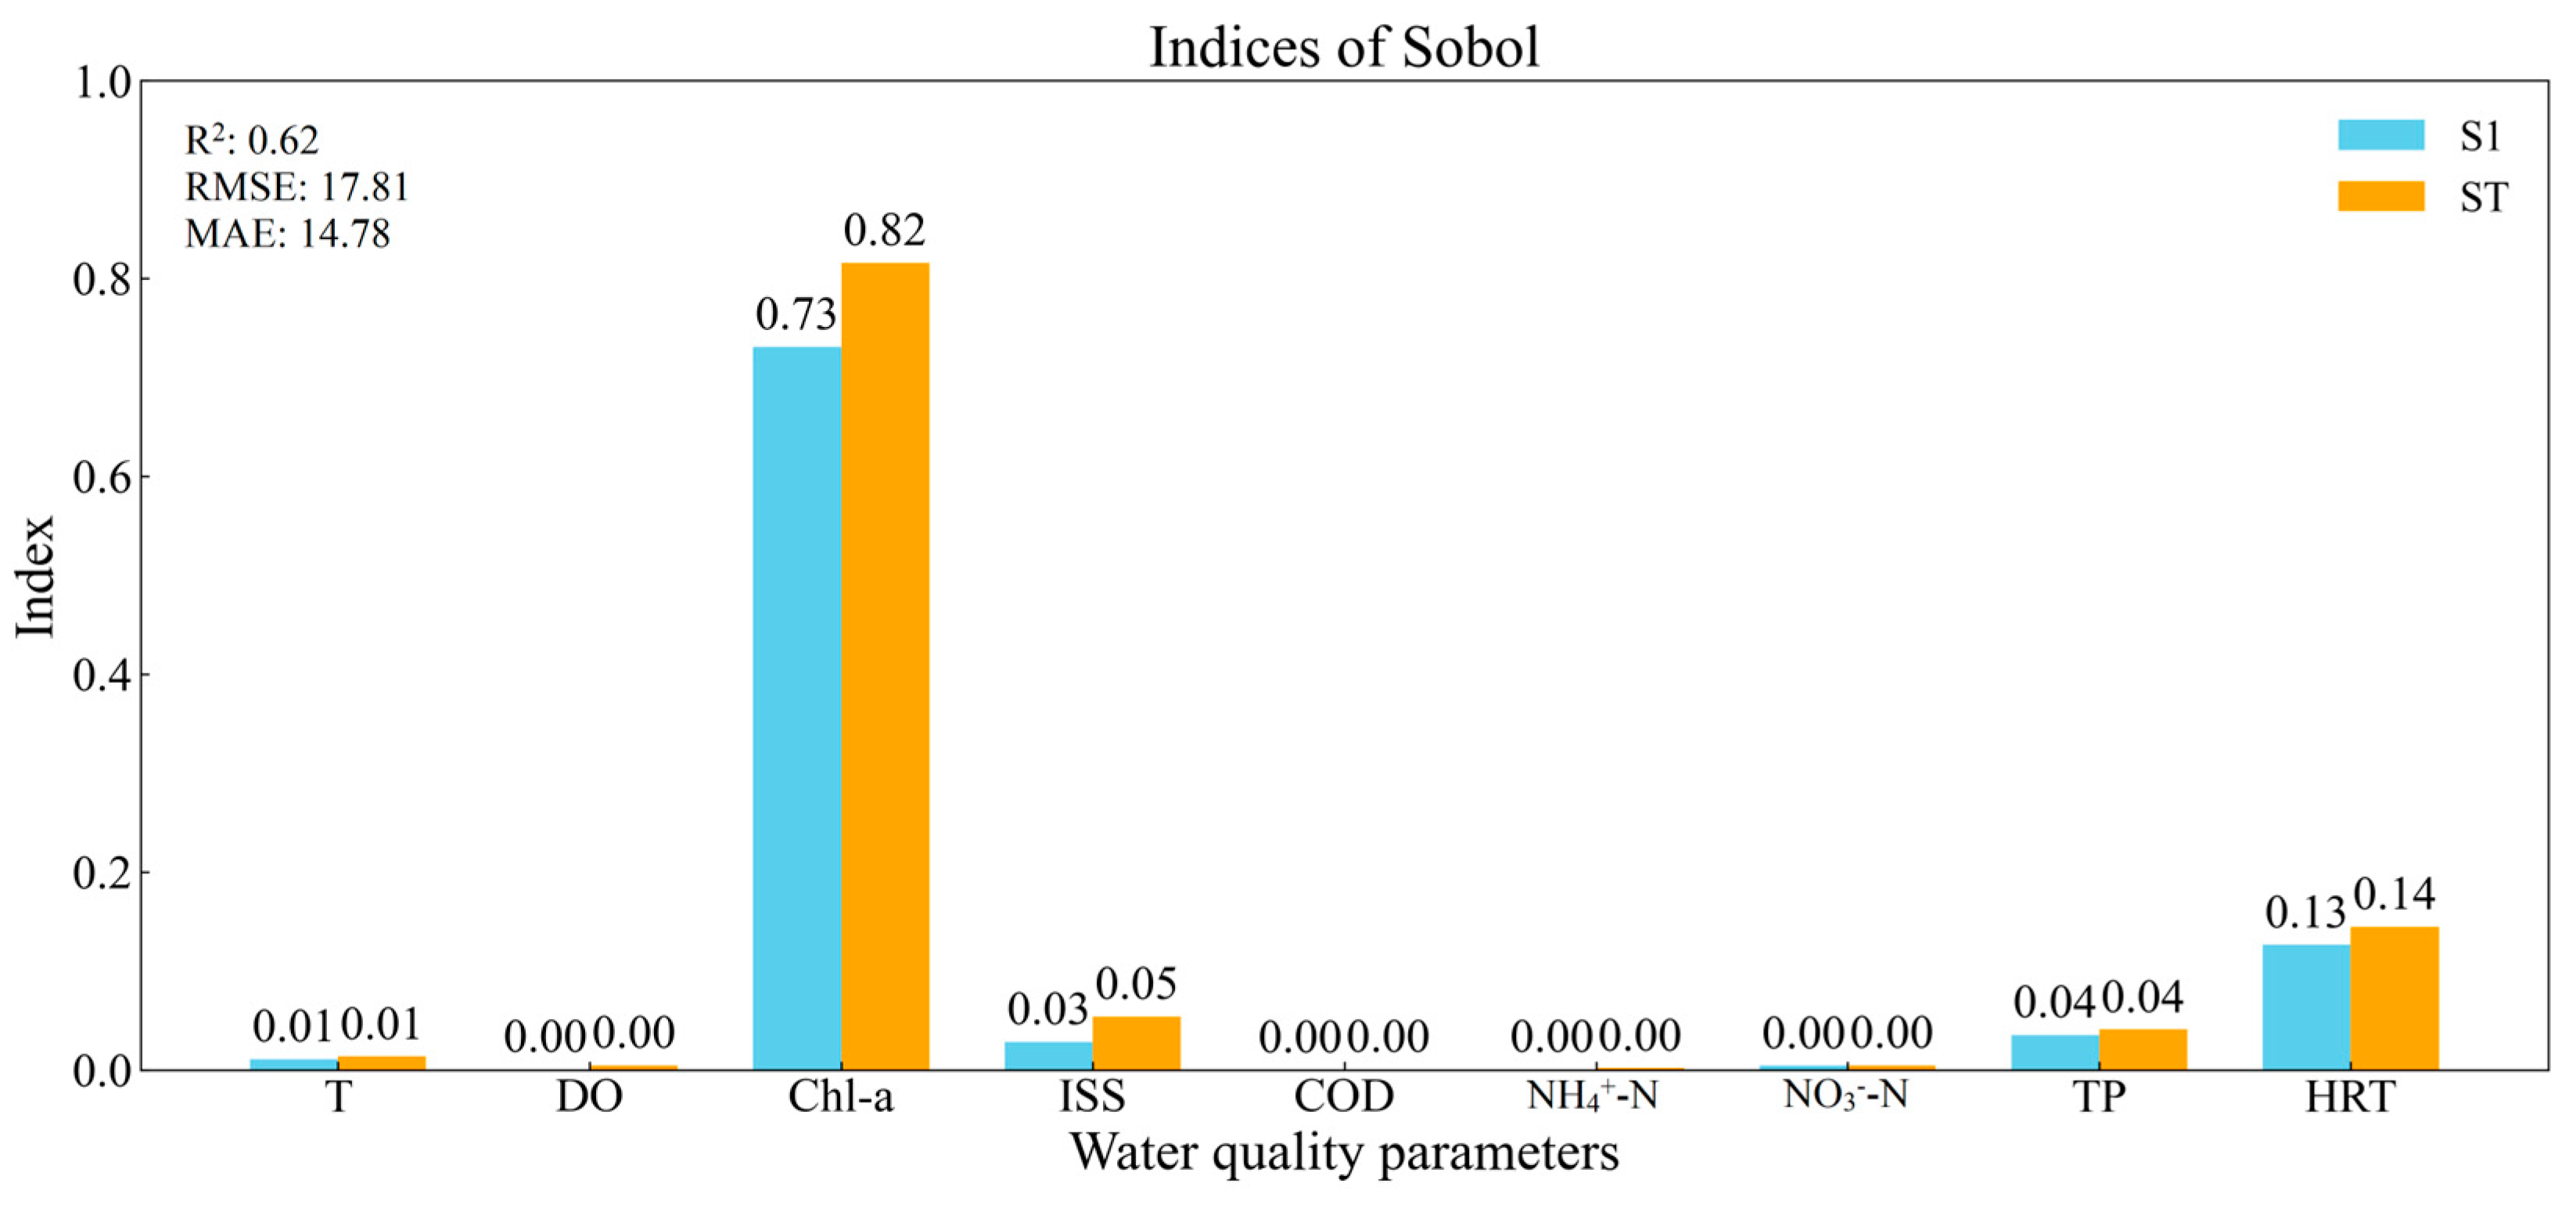
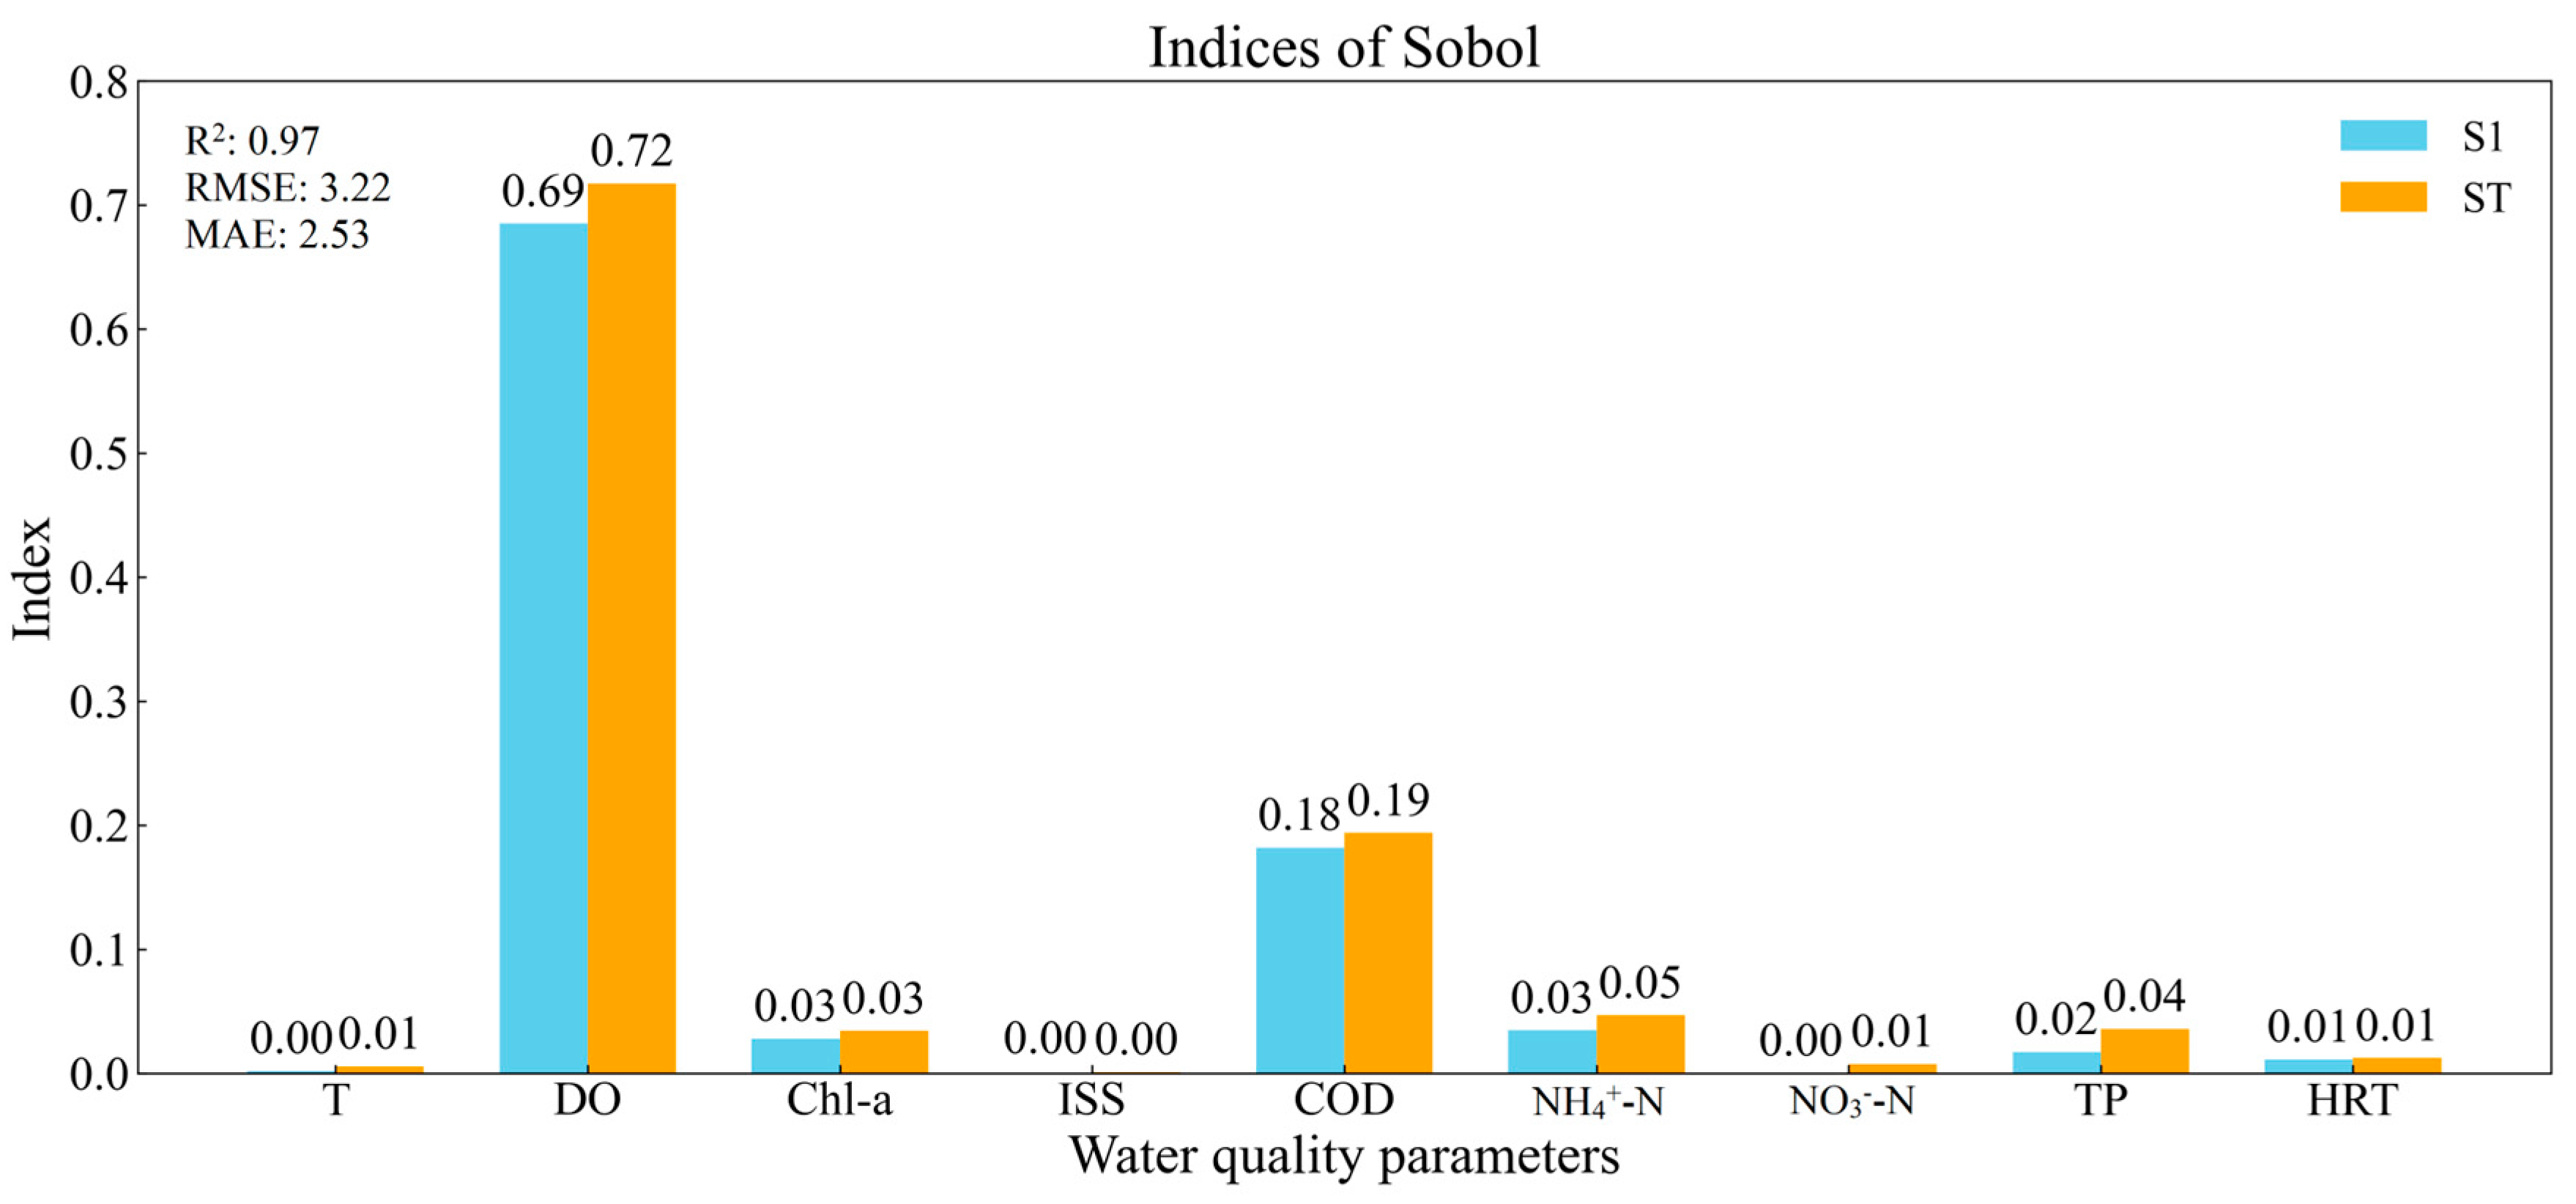
3.2.1. Sobol Sensitivity Analysis

In ULLs with surface water as the supply source, Chl-a, COD, HRT, and ISS exhibit high sensitivity. Chl-a measures algal biomass; it reflects nutrient levels in the water body and directly influences water transparency. COD, an indicator of organic pollutant load, indirectly affects nutrient levels. HRT is crucial for regulating the water quality balance in enclosed ULLs. ISS also directly impacts water transparency.
The results of the Sobol sensitivity analysis are shown in Figure 6. The S1 and ST values for Chl-a are 0.73 and 0.82, respectively, which indicates that Chl-a exhibits the highest sensitivity. As an indicator of algal biomass, Chl-a is a key parameter affecting system output and it directly reflects nutrient levels and light conditions in the water body. This sensitivity is particularly significant in enclosed water bodies that are heavily influenced by nutrient inputs and T. Furthermore, HRT and TP show considerable influence, with S1 and ST values of 0.13 and 0.14 and 0.04 and 0.04, respectively. HRT affects the circulation and degradation rates of pollutants and nutrients in ULLs and its regulation is essential for maintaining water quality balance in enclosed systems. ISS also shows some influence, with S1 and ST values of 0.03 and 0.05, respectively. The calculated R2 is 0.62, RMSE is 17.81, and MAE is 14.78, which indicates that the model is a good predictor of transparency.

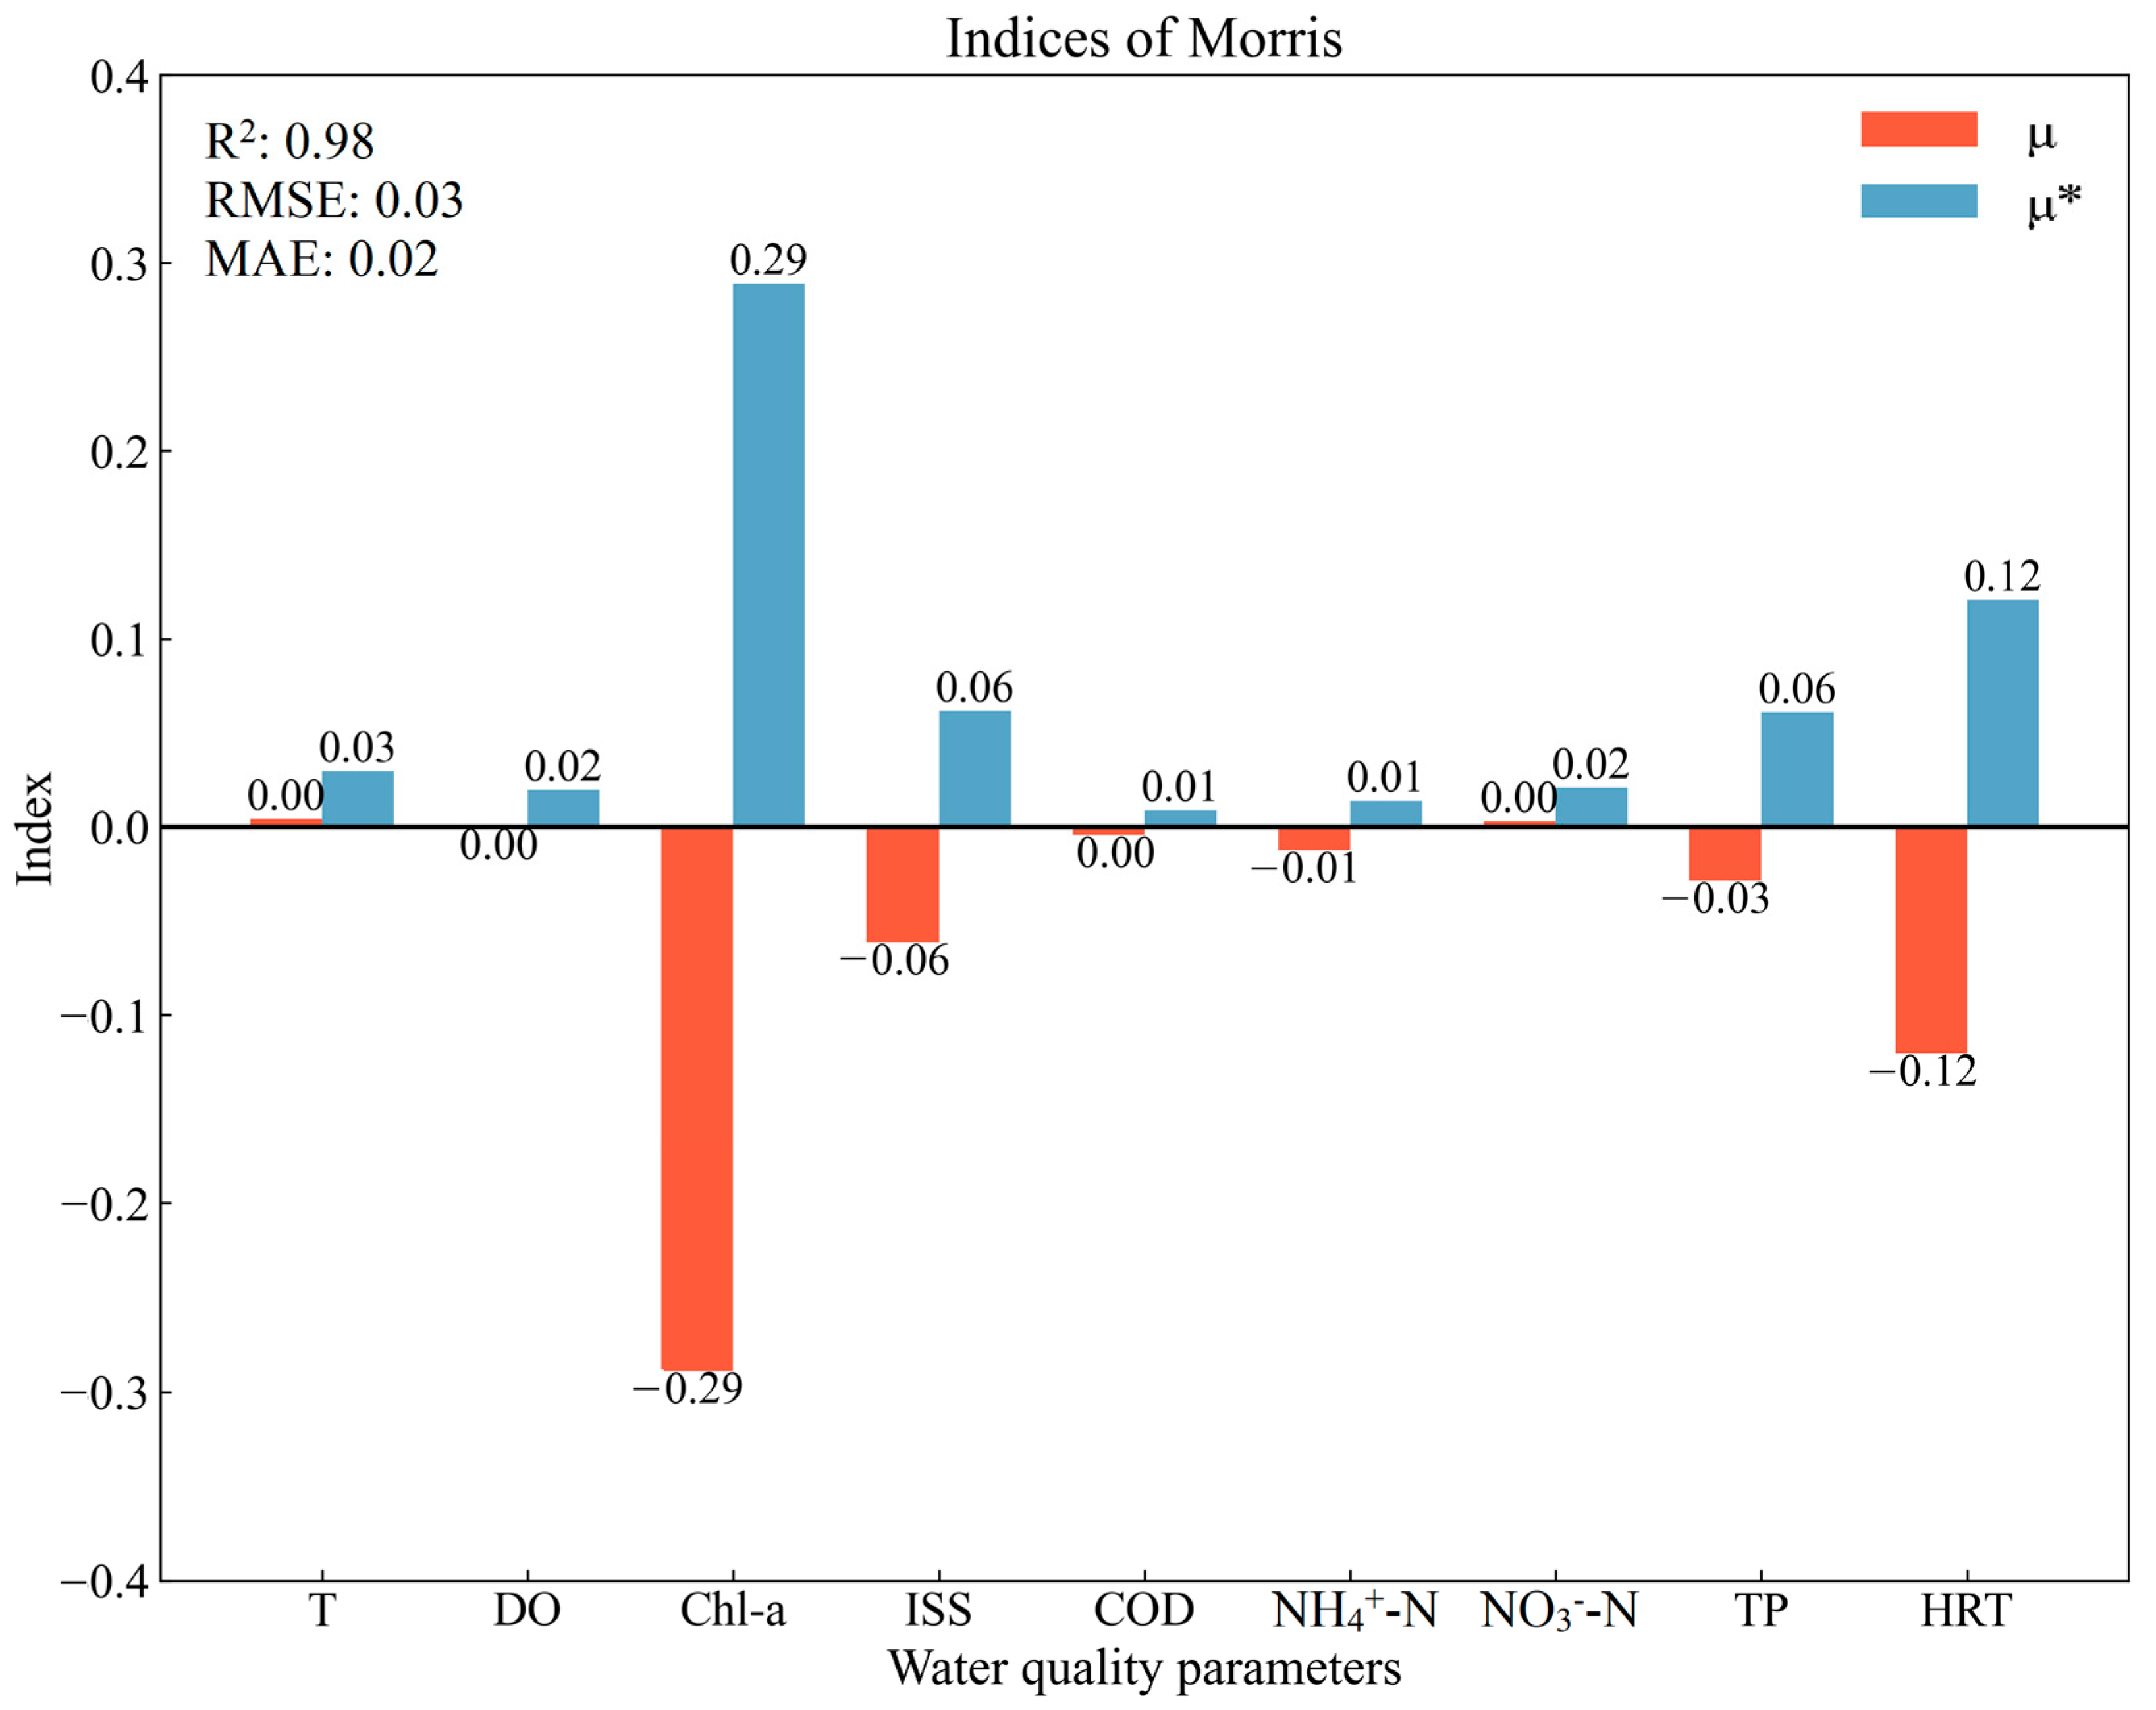
3.2.2. Morris Sensitivity Analysis

The results of the Morris sensitivity analysis are shown in Figure 7. They show that Chl-a has a significant impact on water transparency, with a sensitivity index μ* value of 0.29 and a μ value of −0.29, which confirms its negative correlation with water transparency. HRT also significantly affects transparency, with μ* and μ values of 0.12 and −0.12, respectively, which indicates that longer HRT promotes the sedimentation of suspended solids, thereby reducing transparency. The calculated R2 is 0.98, RMSE is 0.03, and MAE is 0.02, which shows that the model is a good predictor of water transparency.

3.3. ULLs with Tap Water as the Main Water Source

3.3.1. Sobol Sensitivity Analysis

The analysis conducted in this study reveals that for ULLs using tap water as the supply source, ISS and TP exhibit high sensitivity. ISS directly affects water transparency by scattering light and reducing visibility. TP is a key nutrient contributing to algal growth, which can lead to eutrophication and reduced water quality.
The results of the Sobol sensitivity analysis are shown in Figure 8. The S1 and ST values for ISS are 0.50 and 0.64, respectively, indicating that ISS is likely one of the most significant parameters affecting water transparency. Although tap water is treated, it can still carry inorganic suspended solids due to transportation processes or environmental pollution. The presence of these solids, especially those introduced by surface runoff after rainfall or during the summer, can elevate ISS levels and consequently impact water transparency.
Chl-a and TP also display high sensitivity, with S1 and ST values of 0.10 and 0.12 for Chl-a and 0.20 and 0.23 for TP, respectively, suggesting their significant direct and overall influence on water transparency. The calculated R2 is 0.97, RMSE is 4.85, and MAE is 2.97, which indicates that the model has excellent predictive performance for water transparency.

3.3.2. Morris Sensitivity Analysis

Figure 9 presents the results of the Morris sensitivity analysis for ULLs with tap water as the primary supply source. The μ value for ISS is −0.20 and the μ* value is 0.21, indicating that ISS has a strong negative impact on water quality and high sensitivity. The μ value for TP is −0.10 and the μ* value is 0.10, showing that the presence of TP also negatively affects water quality, though its sensitivity is somewhat lower than that of ISS. Although the sensitivities of Chl-a and DO are not high, they still warrant attention. These results indicate that ISS and TP are the primary sensitive factors influencing the water quality of ULLs. The calculated R2 is 0.97, RMSE is 0.04, and MAE is 0.02, which indicates that the model is a good predictor of water transparency.

3.4. ULLs with Rainwater Storage Function

3.4.1. Sobol Sensitivity Analysis

In ULLs with rainwater storage functions, DO and COD exhibit high sensitivity. DO is crucial for maintaining aquatic life and overall water quality, indirectly affecting water transparency by influencing biological respiration and chemical reactions, leading to water quality deterioration. COD, as an indicator of organic pollutant load, affects the decomposition process of organic matter in the water, which can lead to decreased oxygen levels and consequently result in water quality deterioration.
Figure 10 presents the Sobol sensitivity analysis results. The S1 and ST values for DO are 0.69 and 0.72, respectively, indicating that DO is a key factor affecting water transparency, with changes in DO having a direct and significant impact. The S1 and ST values for COD are 0.18 and 0.19, respectively, suggesting that although its impact is not as pronounced as that of DO, it still plays an important role in determining water transparency.
Higher DO levels promote more vigorous biological activity, which helps to reduce organic matter in the water and thus improve transparency. Changes in dissolved oxygen directly affect the aquatic ecosystem, thereby influencing transparency. COD reflects the concentration of organic matter in the water; the decomposition of organic matter consumes dissolved oxygen, potentially disrupting the balance of dissolved oxygen and indirectly affecting transparency. The calculated R2 is 0.97, RMSE is 3.22, and MAE is 2.53, which shows that the model is a good predictor of water transparency.

3.4.2. Morris Sensitivity Analysis

The results of the Morris sensitivity analysis are presented in Figure 11. NH4+-N has the highest μ* value of 0.23, suggesting that it plays a crucial role in determining water transparency. DO also demonstrates significant sensitivity, with μ and μ* values of −0.17 and 0.18, respectively, indicating its important impact despite the negative μ value. T has μ and μ* values of 0.06 and 0.12, respectively, indicating a moderate impact on water transparency. The model’s performance, with a calculated R2 of 1, and both RMSE and MAE of 0 confirms its excellent predictive accuracy for water transparency.

3.5. Key Factors Influencing Water Quality in ULLs

This study employed Sobol and Morris sensitivity analyses to identify the key factors for maintaining water quality in ULLs in Taiyuan based on different water supply sources. The results are shown in Figure 12. For ULLs supplemented by surface water, Chl-a and HRT are the primary influencing factors. For those supplemented by tap water, ISS and TP are more critical. For ULLs with rainwater storage functions, DO, NH4+-N, and COD significantly impact water quality. This analysis provides essential guidance for maintaining the water quality of ULLs in Taiyuan.

4. Discussion

4.1. ULLs with Surface Water as the Main Water Source

According to the Sobol sensitivity analysis, Chl-a is the most critical parameter influencing system performance, as it accounts for 60% of the total variance in the output variable. This underscores its vital role in regulating system functions. HRT also shows significant influence. The Morris sensitivity analysis further supports these findings, indicating that Chl-a and HRT have a substantial impact on water transparency, which is essential for improving water quality and system efficiency. Combining the results of both analyses, it is evident that in ULLs supplemented by surface water, Chl-a and HRT are the most important parameters. Adjusting these values can significantly enhance water transparency. Moreover, the roles of TP and ISS in system operation should not be overlooked.
Chl-a and ISS are water quality factors that directly affect water transparency. For water bodies supplemented by surface water, whether they are large lakes or small ponds, these factors are the primary influences. Numerous studies have analyzed how to efficiently predict and manage Chl-a and ISS levels in these water bodies [32,33]. Surface water typically contains high levels of nutrients that promote algal growth. Chl-a is highly sensitive as an indicator of algal biomass due to the direct nutrient input from surface water.
Additionally, HRT ensures a minimum base flow while maintaining the required water quality standards. An optimal HRT is necessary for ULLs relying on artificial regulation in order to ensure adequate mixing of supplemental water, thereby reducing pollutant concentrations and preventing prolonged water retention, which could foster the growth of harmful algae and bacteria [34]. Furthermore, nutrients such as TP are essential for algal growth; by influencing the eutrophication process, they impact water transparency [35].
In the city of Xi’an, China, which faces water scarcity, machine learning techniques were used to analyze the sensitivity of water body parameters with water quality data from Lake Hancheng and Lake Xingqing, which are supplemented by surface water, as reported by Dong [2]. The original data from Dong’s study were inputted into sensitivity analysis models to derive the results presented in Table 2. These results show that ISS and Chl-a had significant sensitivity, which confirms the findings from Taiyuan. This consistency suggests the presence of common key factors affecting transparency in surface water-supplemented bodies.
Additionally, Chang [36] used MIKE to analyze the sensitivity of water quality parameters affecting transparency in four ULLs supplemented by surface water: Lake Weiyang in Xi’an, Yantan Park Lake in Lanzhou, Lake Meixi in Changsha, and Lake Tian in Qingyang. The findings show that suspended solids had the highest sensitivity, followed by TP and HRT. This evidence supports the results of the present study and it highlights the general characteristics of sensitivity analysis for ULLs supplemented by surface water. The concentration of suspended solids and nutrients has a decisive impact on water transparency.
The abovementioned studies demonstrate the high reliability of machine learning methods in analyzing water body sensitivity. They also reveal common issues in water quality management and transparency improvement for water bodies supplemented by surface water. This provides a robust scientific foundation for developing targeted water quality management strategies.

4.2. ULLs with Tap Water as the Main Water Source

By combining the results of the Sobol and Morris analyses, it is evident that ISS, TP, and Chl-a significantly impact the transparency and quality of ULLs. The sensitivity analysis of these parameters reveals their critical roles in water quality management and protection. The high sensitivity of ISS and TP suggests that controlling solid particles and nutrient levels is essential for improving water transparency and overall water quality. Moreover, the high sensitivity of Chl-a emphasizes the impact of organic matter content and photosynthesis on the aquatic environment.
Although tap water is a clean water source treated to remove most nutrients and organic pollutants, the process of its supplementation, as well as surface runoff, introduces a certain amount of organic matter and ISS [37]. Water bodies supplemented by tap water are often smaller and shallower, with low self-purification capacity. Additionally, due to water resource constraints, these water bodies often lack outflows, leading to the accumulation of pollutants such as ISS, which diminishes water transparency. Lakes with sediment are particularly prone to increased levels of organic matter, nutrients, and suspended solids due to sediment disturbance [38]. Unlike water bodies supplemented by surface water, which are highly sensitive to algal growth and nutrient levels, those supplemented by tap water are more sensitive to suspended solids and organic matter.

4.3. ULLs with Rainwater Storage Function

When combining the results of the Sobol and Morris sensitivity analyses, DO, NH4+-N, and COD emerge as significant factors influencing water transparency. The sensitivity analysis of these parameters highlights not only their direct impact on water transparency but also their complex interactions and indirect effects. The prominence of DO underscores its direct and crucial influence on water transparency, while the results for COD and NH4+-N suggest that these chemical parameters play nuanced roles in regulating water transparency.
Rainwater retention ponds reduce the pressure on urban drainage systems and prevent flooding by storing rainwater during intense rainfall events [39]. However, runoff during these events often flows directly into ULLs without treatment, carrying significant amounts of organic matter and pollutants [37]. These substances not only directly impact water quality but also consume large amounts of oxygen during decomposition, leading to decreased DO levels, deteriorating water quality, and reduced transparency. Gao et al. [40] used the MIKE11 model to analyze the impact of rainfall on ULLs and they confirmed that stormwater runoff carries substantial organic matter and nutrients, which diminish water quality.

4.4. Water Quality Management Strategies for ULLs

After identifying the key factors affecting the transparency of ULLs, this study proposes a series of targeted management strategies. These strategies aim to comprehensively improve the water quality of ULLs through enhanced algae management, optimization of HRT, and control of suspended solids, among other measures.
  • Enhanced algae management. Eutrophication and algal blooms are significant water quality issues in ULLs, which require focused monitoring and the management of algal growth. Regular maintenance, the use of algal growth inhibitors, and the introduction of natural predators (e.g., certain fish species) should be employed to control algal populations. Furthermore, aquatic plants should be promptly cleared to prevent overgrowth and reduce the potential for algal proliferation;
  • Optimization of HRT. Water flow and quality should be improved by increasing flow paths and retention areas, controlling inflow rates, and optimizing the hydraulic structure of ULLs [18];
  • Control of suspended solids. Runoff management should be strengthened to reduce soil erosion and prevent particulate and pollutant influx into water bodies. Greening efforts around lakes should be enhanced to stabilize the soil [39];
  • Nutrient load management. Land use management around water bodies should be improved to reduce nutrient inflow [41]. Ecological restoration should be improved to enhance the lake’s self-purification capacity [42]. Lake sediments should be regularly dredged to effectively reduce the accumulation and release of nutrients [43];
  • Increase dissolved oxygen levels. Oxygen levels should be enhanced by adding aquatic vegetation and installing surface aerators to directly improve water transparency [44];
  • Strengthened monitoring and regulation. Monitoring systems should be established and improved to track changes in key parameters in real time and adjust management measures accordingly. During the eutrophication-prone summer and autumn seasons, there should be a focus on enhanced monitoring of algal blooms, and water quality monitoring indicators should be adjusted as needed. For instance, water transparency monitoring should be implemented; also, during seasons prone to algal blooms, water quality parameters that are highly sensitive to transparency should be monitored;
  • Public participation and education. It is necessary to raise public awareness of the importance of water resource protection and encourage participation in water environment protection activities, such as pollutant discharge reduction and cleanup efforts.

4.5. Potential Significance and Limitations

By applying the Sobol and Morris sensitivity analysis methods, this study discovered the key parameters affecting the transparency of ULLs in Taiyuan, thus providing a scientific basis for the management of the quality of these water bodies. These findings also offer valuable references for other cities facing similar water resource challenges.
Despite systematically analyzing the key water quality factors influenced by different water supply sources and functions of ULLs, this study has some limitations. First, the study focused on water bodies in Taiyuan, which have unique geographical and environmental characteristics. Therefore, further validation is required before applying these findings to ULLs in other cities. Second, the data used were limited; future research should include more extensive sampling and analysis to further verify the reliability of the findings. Third, due to differences in water supply sources and functions, comprehensive horizontal comparisons of water bodies supplemented by tap water and rainwater storage ponds were not conducted, which may have affected the comprehensiveness and generalizability of the results.

5. Conclusions

This study systematically evaluated the impact of water quality factors on urban landscape lakes in Taiyuan using Sobol and Morris sensitivity analysis methods for different supply sources and functions. The study deepens the understanding of sensitivity analysis for water transparency, revealing the importance of parameters such as chlorophyll a, chemical oxygen demand, hydraulic retention time, and inorganic suspended solids for water quality. The results indicate that for urban landscape lakes supplemented by surface water, attention should be focused on chlorophyll a and hydraulic retention time levels. For those supplemented by tap water, inorganic suspended solids, and total phosphorus have more prominent impacts. For water bodies with urban flood control functions, dissolved oxygen, ammonium nitrogen, and chemical oxygen demand levels are of primary concern. These differences in sensitivity can be attributed to the varying characteristics of water sources and their associated nutrient and pollutant loads. Based on these findings, this study provides targeted management recommendations to improve the transparency and quality of urban landscape lakes in Taiyuan by adjusting key sensitive parameters.
Overall, this study underscores the importance of conducting scientific data analysis in environmental management and decision-making processes and it demonstrates the effectiveness of using sensitivity analysis to support the management of urban landscape lakes. This approach exemplifies a scalable model for enhancing water resource management across different regions and environmental contexts, thus promoting strategic advancements in urban water quality improvement. Future work should continue to focus on the response of the abovementioned sensitive factors to environmental changes in order to develop more precise and effective water management strategies. Finally, integrating real-time monitoring technologies and public participation will further enhance the effectiveness and sustainability of water body management.

Author Contributions

Conceptualization, J.Y. and Y.L.; methodology, J.D.; software, Y.Z.; validation, Y.Z.; formal analysis, Y.Z.; investigation, J.D. and Y.Z.; resources, J.Y.; data curation, Y.Z.; writing—original draft preparation, Y.Z.; writing—review and editing, J.D.; visualization, Y.Z.; supervision, J.Y. and X.H.; project administration, J.Y. and J.D.; funding acquisition, J.Y. and J.D. All authors have read and agreed to the published version of the manuscript.

Funding

This work was financially supported by the National Key Research and Development Program Project (No. 2019YFC0408602), the Fundamental Research Program of Shanxi Province (No. 202103021224107), and the Shanxi Province Science and Technology Cooperation and Exchange Special Project (No. 202304041101047).

Institutional Review Board Statement

Not applicable.

Informed Consent Statement

Not applicable.

Data Availability Statement

The data used in this study cannot be publicly disclosed due to policy requirements.

Conflicts of Interest

Author Jin Yuan was employed by the company Coshare Energy Environment. The remaining authors declare that the research was conducted in the absence of any commercial or financial relationships that could be construed as a potential conflict of interest.

Abbreviations

ULLsUrban landscape lakes
TTemperature
DODissolved oxygen
TPTotal phosphorus
Chl-aChlorophyll a
ISSInorganic suspended solids
CODChemical oxygen demand
NO3-NNitrate nitrogen
NH4+-NAmmonium nitrogen

References

  1. Chang, N.N.; Wang, X.C.; Song, J.; Han, J.X.; Ao, D. A novel index for assessing the water quality of urban landscape lakes based on water transparency. Sci. Total Environ. 2020, 735, 139351. [Google Scholar] [CrossRef] [PubMed]
  2. Ao, D. Reclaimed Water Reuse for Replenishing Urban Waters in Water Dificient Cities: Theories and Technologies for Landscape Water Quality Control; Xi’an University of Architecture and Technology: Xi’an, China, 2018. [Google Scholar]
  3. Wu, Q.; Li, X.H.; Mou, X. Impacts of meteorological variations on urban lake water quality: A sensitivity analysis for 12 urban lakes with different trophic states. Aquat. Sci. 2014, 76, 339–351. [Google Scholar] [CrossRef]
  4. Mei, Z.J.; Li, C.; Zhao, J.; Li, Z.X.; Chen, K.Y.; Huang, X.; Zhao, Z.Y. The temporal and spatial evolution characteristics and driving factors of ecosystem service bundles in Anhui Province, China. Land 2024, 13, 736. [Google Scholar] [CrossRef]
  5. Venkata Vara Prasad, D.; Venkataramama, L.Y.; Kumar, P.S.; Prasannamedha, G.; Harshana, S.; Srividya, S.J. Analysis and prediction of water quality using deep learning and auto deep learning techniques. Sci. Total Environ. 2022, 821, 153311. [Google Scholar] [CrossRef]
  6. Marc Macias-Fauria, P.J.; Zimov, N.; Maihi, Y. Pleistocene Arctic megafaunal evological engineering as a natural climate solution? Philos. Trans. R. Soc. B 2020, 375, 20190122. [Google Scholar] [CrossRef]
  7. Saltelli, A.; Ratto, M.; Cariboni, J.; Gatelli, D.; Saisana, M.; Tarantola, M. Global Sensitivity Analysis: The Primer; John Wiley & Sons: Hoboken, NJ, USA, 2007. [Google Scholar]
  8. Saltelli, A.; Annoni, P.; D’Hombres, B. How to avoid a perfunctory sensitivity analysis. Procedia Soc. Behav. Sci. 2010, 2, 7592–7594. [Google Scholar] [CrossRef]
  9. Hsieh, N.H.; Reish, B.; Frederic, Y.B.; Weihsueh, A.C. Applying a global sensitivity analysis workflow to improve the computational efficiencies in Physiologically-Based Pharmacokinetic Modeling. Front. Pharmacol. 2018, 9, 588. [Google Scholar] [CrossRef] [PubMed]
  10. Xue, H.L.; Tian, X.L.; Wang, B.; Sun, S.C.; Cao, T.J. Comparison of global sensitivity analysis techniques based on a process-based model CROBAS. J. Appl. Ecol. 2021, 32, 134–144. [Google Scholar]
  11. Norton, J.P. Algebraic sensitivity analyysis of environmental models. Environ. Model. Softw. 2008, 23, 963–972. [Google Scholar] [CrossRef]
  12. Pianosi, F.; Beven, K.; Freer, J.; Hall, J.W.; Rougier, J.; Stephenson, D.B.; Wagener, T. Sensitivity analysis of environmental models: A systematic review with practical workflow. Environ. Model. Softw. 2016, 79, 214–232. [Google Scholar] [CrossRef]
  13. Turanyi, T. Sensitivity analysis of complex kinetic systems. Tools and applications. J. Math. Chem. 1990, 5, 203–248. [Google Scholar] [CrossRef]
  14. Tian, W. A review of sensitivity analysis methods in building energy analysis. Renew. Sustain. Energy Rev. 2013, 20, 411–419. [Google Scholar] [CrossRef]
  15. Wainwright, H.M.; Finsterle, S.; Jung, Y.; Zhou, Q.; Birkholzer, J.T. Making sense of global sensitivity analyses. Comput. Geosci. 2014, 65, 84–94. [Google Scholar] [CrossRef]
  16. Liu, J.; Sun, D.; Zhang, Y.L.; Li, Y.M. Prelassification improves relationships between water clarity, light attenuation, and suspended particulates in turbid inland waters. Hydrobiologia 2013, 711, 71–86. [Google Scholar] [CrossRef]
  17. Lee, L.H.; Lee, Y.D. The impact of water quality on the visual and olfactory satisfaction of tourists. Ocean Coast. Manag. 2015, 105, 92–99. [Google Scholar] [CrossRef]
  18. Chang, N.N.; Zhang, Q.H.; Wang, Q.; Luo, L.; Wang, X.C.; Xiong, J.Q.; Han, J.X. Current status and characteristics of urban landscape lakes in China. Sci. Total Environ. 2020, 712, 135669. [Google Scholar] [CrossRef]
  19. Xiang, X.J.; Li, Q.; Khan, X.; Khalaf, O.I. Urban water resource management for sustainable environment planning using artificial intelligence techniques. Environ. Impact Assess. Rev. 2021, 86, 106515. [Google Scholar] [CrossRef]
  20. Uddin, M.G.; Nash, S.N.; Olbert, A.I. A review of water quality index models and their use for assessing surface water quality. Ecol. Indic. 2021, 122, 107218. [Google Scholar] [CrossRef]
  21. Kouadri, S.; Elbeltage, A.; Islam, A.R.M.; Kateb, S. Performance of machine learning methods in predicting water quality index based on irregular data set: Application on Illizi region (Algerian southeast). Appl. Water Sci. 2021, 11, 190. [Google Scholar] [CrossRef]
  22. Xu, R.C.; Peng, Y.; Hu, Z.B.; Hu, X.Y. The spatiotemporal characteristics of water quality and main controlling factors of algal blooms in Tai Lake, China. Sustainability 2022, 14, 5710. [Google Scholar] [CrossRef]
  23. Jiang, L.; Li, Y.P.; Zhao, X.; Martin, R.T.; Wang, W.C.; Zhang, S.S.; Sarpong, L.; Asmaa, Q.; Pan, B.Z. Parameter uncertainty and sensitivity analysis of water quality model in Lake Taihu, China. Ecohydrol. Model. 2018, 375, 1–12. [Google Scholar] [CrossRef]
  24. Wu, W.Y.; Zhao, X.H.; Zhang, X.Y.; Wu, X.X.; Zhao, Y.H.; Guo, Q.C.; Yao, L.S.; Liu, X. An ordered multi-objective fuzzy stochastic approach to sustainable water resources management: A case study from Taiyuan City, China. Water Supply 2024, 24, 865–888. [Google Scholar] [CrossRef]
  25. Sajib, A.M.; Diganta, M.T.M.; Moniruzzaman, M.; Rahman, A.; Dabrowski, T.; Uddin, M.G.; Olber, A.I. Assessing water quality of an ecologically critical urban canal incorporating machine learning approaches. Ecol. Inform. 2024, 80, 102514. [Google Scholar] [CrossRef]
  26. Jia, Z.L.; Chang, X.; Duan, T.T.; Wang, X.; Wei, T.; Li, Y.X. Water quality responses to rainfall and surrounding land uses in ruban lakes. J. Environ. Manag. 2021, 298, 113514. [Google Scholar] [CrossRef]
  27. Liu, S.Y.; Li, X.Y.; Ding, R.; Pan, Y.W.; Ge, X.Y.; Ma, W.F. Transport model simulation prediction and environmental risk assessment of pyrethroid insecticides in urban artificial lakes caused by rainfall: A case study of Cloud Mountain Park in subhumid climate zone. J. Environ. Manag. 2023, 343, 118156. [Google Scholar] [CrossRef]
  28. Wei, Y.; Li, Y.X.; Liu, Y.; Xu, M.X.; Zhang, L.P.; Deng, Q.L. Impacts of rainfall intensity and urbanization on water environment of urban lakes. Ecohydrol. Hydrobiol. 2020, 20, 513–524. [Google Scholar] [CrossRef]
  29. Sobol, I.M. Global sensitivity indices for nonlinear mathematical models and their Monte Carlo estimates. Math. Comput. Simul. 2001, 55, 271–280. [Google Scholar] [CrossRef]
  30. Saltelli, A.; Annoni, P.; Azzini, I.; Campolongo, F.; Ratto, M.; Tarantola, S. Variance based sensitivity analysis of model output. Design and estimator for the total sensitivity index. Comput. Phys. Commun. 2010, 181, 259–270. [Google Scholar] [CrossRef]
  31. Borgonovo, E. A new uncertainty importance measure. Reliab. Eng. Syst. Saf. 2007, 92, 771–784. [Google Scholar] [CrossRef]
  32. Yang, J.; Zheng, Y.; Zhang, W.; Zhou, Y.C.; Zhang, Y.P. Comparative analysis of machine learning methods for prediction of chlorophyll-a in a river with different hydrology characteristivs: A case study in Fuchun River, China. J. Environ. Manag. 2024, 364, 121386. [Google Scholar] [CrossRef]
  33. Feng, L.; Hou, X.J.; Zheng, Y. Monitoring and understanding the water transparency changes of fifty large lakes on the Yangtze Plain based on long-term MODIS observations. Remote Sens. Environ. 2019, 221, 675–686. [Google Scholar] [CrossRef]
  34. Zheng, X.N.; Wu, D.X.; Huang, C.Q.; Wu, Q.Y.; Guan, Y.T. Impacts of hydraulic retention time and inflow water quality on algal growth in a shallow lake supplied with reclaimed water. Water Cycle 2022, 3, 71–78. [Google Scholar] [CrossRef]
  35. Shan, X.; Li, C.G.; Li, F. Water quality variation of a typical urban landscape river replenished with reclaimed water. Water Cycle 2023, 4, 137–144. [Google Scholar] [CrossRef]
  36. Chang, N.N. Study on the Comrehensive Index for Water Landscape Effect Assessing of Urban Water Bodies, in Envrionmental Science and Engineering; Xi’an University of Architecture and Technology: Xi’an, China, 2020. [Google Scholar]
  37. Cao, J.; Hou, Z.Y.; Li, Z.K.; Chu, Z.S.; Yang, P.P.; Zheng, B.H. Succession of phytoplankton functional groups and their driving factors in a subtropical plateau lake. Sci. Total Environ. 2018, 631, 1127–1137. [Google Scholar] [CrossRef] [PubMed]
  38. Yu, Z.; Yang, K.; Luo, Y.; Yang, Y.L. Secchi depth inversion and its temporal and spatial variation analysis—A case study of nine plateau lakes in Yunnan Province of China. Int. J. Appl. Earth Obs. Geoinf. 2021, 100, 102344. [Google Scholar] [CrossRef]
  39. Chen, X.C.; Huang, X.C.; He, S.B.; Yu, X.J.; Sun, M.J.; Wang, X.D.; Kong, H.N. Pilot-scale study on preserving eutrophic landscape pond water with a combined recycling purification system. Ecol. Eng. 2013, 61, 383–389. [Google Scholar] [CrossRef]
  40. Gao, C.; Xu, Z.T.; Yan, X.J.; Wang, G.D.; Lin, X.P.; Zhang, J.C.; Guo, X. Coupling the measures of pollution source control and water replenishment to improve water quality in the catchment scale of Qianshan River Basin. Environ. Pollut. 2024, 341, 122899. [Google Scholar] [CrossRef] [PubMed]
  41. Wang, Q.; Zhang, Q.H.; Dzakpasu, M.; Lian, B. Development of an indicator for characterizing particle size distribution and quality of stormwater runoff. Environ. Sci. Pollut. Res. 2018, 25, 7991–8001. [Google Scholar] [CrossRef] [PubMed]
  42. Dunalska, J.A. Abiotic–biotic method of water treatment in a shore of lake—A new strategy for protection of urban lakes. Ecohydrol. Hydrobiol. 2018, 18, 454–458. [Google Scholar] [CrossRef]
  43. Huser, B.J.; Futter, M.; Lee, J.T.; Perniel, M. In-lake measures for phosphorus control: The most feasible and cost-effective solution for long-term management of water quality in urban lakes. Water Res. 2016, 97, 142–152. [Google Scholar] [CrossRef] [PubMed]
  44. Parr, L.B.; Perkins, R.G.; Mason, C.F. Reduction in photosynthetic efficiency of Cladophora glomerata, induced by overlying canopies of Lemna spp. Water Res. 2002, 36, 1735–1742. [Google Scholar] [CrossRef] [PubMed]
Figure 1. Sampling point map from Taiyuan, Shanxi, China.
Sustainability 16 07026 g001
Figure 2. Methodological flowchart.
Sustainability 16 07026 g002
Figure 3. Schematic diagram of the principle of Sobol sensitivity analysis.
Sustainability 16 07026 g003
Figure 4. Schematic diagram of the principle of Morris sensitivity analysis.
Sustainability 16 07026 g004
Figure 5. Box plots and violin plots comparing water quality parameters of ULLs with different water sources across various seasons: (a) transparency comparison; (b) Chl-a comparison; (c) ISS comparison; and (d) COD comparison.
Sustainability 16 07026 g005
Figure 6. Sobol sensitivity analysis of water quality parameters for ULLs supplemented by surface water.
Sustainability 16 07026 g006
Figure 7. Morris sensitivity analysis of water quality parameters for ULLs supplemented by surface water.
Sustainability 16 07026 g007
Figure 8. Sobol sensitivity analysis of water quality parameters for ULLs supplemented by tap water.
Sustainability 16 07026 g008
Figure 9. Morris sensitivity analysis of water quality parameters for ULLs supplemented by tap water.
Sustainability 16 07026 g009
Figure 10. Sobol sensitivity analysis of water quality parameters for ULLs with the rainwater storage function.
Sustainability 16 07026 g010
Figure 11. Morris sensitivity analysis of water quality parameters for ULLs with a rainwater storage function.
Sustainability 16 07026 g011
Figure 12. Comparison of sensitivity analysis of water quality parameters for ULLs in Taiyuan with different supply sources and functions: (a) ULLs supplemented by surface water; (b) ULLs supplemented by tap water; and (c) ULLs with rainwater storage functions.
Sustainability 16 07026 g012
Table 1. Characterization of sampling points.
No.Water BodyArea
/(ha)
Depth/(m)Water SourceFunctionSampling PointsRemarks
1Fores Park25.001.40Surface waterLandscape fuction3
2Jinci Park20.001.502
3Yinmahe Park2.751.902Maintenance in Jul 2021
4Xihaizi Park1.301.92Maintenance in Jul–Aug 2021
5Nanhaizi Park1.401.92Maintenance in Jul–Aug 2021
6Yingze Park16.802.203
7Longtan Park16.502.55Tap water2Maintenance in Jul 2021
8Hexie Park1.762.002
9Xiangyun Park3.271.52
10Heping Park2.622.001
11Zoo Park2.5712
12Yifen Park0.231.52
13Beilin Park0.111.052
14Dongli Park0.31.82
15Xuefu Park5.261.20RainwaterLandscape function, flood control2
16Wenying Park3.962.402
Table 2. Sensitivity analysis results and performance parameters for ULLs bodies in Xi’an.
SobolMorris
S1STμμ*
Hancheng LakeISS0.510.51−0.190.19
Chla0.380.38−0.090.1
AN000.030.09
NN0.020.020.030.03
IP0.090.090.030.03
Xingqing LakeISS0.240.24−0.740.74
Chla0.670.67−0.30.3
AN0.020.0200
NN0000
IP0.070.0700
Disclaimer/Publisher’s Note: The statements, opinions and data contained in all publications are solely those of the individual author(s) and contributor(s) and not of MDPI and/or the editor(s). MDPI and/or the editor(s) disclaim responsibility for any injury to people or property resulting from any ideas, methods, instructions or products referred to in the content.

