Article

Influence of Soil Moisture in Semi-Fixed Sand Dunes of the Tengger Desert, China, Based on PLS-SEM and SHAP Models

1
Centre for Quantitative Biology, College of Science, Gansu Agricultural University, Lanzhou 730070, China
2
Shapotou Desert Research and Experimental Station, Northwest Institute of Eco-Environment and Resources, Chinese Academy of Sciences, Lanzhou 730000, China
*
Author to whom correspondence should be addressed.
Sustainability 2024, 16(16), 6971; https://doi.org/10.3390/su16166971
Submission received: 13 July 2024 / Revised: 9 August 2024 / Accepted: 13 August 2024 / Published: 14 August 2024

Abstract

:
Drought stress significantly limits the function and stability of desert ecosystems. This research examines the distribution characteristics of soil moisture across different microtopographic types in the semi-fixed dunes located at the southeastern edge of the Tengger Desert. We constructed a path model to examine the direct and indirect impacts of topography, shrub vegetation, and herbaceous vegetation. The data encompassed soil moisture, topography, and vegetation variables, which were collected from field experiments to ensure their accuracy and relevance. Furthermore, SHAP models based on machine learning algorithms were utilized to elucidate the specific mechanisms through which key factors influence soil moisture. The results of the descriptive statistics indicate the highest surface soil moisture content, recorded at 1.21%, was observed at the bottom of the dunes, while the leeward slopes demonstrated elevated moisture levels in the middle and deep soil layers, with measurements of 2.25% and 2.43%, respectively. Soil moisture at different depths initially decreases and then increases with greater herbaceous cover and slope direction, while surface soil moisture follows a similar trend in terms of height difference, with 3 m serving as the boundary for trend changes. Middle and deep soil moistures initially increase and then decrease with greater biomass and shrub coverage, with 30 g and 40% serving as the boundary for trend changes respectively. This study elucidates the spatial distribution patterns and influencing factors of soil moisture in semi-fixed dunes, offering valuable references for the establishment of sand-stabilizing vegetation in desert regions.

1. Introduction

Desertification, resulting from the interaction of multiple factors, including climate change and human activities, results in vegetation degradation and soil function loss, thereby threatening ecosystem functionality, human survival, and socioeconomic development [1]. In China, desertification typically occurs in arid and semi-arid regions north of 35° N, where annual precipitation is less than 450 mm and spring precipitation is less than 90 mm [2]. The degradation of fixed and semi-fixed dunes into mobile dunes, accompanied by a reduction in vegetation cover and an increase in aeolian activities, constitutes the primary form of land degradation [3]. Soil moisture restricts the abundance and growth of perennial plants in arid and semi-arid regions [4,5,6], thereby limiting the potential for vegetation restoration and mitigation of sand erosion. Several studies have illustrated the critical influence of topography on soil moisture distribution in arid and semi-arid ecosystems [7,8]. Soil moisture significantly governs the vegetation carrying capacity in arid desert regions, playing a pivotal role as the principal constraint in mitigating desertification processes [9]. Research on soil moisture variability, influenced by diverse topography and vegetation communities, contributes to the improvement of the efficiency of soil moisture utilization in arid and semi-arid desert regions, thus advancing ecological restoration efforts.
Vegetation serves as a crucial conduit for water exchange between soil and the atmosphere. Ecohydrological studies indicate that the type, structure, and distribution of vegetation communities significantly control both horizontal and vertical variations in soil moisture [10,11,12,13]. Different functional plant types exhibit temporal and spatial variations in their absorption of soil moisture at varying depths, directly impacting soil moisture dynamics throughout the growing season [14,15,16]. Canopies can modify the spatial distribution of soil moisture by altering precipitation patterns. Soil moisture displays lateral variations among regions located beneath the canopy, at the canopy periphery, and within exposed patches [17,18]. Plant root systems possess the ability to actively redistribute soil moisture, thus ensuring a consistent water supply in the shallow root zone during periods of drought [19,20]. The absorption of soil moisture is significantly influenced by phenological stages, stomatal resistance, plant density, and transpiration rates [14,15,16]. Consequently, soil moisture can produce significant feedback effects on the processes of plant establishment, growth, competition, and succession. Investigating the interaction mechanisms between vegetation and soil moisture facilitates the development of more accurate models for predicting soil moisture, thus enhancing simulations of complex ecohydrological processes, including transpiration, root water uptake, and soil moisture redistribution.
Variations in rainfall redistribution processes and solar radiation across distinct microtopographies directly impact soil moisture content and distribution [21,22]. On slopes, microtopography sometimes influences hydrological processes such as infiltration and runoff. Due to gravitational forces, water moves laterally downward more rapidly on steep slopes [22,23]. The slope aspect affects solar radiation absorption and evapotranspiration. In the northern hemisphere, soil moisture on northeast-facing slopes typically exceeds that on southwest-facing slopes [21,22,23,24]. Wind also plays a significant role in the distribution of soil moisture. Leeward slopes generally demonstrate elevated soil moisture levels relative to windward slopes, which can be attributed to decreased evaporation and enhanced dew deposition [21,25]. In arid and semi-arid sandy areas that are characterized by poor soils, sparse vegetation, and complex terrain, the impact of topography on soil moisture is particularly significant. Analyzing the mechanisms and extent of topographical influences at a micro scale remains a challenge.
Given the critical role of soil moisture in earth system processes, research on the primary factors influencing the spatiotemporal distribution of soil moisture has attracted significant attention in the field of ecohydrology over the past few decades [26]. Although climatic conditions, such as precipitation and radiation, often dominate soil moisture variability at the regional scale, small-scale variations in microtopography and vegetation patterns can significantly influence soil moisture at the local scale. At the local scale, several studies focusing on the main determinants of soil moisture have found that microclimate, soil texture, vegetation, and topography often play pivotal roles in soil moisture distribution [27,28,29,30,31]. However, the exact nature of these relationships remains unclear. Drought stress is a major factor limiting the functionality and stability of desert ecosystems. In ecohydrological studies of desert ecosystems, particularly at the local scale, understanding the interactions among soil moisture, vegetation, and topography is of critical importance. These interactions significantly influence the retention and drainage of water, creating various microhabitats that promote biodiversity [32]. Further research is required to investigate the distribution characteristics of soil moisture across different microtopographic types and to analyze the direct and indirect effects of topographic and vegetation factors on soil moisture. Such insights will not only enhance our understanding of desert ecology but also provide valuable applications in restoration ecology, sustainable agriculture, and climate change mitigation. Therefore, this study focuses on the semi-fixed dunes in the Shapotou area, located on the southeastern edge of the Tengger Desert. It aims to describe the soil moisture distribution characteristics at depths ranging from 0 cm to 300 cm across four microtopographic types: windward slope, leeward slope, the bottom of dunes, and the top of dunes. Additionally, a comprehensive examination of how topography and vegetation jointly influence soil moisture levels is crucial for understanding desert ecosystems.
In recent years, the application of machine learning methods in ecology has significantly increased, particularly in data-driven prediction and pattern recognition [33,34,35]. Nevertheless, traditional machine learning models frequently lack interpretability, rendering it challenging for researchers to comprehend the decision-making processes of these models and their implications for ecosystems [36]. To address this issue, interpretable machine learning techniques, such as Shapley Additive Explanations (SHAP), have emerged, offering quantitative explanations of feature importance [37]. These techniques enable ecologists to gain deeper insights into the underlying driving factors within ecological data. This study aims to investigate the intensity and direction of the influence exerted by various topographic and vegetation factors through the application of the SHAP method, thereby enhancing the interpretability of ecological models. Our research presents a methodological contribution by utilizing the SHAP interpretable machine learning technique, which allows us to not only establish accurate predictive models but also to identify key factors influencing ecological processes. Consequently, this provides a solid foundation for further research on desert ecosystems.

2. Materials and Methods

2.1. Description of Study Area

The study area is situated in the semi-fixed dunes of the Changliushui region, located in the southeastern part of the Tengger Desert, Zhongwei city, Ningxia Hui autonomous region. Geographically, this area spans between 37°30′~40°10′ N and 102°20′~105°55′ E. The annual average temperature is approximately 10.0 °C, with winter temperatures dropping to a minimum of −25.1 °C and summer temperatures reaching a maximum of 38.1 °C. The annual average rainfall is about 186.2 mm, with around 80% of precipitation events occurring between June and September. Approximately 64% of individual rainfall events have an intensity below 0.5 mm/h. Precipitation serves as the primary source of water for vegetation growth in this region, as the groundwater table lies between 50 m and 80 m deep, rendering it inaccessible to plants [38]. The average annual wind speed is approximately 2.9 m/s, accompanied by an average of 59 sandstorm days per year and an annual evaporation rate of 3000 mm [39,40]. The area is characterized by densely distributed grid dunes and crescent dunes. The soil substrate is predominantly loose sand, with primary soil types being primitive gray calcium soil and aeolian sandy soil. Sand-fixing vegetation communities in this area consist mainly of shrubs and herbaceous plants. Dominant shrubs include Caragana korshinskii and Hedysarum scoparium, while dominant herbaceous plants include Artemisia capillaris and Eragrostis minor.

2.2. Field Study Design

A comprehensive survey was conducted in July 2023 to investigate the natural sand-fixing vegetation in the Changliushui region, situated at the southeastern edge of the Tengger Desert. Following this survey, an experimental plot was established (37°27′26″ N, 104°46′12″ E, altitude 1573 m). This plot, measuring 40 × 180 m, incorporates four distinct microtopographic features: windward slope, leeward slope, dune bottom, and dune top (Figure 1).
The specific experimental methodologies employed are as follows: (1) Plot division: The study area was divided into 10 rows and 37 columns, resulting in individual subplots each measuring 4 × 4 m. (2) Soil moisture data collection: Sampling points were selected at the parallel corresponding positions of rows 3, 6, and 9. Additional sampling points were added in areas with significant topographical variation, resulting in the establishment of 72 points for soil moisture sampling, as illustrated in Figure 1. Soil samples were collected using a soil auger. The soil profile from 0 to 300 cm was divided into 18 layers. Layers above 50 cm were segmented into 0–5 cm, 5–15 cm, 15–25 cm, 25–35 cm, and 35–50 cm, with one sample taken per layer. For depths exceeding 50 cm, samples were taken every 20 cm. The collected soil samples were placed in pre-weighed aluminum containers (mass m0) and transported to the laboratory. The total mass of the container and soil was measured (mass m1) using an electronic balance before the samples were dried at 105 °C for 24 h. The mass was then measured again (mass m2). Soil moisture content was calculated using the following formula: (m1m2)/(m1m0) × 100%. (3) Herbaceous vegetation data collection: Row 4 was selected for herbaceous vegetation analysis. Considering the sparse and scattered nature of vegetation in desert regions, a 1 m × 1 m quadrat was used to investigate the cover and abundance of herbaceous plants in each subplot. All herbaceous plants in the selected row were harvested, placed in labeled paper bags, and taken to the laboratory. These samples were then dried at 65 °C to a constant weight and weighed using an electronic balance to record biomass. (4) Shrub data collection: All shrubs within the study plots were tagged with markers and their quantities recorded (Figure 2). The height of each shrub and the canopy diameters in both the longitudinal and latitudinal orientations were measured using a steel tape measure. Litterfall collection frames, each measuring 50 × 50 cm, were placed directly on the ground beneath the shrub vegetation. The collected litterfall was dried at 65 °C to a constant weight and subsequently weighed using an electronic balance to determine the litterfall mass. (5) Topographical data collection: The coordinates of the vertices of each subplot were obtained using an RTK surveying instrument. Subsequently, these data were utilized to calculate slope degree, direction, and height difference, which are essential for determining the distribution of soil moisture. Topographical data of each subplot were collected using high-resolution digital elevation models (DEMs).

2.3. Data Analysis Methods

2.3.1. Division of Soil Moisture

Herbaceous plants within the study region mainly reside in the soil layer, spanning depths from 0 cm to 40 cm [40,41,42]. About 80% of shrub roots are concentrated between 40 cm and 200 cm, with an additional 10% extending from 200 cm to 300 cm [43,44]. This study categorizes soil depth into three layers, as follows: the surface layer is defined as soil above 40 cm, the middle layer encompasses soil from 40 cm to 200 cm in depth, and the deep layer includes soil from 200 cm to 300 cm in depth. Each layer’s soil moisture content and influencing factors undergo separate analysis.

2.3.2. Calculate the Topographic Factors

The geodetic coordinate data obtained using RTK were converted into rectangular coordinate system data. The elevation difference for each point was calculated as the difference between the elevation of that point and the elevation of the lowest point in the plot. The elevation differences for the four vertices of each subplot were denoted as z a ,   z b , z c and z d . The average of these values was used to represent the height difference for the subplot.
Assuming the origin coordinates are x 0 ,   y 0 , z 0 , prior to the calculation of slope degree and direction, the unit normal vector of the quadrat was first determined. This vector n i , j is the vector product of the basic vectors a i , j and b i , j of the xoy plane, as shown in Equation (1).
n i , j = a i , j × b i , j
The formulas for a i , j and b i , j are provided in Equation (2),
a i , j = P i + 1 , j + 1 P i , j = Δ x , Δ y , z i + 1 , j + 1 z i , j b i , j = P i , j + 1 P i + 1 , j = Δ x , Δ y , z i , j + 1 z i + 1 , j
where Δ x and Δ y represent the unit lengths of the subplot, and P i , j denotes the standard vector, which is computed using Equation (3).
P i , j = x 0 + i 1 Δ x , x 0 + j 1 Δ y , z i , j
In Equation (3), i and j represent the length and width of the grid, respectively. The coordinate z i , j denotes the position of P i , j along the z axis.
The slope degree Q s l o p is defined as the angle formed by n i , j and the z axis, calculated as shown in Equation (4).
u = z a z b d i s = 2 z a z b 2 Δ x y v = z c z d d i s = 2 z c z d 2 Δ x y Q s l o p = tan 1 u 2 + v 2
In Equation (4), dis represents the length of the grid diagonal, Δ x y denotes the basic unit length of the grid, u represents the inclination angle at point z b , and v represents the inclination angle at point z d .
The direction Q d i r is defined as the angle between the projection of the unit normal vector n i , j on the xoy plane and the x axis, where the x axis is oriented towards the south. For a square grid, Q d i r is determined by Equation (5):
θ = tan 1 v u + π
The direction of Q d i r varies based on the value of u and v as follows:
When u < 0 , if v = 0 , then θ = 0 , indicating that Q d i r points due south. If v < 0 , then 0 < θ < 90 ° , indicating that Q d i r points southwest. If v > 0 , then 90 ° < θ < 0 , indicating that Q d i r points southeast. When u > 0 , if v = 0 , then θ = 180 ° , indicating that Q d i r points due north. If v < 0 , then 90 ° < θ < 180 ° , indicating that Q d i r points northwest. If v > 0 , then 180 ° < θ < 270 ° , indicating that Q d i r points northeast. When u = 0 , if v < 0 , then θ = 90 ° , indicating that Q d i r points due west. If v > 0 , then θ = 270 ° , indicating that Q d i r points due east.

2.3.3. Partial Least Squares Structural Equation Modeling Analysis

Partial least squares structural equation modeling (PLS-SEM), executed using R software (version 4.3.2), was employed to model intricate relationships between multiple dependent variables of soil moisture at varying depths (surface, middle, and deep) and various topographical–vegetation independent variables. The main advantage of this method is its capability to incorporate four latent variables that cannot be directly observed: topography, herbaceous vegetation, shrub vegetation, and soil moisture. The topographical-vegetation factors and soil moisture at different depths, derived from experiments, serve as observed variables by which to measure the specified latent variables. Table 1 presents a comprehensive correspondence between the latent and observed variables. PLS-SEM aims to minimize residuals so as to maximize the explained variance of endogenous latent variables and has proved effective when estimating relationships among variables, especially with small sample sizes and complex relationships. Furthermore, as a non-parametric method, PLS-SEM does not require assumptions about data distribution [45,46].

2.3.4. Machine Learning Algorithms

The random forest (RF) algorithm operates on the principle of the bagging algorithm, utilizing bootstrap sampling to randomly select several subsets from the original training dataset. Each subset is used to train a decision tree. For the random forest algorithm performing regression tasks, the final prediction is derived from the average of all decision tree predictions This method provides robust resistance to overfitting and ensures high accuracy [47,48].
Extreme gradient boosting (XGBoost) is a highly efficient gradient boosting algorithm designed to enhance model performance through the optimization of an objective function [49,50]. This objective function typically comprises a loss function and a regularization term, mathematically represented as follows:
L = i = 1 n l y i , y ^ i + k = 1 K Ω f k
where l is the loss function, y i is the true value, y ^ i is the predicted value, K is the number of trees, f k is the k-th tree, and Ω f k is the regularization term that controls the model’s complexity. Various loss functions can be employed in XGBoost to optimize performance, with mean squared error (MSE), mean absolute error (MAE), and mean absolute percentage error (MAPE) being the most commonly utilized, as follows:
M S E = 1 n i = 1 n y i y ^ i 2
M A E = 1 n i = 1 n y i y ^ i
M A P E = 1 n i = 1 n y i y ^ i y i × 100 %
XGBoost constructs decision trees iteratively to optimize the objective function, where a new tree is built in each iteration based on the current prediction errors, aiming to minimize the loss function. The model adopts an additive approach, expressed as follows:
y ^ i = k = 1 K f k x i
To mitigate overfitting, a regularization term is incorporated into the objective function, as follows:
Ω f = γ T + 1 2 λ j = 1 T w j 2
where T is the number of leaf nodes, w j is the weight of the leaf nodes, and γ and λ are regularization parameters. Furthermore, XGBoost leverages second-order gradient information, specifically the Hessian matrix, in each iteration to enhance convergence speed and prediction accuracy.
The bagging algorithm of random forests effectively reduces the risk of overfitting by independently constructing multiple decision trees, thereby enhancing the model’s robustness, particularly in handling noisy data and outliers. Moreover, the bagging algorithm is suitable for the rapid training and prediction of large-scale datasets and exhibits good parallelism [51,52]. However, the interpretability of bagging is relatively poor, and understanding feature importance is not intuitive. Additionally, the multiple trees generated can lead to a large model size, which may impact storage and computational efficiency. In contrast, the boosting algorithm progressively optimizes the model and typically achieves higher predictive accuracy in many machine learning tasks, particularly when dealing with imbalanced data, demonstrating stronger identification capabilities. Additionally, the regularization terms introduced by boosting help mitigate overfitting. However, boosting usually requires longer training times and is sensitive to noisy data, which may lead to a higher risk of overfitting, especially when the data are limited or parameter settings are inappropriate [53,54]. When selecting a model, it is crucial to comprehensively consider the characteristics of both bagging and boosting, as well as the specific application scenario and data properties, to achieve optimal modeling results.
Based on game theory, SHAP is designed to explain the predictions of machine learning models. Its core concept originates from Shapley values, which are used to measure the marginal contributions of each participant in a cooperative game [37,55]. In the context of SHAP, the Shapley value ϕ j for a feature x j is calculated using the following formula:
ϕ j = S N j S ! N S 1 ! N ! f S j f S
where N represents the set of all features, S is a subset of features, and f(S) denotes the model output using only the subset S. This approach considers all possible feature combinations, ensuring that each feature’s contribution is evaluated fairly and consistently. Additionally, the SHAP model possesses an additive property, meaning that the model’s prediction can be expressed as the sum of a baseline value and the contributions of each feature, as follows:
f x = ϕ 0 + j = 1 M ϕ j
where ϕ 0 is the baseline value, typically the model’s prediction when no features are present. This framework not only effectively captures interactions between features but also provides reliable interpretability for complex models. Although the calculation of Shapley values involves considering all feature combinations, SHAP leverages Monte Carlo methods and approximation algorithms to compute SHAP values efficiently, thereby enhancing model transparency and interpretability.

3. Results and Analysis

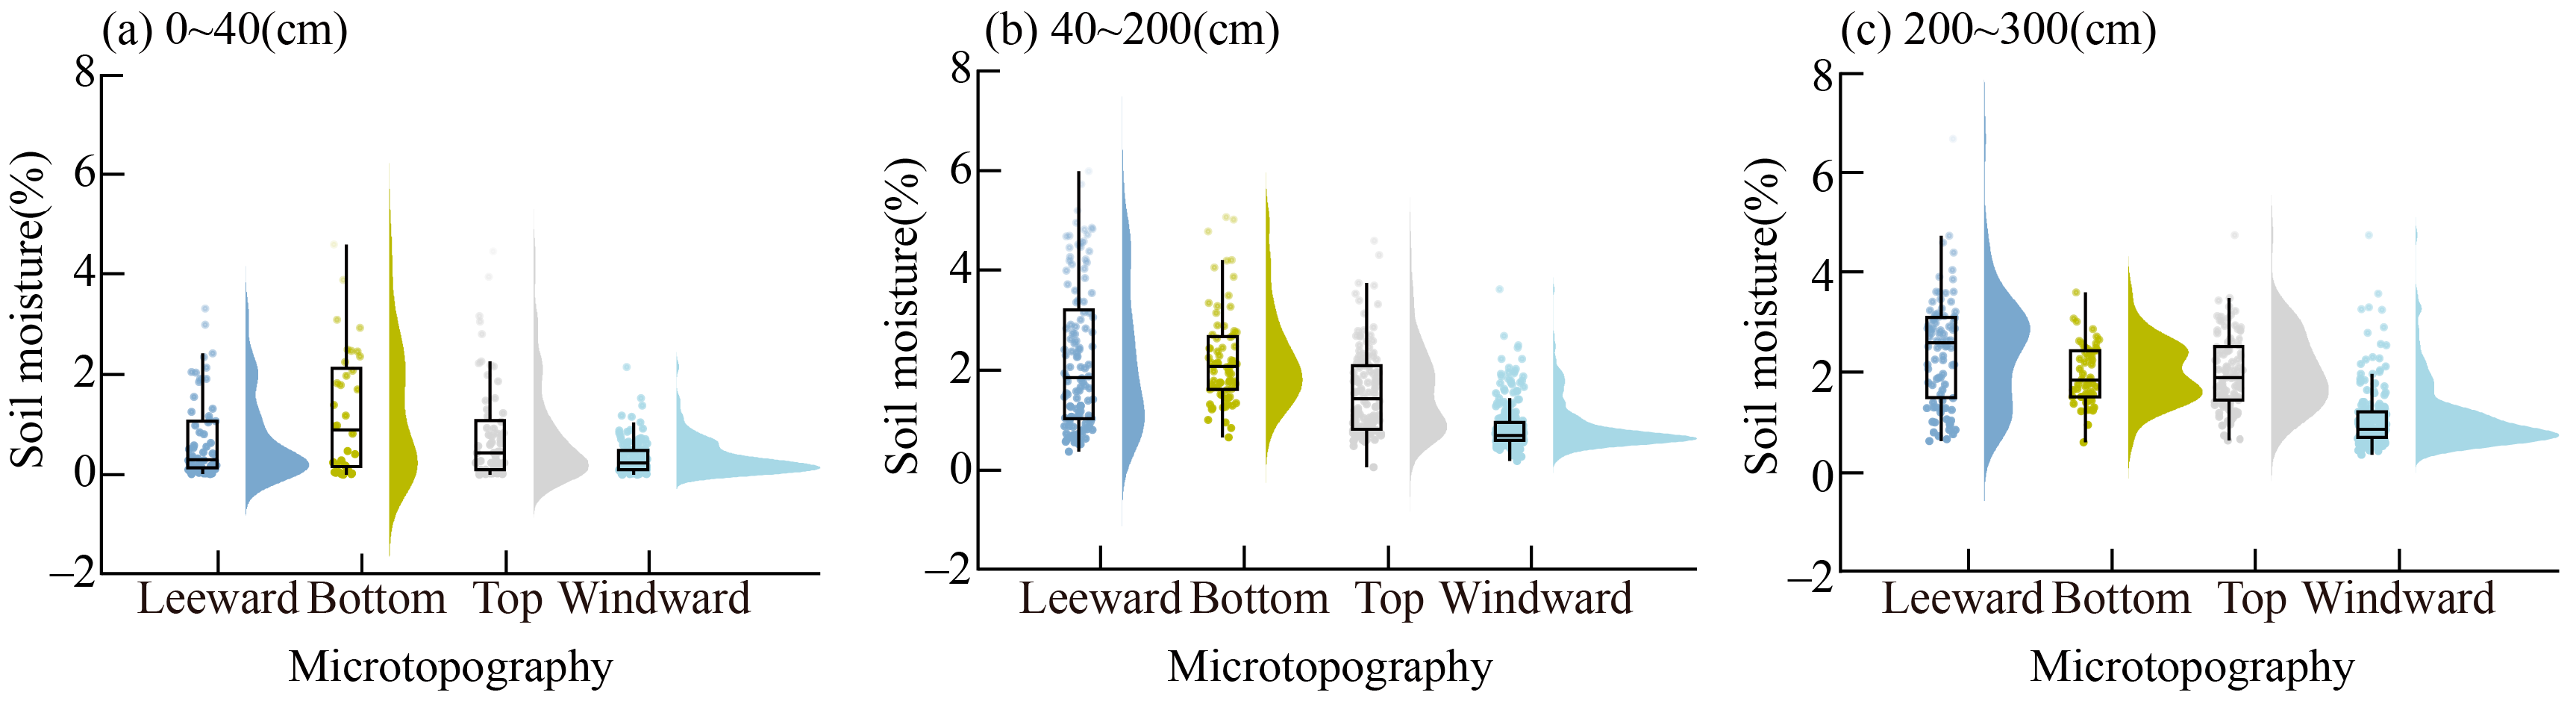
3.1. Patterns of Soil Moisture Distribution among Four Microtopography Types

In different microtopography types, surface soil moisture follows the following order: the bottom of dunes (1.21 ± 0.50)% > the top of dunes (0.81 ± 0.71)% > leeward slope (0.71 ± 0.44)% > windward slope (0.34 ± 0.19)%. Soil moisture on the leeward slope, windward slope, and the top of dunes exhibits a relatively distinct peak, showing a right-skewed distribution that indicates a higher probability of low moisture values (Figure 3a). For mid-layer soil moisture, the order is leeward slope (2.25 ± 1.18)% > the bottom of dunes (2.23 ± 0.56)% > the top of dunes (1.57 ± 0.71)% > windward slope (0.86 ± 0.35)%. Soil moisture on the windward slope and the bottom of dunes presents a notably concentrated unimodal distribution. The soil moisture distribution on the top of dunes shows two peaks with smaller values at the ends and larger values in the middle, indicating a differentiated distribution with a lower probability of extremely high or low values. The leeward slope’s soil moisture shows a less distinct bimodal distribution with considerable spatial variability (Figure 3b). For deep-layer soil moisture, the sequence is leeward slope (2.43 ± 0.88)% > the top of dunes (2.01 ± 0.54)% > the bottom of dunes (1.98 ± 0.45)% > windward slope (1.09 ± 0.55)%. The windward slope exhibits a clear right-skewed distribution, indicating a higher probability of lower moisture values (Figure 3c). The coefficient of variation (CV) of soil moisture distribution at different depths across the four microtopography types (Table 2) indicates that surface and mid-layer soil moisture show substantial fluctuations, whereas deep-layer soil moisture exhibits less fluctuation and a more stable distribution. Soil moisture at the bottom of dunes shows the least variation among all microtopography types.

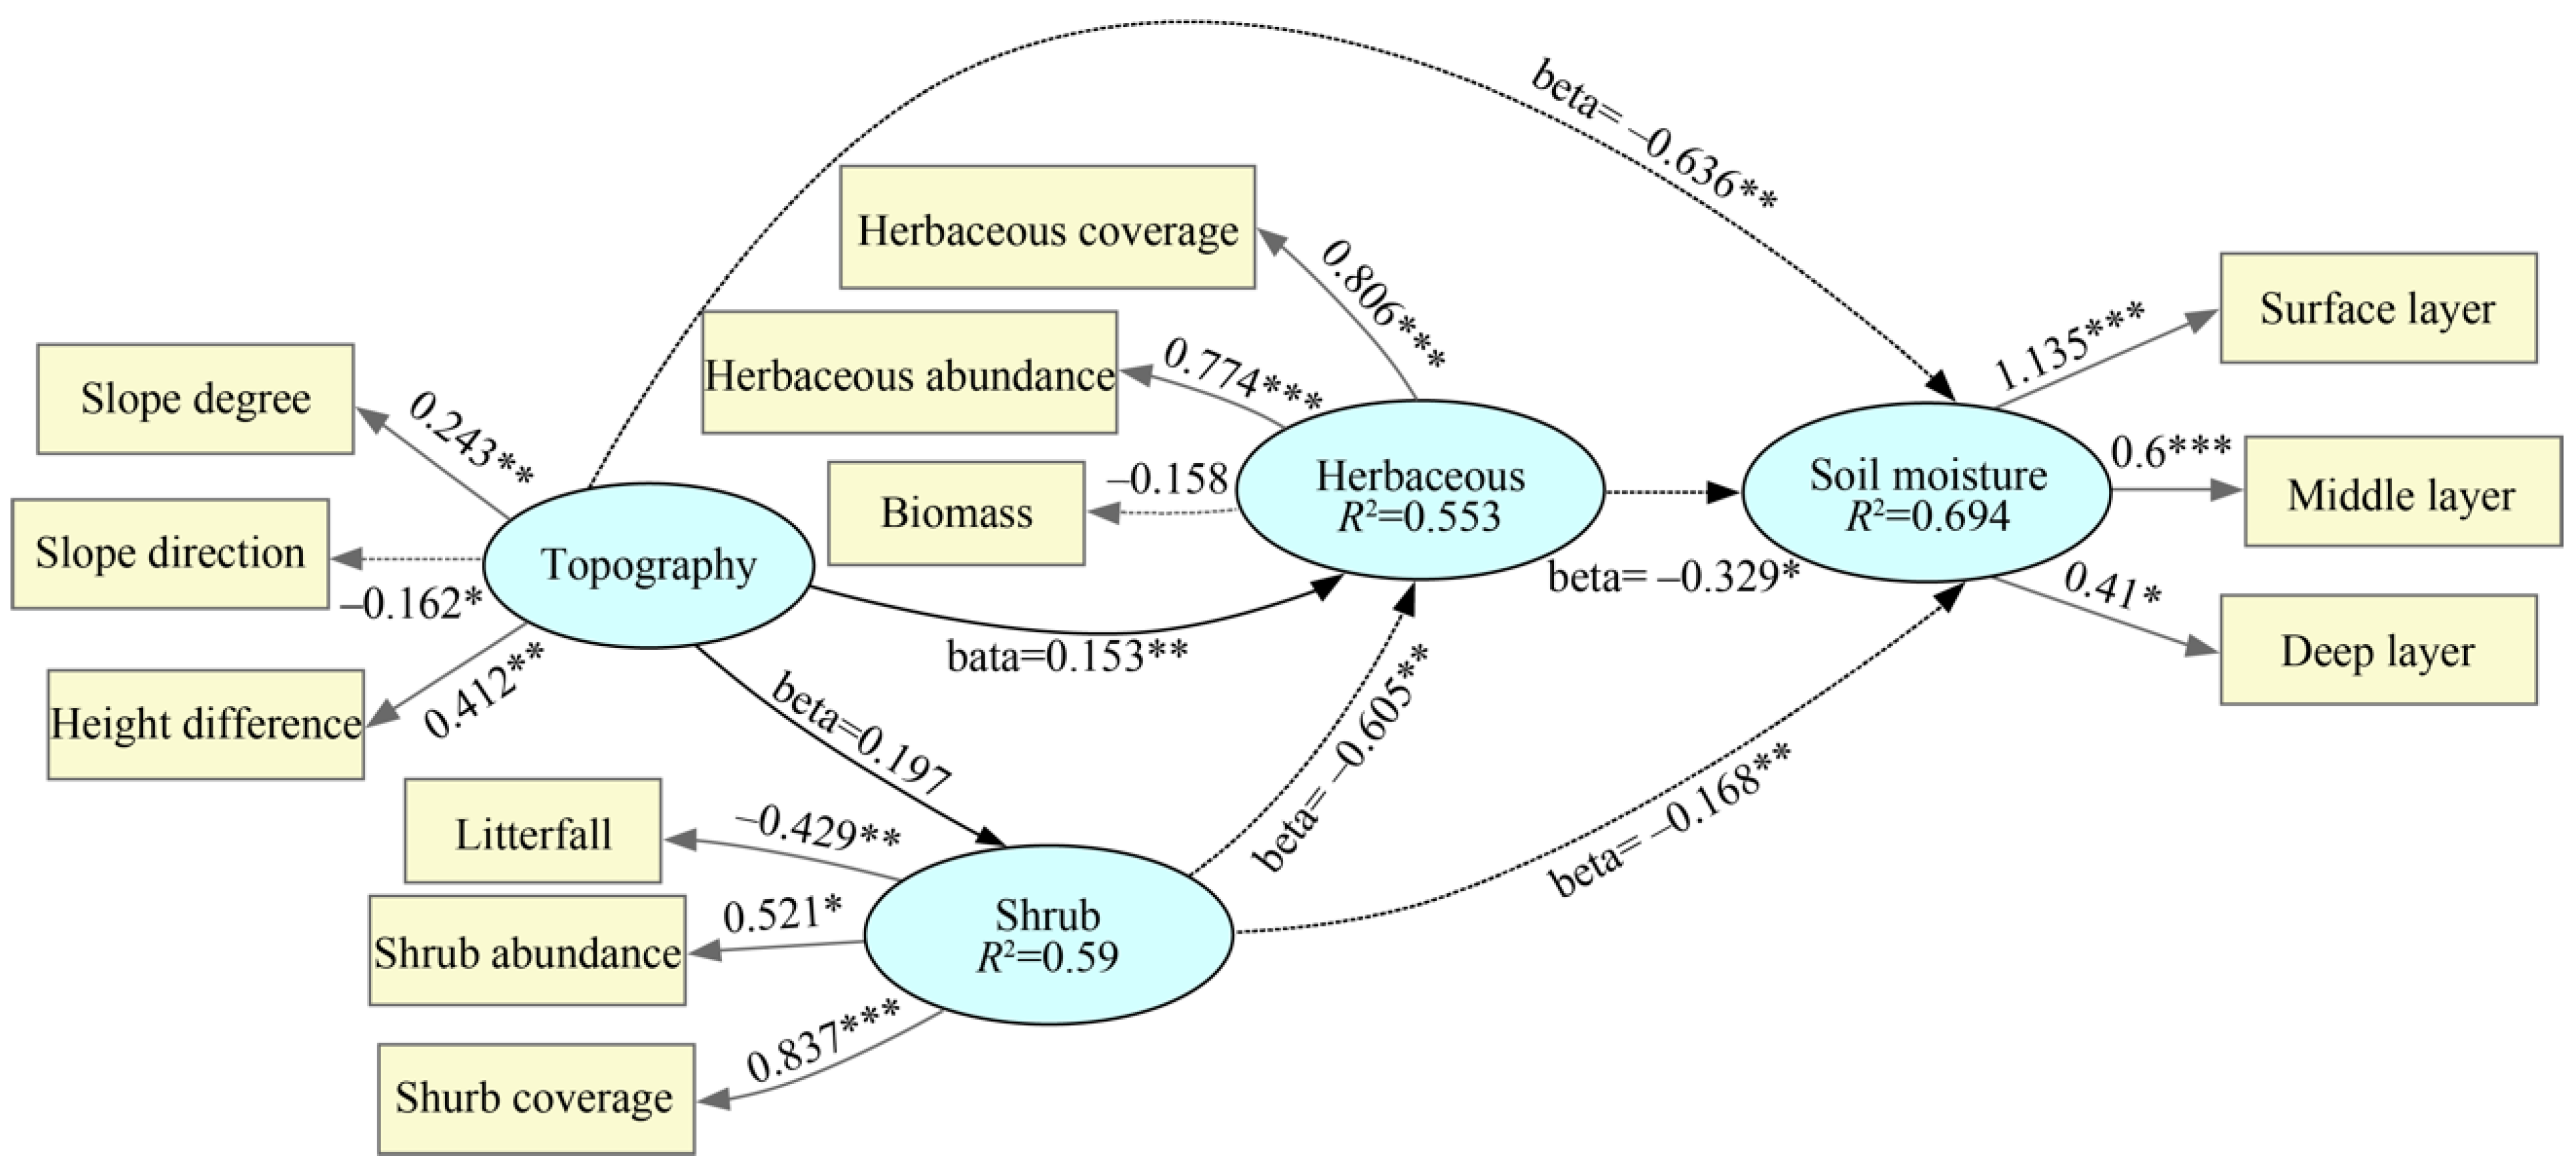
3.2. Influence Pathways of Topographical and Vegetative Factors

Topography, shrub vegetation, herbaceous vegetation, and soil moisture were considered latent variables in this study. A partial least squares structural equation modeling (PLS-SEM) was constructed incorporating topography–vegetation factors along with surface, middle, and deep layer soil moisture as observed variables. Path coefficients for each pathway were calculated using the least squares method, and significance tests were conducted to explore the impact pathways on soil moisture. The study hypothesized that topography directly affects soil moisture and indirectly affects it by influencing the distribution patterns of herbaceous and shrub vegetation. Additionally, it was proposed that shrub and herbaceous vegetation exert a reciprocal influence on each other, indirectly influencing soil moisture, and both have direct effects on soil moisture.
The external model was initially validated using Cronbach’s alpha coefficient, a metric commonly employed to assess the correlation or consistency among a set of measurement items to determine if they measure the same concept. Its values range from 0 to 1, with higher values indicating greater consistency among measurement items. Typically, an α coefficient exceeding 0.7 is considered acceptable for internal consistency [56]. Additionally, the DG. rho coefficient was utilized to evaluate the model’s predictive ability for external indicators, specifically assessing the correlation between predicted values and actual observations. The DG. rho coefficient typically ranges between 0 and 1, with values closer to 1 indicating better predictive capability of the model for external indicators. DG. rho coefficients above 0.7 are generally deemed acceptable [57].The first eigenvalue reflects the overall predictive power of the external model. A larger first eigenvalue suggests that the model explains a greater variance in external indicators, indicating stronger overall predictive capability. The second eigenvalue is often used to evaluate model overfitting [58]. A smaller second eigenvalue indicates that the model has good predictive ability for external indicators without overfitting the data. The validation results (Table 3) indicate that the C. alpha coefficients for topography and soil moisture exceed 0.7, while those for shrub vegetation and herbaceous vegetation exceed 0.6. The DG. rho coefficients for all four latent variables exceed 0.8, with first eigenvalues exceeding 1 and second eigenvalues below 1, suggesting the external model’s good effectiveness.
The internal model’s explanatory power was validated by calculating the GoF value using Formula (14), as follows, where c o m m u n a l i t y represents the average extent to which the observed variables are explained by the latent variables.
G o F = c o m m u n a l i t y ¯ × R 2 ¯
The GoF value ranges from 0 to 1. A GoF value less than 0.25 indicates weak explanatory power, a value between 0.25 and 0.36 indicates moderate explanatory power, and a value greater than 0.36 indicates good explanatory power [59]. The calculated values are c o m m u n a l i t y ¯ = 0.56 and R 2 ¯ = 0.61, resulting in a GoF value of 0.58, thereby confirming the model’s strong explanatory power.
The impact pathways (Figure 4) indicate that topography has a significant positive impact on herbaceous vegetation and a significant negative impact on soil moisture. Both herbaceous and shrub vegetation have significant negative impacts on soil moisture, likely due to their consumption of soil moisture during growth. The degree of competition will depend on the shrub species, the developing species more rapidly impacts the neighboring plant more negative. Topography has the greatest effect on soil moisture ( β = −0.636), followed by herbaceous vegetation ( β = −0.329), and shrub vegetation has the smallest effect ( β = −0.168). Among topographical factors, slope degree and height difference have the most significant impact on soil moisture ( p < 0.01). For herbaceous vegetation, herbaceous coverage and abundance are most significant ( p < 0.001), while for shrub vegetation, shrub coverage is most significant ( p < 0.001). It is noteworthy that, while PLS-SEM serves as an exploratory analytical method capable of elucidating the correlations between variables, caution is warranted when inferring causal relationships based on these correlations. Unmeasured or uncontrolled variables may simultaneously influence both independent and dependent variables, thereby contributing to the observed correlations.

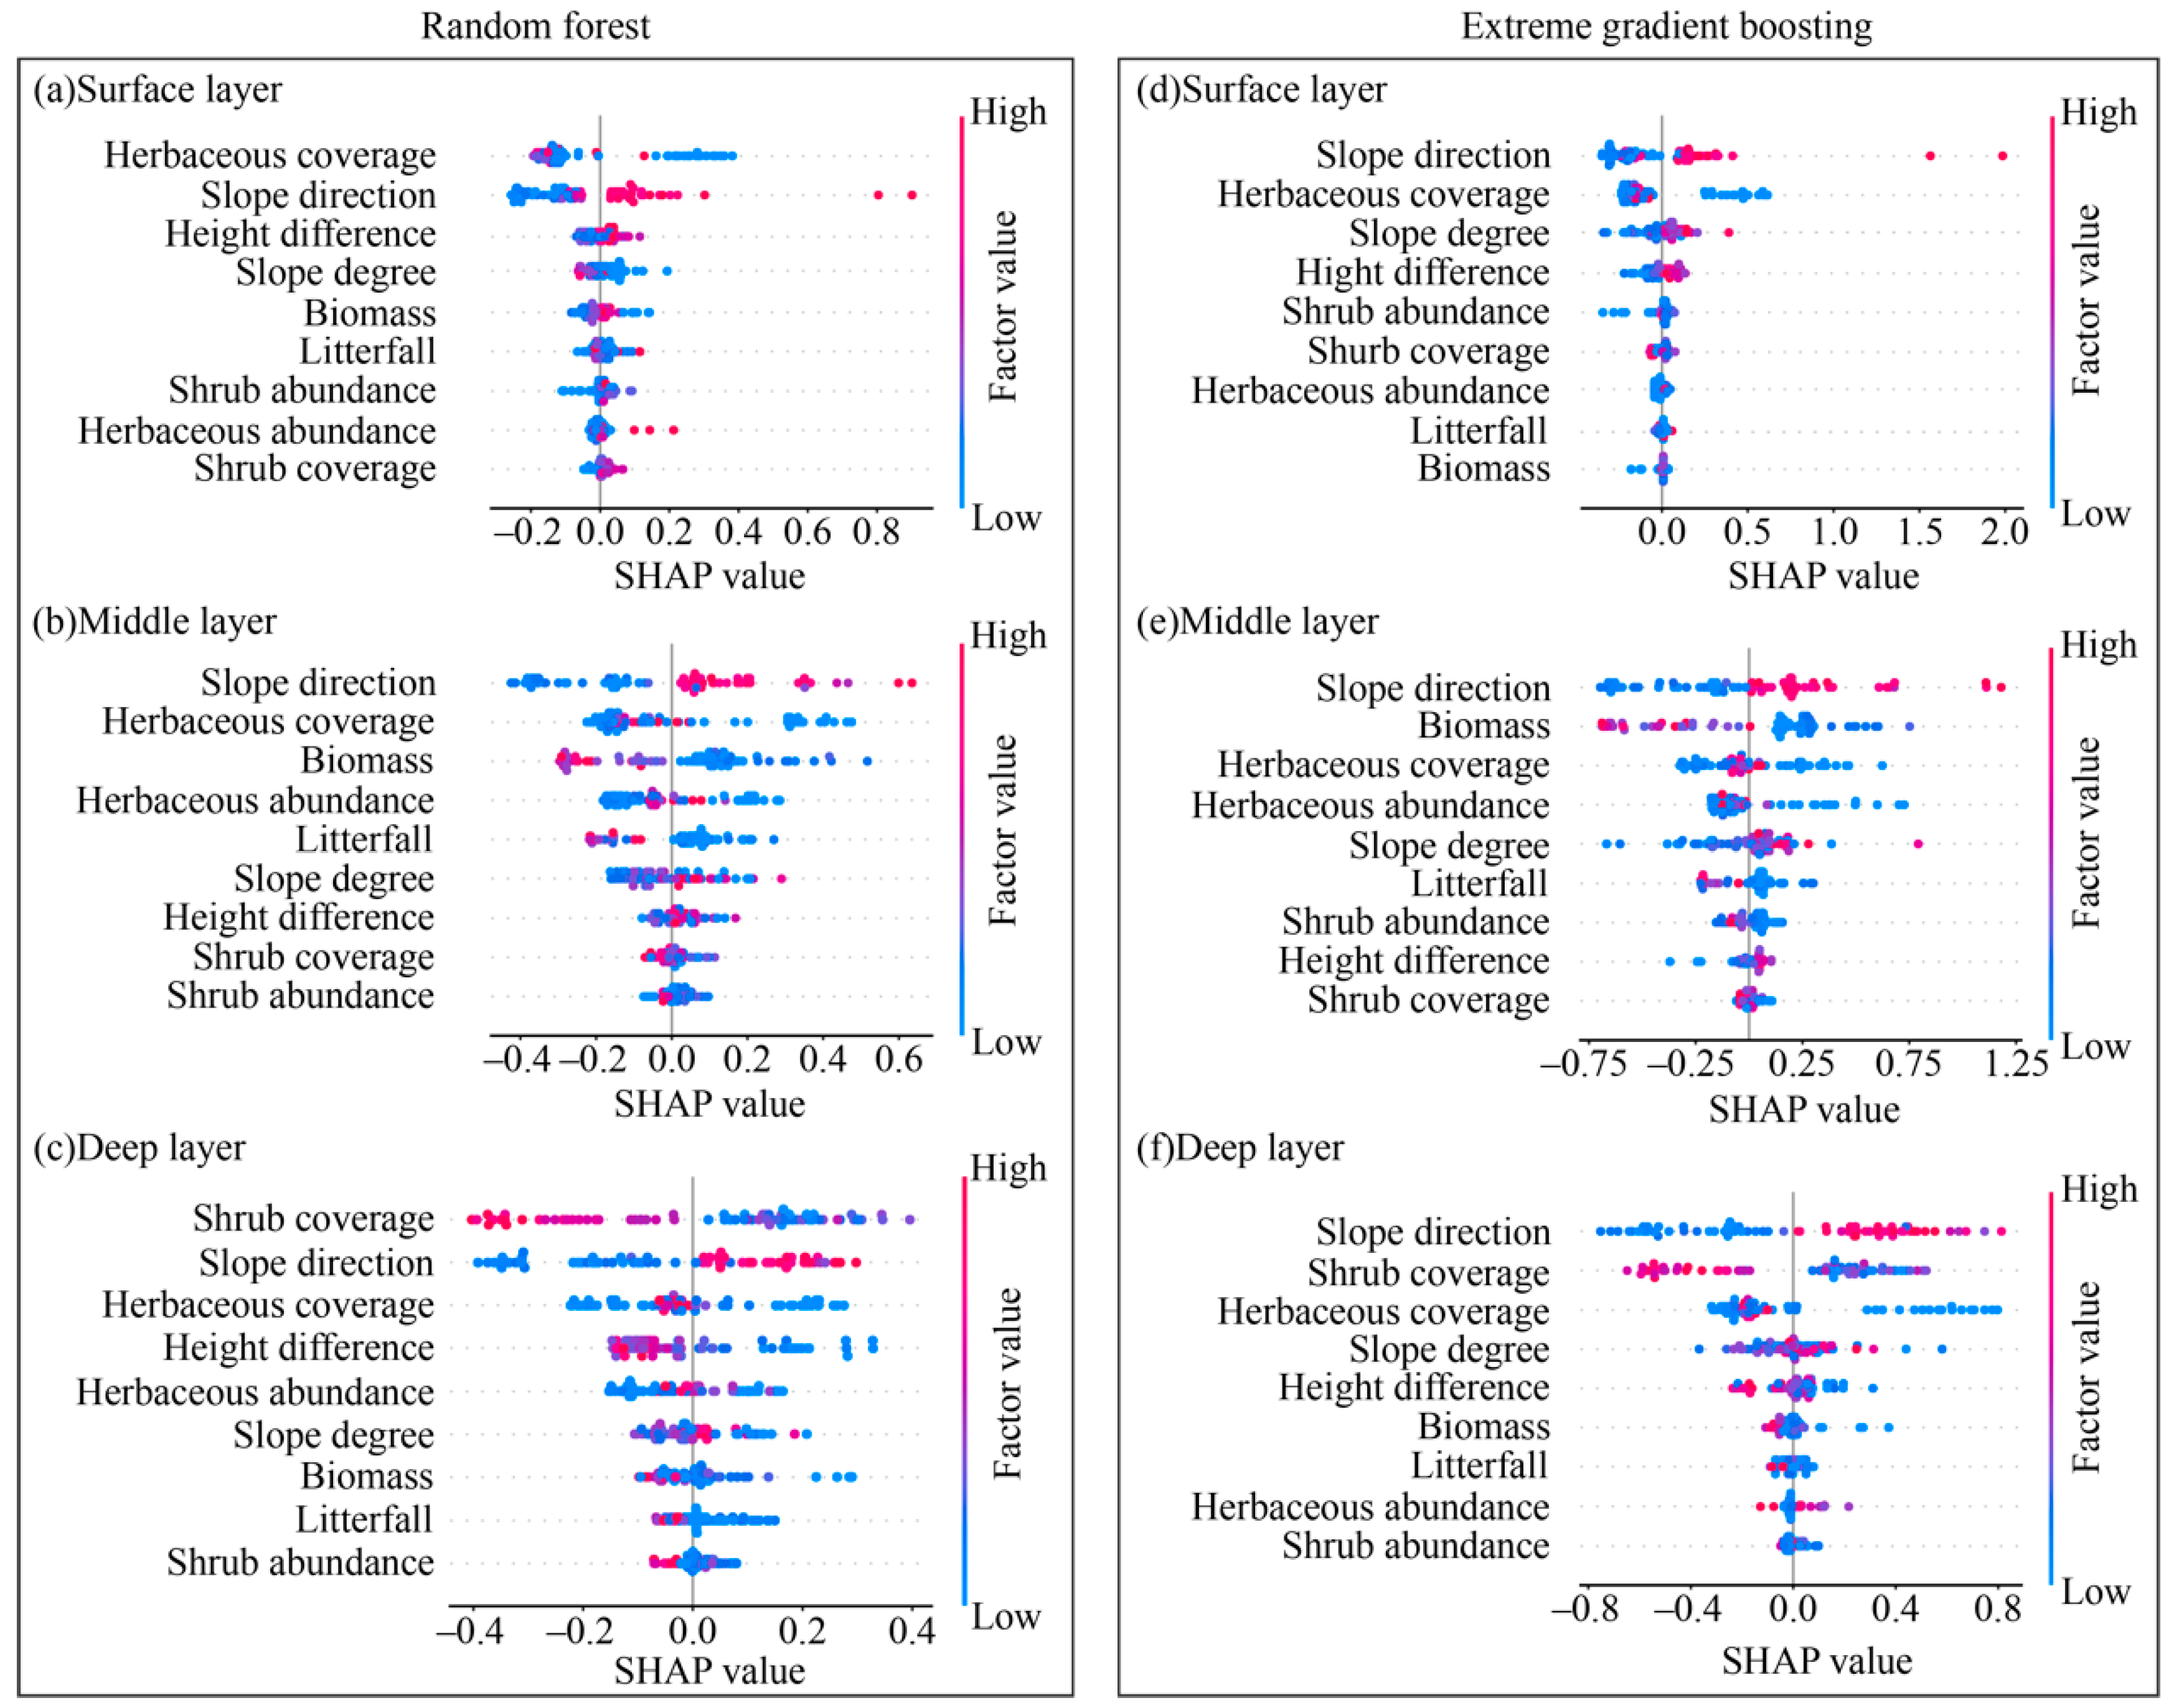
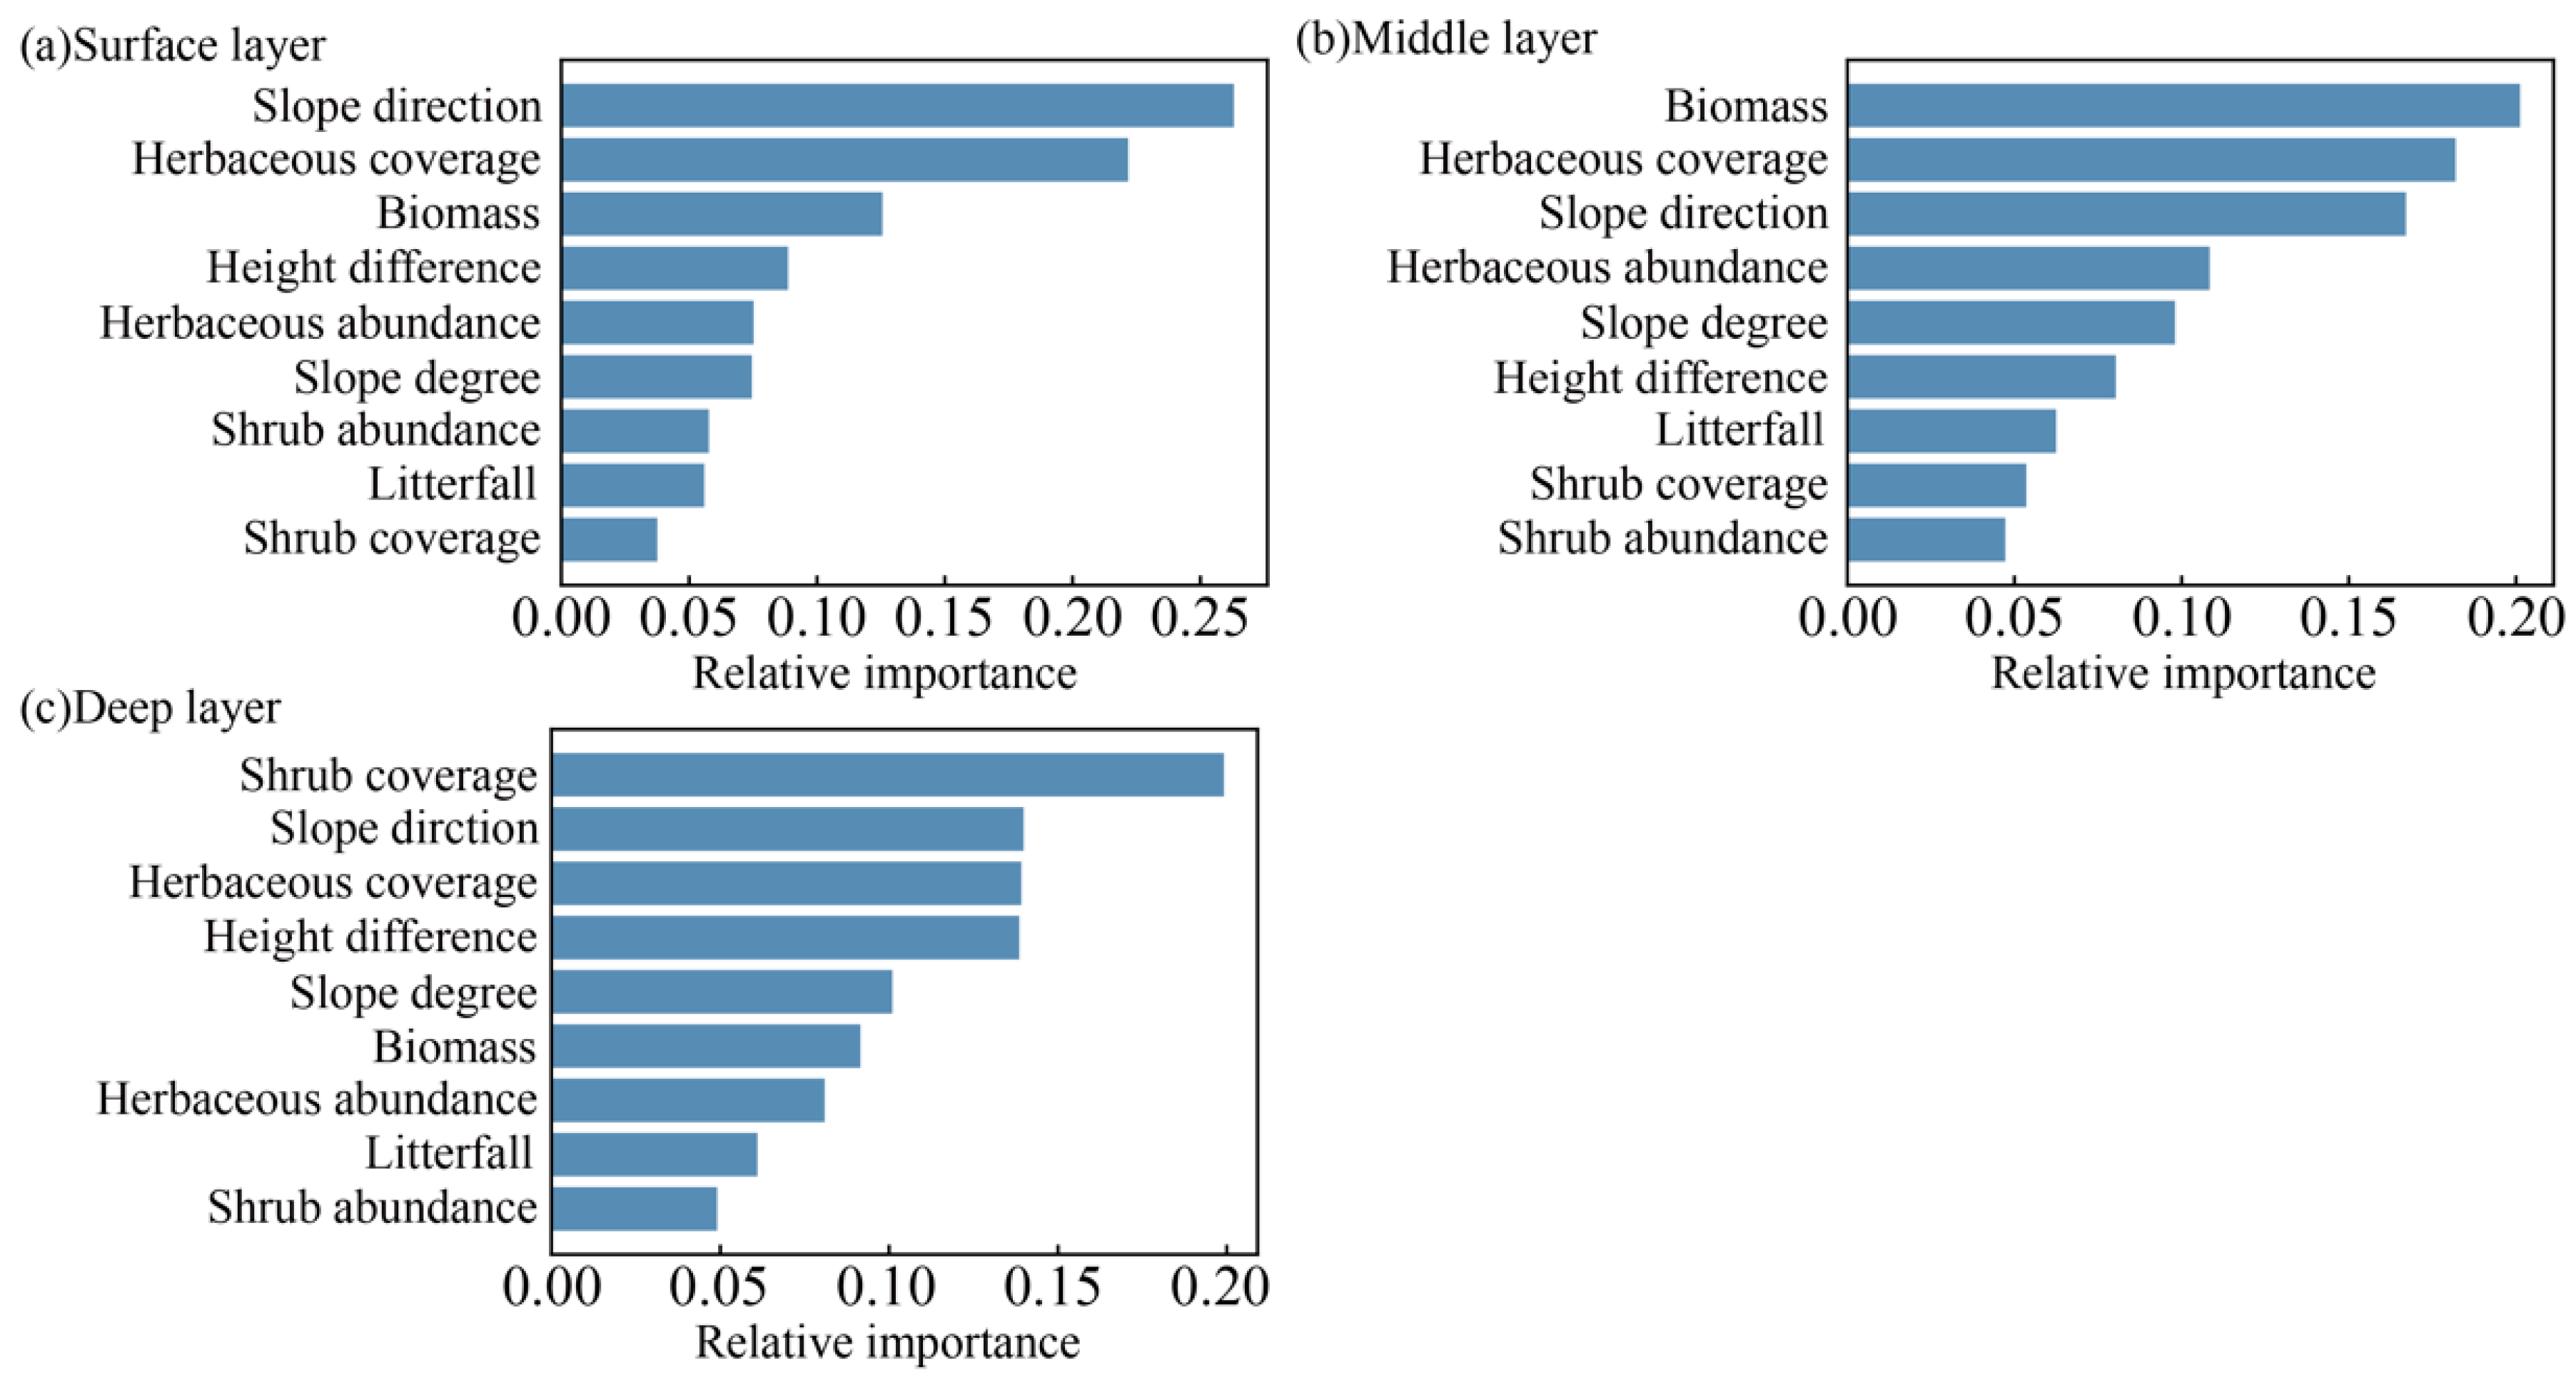
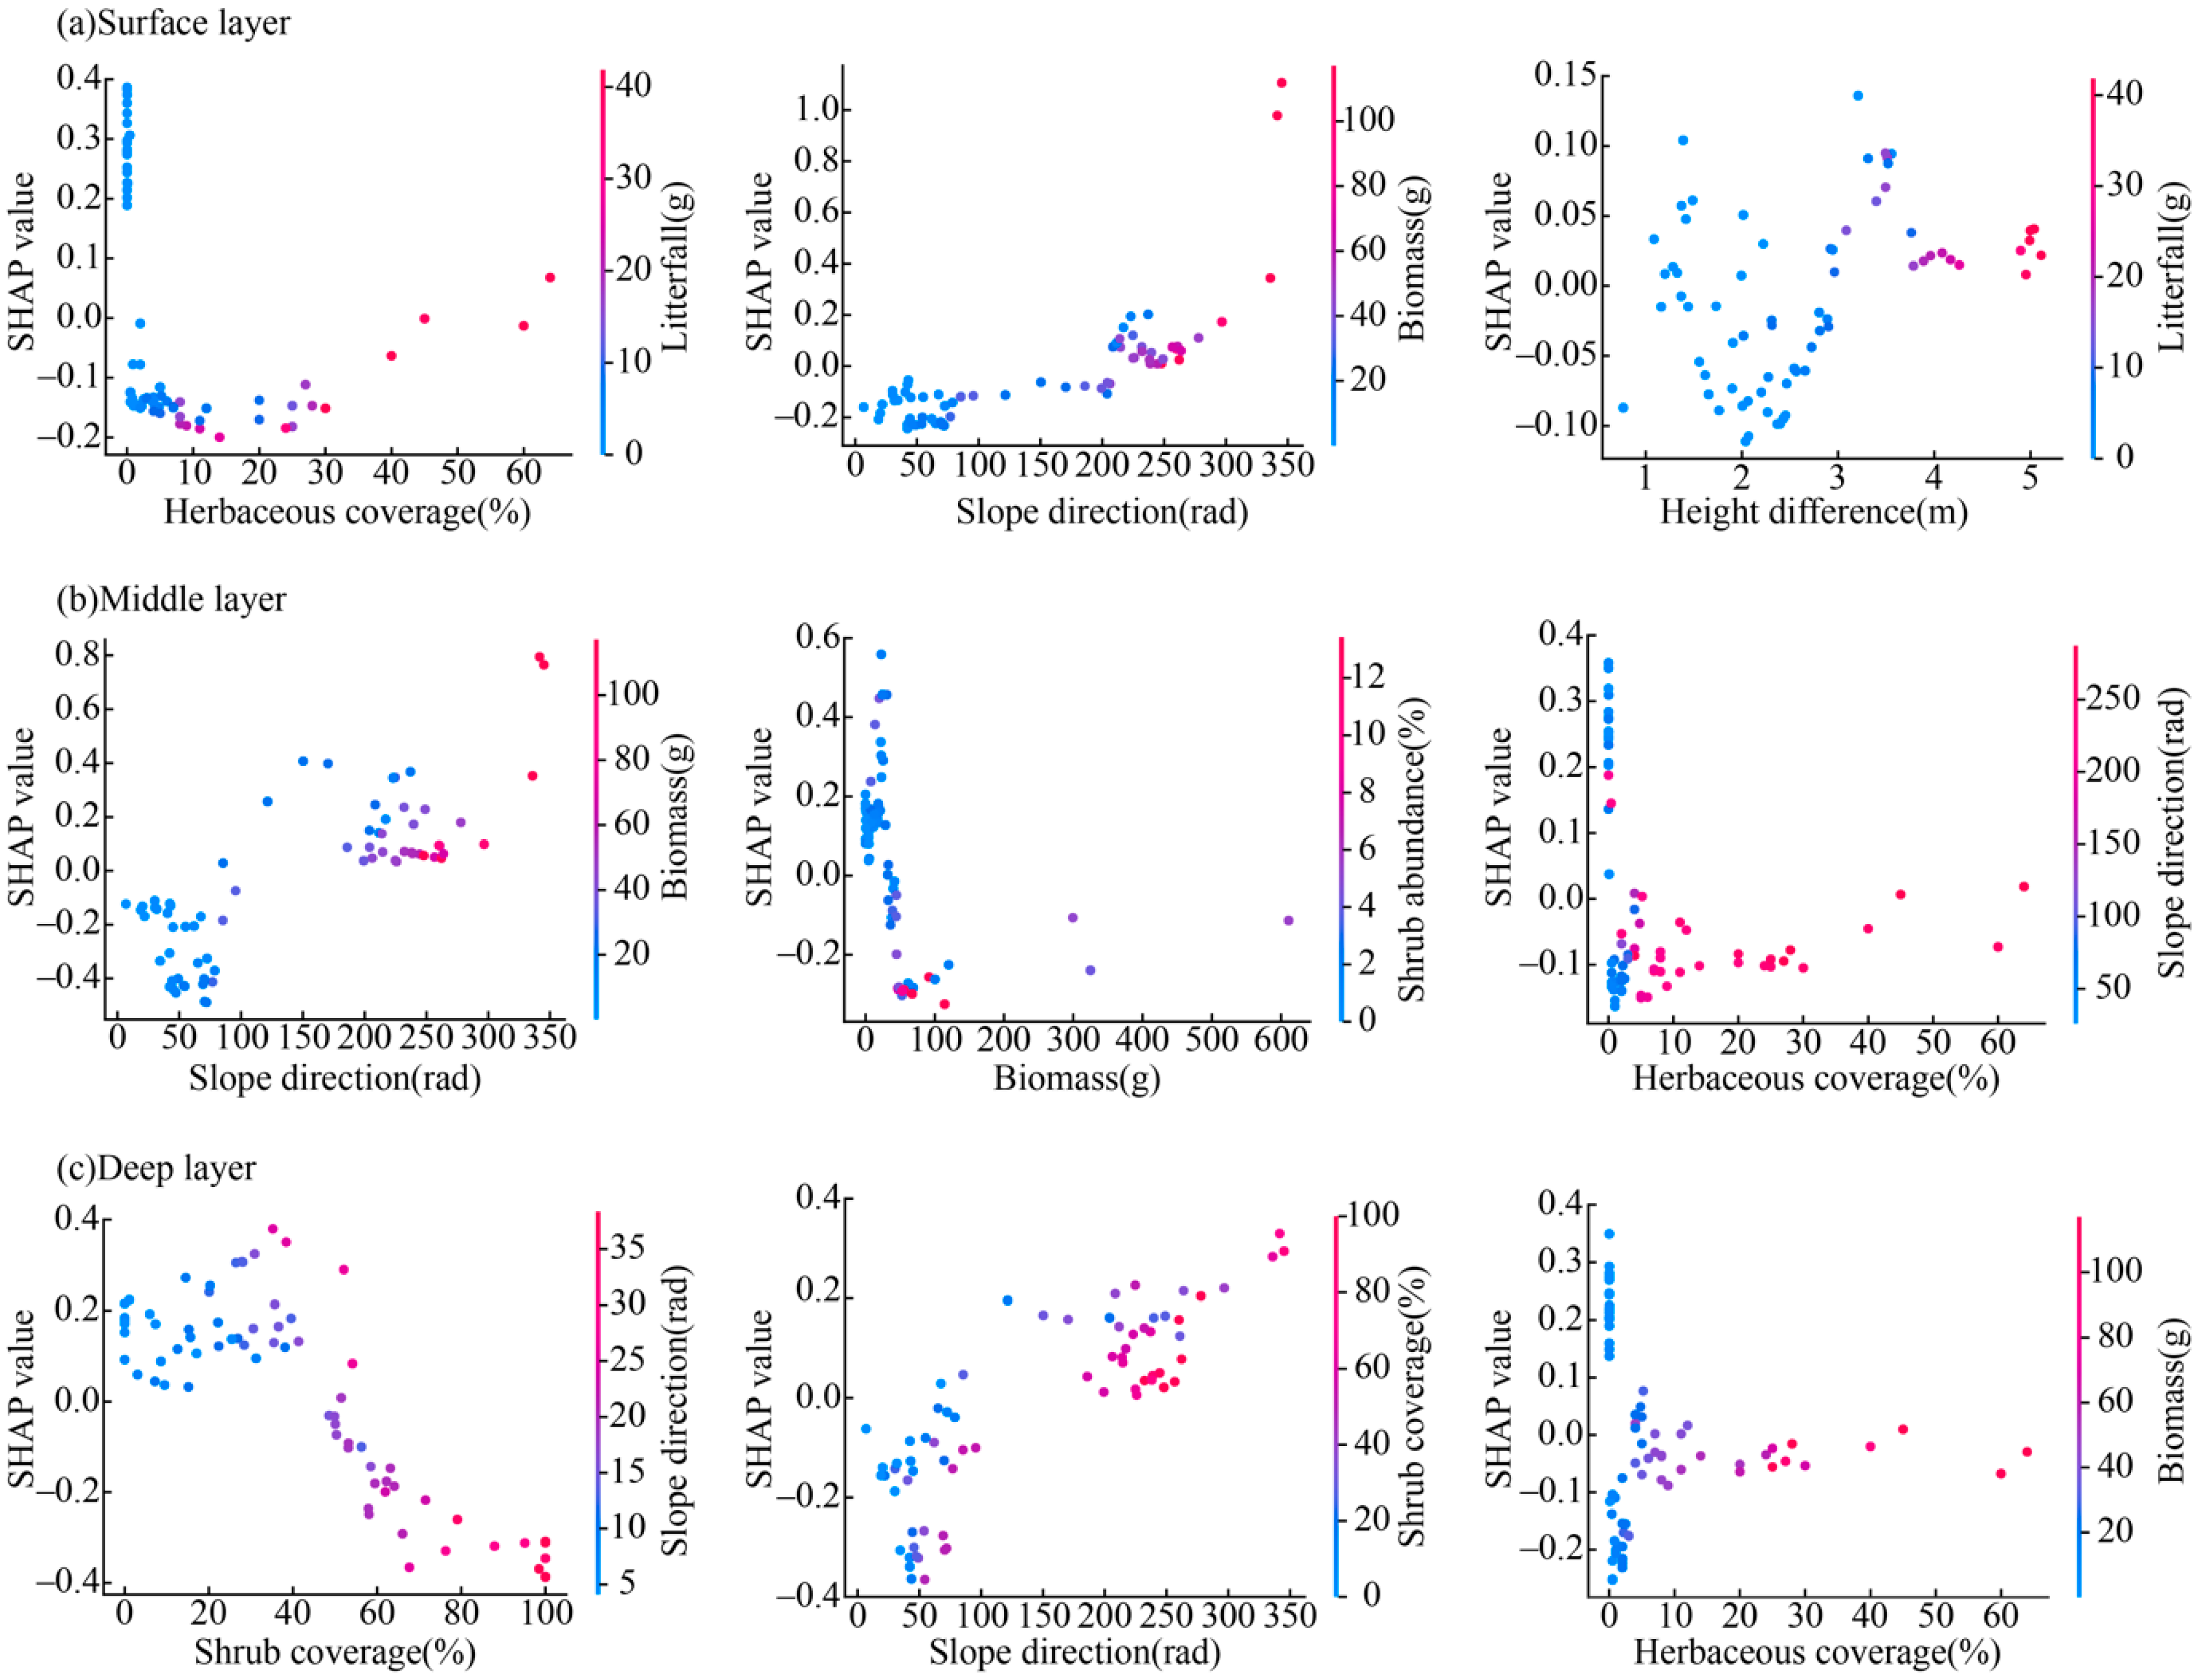
3.3. Analysis of Factors Influencing Soil Moisture Based on the SHAP Model

Two machine learning algorithms, RF and XGBoost, were implemented using Python 3.11.0. The hyperparameters of the models were optimized using grid search and 5-fold cross-validation. The optimized parameters are presented in Table 4 and Table 5. This study utilized four statistical metrics to assess the predictive accuracy of RF and XGBoost models, with 80% of the data allocated as the training set and 20% as the testing set. These evaluation metrics facilitate the comparison of cumulative errors between predicted values and actual observations. The statistical parameters employed include R², MSE, MAE, and MAPE (Table 6). Collectively, these measures offer valuable insights into the predictive accuracy of the ensemble learning models. Furthermore, in the process of selecting appropriate parameters for optimization, the RF model exhibited superior potential in predicting soil moisture across surface, middle, and deep layers.
The SHAP models based on RF and XGBoost were employed to prioritize factors based on their significance for soil moisture levels. The magnitude of the SHAP score signifies the intensity of the factor’s influence on soil moisture, where higher absolute values denote more pronounced effects. A positive SHAP value signifies a beneficial effect of the factor on soil moisture fluctuations. High factor values are displayed in red, while low values are depicted in blue based on the factor’s magnitude. Due to the superior model fit of RF, it was selected for factor importance ranking. The factor importance rankings from Figure 5 and Figure 6 reveal that the significance of each factor for soil moisture differs across various depths. The comprehensive rankings demonstrate that herbaceous coverage, slope direction, and height difference have notable impacts on surface soil moisture; that slope direction, herbaceous coverage, and biomass are influential for mid-level soil moisture; and that shrub coverage, slope direction, and herbaceous coverage play significant roles in deep soil moisture levels. Specifically, high values of biomass and shrub coverage exert adverse effects on soil moisture, whereas elevated values of slope direction and height difference promote soil moisture levels. The impact of herbaceous coverage is intricate, with a general tendency towards reducing soil moisture.
Figure 7 further elucidates the effect of topography–vegetation factors on soil moisture. Despite differing sequences, all models consistently identify the top three contributing factors. Consequently, three factors that contribute most significantly to soil moisture at varying depths were selected for a detailed analysis of their specific mechanisms. The results indicate that a herbaceous coverage of near 0 may either positively or negatively affect soil moisture, potentially due to its less pronounced impact at lower cover levels. Increasing herbaceous coverage adversely affects soil moisture (Figure 6a–c). Slope degrees below 100 radians adversely affect middle and deep soil moisture, while those above 100 radians exert a positive effect (Figure 6b,c). Height differences below 3 m negatively impact surface soil moisture, whereas those above 3 m have a positive impact (Figure 6a). Biomass below 30 g positively affects middle soil moisture, but biomass above 30 g exerts a negative effect (Figure 6b). Shrub coverage below 40% positively impacts deep soil moisture, whereas cover above 40% has a negative effect, with the adverse impact intensifying as shrub cover increases (Figure 6c). In summary, soil moisture at different depths generally decreases with increasing herbaceous coverage, initially decreasing and then increasing with slope direction. Furthermore, surface soil moisture initially decreases and subsequently increases with rising height difference and middle and deep soil moisture originally rises and then declines with increasing biomass and shrub coverage, respectively.
A waterfall plot was generated to depict surface soil moisture, highlighting the factors that affect soil moisture variations across four microtopography types. Windward slope soil moisture is significantly influenced by herbaceous abundance, slope direction, and height difference. Herbaceous abundance at 48%, slope direction of 262.195 radians, and height difference of 5.109 m positively impact soil moisture on windward slopes, whereas biomass of 141.212 g has a negative effect (Figure 8a). Soil moisture at the bottom of dunes is notably influenced by slope direction, herbaceous coverage, and height difference. A slope direction of 277.839 radians, height difference of 3.554 m, and total litterfall of 2.652 g positively influence soil moisture at the dune bottom, whereas herbaceous coverage at 4% has a negative impact (Figure 8b). Leeward slope soil moisture is significantly influenced by herbaceous coverage, biomass, and litterfall. Herbaceous coverage at 25% and litterfall at 16.724 g have a negative impact, whereas biomass at 324.704 g and a slope direction of 247.875 radians positively affect it (Figure 8c). Soil moisture at the top of dunes is significantly influenced by slope direction, biomass, and herbaceous abundance. A slope direction of 345.117 radians, biomass of 141.212 g, herbaceous abundance at 92%, and herbaceous coverage at 64% positively influence soil moisture at the top of dunes (Figure 8d). Figure 7 reflects the impact results for individual samples, indicating variability in the sequence of topography–vegetation factor importance among samples compared with the overall sequence. The following findings provide additional support for Figure 7: lower herbaceous coverage (below 40%) negatively affects soil moisture (Figure 8b,c), whereas higher herbaceous coverage has a positive effect (Figure 8d). Slope directions above 200 radians and height differentials exceeding 3 m positively impact soil moisture (Figure 8a,b).
Variations in model selection and parameter settings can lead to differing local SHAP values, potentially undermining the reliability of global analyses. The application of ensemble methods, such as RF or XGBoost, which integrate predictions from multiple models, typically demonstrates greater stability compared with single models, thereby reducing uncertainty. Moreover, conducting hyperparameter optimization to determine optimal parameter settings can minimize fluctuations in model performance. By employing these integrated strategies, we can more accurately assess the impacts of terrain and vegetation features on soil moisture.

4. Discussion

4.1. Examination of Soil Moisture Distribution Patterns among Four Microtopography Types

It was observed that the surface soil moisture is highest at the bottom of dunes, whereas the middle and deep soil moisture is highest on the leeward slope. Conversely, the windward slope exhibits the lowest soil moisture content across all depths. Overall, the soil moisture on the leeward slope and at the bottom of dunes is higher than that on the windward slope and at the top of dunes. The distribution of soil moisture in semi-fixed dunes is affected by multiple factors, including topography, wind direction, vegetation cover, and evaporation [21]. The greatest surface soil moisture content was observed at the bottom of the dunes, likely due to the capacity of these areas to capture direct precipitation and runoff from the adjacent highlands. The low-lying terrain extends water retention time, reducing evaporation and runoff loss and thereby facilitating the accumulation and preservation of moisture [60,61]. Additionally, soil biological crusts, composed of microorganisms and plant communities, such as cyanobacteria, fungi, lichens, and mosses, are extensively present on the soil surface of dunes and arid regions. As a moisture-converging area, the bottoms of dunes support the growth and proliferation of these biological crust communities. Furthermore, the lower wind speed at a dune bottom aids in the deposition of fine particles, providing a substrate for the attachment and growth of microorganisms and plants and thereby contributing to the thickening of the crust. The biological soil crust covering the soil surface can reduce direct soil moisture evaporation, and its porous structure further enhances the soil’s water retention capacity [62,63].
The impact of wind on soil moisture is multifaceted, encompassing increased evaporation, altered soil surface structure, and influenced plant transpiration [64]. Middle and deep soil moisture content is highest on the leeward slope, whereas the windward slope exhibits the lowest soil moisture content at all depths, likely due to accelerated evaporation on the windward slope. Additionally, the soil on the windward slope may be looser due to wind and precipitation erosion, which is detrimental to moisture retention. The leeward slope, sheltered from the prevailing wind direction, typically forms a more stable microclimate [28,65,66]. Lower wind speeds reduce surface soil moisture evaporation, while sand particles rapidly settle under gravity [67], creating steeper slopes that enhance moisture retention in the intermediate and deep soil layers. Several studies have suggested that wind-induced drying significantly modulates the dynamics of local phytogeographic compositions. In a restoration study of a Texas landfill, Biederman and Whisenant demonstrated that the number and density of plant species are significantly higher on the leeward side of mounds than on the windward side. Researchers have attributed this to reduced soil moisture evaporation and increased dew deposition on the leeward side, a result of wind sheltering [25]. Similar conclusions have been drawn from studies conducted in the Kuwaiti desert, where higher soil moisture on the leeward slopes of dunes has significantly promoted plant growth [68].
Surface and middle soil moisture fluctuations are more pronounced, whereas deep soil moisture fluctuations are more gradual and stable. This phenomenon may be attributed to surface soil’s direct exposure to the atmosphere, where it is significantly affected by solar radiation, wind speed, and temperature, particularly under arid and high-temperature conditions, resulting in higher evaporation rates. Surface soil is the initial contact point for precipitation and irrigation water, rapidly increasing moisture during these events, and quickly evaporating or infiltrating in their absence [69]. In the study area, vegetation roots are predominantly distributed in the surface and middle soil, where root absorption and transpiration exacerbate soil moisture fluctuations. Middle soil moisture is influenced by both surface infiltration and root absorption. Conversely, the process of moisture infiltration into deep soil is relatively slow and sustained [70,71]. Deep soil layers, located far from the surface, exhibit very low evaporation rates and are minimally affected by root systems. This analysis reveals the soil moisture variation across different depths and microtopographic types, providing a basis for scientific plant cultivation strategies, improved water resource management, and appropriate microtopographic enhancement measures.

4.2. Analysis of the Direct and Indirect Effects of Topography–Vegetation Factors

SEM elucidates specific pathways by which various topography and vegetation variables influence soil moisture levels. Topography exerts a significant negative impact on soil moisture while simultaneously benefiting herbaceous vegetation. Topography likely controls local soil moisture patterns through multiple mechanisms, including direct hydrological impacts and indirect pathways. Numerous studies have confirmed the impact of microtopography on water flow paths, thereby affecting the availability of soil moisture in various habitat areas [72,73,74]. Soil moisture can influence vegetation by regulating community composition and species richness, depending on plant preferences for different soil moisture levels [75,76]. Thus, microtopography plays a crucial role in the establishment of regional plant communities. Furthermore, both herbaceous and shrub vegetation significantly negatively impact soil moisture, suggesting that the role of topography in promoting vegetation growth will further exacerbate soil moisture depletion.

4.3. The Mechanism of Topography–Vegetation Factors Affecting Soil Moisture at Different Depths

Despite the varying order of importance among variables, all models demonstrate that slope direction and herbaceous coverage substantially modulate soil moisture dynamics across different soil depths. Moreover, slope degree and height difference are critical for surface soil moisture, while herbaceous abundance and biomass affect middle soil moisture. Conversely, shrub coverage is essential for deep soil moisture. The topographic factors of slope degree, slope direction, and height difference notably impact surface soil moisture by influencing precipitation, evaporation, runoff, and infiltration processes, thus significantly altering its distribution. Slope degree determines the flow velocity and runoff volume of surface water, slope direction affects the amount of solar radiation received, influencing the evaporation rate of soil moisture, and height difference may impact temperature and precipitation patterns [77,78,79]. Vegetation plays a crucial role in regulating hydrological processes. Ecohydrology studies have elucidated how the spatial patterns of vegetation strongly control the horizontal and vertical gradients of soil moisture and infiltration, the distribution of throughfall and stemflow, as well as transpiration and runoff [80,81,82,83]. The influence of shrub vegetation on deep soil moisture can be attributed to the extensive hydrological effects produced by xerophytic shrubs, such as alterations in water balance, infiltration processes, and dew formation characteristics [84,85].
Topographic influences on soil moisture are evident in the trend of soil moisture to decrease and then increase with a rise in slope direction at various depths. Surface soil moisture exhibits a similar trend with increasing height difference. Variations in slope direction determine the amount and intensity of solar radiation received, wind flow, and the physicochemical properties of the soil [86,87], all of which collectively form a complex soil moisture feedback mechanism. Height difference causes soil moisture in high-altitude areas to undergo lateral flow due to gravity, resulting in rapid loss, while in low-altitude areas, soil moisture converges. The combined effect explains the way in which height difference impacts soil moisture, causing a moisture gradient in the soil profile.
The mechanisms through which vegetation affects soil moisture indicate that soil moisture at different depths declines with rising herbaceous coverage, whereas middle and deep soil moisture first increase and then decrease with growing biomass and shrub coverage. The interplay between root depth and soil moisture fluctuations illustrates the connection between vegetation physiological traits and soil moisture. According to Yang et al. (2012), the growth state of plants can modify the spatial distribution of shallow and deep soil moisture in semi-arid regions [88]. Shallow-rooted plants necessitate higher soil moisture utilization efficiency so as to manage the limited soil moisture supply in arid environments; however, this elevated transpiration rate subsequently accelerates soil moisture depletion [89]. Given that vegetation growth in arid and semi-arid regions depletes both surface and deeper soil moisture, comprehending the vertical distribution and dynamic variations of soil moisture is vital for the development of artificial sand-fixing vegetation. Maintaining an appropriate shrub density exerts a positive feedback effect on soil moisture. Some studies have indicated that patches between tree canopies dry faster than those beneath the canopies [90,91,92]. D’Odorico et al. attribute this phenomenon to the rapid evaporation of soil moisture due to high-intensity solar radiation in the absence of canopy cover [90]. Shrub canopies redistribute precipitation into stemflow and throughfall, with stemflow concentrating precipitation around plant roots, thus aiding the maintenance of regional soil moisture balance [93,94]. The decomposition of plant roots and leaf litter augments organic matter in the soil, thereby enhancing its water retention capacity [95]. In summary, vegetation regulates the microclimate, thus improving local soil moisture and playing a crucial role in promoting ecosystem sustainability [96,97]. However, in arid environments where precipitation is insufficient to sustain long-term vegetation growth, excessive vegetation density exacerbates soil moisture depletion [98]. Comprehending the mechanisms of interaction between topography, vegetation, and soil moisture aids in devising effective desertification prevention strategies.

4.4. Factors Influencing Soil Moisture Dynamics in Desert Ecosystems and the Potential Effects of Climate Change

In this study, we explored the effects of topography and vegetation factors on soil moisture in the Tengger Desert. Comparing these relationships with other desert ecosystems may enhance our understanding of them. A study on the Sahara Desert indicates that soil moisture in this region is significantly influenced by precipitation and topography. Variations in precipitation directly affect the distribution of soil moisture, whereas topographical features, such as dunes and low-lying areas, influence the accumulation and evaporation rates of moisture [99]. Conversely, soil moisture in the Tengger Desert is predominantly influenced by vegetation type and coverage, which may be attributed to the relatively high diversity of vegetation in this area. In contrast, research in the Sonoran Desert of Mexico reveals that soil moisture is strongly affected by monsoonal influences and vegetation types, with seasonal precipitation having a more pronounced effect on moisture levels [100]. Furthermore, in the Simpson Desert of Australia, the recovery rate and retention capacity of soil moisture are closely linked to precipitation, soil characteristics, and vegetation types [101]. These findings suggest that, while moisture dynamics are primarily influenced by topographical and vegetation factors, the interplay of precipitation patterns and soil properties also plays a critical role in determining moisture distribution within desert ecosystems.
The potential impacts of climate change on soil moisture dynamics in desert ecosystems have received increasing attention. With the rise in global temperatures and alterations in precipitation patterns, desert regions may face more extreme climatic conditions [102,103]. For instance, climate change may modify the frequency and intensity of precipitation events, thereby affecting the replenishment and evaporation processes of soil moisture [104]. In the Tengger Desert, climate change could render precipitation more erratic, subsequently affecting vegetation growth and the soil’s moisture retention capacity. Furthermore, rising temperatures may accelerate evaporation rates, exacerbating the loss of soil moisture. Therefore, understanding the potential impacts of climate change on soil moisture dynamics is crucial for formulating adaptive management strategies to address future ecological changes.

5. Conclusions

This study aimed to investigate the factors influencing soil moisture dynamics in the Tengger Desert, focusing on the analysis of microtopographic types and topographic–vegetative influences. The results indicate significant differences in soil moisture distribution patterns across four microtopographic types—windward slope, leeward slope, dune bottoms, and dune tops. Specifically, surface soil moisture is highest at dune bottoms (1.21%), while middle and deep soil moisture levels peak on leeward slopes (2.25% and 2.43%, respectively); windward slopes exhibit the lowest soil moisture across various depths (0.33%, 0.86% and 1.09% in surface, middle and deep layers). Overall, leeward slopes and dune bottoms retain higher moisture levels than windward slopes and dune tops, with surface and middle soil moisture showing greater fluctuations, while deep soil moisture remains relatively stable. Furthermore, the direct negative impact of topography on soil moisture and its positive influence on herbaceous vegetation suggest that topography supports herbaceous growth, which in turn affects soil moisture levels. The significant negative impacts of both herbaceous and shrub vegetation on soil moisture were also confirmed. A systematic evaluation and ranking of influential factors revealed that slope direction and herbaceous coverage are critical determinants of soil moisture. Slope degree and height difference significantly affect surface soil moisture, whereas herbaceous abundance and biomass predominantly influence middle soil moisture, and shrub coverage plays a key role in deep soil moisture. Soil moisture at different depths initially decreases and then increases with rising slope direction, a pattern mirrored by surface soil moisture as height difference increases. Additionally, as herbaceous coverage increases, soil moisture at various depths tends to decline, while middle and deep soil moisture levels exhibit an initial increase followed by a decrease with rising biomass and shrub coverage, respectively. These findings provide important insights into understanding soil moisture dynamics in the Tengger Desert.
The findings provide valuable insight into the development of vegetation management strategies for semi-fixed dunes. To mitigate the adverse effects of wind erosion, it is advisable to deploy denser grass grids and sand barriers in vulnerable areas. Considering the fluctuations in soil moisture at various depths, establishing a multi-layered vegetation structure can significantly enhance the overall drought resistance of the vegetation. Furthermore, appropriate pruning and thinning are essential to avoid excessive vegetation volume and density, which can otherwise lead to substantial soil moisture depletion. Despite the comprehensive analysis in the semi-fixed dunes of the Tengger Desert, the applicability of findings to other desert ecosystems remains uncertain. By integrating hydrological processes with plant physiological processes, future studies can establish a more robust connection between ecological and hydrological processes in arid and semi-arid ecosystems. This integration will provide a firmer theoretical foundation for future ecological conservation practices.

Author Contributions

H.Q.: writing—review and editing, writing–original draft, methodology, data curation, conceptualization. D.Z.: writing—review and editing, project administration, funding acquisition, conceptualization. Z.Z.: investigation, conceptualization, formal analysis. Y.Z.: formal analysis. Z.S.: investigation, formal analysis. All authors have read and agreed to the published version of the manuscript.

Funding

This research was funded by the National Natural Science Foundation of China (No. 42361016), the Gansu Science and Technology Program, the CAS ‘Light of West China’ Program (No. 22JR9KA032) and the Gansu Natural Science Foundation (No. 21JR7RA831).

Institutional Review Board Statement

Not applicable.

Informed Consent Statement

Not applicable.

Data Availability Statement

The original contributions presented in the study are included in the article’s data. Further inquiries can be directed to the corresponding author and will be available upon reasonable request.

Acknowledgments

We would like to extend our sincere appreciation to the editors and anonymous reviewers for their invaluable feedback on the draft of this manuscript.

Conflicts of Interest

The authors declare that they have no known competing financial interests or personal relationships that could have appeared to influence the work reported in this paper.

References

  1. Feng, Q.; Ma, H.; Jiang, X.; Wang, X.; Cao, S. What has caused desertification in China? Sci. Rep. 2015, 5, 15998. [Google Scholar] [CrossRef] [PubMed]
  2. Wang, S.; Chen, J. Characteristics of precipitation and desertification in arid and semi–arid regions of China. Environ. Sci. Pollut. Res. 2021, 28, 19800–19810. [Google Scholar]
  3. Zhao, H.; Jiang, H. Dynamics of fixed and semi-fixed dunes in response to vegetation cover and aeolian processes. Geomorphology 2019, 333, 27–38. [Google Scholar]
  4. Rasheed, M.W.; Tang, J.; Sarwar, A.; Shah, S.; Saddique, N.; Khan, M.U.; Khan, M.I.; Nawaz, S.; Shamshiri, R.R.; Aziz, M.; et al. Soil moisture measuring techniques and factors affecting the moisture dynamics: A comprehensive review. Sustainability 2022, 14, 11538. [Google Scholar] [CrossRef]
  5. Bar Kutiel, P.; Dorman, M. The importance of annual plants and multi–scalar analysis for understanding Coastal Dune stabilization process in the Mediterranean. Appl. Sci. 2021, 11, 2821. [Google Scholar] [CrossRef]
  6. Zhou, W.; Li, C.; Wang, S.; Ren, Z.; Stringer, L.C. Effects of vegetation restoration on soil properties and vegetation attributes in the arid and semi–arid regions of China. J. Environ. Manag. 2023, 343, 118186. [Google Scholar] [CrossRef]
  7. Guo, X.; Fu, Q.; Hang, Y.; Lu, H.; Gao, F.; Si, J. Spatial variability of soil moisture in relation to land use types and topographic features on hillslopes in the black soil (mollisols) area of northeast China. Sustainability 2020, 12, 3552. [Google Scholar] [CrossRef]
  8. Svoray, T.; Karnieli, A. Rainfall, topography and primary production relationships in a semiarid ecosystem. Ecohydrology 2011, 4, 56–66. [Google Scholar] [CrossRef]
  9. Pockman, W.T.; Small, E. The influence of spatial patterns of soil moisture on the grass and shrub responses to a summer rainstorm in a Chihuahuan Desert ecotone. Ecosystems 2010, 13, 511–525. [Google Scholar] [CrossRef]
  10. Liu, C.; Wang, F.G.; Xue, Q.; Li, L.; Wang, Z. Pattern formation of a spatial vegetation system with root hydrotropism. Appl. Math. Comput. 2022, 420, 126913. [Google Scholar] [CrossRef]
  11. Zhang, G.; Biradar, C.M.; Xiao, X.; Dong, J.; Zhou, Y.; Qin, Y.; Zhang, Y.; Liu, F.; Ding, M.; Thomas, R.J. Exacerbated grassland degradation and desertification in Central Asia during 2000–2014. Ecol. Appl. 2018, 28, 442–456. [Google Scholar] [CrossRef] [PubMed]
  12. Holdo, R.M.; Nippert, J.B. Linking resource-and disturbance-based models to explain tree–grass coexistence in savannas. New Phytol. 2023, 237, 1966–1979. [Google Scholar] [CrossRef] [PubMed]
  13. Demir, G.; Michalzik, B.; Filipzik, J.; Metzger, J.C.; Hildebrandt, A. Spatial variation of grassland canopy affects soil wetting patterns and preferential flow. Hydrol. Process. 2022, 36, e14760. [Google Scholar] [CrossRef]
  14. Cai, G.; Vanderborght, J.; Couvreur, V.; Mboh, C.M.; Vereecken, H. Parameterization of root water uptake models considering dynamic root distributions and water uptake compensation. Vadose Zone J. 2018, 17, 1–21. [Google Scholar] [CrossRef]
  15. Butz, P.; Hölscher, D.; Cueva, E.; Graefe, S. Tree water use patterns as influenced by phenology in a dry forest of Southern Ecuador. Front. Plant Sci. 2018, 9, 945. [Google Scholar] [CrossRef] [PubMed]
  16. Lamoureux, S.C.; Poot, P.; Veneklaas, E.J. Shallow soils negatively affect water relations and photosynthesis in two semi–arid Eucalyptus species. Environ. Exp. Bot. 2018, 155, 239–250. [Google Scholar] [CrossRef]
  17. Özkan, U.; Gökbulak, F. Effect of vegetation change from forest to herbaceous vegetation cover on soil moisture and temperature regimes and soil water chemistry. Catena 2017, 149, 158–166. [Google Scholar] [CrossRef]
  18. Wang, X.P.; Zhang, Y.F.; Wang, Z.N.; Pan, Y.X.; Hu, R.; Li, X.J.; Zhang, H. Influence of shrub canopy morphology and rainfall characteristics on stemflow within a revegetated sand dune in the Tengger Desert, NW China. Hydrol. Process. 2013, 27, 1501–1509. [Google Scholar] [CrossRef]
  19. Guderle, M.; Bachmann, D.; Milcu, A.; Gockele, A.; Bechmann, M.; Fischer, C.; Roscher, C.; Landais, D.; Ravel, O.; Devidal, S.; et al. Dynamic niche partitioning in root water uptake facilitates efficient water use in more diverse grassland plant communities. Funct. Ecol. 2018, 32, 214–227. [Google Scholar] [CrossRef]
  20. Laughlin, D.C.; Mommer, L.; Sabatini, F.M.; Bruelheide, H.; Kuyper, T.W.; McCormack, M.L.; Bergmann, J.; Freschet, G.T.; Guerrero-Ramírez, N.R.; Iversen, C.M.; et al. Root traits explain plant species distributions along climatic gradients yet challenge the nature of ecological trade–offs. Nat. Ecol. Evol. 2021, 5, 1123–1134. [Google Scholar] [CrossRef]
  21. Moeslund, J.E.; Arge, L.; Bøcher, P.K.; Dalgaard, T.; Svenning, J.C. Topography as a driver of local terrestrial vascular plant diversity patterns. Nord. J. Bot. 2013, 31, 129–144. [Google Scholar] [CrossRef]
  22. Schaefer, M.L.; Bogacki, W.; Lopez Caceres, M.L.; Kirschbauer, L.; Kato, C.; Kikuchi, S.I. Influence of Slope aspect and vegetation on the soil moisture response to snowmelt in the German Alps. Hydrology 2024, 11, 101. [Google Scholar] [CrossRef]
  23. Caviedes-Voullième, D.; Ahmadinia, E.; Hinz, C. Interactions of microtopography, slope and infiltration cause complex rainfall-runoff behavior at the hillslope scale for single rainfall events. Water Resour. Res. 2021, 57, e2020WR028127. [Google Scholar] [CrossRef]
  24. Yang, J.; El-Kassaby, Y.A.; Guan, W. The effect of slope aspect on vegetation attributes in a mountainous dry valley, Southwest China. Sci. Rep. 2020, 10, 16465. [Google Scholar] [CrossRef] [PubMed]
  25. Biederman, L.A.; Whisenant, S.G. Using mounds to create microtopography alters plant community development early in restoration. Restor. Ecol. 2011, 19, 53–61. [Google Scholar] [CrossRef]
  26. Brocca, L.; Ciabatta, L.; Massari, C.; Camici, S.; Tarpanelli, A. Soil moisture for hydrological applications: Open questions and new opportunities. Water 2017, 9, 140. [Google Scholar] [CrossRef]
  27. Liu, Y.; Cui, Z.; Huang, Z.; López-Vicente, M.; Wu, G.-L. Influence of soil moisture and plant roots on the soil infiltration capacity at different stages in arid grasslands of China. Catena 2019, 182, 104147. [Google Scholar] [CrossRef]
  28. Srivastava, A.; Saco, P.M.; Rodriguez, J.F.; Kumari, N.; Chun, K.P.; Yetemen, O. The role of landscape morphology on soil moisture variability in semi-arid ecosystems. Hydrol. Process. 2021, 35, e13990. [Google Scholar] [CrossRef]
  29. Caracciolo, D.; Istanbulluoglu, E.; Noto, L.V.; Collins, S.L. Mechanisms of shrub encroachment into northern Chihuahuan Desert grasslands and impacts of climate change investigated using a cellular automata model. Adv. Water Resour. 2016, 91, 46–62. [Google Scholar] [CrossRef]
  30. Lawrence, J.E.; Hornberger, G.M. Soil moisture variability across climate zones. Geophys. Res. Lett. 2007, 34, 5. [Google Scholar] [CrossRef]
  31. Teuling, A.J.; Troch, P.A. Improved understanding of soil moisture variability dynamics. Geophys. Res. Lett. 2005, 32, L05404. [Google Scholar] [CrossRef]
  32. Jiang, L.M.; Sattar, K.; Lü, G.H.; Hu, D.; Zhang, J.; Yang, X.D. Different contributions of plant diversity and soil properties to the community stability in the arid desert ecosystem. Front. Plant Sci. 2022, 13, 969852. [Google Scholar] [CrossRef]
  33. Christin, S.; Hervet, É.; Lecomte, N. Applications for deep learning in ecology. Methods Ecol. Evol. 2019, 10, 1632–1644. [Google Scholar] [CrossRef]
  34. Olden, J.D.; Lawler, J.J.; Poff, N.L. Machine learning methods without tears: A primer for ecologists. Q. Rev. Biol. 2008, 83, 171–193. [Google Scholar] [CrossRef] [PubMed]
  35. Karpatne, A.; Ebert-Uphoff, I.; Ravela, S.; Babaie, H.A.; Kumar, V. Machine learning for the geosciences: Challenges and opportunities. IEEE Trans. Knowl. Data Eng. 2018, 31, 1544–1554. [Google Scholar] [CrossRef]
  36. Ryo, M.; Angelov, B.; Mammola, S.; Kass, J.M.; Benito, B.M.; Hartig, F. Explainable artificial intelligence enhances the ecological interpretability of black-box species distribution models. Ecography 2021, 44, 199–205. [Google Scholar] [CrossRef]
  37. Lundberg, S.M.; Lee, S.I. A Unified Approach to Interpreting Model Predictions. In Proceedings of the 31st International Conference on Neural Information Processing Systems, Long Beach, CA, USA, 4 December 2017; Volume 30. [Google Scholar]
  38. Zhang, S.; Wang, H.; Zhang, D.; Wu, X. Relationship between soil moisture and topography–vegetation factors on three types of sand dunes and four types of microgeomorphology in the southeastern margin of Tengger Desert in northern China. J. Gansu Agric. Univ. 2023, 58, 160–168+179. [Google Scholar]
  39. Li, X.; Zhang, Z.; Tan, H.; Gao, H.; Liu, L.; Wang, X. Ecological restoration and recovery in the wind–blown sand hazard areas of northern China: Relationship between soil water and carrying capacity for vegetation in the Tengger Desert. Sci. China Life Sci. 2014, 44, 257–266. [Google Scholar] [CrossRef]
  40. Sun, Y.; Zhang, D.; Zhang, Z. Relationship between soil moisture content and topography–vegetation factors in different types of dunes in the Tengger Desert. Arid Land Geogr. 2022, 45, 1570–1578. [Google Scholar]
  41. Liu, L.; Bai, Y.; She, W.; Qiao, Y.; Qin, S.; Zhang, Y. A nurse shrub species helps associated herbaceous plants by preventing shade–induced evaporation in a desert ecosystem. Land Degrad. Dev. 2021, 32, 1796–1808. [Google Scholar] [CrossRef]
  42. Liu, R.; Li, Y.; Wang, Y.; Ma, J.; Cieraad, E. Variation of water use efficiency across seasons and years: Different role of herbaceous plants in desert ecosystem. Sci. Total Environ. 2019, 647, 827–835. [Google Scholar] [CrossRef] [PubMed]
  43. Zhang, Z.; Li, X.; Liu, L.; Jia, R.; Zhang, J.; Wang, T. Distribution, biomass, and dynamics of roots in a revegetated stand of Caragana korshinskii in the Tengger Desert, northwestern China. J. Plant Res. 2009, 122, 109–119. [Google Scholar] [CrossRef] [PubMed]
  44. Fijałkowska, A. Analysis of the influence of DTM source data on the LS factors of the soil water erosion model values with the use of GIS technology. Remote Sens. 2021, 13, 678. [Google Scholar] [CrossRef]
  45. Hair, J.F., Jr.; Hult, G.T.; Ringle, C.M.; Sarstedt, M.; Danks, N.P.; Ray, S. Partial Least Squares Structural Equation Modeling (PLS–SEM) Using R: A Workbook; Springer: Cham, Switzerland, 2021; ISBN 978-3-030-80518-0. [Google Scholar]
  46. Hair, J.F., Jr.; Matthews, L.M.; Matthews, R.L.; Sarstedt, M. PLS–SEM or CB–SEM: Updated guidelines on which method to use. Int. J. Multivar. Data Anal. 2017, 1, 107–123. [Google Scholar] [CrossRef]
  47. Breiman, L. Random forests. Mach. Learn. 2001, 45, 5–32. [Google Scholar] [CrossRef]
  48. Boulesteix, A.L.; Janitza, S.; Kruppa, J.; König, I.R. Overview of random forest methodology and practical guidance with emphasis on computational biology and bioinformatics. Wiley Interdiscip. Rev. Data Min. Knowl. Discov. 2012, 2, 493–507. [Google Scholar] [CrossRef]
  49. Iban, M.C.; Bilgilioglu, S.S. Snow avalanche susceptibility mapping using novel tree–based machine learning algorithms (XGBoost, NGBoost, and LightGBM) with eXplainable Artificial Intelligence (XAI) approach. Stoch. Environ. Res. Risk Assess. 2023, 37, 2243–2270. [Google Scholar] [CrossRef]
  50. Gupta, A.; Gowda, S.; Tiwari, A.; Gupta, A.K. XGBoost–SHAP framework for asphalt pavement condition evaluation. Constr. Build. Mater. 2024, 426, 136182. [Google Scholar] [CrossRef]
  51. Genuer, R.; Poggi, J.M.; Tuleau-Malot, C. Variable selection using random forests. Pattern Recognit. Lett. 2010, 31, 2225–2236. [Google Scholar] [CrossRef]
  52. Altman, N.; Krzywinski, M. Ensemble methods: Bagging and random forests. Nat. Methods 2017, 14, 933–935. [Google Scholar] [CrossRef]
  53. Kotsiantis, S.B.; Pintelas, P.E. Combining bagging and boosting. Int. J. Math. Comput. Sci. 2007, 1, 372–381. [Google Scholar]
  54. González, S.; García, S.; Del Ser, J.; Rokach, L.; Herrera, F. A practical tutorial on bagging and boosting based ensembles for machine learning: Algorithms, software tools, performance study, practical perspectives and opportunities. Inf. Fusion 2020, 64, 205–237. [Google Scholar] [CrossRef]
  55. Rudin, C. Stop explaining black box machine learning models for high stakes decisions and use interpretable models instead. Nat. Mach. Intell. 2019, 1, 206–215. [Google Scholar] [CrossRef]
  56. Tavakol, M.; Dennick, R. Making sense of Cronbach’s alpha. Int. J. Med. Educ. 2011, 2, 53. [Google Scholar] [CrossRef] [PubMed]
  57. Mehmetoglu, M. Partial Least Squares Approach to Structural Equation Modeling for Tourism Research. In Advances in Hospitality and Leisure; Chen, J.S., Ed.; Emerald Group Publishing Limited: Leeds, UK, 2012; Volume 8, pp. 43–61. ISBN 978-1-78052-936-3. [Google Scholar]
  58. Dijkstra, T.K.; Henseler, J. Linear indices in nonlinear structural equation models: Best fitting proper indices and other composites. Qual. Quant. 2011, 45, 1505–1518. [Google Scholar] [CrossRef]
  59. Wetzels, M.; Odekerken-Schröder, G.; Van Oppen, C. Using PLS path modeling for assessing hierarchical construct models: Guidelines and empirical illustration. MIS Q. 2009, 33, 177–195. [Google Scholar] [CrossRef]
  60. Zipper, S.C.; Soylu, M.E.; Booth, E.G.; Loheide, S.P. Untangling the effects of shallow groundwater and soil texture as drivers of subfield-scale yield variability. Water Resour. Res. 2015, 51, 6338–6358. [Google Scholar] [CrossRef]
  61. Li, X.; Zhang, Z.; Huang, L.; Wang, X. Review of the ecohydrological processes and feedback mechanisms controlling sand–binding vegetation systems in sandy desert regions of China. Chin. Sci. Bull. 2013, 58, 397–410. [Google Scholar] [CrossRef]
  62. Song, G.; Li, X.; Hui, R. Biological soil crusts increase stability and invasion resistance of desert revegetation communities in northern China. Ecosphere 2020, 11, e03043. [Google Scholar] [CrossRef]
  63. Chamizo, S.; Canton, Y.; Lázaro, R.; Domingo, F. The role of biological soil crusts in soil moisture dynamics in two semiarid ecosystems with contrasting soil textures. J. Hydrol. 2013, 489, 74–84. [Google Scholar] [CrossRef]
  64. Meng, Z.; Dang, X.; Gao, Y.; Ren, X.; Ding, Y.; Wang, M. Interactive effects of wind speed, vegetation coverage and soil moisture in controlling wind erosion in a temperate desert steppe, Inner Mongolia of China. J. Arid Land 2018, 10, 534–547. [Google Scholar] [CrossRef]
  65. John, A.; Olden, J.D.; Oldfather, M.F.; Kling, M.M.; Ackerly, D.D. Topography influences diurnal and seasonal microclimate fluctuations in hilly terrain environments of coastal California. PLoS ONE 2024, 19, e0300378. [Google Scholar] [CrossRef] [PubMed]
  66. Singh, S. Understanding the role of slope aspect in shaping the vegetation attributes and soil properties in Montane ecosystems. Trop. Ecol. 2018, 59, 417–430. [Google Scholar]
  67. Wunsch, M.; Betzler, C.; Eberli, G.P.; Lindhorst, S.; Lüdmann, T.; Reijmer, J.J. Sedimentary dynamics and high–frequency sequence stratigraphy of the southwestern slope of Great Bahama Bank. Sediment. Geol. 2018, 363, 96–117. [Google Scholar] [CrossRef]
  68. Brown, G.; Porembski, S. The maintenance of species diversity by miniature dunes in a sand–depleted Haloxylon salicornicum community in Kuwait. J. Arid Environ. 1997, 37, 461–473. [Google Scholar] [CrossRef]
  69. Gong, X.; Zhang, H.; Ren, C.; Sun, D.; Yang, J. Optimization allocation of irrigation water resources based on crop water requirement under considering effective precipitation and uncertainty. Agric. Water Manag. 2020, 239, 106264. [Google Scholar] [CrossRef]
  70. Liu, X.; Lu, K.; Li, P.; Xu, G.; Cheng, S.; Bai, L.; Wei, F. Research and simulation of soil water infiltration on slope under different rain–fall conditions. J. Arid Land Resour. Environ. 2018, 32, 114–118. [Google Scholar]
  71. Cheng, L.; Liu, W.; Li, Z. Soil water in deep layers under different land use patterns on the Loess Tableland. Acta Ecol. Sin. 2014, 34, 1975–1983. [Google Scholar]
  72. Zheng, L.; Wang, X.; Li, D.; Xu, G.; Guo, Y. Spatial heterogeneity of vegetation extent and the response to water level fluctuations and micro–topography in Poyang Lake, China. Ecol. Indic. 2021, 124, 107420. [Google Scholar] [CrossRef]
  73. Liu, Y.; Du, J.; Xu, X.; Kardol, P.; Hu, D. Microtopography–induced ecohydrological effects alter plant community structure. Geoderma 2020, 362, 114119. [Google Scholar] [CrossRef]
  74. Mata-González, R.; Averett, J.P.; Abdallah, M.A.; Martin, D.W. Variations in groundwater level and microtopography influence desert plant communities in shallow aquifer areas. Environ. Manag. 2022, 69, 45–60. [Google Scholar] [CrossRef] [PubMed]
  75. De Falco, N.; Tal-Berger, R.; Hjazin, A.; Yizhaq, H.; Stavi, I.; Rachmilevitch, S. Geodiversity impacts plant community structure in a semi–arid region. Sci. Rep. 2021, 11, 15259. [Google Scholar] [CrossRef] [PubMed]
  76. Wu, C.; Deng, L.; Huang, C.; Chen, Y.; Peng, C. Effects of vegetation restoration on soil nutrients, plant diversity, and its spatiotemporal heterogeneity in a desert–oasis ecotone. Land Degrad. Dev. 2021, 32, 670–683. [Google Scholar] [CrossRef]
  77. Fan, B.; Tao, W.; Qin, G.; Hopkins, I.; Zhang, Y.; Wang, Q.; Lin, H.; Guo, L. Soil micro–climate variation in relation to slope aspect, position, and curvature in a forested catchment. Agric. For. Meteorol. 2020, 290, 107999. [Google Scholar] [CrossRef]
  78. Rita, A.; Bonanomi, G.; Allevato, E.; Borghetti, M.; Cesarano, G.; Mogavero, V.; Rossi, S.; Saulino, L.; Zotti, M.; Saracino, A. Topography modulates near–ground microclimate in the Mediterranean Fagus sylvatica treeline. Sci. Rep. 2021, 11, 8122. [Google Scholar] [CrossRef]
  79. Zhou, X.; Ke, T.; Li, S.; Deng, S.; An, X.; Ma, X.; De Philippis, R.; Chen, L. Induced biological soil crusts and soil properties varied between slope aspect, slope gradient and plant canopy in the Hobq desert of China. Catena 2020, 190, 104559. [Google Scholar] [CrossRef]
  80. Ramos, M.B.; Diniz, F.C.; de Almeida, H.A.; de Almeida, G.R.; Pinto, A.S.; Meave, J.A.; Lopes, S.D. The role of edaphic factors on plant species richness and diversity along altitudinal gradients in the Brazilian semi–arid region. J. Trop. Ecol. 2020, 36, 199–212. [Google Scholar] [CrossRef]
  81. Geng, Q.; Arif, M.; Yuan, Z.; Zheng, J.; He, X.; Ding, D.; Yin, F.; Li, C. Plant species composition and diversity along successional gradients in arid and semi–arid regions of China. For. Ecol. Manag. 2022, 524, 120542. [Google Scholar]
  82. Zhao, L.; Fang, Q.; Yang, Y.; Yang, H.; Yang, T.; Zheng, H. Stemflow contributions to soil erosion around the stem base under simulated maize–planted and rainfall conditions. Agric. For. Meteorol. 2020, 281, 107814. [Google Scholar] [CrossRef]
  83. Peters, R.; Walther, M.; Lovelock, C.; Jiang, J.; Berger, U. The interplay between vegetation and water in mangroves: New perspectives for mangrove stand modelling and ecological research. Wetl. Ecol. Manag. 2020, 28, 697–712. [Google Scholar] [CrossRef]
  84. Li, B.B.; Li, P.P.; Zhang, W.T.; Ji, J.Y.; Liu, G.B.; Xu, M.X. Deep soil moisture limits the sustainable vegetation restoration in arid and semi–arid Loess Plateau. Geoderma 2021, 399, 115122. [Google Scholar] [CrossRef]
  85. Na, L.; Na, R.; Bao, Y.; Zhang, J. Time–lagged correlation between soil moisture and intra–annual dynamics of vegetation on the Mongolian plateau. Remote Sens. 2021, 13, 1527. [Google Scholar] [CrossRef]
  86. Najafifar, A.; Hosseinzadeh, J.; Karamshahi, A. The role of hillshade, aspect, and toposhape in the woodland dieback of arid and semi–arid ecosystems: A case study in Zagros woodlands of Ilam province, Iran. J. Landsc. Ecol. 2019, 12, 79–91. [Google Scholar] [CrossRef]
  87. Jakšić, S.; Ninkov, J.; Milić, S.; Vasin, J.; Živanov, M.; Jakšić, D.; Komlen, V. Influence of slope gradient and aspect on soil organic carbon content in the region of Niš, Serbia. Sustainability 2021, 13, 8332. [Google Scholar] [CrossRef]
  88. Yang, L.; Wei, W.; Chen, L.; Jia, F.; Mo, B. Spatial variations of shallow and deep soil moisture in the semi–arid Loess Plateau, China. Hydrol. Earth Syst. Sci. 2012, 16, 3199–3217. [Google Scholar] [CrossRef]
  89. Thomas, A.; Yadav, B.K.; Šimůnek, J. Root water uptake under heterogeneous soil moisture conditions: An experimental study for unraveling compensatory root water uptake and hydraulic redistribution. Plant Soil 2020, 457, 421–435. [Google Scholar] [CrossRef]
  90. D’Odorico, P.; Caylor, K.; Okin, G.S.; Scanlon, T.M. On soil moisture–vegetation feedbacks and their possible effects on the dynamics of dryland ecosystems. J. Geophys. Res. Biogeosci. 2007, 112, G04010. [Google Scholar] [CrossRef]
  91. Cheng, M.; Jiao, X.; Liu, Y.; Shao, M.; Yu, X.; Bai, Y.; Wang, Z.; Wang, S.; Tuohuti, N.; Liu, S.; et al. Estimation of soil moisture content under high maize canopy coverage from UAV multimodal data and machine learning. Agric. Water Manag. 2022, 264, 107530. [Google Scholar] [CrossRef]
  92. Cheng, R.R.; Chen, Q.W.; Zhang, J.G.; Shi, W.Y.; Li, G.; Du, S. Soil moisture variations in response to precipitation in different vegetation types: A multi-year study in the loess hilly region in China. Ecohydrology 2020, 13, e2196. [Google Scholar] [CrossRef]
  93. Chen, N.; Zhang, Y.; Zhao, C. On the importance of stemflow to the woody plants in drylands: Individual vs. ecosystem scales. J. Hydrol. 2021, 601, 126591. [Google Scholar] [CrossRef]
  94. Yue, K.; De Frenne, P.; Fornara, D.A.; Van Meerbeek, K.; Li, W.; Peng, X.; Ni, X.; Peng, Y.; Wu, F.; Yang, Y.; et al. Global patterns and drivers of rainfall partitioning by trees and shrubs. Glob. Chang. Biol. 2021, 27, 3350–3357. [Google Scholar] [CrossRef] [PubMed]
  95. Ankenbauer, K.J.; Loheide, S.P. The effects of soil organic matter on soil water retention and plant water use in a meadow of the Sierra Nevada, CA. Hydrol. Process. 2017, 31, 891–901. [Google Scholar] [CrossRef]
  96. D’odorico, P.; He, Y.; Collins, S.; De Wekker, S.F.; Engel, V.; Fuentes, J.D. Vegetation–microclimate feedbacks in woodland–grassland ecotones. Glob. Ecol. Biogeogr. 2013, 22, 364–379. [Google Scholar] [CrossRef]
  97. Jaroszynska, F.; Althuizen, I.; Halbritter, A.H.; Klanderud, K.; Lee, H.; Telford, R.J.; Vandvik, V. Bryophytes dominate plant regulation of soil microclimate in alpine grasslands. Oikos 2023, 12, e10091. [Google Scholar] [CrossRef]
  98. Sharma, S.; Carlson, J.D.; Krueger, E.S.; Engle, D.M.; Twidwell, D.; Fuhlendorf, S.D.; Patrignani, A.; Feng, L.; Ochsner, T.E. Soil moisture as an indicator of growing–season herbaceous fuel moisture and curing rate in grasslands. Int. J. Wildland Fire 2020, 30, 57–69. [Google Scholar] [CrossRef]
  99. Kim, Y.; Eltahir, E.A. Role of topography in facilitating coexistence of trees and grasses within savannas. Water Resour. Res. 2004, 40, W07505. [Google Scholar] [CrossRef]
  100. Rodríguez-Moreno, V.M.; Bullock, S.H. Vegetation response to rainfall pulses in the Sonoran Desert as modelled through remotely sensed imageries. Int. J. Climatol. 2014, 34, 3967–3976. [Google Scholar] [CrossRef]
  101. Nano, C.E.; Pavey, C.R. Refining the ‘pulse-reserve’model for arid central A ustralia: Seasonal rainfall, soil moisture and plant productivity in sand ridge and stony plain habitats of the Simpson Desert. Austral Ecol. 2013, 38, 741–753. [Google Scholar] [CrossRef]
  102. Hassan, W.H. Climate change impact on groundwater recharge of Ummer Radhuma unconfined aquifer Western Desert, Iraq. Int. J. Hydrol. Sci. Technol. 2020, 10, 392–412. [Google Scholar] [CrossRef]
  103. Stringer, L.C.; Mirzabaev, A.; Benjaminsen, T.A.; Harris, R.M.; Jafari, M.; Lissner, T.K.; Stevens, N.; Der Pahlen, C.T.-V. Climate change impacts on water security in global drylands. One Earth 2021, 4, 851–864. [Google Scholar] [CrossRef]
  104. Zuo, X.; Cheng, H.; Zhao, S.; Yue, P.; Liu, X.; Wang, S.; Liu, L.; Xu, C.; Luo, W.; Knops, J.M.; et al. Observational and experimental evidence for the effect of altered precipitation on desert and steppe communities. Glob. Ecol. Conserv. 2020, 21, e00864. [Google Scholar] [CrossRef]
Figure 1. Diagram of the semi-fixed dune plot. Blue dots represent the quadrat vertices, while red diamonds indicate soil moisture sampling points. The plot encompasses four microtopographic types: windward slope, leeward slope, the bottom of dunes, and the top of dunes. The figure illustrates the boundaries of the sampling plots using lines of various colors. Various colors are employed to differentiate between the distinct rows and columns within the plots.
Sustainability 16 06971 g001
Figure 2. Positioning of plants.
Sustainability 16 06971 g002
Figure 3. The patterns of soil moisture distribution at windward slopes, leeward slopes, the bottom of dunes, and the top of dunes across surface layer (a), middle layer (b), and deep layer (c). The scatter plots and half violin plots, depicted in deep blue, yellow-green, gray, and light blue, respectively, illustrate the distribution of soil moisture across the leeward slope, the bottom of dunes, the top of dunes, and windward slope.
Sustainability 16 06971 g003
Figure 4. The channels by which topography–vegetation factors affect soil moisture. Yellow rectangles represent observed variables obtained through experiments, while blue ellipses denote latent variables set in the model. Solid arrows indicate variables that positively feedback on soil moisture, while dashed arrows indicate variables that negatively affect soil moisture. The symbol ‘*’indicates a significance level of p < 0.05, ‘**’ indicates p < 0.01, and “***” indicates p < 0.001.
Sustainability 16 06971 g004
Figure 5. Based on random forest and extreme gradient boosting, the SHAP model ranks the importance of terrain–vegetation factors in surface (a,d), middle (b,e), and deep layers (c,f). Positive SHAP values indicate beneficial impacts on soil moisture, whereas negative values suggest adverse effects. The color of the points reflects the magnitude of each factor’s values, ranging from blue to red, indicating low to high factor values.
Sustainability 16 06971 g005
Figure 6. The importance of topography–vegetation factors on surface (a), middle (b), and deep layer (c) soil moisture using random forest models.
Sustainability 16 06971 g006
Figure 7. Relationship between the values of topography–vegetation factors and SHAP values of their impact in the surface (a), middle (b), and deep layers (c). The horizontal axis represents the values of the factors. The left vertical axis indicates the SHAP values of the factors. The right vertical axis shows the values of the factor with the greatest interaction effect. The color of the points, ranging from blue to red, indicates the values of the factor with the highest interaction effect, from low to high.
Sustainability 16 06971 g007
Figure 8. The effects of topographic and vegetative factors on the surface soil moisture at the windward slope (a), the bottom of dunes (b), leeward slope (c), and the top of dunes (d) in a single sample. Red indicates a positive impact of the factor on soil moisture, while blue indicates a negative impact. E[f(X)] represents the predicted value of soil moisture by the model without considering any factors, while f(X) represents the predicted value considering all factors.
Sustainability 16 06971 g008
Table 1. Category and units of topography–vegetation factors.
CategoryFactorsUnits
Topographic factorsSlope degreerad
Slope directionrad
Height differencem
Shrub factorsShrub coverage%
Shrub abundance%
Litterfallg
Herbaceous factorsHerbaceous coverage%
Herbaceous abundance%
Biomassg
Soil moistureSurface layer%
Middle layer%
Deep layer%
Table 2. Mean content and coefficient of variation of soil moisture at the surface, middle, and deep layers on the windward slope, leeward slope, the bottom of dunes, and the top of dunes.
Microtopography0~40 cm40~200 cm200~300 cm
Average Soil Moisture (%)Coefficient of VariationAverage Soil Moisture (%)Coefficient of VariationAverage Soil Moisture (%)Coefficient of Variation
Leeward0.710.622.250.522.430.36
Bottom1.210.412.230.251.980.23
Top0.810.871.570.462.010.27
Windward0.330.570.860.411.090.51
Table 3. Validity test results of the outer model in the partial least squares structural equation model (PLS-SEM).
Latent VariableC. Alpha CoefficientDG. Rho CoefficientFirst EigenvalueSecond Eigenvalue
Topography0.890.922.580.53
Shrub0.610.841.430.56
Herbaceous0.660.802.090.99
Soil moisture0.790.882.140.70
Table 4. Optimal hyperparameters of the random forest model.
ParameterValue
n_estimators49
min_samples_split6
min_samples_leaf1
random_state42
Table 5. Optimal hyperparameters of the extreme gradient boosting model.
ParameterValue
n_estimators87
learning_rate0.1
subsample0.05
colsample_bytree0.8
max_depth5
reg_alpha0
reg_lambda1
Table 6. Model performance of RF and XGBoost.
Evaluation MetricsAlgorithmSurface LayerMiddle LayerDeep Layer
R2RF0.840.700.83
XGBoost0.680.610.59
MSERF0.190.520.30
XGBoost0.310.450.36
MAERF0.340.500.35
XGBoost0.280.580.41
MAPERF5.25%13.5%5.47%
XGBoost7.11%13.7%11.59%
Disclaimer/Publisher’s Note: The statements, opinions and data contained in all publications are solely those of the individual author(s) and contributor(s) and not of MDPI and/or the editor(s). MDPI and/or the editor(s) disclaim responsibility for any injury to people or property resulting from any ideas, methods, instructions or products referred to in the content.

