Abstract
The capacity of soil to retain water and make it available to plants is an essential soil functions for the sustainability of terrestrial ecosystems. A lot of progress has been made in estimating water retention and availability as a function of soil texture. On the other hand, a lower effort has been dedicated to seeking correlations between plant-available water (AW) and soil compaction. In this study, we compiled a dataset with 2479 records from experiments conducted in Brazilian soils to evaluate the relationship between AW and bulk density (BD). The dataset was split into sub-datasets defined by soil textural classes to reduce the effect of texture on AW–BD relationships. In each sub-dataset, AW–BD relationships were described by linear regression. In general, there was a weak association between AW and BD. The strongest correlations were found in the Silty Loam (R2 = 0.26) and Loam (R2 = 0.13) classes. However, the partitioning of the overall dataset by textural classes was not effective to eliminate the effect of texture on AW–BD relationships. Still, the data showed that soil compaction may increase or reduce AW. Nevertheless, more experimental research is needed to bring a better understanding of how AW is affected by changes in BD.
1. Introduction
The capacity of the soil to store available water (AW) directly determines the production potential of crops in agroecosystems, irrigation scheduling and sowing []. Soil compaction can limit the deepening of roots and, consequently, plant access to available water at greater depths in the soil []. Numerous studies that have investigated and described relationships between soil water retention and basic soil properties such as texture, organic matter, porosity and bulk density can be found in the literature. However, there is a scarcity of research to understand the specific role of soil compaction on AW.
An example of this is the absence of a variable related to the state of soil compaction in the set of predictors of the pedotransfer function generated to estimate the available water content for Brazilian soils []. The presence of soil bulk density, the main measure of the state of compaction, is also missing in some pedotransfer functions of water retention [,]. There are cases in which bulk density is present in pedotransfer functions of water retention [,,,,,] but its weight in predictions is generally lower than that of other predictors and these pedotransfer functions are not specific for estimating AW.
However, the rapid expansion of no-tillage in Brazil [] and the consequent increase in the state of soil compaction in this cropping system [] has led researchers, farmers and technicians to question whether soil compaction is reducing AW. There is some evidence based on predictions of pedotransfer functions [,,] indicating that the effect of bulk density can occur in the same direction on the boundaries that define AW (field capacity and permanent wilting point), without necessarily affecting AW []. Still, interference from factors that may make the relationship between AW and bulk density less noticeable could have occurred in these studies. For example, the variability in bulk density in a dataset may be due more to changes in texture than to that of the state of compaction of the samples. Correlation between soil texture and bulk density and the preponderant effect of texture in relation to bulk density on water retention are highlighted as the main complicating factors in identifying the relationship between bulk density and water retention [].
A solution to this problem would be to produce a comprehensive dataset and divide it into subsets of data so that one could minimize variability in texture and preserve variability in bulk density due to differences in the state of compaction. This would reduce the uncertainty that texture causes in the relationship between AW and bulk density, facilitating its identification. If this strategy proves effective, one of the possible benefits would be a better understanding of the relationship between compaction and AW. However, as AW is capillary water, the main parameter dominating the capillary effect is porosity size and its arrangement or soil structure. Since bulk density is less sensitive than the distribution of soil pores to a change in the arrangement of soil grains, a weak correlation between AW and bulk density is expected. Although this may sound like a disadvantage, and a correlation between AW and bulk density does not encompass the physical mechanisms of water retention, a statistical relationship between AW and bulk density could provide farmers with the direction that soil compaction is affecting water availability to plants in their fields. This may be of interest while more sophisticated scientific approaches involving the mechanisms of water retention and availability are still not easily applicable at the field scale.
Therefore, this study aimed to (i) organize a dataset with information on AW, bulk density and textural class and (ii) seek relationships between AW and bulk density within each class.
2. Materials and Methods
2.1. Organization of a Dataset
A dataset with variation in texture and bulk density was formed by compiling data provided by several authors who perform measurements for dissertations, theses and other type of projects with Brazilian soils (S1). All authors shared their individual measurements (repetitions) in as much detail as possible. A dataset is normally comprised of rows and columns. Each row is termed as a record, in which a particular set of variables is stored. Each record of our dataset can store qualitative variables, as the owner’s name, reference of publication, geographic coordinates, soil class, soil use, soil management, soil depth, year of measurement, and quantitative variables, as sand, silt, clay, bulk density, particle density, total porosity, organic matter, saturated hydraulic conductivity and water retention as well as their correspondent suctions.
Of all data shared by the authors, we considered only those that were measured in undisturbed samples (except permanent wilting point) and that could generate a record having at least sand, silt, clay, bulk density and water retention at 1 and 150 m of suction. These are the key variables for this study, as it will be seen in the next sections. We standardized bulk density in kg m−3, sand, silt and clay in %, water retention in m3 m−3 and water suction in m. Thus, an initial dataset with 4546 records was formed. Although all records had the key variables, many of them were lacking data on particle density, organic matter and hydraulic conductivity.
To reduce interferences in the porous system that could biases the evaluation of our objective, like dense root systems, soil disturbances and high organic matter, we removed the records from areas cultivated with eucalyptus, peach and native grassland, records with organic matter higher than 5% and records of depths lower than 5 cm. This initial screening eliminated 719 records, resulting in a dataset with 3827 records, in which the plant available water content was estimated.
2.2. Estimating of Plant Available Water Content in the Dataset
The definition of plant-available water content (AW) is a controversial matter in the literature [,,]. Its upper limit has been defined by the field capacity, whose value depends on the chosen criterion (drainage rate, matric suction or drainage time) and the value considered for it (1 mm d−1 or other values for drainage rate; between 0.6 and 33 m of matric suction; on average 1 to 3 days for drainage time). However, there is less conflict regarding the lower limit, most commonly defined by the permanent wilting point at a matric suction of 150 m. In our dataset, the AW was estimated by the range of water retained between matric suctions of 1 and 150 m (AW = θ1m − θ150m), as this is commonly used [,] in the absence of more accurate information from monitoring or modeling the processes of drainage and water uptake by plants [,]. Thus, θ1m and θ150m are estimates of field capacity (FC) and permanent wilting point (PWP), respectively. Another reason for choosing θ1m as FC is that the availability of water retention data at a suction of 1 m in our dataset was much greater than it was at other lower or higher suctions.
2.3. Splitting the Dataset by Textural Classes
The state of the art on the development of pedotransfer functions has highlighted the significant effect of texture on soil water retention. Due to this, the relationships between AW and bulk density are commonly unclear []. As the objective of this study was to seek relationships between AW and bulk density, we partitioned the dataset according to the soil textural classes in other to create sub-datasets with less heterogeneity in texture, and, thus, reduce the texture perturbation on the relationships between AW and bulk density. Thus, the dataset was split into the textural classes of the Brazilian Soil Classification System [], with an EXCEL-VBA algorithm (S2). As there were no records in the Silt class, a total of 12 sub-datasets were formed.
Before evaluating the relationship between AW and bulk density, an analysis of outliers in FC, PWP and AW was performed within each sub-dataset. Any value of each variable (FC, PWP and AW) below its lower limit [Lw = quart_1 − (quart_3 − quart_1) × 1.5] or above its upper limit [Up = quart_3 + (quart_3 − quart_1) × 1.5] was considered an outlier, where quart_1 and quart_3 are the quartiles calculated for each series (FC, PWP and AW) within each sub-dataset. The records containing at least one outlier (in FC, PWP or AW) were removed. This was done because the three variables are interdependent.
The analysis of outliers eliminated a total of 1348 records, resulting in a final overall dataset (all sub-datasets) with 2479 records. Figure 1 shows the texture triangle distribution of the 2479 records, while Table 1 and Table 2 show the number of records in each sub-dataset and descriptive statistics for the most relevant variables used in this study.
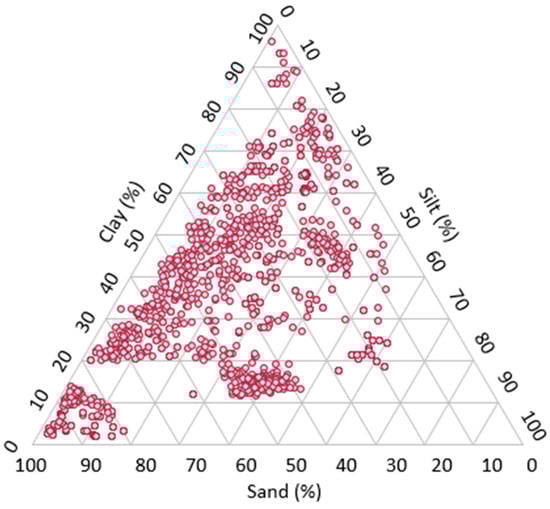
Figure 1.
Distribution in the soil texture triangle of the 2479 records used to evaluate the association between available water content and soil compaction.

Table 1.
Number of records of each sub-dataset (textural class) for Sand, Loamy Sand, Sandy Loam, Sandy Clay Loam, Loam classes and descriptive statistics for the most relevant variables used in this study (units at the bottom of the table).
Table 2.
Number of records of each sub-dataset (textural class) for the Clay Loam, Silty Loam, Silty Clay Loam, Silty Clay, Clay, Very clayey classes and descriptive statistics for the most relevant variables used in this study (units at the bottom of the table).
2.4. Relationships of AW with Bulk Density, Particle Size Fractions and Organic Matter
In each sub-dataset, regression analysis was used to evaluate whether a mathematical function would correlate AW with BD significantly. After visual examination and comparison of the R2 values of the linear and quadratic equations, we found that the linear model fit well to relationship between AW and BD, and no relevant statistical gain was obtained by using a quadratic equation. Therefore, the function AW = aBD + b was adjusted in each sub-dataset.
In addition, the linear regression analysis AW = aX + b, where X is sand, silt or clay (%) content, was also performed to examine how much variability in AW associated with variability in texture remained in each sub-dataset. In cases where there were data of organic matter, we also used linear regression to assess the relationship between organic matter and AW.
Pearson’s correlation analysis was carried out between FC, PWP and AW. The correlation coefficient was interpreted according to [,]: 0.00 to 0.10 (negligible correlation); 0.10 to 0.39 (weak correlation); 0.40 to 0.69 (moderate correlation); 0.70 to 0.89 (strong correlation); and 0.90 to 1.00 (very strong correlation).
3. Results
With the dataset formed for this study, it was possible to gather between 102 and 549 records in most of the sub-datasets, with fewer data only in the Sandy Loam, Sandy Clay and Silty Clay Loam classes (Table 1 and Table 2).
Considering the low amount of data with more than 40% of silt (470 records) (Figure 1), the ordering of the textural classes shown in Figure 2 generally represents an increase in clay content and a decrease in sand content from left to right. Therefore, the average FC ranged from 0.14 to 0.39 m3 m−3, and the average PWP ranged from 0.04 to 0.26 m3 m−3. AW was less sensitive to changes in soil texture, with an average value ranging from 0.10 to 0.22 m3 m−3.
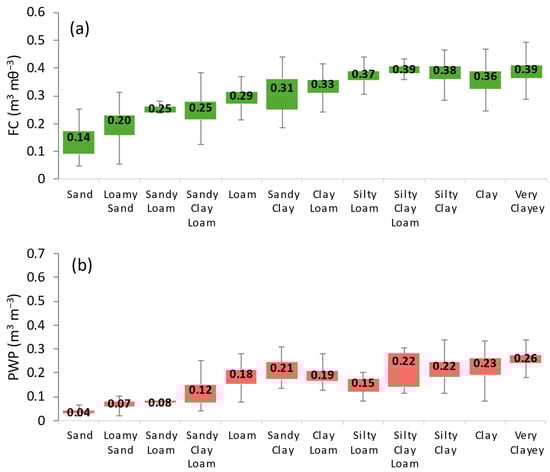
Figure 2.
Distribution of FC (a), PWP (b) and AW (c) in the data subsets defined by soil textural class. The numbers represent the average, the ends of the boxes represent the first and third quartiles and the ends of the dashes represent the minimum and maximum values. FC = field capacity, WP = permanent wilting point and AW = available water.
The existence of variability in FC, PWP and AW in each sub-dataset (Figure 2c) was necessary to investigate whether variability in AW would be associated with variability in BD. However, there was a low correlation between AW and BD in every sub-dataset (Figure 3, Figure 4 and Figure 5), and only five regressions between AW and BD were significant (Table 3). The greatest correlations were found in the Silt Loam (R2 = 0.26) (Figure 4) and Loam (R2 = 0.13) classes (Figure 5). In the other textural classes, the R2 value was between <0.01 and 0.07.
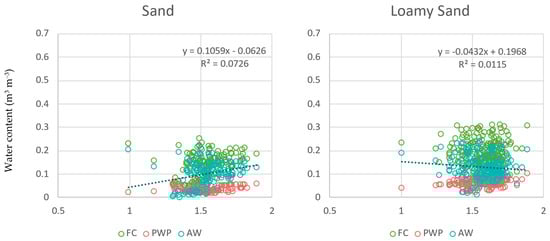
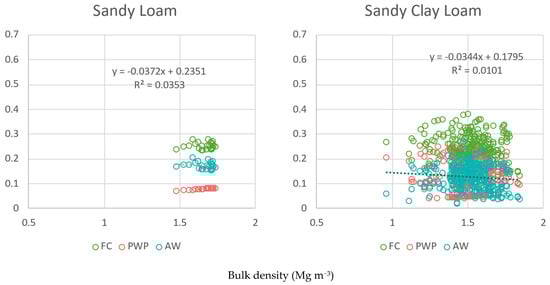
Figure 3.
Association of field capacity (FC), wilting point (WP) and available water (AW) with bulk density in the data subsets defined by the Sand, Loamy Sand, Sandy Loam and Sandy Clay Loam classes.
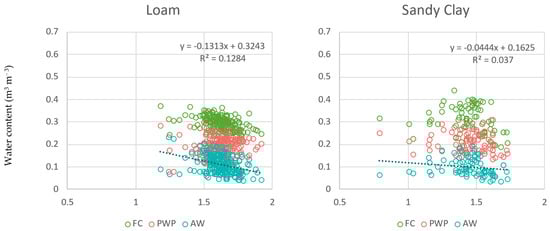
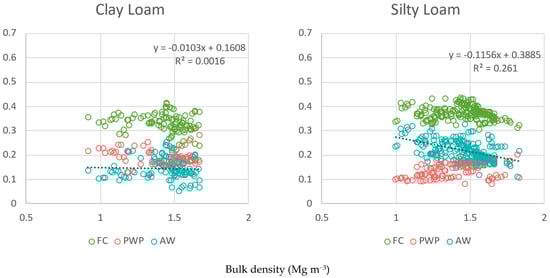
Figure 4.
Association of field capacity (FC), wilting point (WP) and available water (AW) with bulk density in the data subsets defined by the Loam, Sandy Clay, Clay Loam and Silty Loam classes.
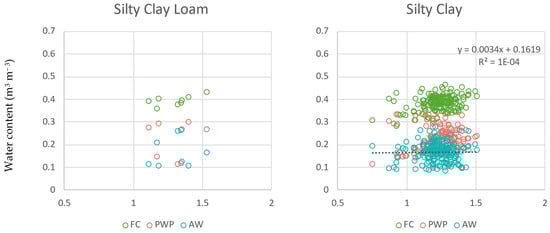
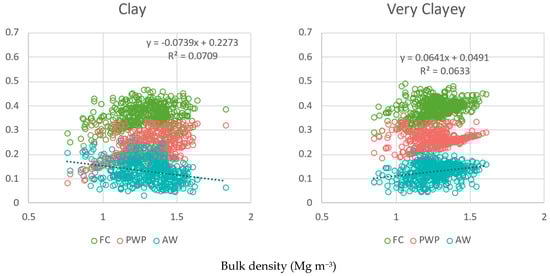
Figure 5.
Association of field capacity (FC), wilting point (WP) and available water (AW) with soil bulk density in the data subsets defined by the Silty Clay Loam, Silty Clay, Clay and Very Clayey classes.
Table 3.
Coefficient of determination (R2) of the linear regressions of AW with bulk density (BD), sand, silt, clay and organic matter (OM) in each sub-dataset.
Linear regressions of AW with sand, clay and organic matter within sub-dataset detected a significant effect of such variables on AW (Table 3). In certain sub-datasets, the determination coefficient R2 was higher in AW regressions with sand, silt and clay than in those with BD. In addition, the number of significant regressions between AW and BD (five) was lower than those with sand (six), silt (eight) and clay (seven), which highlights the close relationship between particle size fractions and soil water retention even within the sub-datasets.
Positive and significant correlations between FC and PWP, AW and FC and AW and PWP are shown in Figure 6, which will complement the discussion about the low correlation between AW and BD.
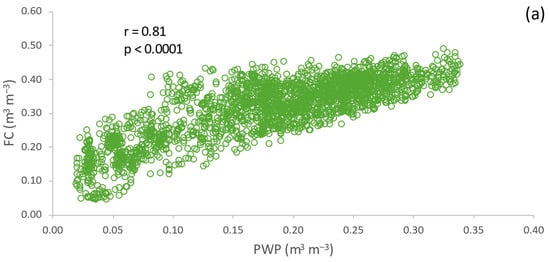
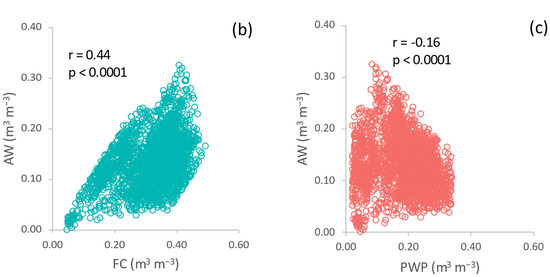
Figure 6.
Correlations between FC and PWP (a), AW and FC (b) and AW and PWP (c). FC = field capacity, WP = permanent wilting point and AW = available water.
4. Discussion
The analysis of the data presented in the previous section showed a low degree (R2 ≤ 0.26) of association between AW and BD (Figure 3, Figure 4 and Figure 5) and a significant one in only five of the 12 sub-datasets (Table 1). In general, the association between AW and BD weakened with the decrease in data in the sub-datasets (Table 1). Although the Silty Loam and Loam classes showed relatively higher R2 values, it is not clear what factors the higher R2 values could be attributed to. Any supposition may be biased by the differences in several factors (amount of data and variability in sand, silt and clay) among the regressions. This indicates that there is a need to expand the dataset to identify more accurately the association between AW and BD, especially in textural classes with more than 40% silt, for which there are few data (Figure 1).
The low degree of association between AW and BD is partly due to the insufficient reduction that the sub-dataset caused on the effect of texture on the AW–BD relationship. Linear regressions of AW with sand, silt and clay showed that not-negligible variability in texture remained within each sub-dataset (Table 1). This confounding effect, which even excludes BD in pedotransfer functions [,,,], would need to be further reduced so that the variability in BD within a sub-dataset is due more to variation in the state of compaction than to variation in texture. However, increasing the number of sub-datasets to lower the textural variability within each sub-dataset would reduce the data for each regression of AW and BD. Thus, an increase in the number of sub-datasets without impairing the regression of AW and BD should be accompanied by an expansion in the overall dataset.
A high reduction in the variability of texture and other variables that impact AW, such as mineralogy and organic matter, could be obtained by using data from less heterogeneous soil areas, such as experimental plots. There is a greater likelihood of identifying the relationship between AW and BD at specific sites []. Although site-specific data with compaction experiments may contain sufficient variability in soil bulk density [,,], the amount of data in each experiment is typically small, hardly exceeding 50 to 100 records. This would not be enough to accurately investigate the relationship between AW and BD via regression analysis. Because of the scarcity of data with sufficient control of confounders, more comprehensive tests of the relationship between AW and BD will require expanding the dataset and/or conducting experiments with a high control of confounders and a large set of BD and AW data.
More comprehensive datasets would also make it possible to separate sub-datasets based on measurement techniques. The use of variables measured with different techniques in the same sub-dataset often introduces variability created by the techniques and even the measurement sites []. It is possible to observe subgroups of data in the Sandy Clay Loam and Silt Clay classes (Figure 3 and Figure 5), especially for PWP. In most of the data sources in S1, PWP was determined using a dew point psychrometer, but a pressure plate extractor was used in others []. Some studies have previously shown that there is a difference in determination between the two devices [,]. In controlled experiments, this problem can be eliminated with the use of a single measurement technique for the same variable. In a larger dataset, it would be possible to separate sub-datasets using measurement techniques as a criterion, although there may be confounders arising from different origins (locations, operator of the techniques, etc.) where the measurement was made [].
It is also reasonable to assume that the effect of BD on AW is small, as indicated by the regressions (Figure 3, Figure 4 and Figure 5 and Table 1). Increased compaction implies a direct increase in BD and a decrease in total porosity. However, the increase in soil bulk density may be due solely to the decrease of large pores, which can be reduced to sizes that are still larger than those that retain water between the FC and PWP. Evidence of a weaker association between microporosity and BD compared to that between macroporosity and BD [] suggests that AW may change slightly with compaction, unless the degree of compaction is high enough to decrease soil microporosity to the point of having a greater impact on AW. Also, several studies that have determined the Least Limiting Water Range show that FC and PWP are generally affected in the same direction, both increasing (e.g., []) or decreasing (e.g., []) with the increase in BD. The data from this study proved that FC and PWP are directly correlated (Figure 6). Although they may display differing levels of sensitivity to the BD variation, the fact that they are directly correlated means that the difference between them, i.e., AW, is less sensitive to BD variation due to compaction. Therefore, AW has a weaker correlation with FC and PWP (Figure 6). The correlation was considered weak (r = 0.10 to 0.39) between AW and FC as well as between AW and PWP, but it was strong between FC and PWP, according to the correlation ranges indicated by [,].
In general, the results of this study showed that soil compaction affects AW to a low degree, but it may increase or decrease AW depending on the textural class of the soil (Figure 3, Figure 4 and Figure 5). On the other hand, the relationship between texture and AW (Figure 2, Table 3) is more significant and proven with a larger set of experimental data that made it possible to propose pedotransfer functions in the numerous studies previously mentioned. Soil compaction and AW may be weakly correlated because the ratio of solids mass to its aggregated volume (soil bulk density) does not fully integrate the distribution of adsorptive and capillary forces and permeability, which are the key factors determining water retention. This is due the fact that the complex geometry of soil porosity (affecting capillary water and permeability) and variations in specific surface and its electrical charge (affecting adsorptive forces) may not be well correlated with soil bulk density. Thus, the effect of compaction on AW is weak and still unclear but seems to depend on the texture.
It is important to consider that this work is a collection of data from several experiments that were performed separately and were not designed to be joined in one paper. Although the same methodology was used to determine soil texture, bulk density and water retention, more experimental research considering the parameters of porosity size, soil structure and grain density is needed to clarify the relationship between plant-available water and bulk density. This article constitutes a preliminary approach to understand the relation of AW to bulk density.
5. Conclusions
There was a low association between plant-available water content and bulk density (measure of the state of compaction). The strongest correlations were found in the Silty Loam (R2 = 0.26) and in Loam class (R2 = 0.13), respectively. An increase or decrease in plant available water can be noticed due to soil compaction depending on soil texture.
The splitting of the dataset by textural classes was not enough to reduce the effect of texture on plant-available water content to a level that could clarify the relationship between plant-available water and bulk density. Nevertheless, new attempts to reduce the confounding effects caused by texture are opportunities for future studies. For instance, one could expand the dataset and/or carry out experiments with varying degrees of compaction on soil classes that are homogeneous in terms of texture and other intervening factors (e.g., organic matter and mineralogy).
Supplementary Materials
The following supporting information can be downloaded at: https://www.mdpi.com/article/10.3390/su16166951/s1, Document: Textural Class Algorithm.
Author Contributions
P.I.G. (conceptualization, investigation, formal analysis, writing—original draft, writing—review & editing, funding acquisition); V.P.d.S. (Investigation); R.P.M. (investigation, writing—original draft); L.E.A.S.S. (investigation, writing—original draft, writing—review & editing); M.S.D. (investigation); A.L.Z. (investigation); E.K. (investigation); C.A.P. (investigation); L.R.M. (investigation); R.d.M.G. (investigation); D.B. (investigation); K.E. (investigation); D.B.J. (investigation, writing—original draft); C.D.M. (investigation); E.A.M. (investigation). All authors have read and agreed to the published version of the manuscript.
Funding
This research was funded by the Coordination for the Improvement of Higher Education Personnel (CAPES)—Funding Code 001 and by the National Council for Scientific and Technological Development (CNPq)—Process 434853/2018-6.
Institutional Review Board Statement
Not applicable.
Informed Consent Statement
Not applicable.
Data Availability Statement
Data available on request from the authors.
Acknowledgments
We would also like to thank all contributors for providing the data mentioned in Supplementary Material Table S1.
Conflicts of Interest
Author Lenise Raquel Mentges was employed by the company Empresa de Assistência Técnica e Extensão Rural (Emater/RS-Ascar). The remaining authors declare that the research was conducted in the absence of any commercial or financial relationships that could be construed as a potential conflict of interest.
References
- Gupta, S.; Lehmann, P.; Bickel, S.; Bonetti, S.; Dani, O. Global mapping of potential and climatic plant-available soil water. J. Adv. Model. Earth Syst. 2023, 15, 1–16. [Google Scholar] [CrossRef]
- Mulazzani, R.P.; Gubiani, P.I.; Zanon, A.J.; Drescher, M.S.; Schenato, R.B.; Girardello, V.C. Impact of soil compaction on 30-year soybean yield simulated with CROPGRO-DSSAT. Agr. Syst. 2022, 203, 103523. [Google Scholar] [CrossRef]
- Teixeira, W.G.; Victoria, D.C.; Barros, A.H.C.; Lumbreras, J.F.; Araujo Filho, J.C.; Silva, F.A.M.; Lima, E.P.; Bueno Filho, J.S.S.; Monteiro, J.E.B.A. Predição da Água Disponível no solo em Função da Granulometria para uso nas Análises de Risco no Zoneamento Agrícola de Risco Climático; Embrapa Solos: Rio de Janeiro, Brazil, 2021. [Google Scholar]
- Giarola, N.F.B.; Silva, A.P.; Imhoff, S. Relações entre propriedades físicas e características de solos da região sul do Brasil. Rev. Bras. Cienc. Solo 2002, 26, 885–893. [Google Scholar] [CrossRef]
- Saxton, K.E.; Rawls, W.J.; Romberger, J.S.; Papendick, R.I. Estimating generalized soil-water characteristics from texture. Soil. Sci. Soc. Am. J. 1986, 50, 1031–1036. [Google Scholar] [CrossRef]
- Amorim, R.S.S.; Albuquerque, J.A.; Couto, E.G.; Kunz, M.; Rodrigues, M.F.; Silva, L.C.M.; Reichert, J.M. Water retention and availability in Brazilian Cerrado (neotropical savanna) soils under agricultural use: Pedotransfer functions and decision trees. Soil Tillage Res. 2022, 224, 1–14. [Google Scholar] [CrossRef]
- Arya, L.M.; Paris, J.F. Physicoempirical model to predict the soil moisture characteristic from particle-size distribution and bulk density data. Soil Sci. Soc. Am. J. 1981, 45, 1023–1030. [Google Scholar] [CrossRef]
- Costa, A.; Albuquerque, J.A.; Costa, A.; Pértile, P.; Silva, F.R. Water retention and availability in soils of the State of Santa Catarina-Brazil: Effect of textural classes, soil classes and lithology. Rev. Bras. Cienc. Solo 2013, 37, 1535–1548. [Google Scholar] [CrossRef]
- Gupta, S.C.; Larson, W.E. Estimating soil water retention characteristics from particle size distribution, organic matter percent, and bulk density. Water Resour. Res. 1979, 15, 1633–1635. [Google Scholar] [CrossRef]
- Reichert, J.M.; Albuquerque, J.A.; Kaiser, D.R.; Reinert, D.J.; Urach, F.L.; Carlesso, R. Estimation of water retention and availability in soils of Rio Grande do Sul. Rev. Bras. Cienc. Solo 2009, 33, 1547–1560. [Google Scholar] [CrossRef]
- Ritchie, J.T.; Gerakis, A.; Suleiman, A.A. Simple model to estimate field-measured soil water limits. Trans. ASAE 1999, 42, 1609–1614. [Google Scholar] [CrossRef]
- Fuentes-Llanillo, R.; Telles, T.S.; Soares Junior, D.; de Melo, T.R.; Friedrich, T.; Kassam, A. Expansion of no-tillage practice in conservation agriculture in Brazil. Soil Tillage Res. 2021, 208, 104877. [Google Scholar] [CrossRef]
- Reichert, J.M.; Suzuki, L.E.A.S.; Reinert, D.J. Compactação do solo em sistemas agropecuários e florestais: Identificação, efeitos, limites críticos e mitigação. Tópicos Em Ciência Do Solo 2007, 5, 49–134. [Google Scholar]
- Klein, V.A.; Reichert, J.M.; Reinert, D.J. Água disponível em um Latossolo Vermelho argiloso e murcha fisiológica de culturas. Bras. Eng. Agr. Amb. 2006, 10, 646–650. [Google Scholar] [CrossRef]
- Zhang, Y.; Schaap, M.G. Weighted recalibration of the Rosetta pedotransfer model with improved estimates of hydraulic parameter distributions and summary statistics (Rosetta3). J. Hydrol. 2017, 547, 39–53. [Google Scholar] [CrossRef]
- De Jong van Lier, Q.; Wendroth, O. Reexamination of the Field Capacity Concept in a Brazilian Oxisol. Soil. Sci. Soc. Am. J. 2016, 80, 264–274. [Google Scholar] [CrossRef]
- Melo, M.L.A.; de Jong van Lier, Q. FluxPAW: A standalone software to calculate flux-based plant available water. Softw. Impacts 2023, 15, 1–4. [Google Scholar] [CrossRef]
- Santos, R.D.; Santos, H.G.; Ker, J.C.; Anjos, L.H.C.; Shimizu, S.H. Manual de Descrição e Coleta de solo no Campo, 7th ed.; SBCS: Viçosa, Brazil, 2015. [Google Scholar]
- Mukaka, M.M. Statistics Corner: A guide to appropriate use of correlation coefficient in medical research. Malawi Med. J. 2012, 24, 69–71. [Google Scholar] [PubMed]
- Schober, P.; Boer, C.; Schwarte, L.A. Correlation coefficients: Appropriate use and interpretation. Anesth. Analg. 2018, 126, 63–1768. [Google Scholar] [CrossRef]
- Bitencourt Junior, D.; Suzuki, L.E.A.S.; Pauletto, E.A.; Bamberg, A.L.; Nunes, M.R.; Perazzoli, D. Estrutura e água disponível de um cambissolo submetido a períodos de pastejo rotacionado. Agroamazon 2021, 1, 50–59. [Google Scholar] [CrossRef]
- Kaiser, D.R. Estrutura e Água em Argissolo sob Distintos Preparos na Cultura do Milho. Ph.D. Thesis, Universidade Federal de Santa Maria, Santa Maria, Brazil, 2010. [Google Scholar]
- Suzuki, L.E.A.S.; Reinert, D.J.; Alves, M.C.; Reichert, J.M. Medium-term no-tillage, additional compaction, and chiseling as affecting clayey subtropical soil physical properties and yield of corn, soybean and wheat crops. Sustainability 2022, 14, 9717. [Google Scholar] [CrossRef]
- Moraes, M.T.; Debiasi, H.; Franchini, J.C.; Mastroberti, A.A.; Levien, R.; Leitner, D.; Schnepf, A. Soil compaction impacts soybean root growth in an Oxisol from subtropical Brazil. Soil. Tillage Res. 2020, 200, 104611. [Google Scholar] [CrossRef]
- Guillaume, B.; Boukbida, H.A.; Bakker, G.; Bieganowski, A.; Brostaux, Y.; Cornelis, W.; Durner, W.; Hartmann, C.; Iversen, B.V.; Javaux, M.; et al. Reproducibility of the wet part of the soil water retention curve: A European interlaboratory comparison. EGUsphere 2023, 9, 365–379. [Google Scholar] [CrossRef]
- Ottoni, M.V.; Ottoni Filho, T.B.; Schaap, M.G.; Lopes-Assad, M.L.R.C.; Rotunno Filho, O.C. Hydrophysical database for Brazilian soils (HYBRAS) and pedotransfer functions for water retention. Vadose Zone J. 2018, 17, 1–17. [Google Scholar] [CrossRef]
- De Jong Van Lier, Q.; Pinheiro, E.A.R.; Inforsato, L. Hydrostatic equilibrium between soil samples and pressure plates used in soil water retention determination: Consequences of a questionable assumption. Rev. Bras. Cienc. Solo 2019, 43, 1–14. [Google Scholar] [CrossRef]
- Stolf, R.; Thurler, A.M.; Bacchi, O.O.S.; Reichardt, K. Method to estimate soil macroporosity and microporosity based on sand content and bulk density. Rev. Bras. Cienc. Solo 2011, 35, 447–459. [Google Scholar] [CrossRef]
- Leão, T.P. Water retention and penetration resistance equations for the least limiting water range. Sci. Agric. 2021, 76, 172–178. [Google Scholar] [CrossRef]
Disclaimer/Publisher’s Note: The statements, opinions and data contained in all publications are solely those of the individual author(s) and contributor(s) and not of MDPI and/or the editor(s). MDPI and/or the editor(s) disclaim responsibility for any injury to people or property resulting from any ideas, methods, instructions or products referred to in the content. |
© 2024 by the authors. Licensee MDPI, Basel, Switzerland. This article is an open access article distributed under the terms and conditions of the Creative Commons Attribution (CC BY) license (https://creativecommons.org/licenses/by/4.0/).