Article

Relational Global Value Chain Carbon Emissions and Their Network Structure Patterns: Evidence from China

1
School of Economics and Trade, Hunan University, Changsha 410079, China
2
School of Economics and Trade, Hunan University of Technology and Business, Changsha 410205, China
*
Author to whom correspondence should be addressed.
Sustainability 2024, 16(16), 6940; https://doi.org/10.3390/su16166940
Submission received: 26 June 2024 / Revised: 9 August 2024 / Accepted: 12 August 2024 / Published: 13 August 2024
(This article belongs to the Special Issue Environmental Economics in Sustainable Social Policy Development)

Abstract

:
The structure of the network among firms participating in global value chains is an important factor in understanding the changes in China’s carbon emissions. This paper focuses on the interdependence between firms and the interconnected networks to which they belong, utilizing an inter-country input–output model that distinguishes between domestic-owned enterprises and foreign-invested enterprises for measurement purposes. By distinguishing between domestic and cross-border global value chains, we illustrate the carbon emission effects of relational global value chains and their network structures, thereby contributing a Chinese perspective on relational global value chains and carbon emission reduction. This study reveals that (1) relational global value chain activities have emerged as a significant contributor to China’s carbon emissions, constituting approximately 26.8%, with its growth mainly stemming from the expansion of domestic global value chain emissions. At the sectoral level, relational global value chain activities lead to higher carbon emissions from the service sector than from the manufacturing sector. (2) Domestic global value chain relationship activities are more likely to have favorable economic and environmental trade-offs, as evidenced by the lower carbon intensity of the domestic global value chain than the cross-border global value chain. The circle-structured relationship activities between domestic-owned enterprises and foreign-invested enterprises are associated with more sustainable carbon emission growth and greater potential for emission reduction than the chain structure. (3) Structural decomposition analysis indicates that the impact of cross-border global value chain emissions on China’s carbon emission growth has been decreasing since 2012, while the influence of the domestic global value chain is on the rise and surpasses that of the cross-border global value chain by the end of the period.

1. Introduction

Global value chains (GVCs), which involve multiple cross-border movement characteristics of intermediate goods (e.g., across firm boundaries or across national borders), pose challenges to achieving the sustainable development goals (SDGs) related to low-carbon transitions. Previous studies have shown that GVC production networks, driven by trade and foreign direct investment (FDI), contribute to increased carbon dioxide emissions from international production (Meng et al., 2018, 2023 [1,2]; Zhu et al., 2022 [3]; Li et al., 2023 [4]; Yan et al., 2023a, 2023b [5,6]). However, the impact of different forms of production networks within GVCs on carbon emission reduction remains unclear, especially that of the domestic GVC production networks associated with FDI. As a micro-phenomenon at the firm level, firms involved in GVCs frequently establish complex inter-firm networks (Kano et al., 2020 [7]). These networks revolve around the interdependence and interactions among firms. Therefore, analyzing the carbon effects of GVCs should consider not only individual firms but also the interconnected networks to which they belong and the structure of these networks (Soontornthum et al., 2020 [8]).
Global value chain theory suggests that different value chains generate different relationships between firms in networks operating under multiple national systems (Lakhani et al., 2013 [9]), resulting in different network structure patterns among firms. Differences in production behaviors underlying different network structural patterns can have different environmental impacts. Therefore, we suggest that tracing carbon emissions in GVCs will also vary according to different network structure patterns. The emerging literature has incorporated this perspective into the analysis of GVCs (Alfaro-Urena et al., 2022 [10]; Laari et al., 2022 [11]; Sun et al., 2023 [12]). Following these studies, this paper develops an accounting framework based on the production networks between firms involved in GVCs and carbon emissions using the Activities of Multinational Enterprises (AMNE) database provided by the Organization for Economic Cooperation and Development (OECD) as well as the environmental accounts (EA) from the World Input–Output Database (WIOD). In this process, the framework helps to advance the research and practice related to GVCs as well as sustainable development.
GVCs represent a sophisticated system of interconnected input–output transactions, as highlighted by Henderson et al. (2002) [13]. These transactions involve intricate relationships within value chains, linking firms both upstream and downstream (Yue et al., 2024 [14]), which emphasizes firm-to-firm linkages. Due to sunk costs or barriers to information dissemination, the costs incurred by firms in finding alternative markets and building new networks are much higher than the costs of maintaining existing relationships (Allen, 2014 [15]). In this case, interactions between firms in a production chain, based on technological, cost, and other advantages, can occur between subsidiaries of multinational enterprises (MNEs) and local firms within a country or between firms in different countries. These interactions reflect the value added by at least two countries and can have an impact on the environment (Sun et al., 2023 [12]). The production of the Tesla Model 3 in China is a representative example. Due to the need for automobile production, Tesla’s foreign-invested enterprises (FIEs) in China often engage in production interactions with local firms in China. For example, the production of the Tesla Model 3 in China involves collaborations between Tesla’s FIEs and local Chinese firms for components like power battery packs and electric pile structural parts. In this mutual production interaction, carbon emissions are generated. As firms globally focus on efficiency, those providing factors of production like labor, capital and technology can participate in the GVC production networks. These firms engage in multiple interactions, forming a sticky global value chain relationship (Antràs and Chor, 2021 [16]). Antràs (2020) [17] emphasizes that GVC activities are inherently relational, with transactions involving raw materials and homogeneous intermediate inputs more likely to exhibit persistence or ‘‘stickiness’’ through multiple interactions. This paper refers to this type of relational network activity, based on multiple interactions between GVC firms, as ‘‘relational GVC activity’’.
There are different patterns of such relational networks, which are driven by institutional-, market- and technology-related factors. On the one hand, it stems from contract-based binding relationships between individual firms in GVCs (Antràs, 2020) [17]. In order to avoid the risk associated with different laws and regulations, firms involved in GVCs must establish a stable contractual relationship (Agostino et al., 2020) [18]. This can be achieved by repeatedly engaging in production interactions and cooperation, which ensures that the product is finalized through multiple production stages (Yue et al., 2024) [14]. Gereffi et al. (2005) [19] identified five different types of relationships between firms in the value chain and were the first to propose the concept of the “relational value chain”. On the other hand, local firms join the network of relationships in the transnational supply chains, where the stability of these relationships provides better access to spillovers, such as economic and technological effects (Alfaro-Urena et al., 2022) [10]. For example, supply and demand networks established by large MNEs (e.g., value chain dominant firms) help local suppliers in the host country to access international markets (Cusolito et al., 2016) [20]. Production interactions between domestic-owned enterprises (DOEs) and FIEs within the host country facilitate the development, adoption and improvement of environmentally friendly production technologies (Xing et al., 2023) [21].
Research on GVC carbon accounting builds on the decomposition of GDP production activities and gross trade (Koopman et al., 2014 [22]; Miroudot and Ye, 2020 [23]; Xiao et al., 2020 [24]; Wang et al., 2017, 2021 [25,26]). While these studies have enhanced our comprehension of how trade impacts carbon emissions in the GVC era, there has been limited focus on the carbon emission effects related to relational GVCs (Sun et al., 2023 [12]). This gap exists due to the challenges in accounting for relational GVC activities, particularly the scarcity of data on inter-firm linkages (Alfaro et al., 2019 [27]; Antràs, 2020 [17]; Karabay, 2022 [28]), especially the interaction between MNE subsidiaries and local firms within a country. Obtaining such data is notably challenging when using existing customs statistics and national accounting systems. The inter-country input–output (ICIO) table provided by the AMNE GVC analysis database (Cadestin et al., 2018 [29]) allows for the distinction between DOEs and FIEs, enabling the accounting of relational GVC carbon emission effects. The AMNE-ICIO table is able to describe the production interactions between global enterprises, on the basis of which, based on the different network structural forms between enterprises, we can portray the relational nature of GVCs.
While the existing literature has extensively examined the structural aspects of GVCs at national, regional or inter-sectoral levels (Piccardi et al., 2018 [30]; Pu et al., 2022 [31]), there has been a lack of focus on understanding the interconnected network relationships among firms involved in GVCs and their impact on carbon emissions. On the one hand, GVC production networks often exhibit clustering, indicating frequent interactions among participating firms (Laari et al., 2022 [11]). These interactions can lead to value creation but they may also result in increased carbon emissions due to transportation processes and packaging waste, particularly prevalent in the electronics and plastics industries. However, the ‘‘stickiness’’ of relational GVCs can facilitate a clean technology transfer (Sun et al., 2023 [12]). On the other hand, the GVC production system can be naturally described as a multilayered network. Different network structure patterns between firms correspond to different network layers, and each layer of the network corresponds to a production structure driven by a certain production strategy (Hong et al., 2023 [32]) and the production behaviors underlying different production structures generate large amounts of carbon emissions. Furthermore, the relational nature of GVCs is influenced by the specific structure of the chain (Yue et al., 2024 [14]). Baldwin and Venables (2013) [33] highlighted the ‘‘spider-like’’ and ‘‘snake-like’’ characteristics of product production structures in GVCs, while Yue et al. (2024) [14] explored the diverse roles played by different network structures in GVCs in achieving stable employment outcomes in a country.
We take China as the context to develop our exposition. As China moves towards a higher-quality development stage, the problem of high carbon emissions caused by rapid economic growth in the previous period has attracted a lot of attention, especially on how China can achieve the goal of carbon peaking and carbon neutrality by reducing carbon emissions, which has become a hotspot of attention nowadays. As the world’s largest carbon emitter, China’s role in global carbon emission reduction cannot be ignored. An assessment shows that China’s voluntary emission reduction target is the largest, with a reduction of about 1.5 billion tons of carbon dioxide equivalent, compared with 1.4 billion tons in the United States and 0.9 billion tons in the European Union (Yang et al., 2021) [34]. In fact, the Chinese government proposed the transformation of the economic growth mode in the Ninth Five-Year Plan. After the Eleventh Five-Year Plan, energy conservation and emissions reduction were incorporated into the national economic development plan as an important “binding indicator” (Wang et al., 2020) [35], while a package of emission reduction policies, including investment attraction policies, industrial policies and environmental policies, has been adjusted in a timely manner.
More importantly, China is not only the center of cross-border GVC production networks (Xiao et al., 2020) [24], but also multinational manufacturing firms in China have emerged as global supply centers (Gao et al., 2023) [36]. Over the past 40 years, international trade has evolved into task trades dominated by global value chains (Meng et al., 2018 [1]; Antràs, 2020 [17]). Developed countries, represented by the United States, the European Union and Japan, have long encouraged manufacturing outsourcing and industrial transfer and transformation and gradually formed a GVC pattern that occupies the high end of both sides of the “U”-shaped GVC. In contrast, developing countries, represented by China, are basically characterized by export orientation and acceptance of international outsourcing orders in manufacturing, forming a large-scale manufacturing-based GVC (Xiao et al., 2021) [24], which is at the low end of the manufacturing link of the “U”-shaped GVC. MNEs are the main carriers of this pattern. However, offshoring and overseas direct investments by GVC leaders, such as the United States, the European Union, and Japan, have brought to developing countries, such as China, technologies and production capabilities that would have taken decades to develop domestically. With this, Chinese firms have been deeply involved in GVCs and have been actively utilizing the spillover effects of GVCs, gradually moving up to the top end of the GVCs (Wang et al., 2020) [35], greatly accelerating the process of industrialization. In 2009, China surpassed Germany to become the world’s largest exporter, creating a miracle of exports and gradually becoming the center of the production network of the GVCs. Moreover, China’s open-door policy provides an excellent ground for MNEs such as the US, the EU and Japan to extend their value chains in China, and these MNEs (i.e., FIEs) in China have gradually become global supply centers through their production interactions with DOEs (Gao et al., 2023) [36]. For example, the emergence of FIEs provides a window for local Chinese firms to participate in MNE-dominated value chains. The early emergence of a large number of DOEs on the southeast coast of China that provided outward support to FIEs formed an inter-firm production network between DOEs and FIEs. DOEs were embedded in the value chains of FIEs through backward and forward linkages. At the same time, the competitive pressure among FIEs and the domestic market orientation has led to an increasing dependence on the intermediate product inputs provided by DOEs. Hou et al. (2023a) [37] were the first to analyze the impact of the interactions between DOEs and FIEs on China’s employment, energy, economy and environment and found that MNEs influence the host country’s sustainable development goals through inter-firm interactions. Based on the above considerations, this paper chose China as the research object.
Overall, we may have contributed to the following points: Firstly, by utilizing data from the OECD-AMNE database, this study aims to identify and quantify the carbon emissions within relational GVCs. The focus is on examining the connections between firms involved in GVC production networks and assessing how different network structures influence carbon emissions reduction. Drawing on similarities between complex networks and input–output theory, this research integrates features of the chain and circle structures from complex networks (Fan et al., 2021 [38]) to highlight the relational nature of GVC production networks and trace carbon emissions in these networks. Additionally, the network structure relationship between different types of firms defined in this paper contributes to a better understanding of the relational characteristics of the interconnections between firms involved in GVCs, thus helping to open the ‘‘black box of firm heterogeneity and trade in value-added’’ (Fortanier et al., 2020 [39]), and enriching the literature on GVCs.
Secondly, a distinction is made between domestic GVC emissions and cross-border GVC emissions. As international trade rules expand from cross-border to post-border rules, traditional measures of cross-border GVC trade are no longer sufficient to capture the full extent of GVCs and their associated carbon emissions. This shift has prompted discussions on production activities related to FDI and ‘‘trade in factor income’’ (Hou et al., 2023a, 2023b [37,40]; Meng et al., 2022 [41]). While the existing literature on GVC carbon accounting has enhanced our comprehension of the environmental implications of trade in the GVC era, it overlooks the significance of the interactions between DOEs and FIEs within national borders as manifestations of GVCs. The environmental impacts of these activities within a country should not be underestimated. This concept is based on a realistic understanding of the surge in carbon emissions generated by GVCs’ international production sharing through trade and investment channels. Our findings reveal that domestic GVC emissions in China surpassed cross-border GVC emissions in 2016. Neglecting to consider domestic GVC activities may lead to inaccuracies in trade and investment policies, potentially impacting a country’s sustainable development process.
Thirdly, we present a structural decomposition analysis (SDA) framework that considers the carbon intensity effect, the interaction effect between DOEs, the effect of relational GVC activities, and the effect of final product demand to delve into the factors influencing China’s carbon emission changes. Unlike the existing studies that examine factors influencing carbon emission changes (Su et al., 2017 [42]; Su and Ang, 2023 [43]; Xiao et al., 2023 [44]; Wang et al., 2023, 2024 [45,46]), this paper focuses on how different types of GVC network structures (e.g., chain- and circle-structured relationships) impact the carbon emission variations in China. By investigating how various production network structures within GVCs influence carbon emission reductions, this paper contributes fresh insights to the literature on GVCs and sustainable development.

2. Modeling and Data Description

2.1. Relational GVC Carbon Decomposition Modeling

In the international division of production, the distribution of the value added is better described as a global value “network” rather than a global value “chain”. The GVC involves multiple flows of intermediate goods across firm boundaries, increasing the complexity of GVC production network relationships. Since both the complex network theory and input–output theory are rooted in matrix mathematics and relational data, they, therefore, share similarities (Miller and Blair, 2009 [47]; Liu et al., 2022 [48]). Therefore, some researchers have adopted a complex network analysis approach to examine the structural relationships and diverse network configurations of GVCs (Ferrarini, 2013 [49]; Ferrantino and Taglioni, 2014 [50]; Xiao et al., 2020 [24]; Gao et al., 2023 [36]). They have delved into the carbon emissions implications within GVC networks (Jiang et al., 2019a [51]; Li and Zhang, 2022 [52]; Fang et al., 2024 [53]; Huang et al., 2024 [54]). The research indicates that a country or sector’s carbon emissions are influenced by its position in the network (Jiang et al., 2019a, 2019b [51,55]; Zheng et al., 2021 [56]), and the network’s structural characteristics significantly impact the pressure to reduce emissions from export activities (Cheng et al., 2024 [57]). GVCs, identified as a distinct form of asymmetric networks (Kano, 2018 [58]), possess global, regional and local network characteristics (Tsekeris, 2017 [59]). Relational GVCs are networks of independent and interconnected firms that are mediated by intermediate goods transactions. In the context of production decentralization and investment globalization, the process of embedding GVCs in a country is also the process of continuous extension of a GVC within a country, which is directly manifested in the cyclical flow of intermediate products between different types of enterprises, and this flow is also accompanied by an increase in carbon emissions. This provides us with ideas on how to measure the carbon emissions of a relational GVC.
In order to measure the carbon emissions effect of a relational GVC, we established a relevant accounting framework based on the input–output tables provided by the OECD-AMNE database that distinguishes between DOEs and FIEs. Assuming that the world consists of G countries and N sectors and that firms in each sector are categorized into DOEs (D) and FIEs (F), the input–output structure is shown in Table 1. Where Z is the matrix of intermediate product inputs between enterprises, and S and T represent two different countries. Z D D S S and Z F F S S represent the intermediate inputs between the DOEs in country S and between the FIEs in country S, respectively. Z D F S T denotes the products produced by the DOEs in country S, which are placed into the reproduction of FIEs in country T as intermediate products. Z F D S T denotes the products produced by the FIEs in country S, which are placed into the reproduction of DOEs in country T as intermediate products. Y i S T ( i = D , F ) denotes the products in country S that are directly consumed by country T as final goods; V a i S ( i = D , F ) denotes the vectors of the value added by the DOEs and FIEs in country S; X i S ( i = D , F ) denotes the vectors of total output DOEs and FIEs in country S.
Based on Table 1, the row constant equation for input and output is expressed as Z + Y = X. The intermediate product (Z) is calculated as the direct consumption coefficient (A) multiplied by the total output (X), which is presented in matrix form:
A 1 1 A 1 2 A 1 G A 2 1 A 2 2 A 2 G A G 1 A G 2 A G G X 1 X 2 X G + Y 1 Y 2 Y G = X 1 X 2 X G
Among them, A G G = A d d GG A d f GG A f d GG A f f GG ; Y G = Y d G Y f G ; X G = X d G X f G .
By shifting terms and combining like terms, Equation (1) can be rewritten as:
X 1 X 2 X G = B 1 1 B 1 2 B 1 G B 2 1 B 2 2 B 2 G B G 1 B G 2 B G G Y 1 Y 2 Y G
where B = I A 1 denotes the global Leontief inverse matrix, which is the key to our characterization of the GVC production network. B reflects the economic linkages between firms in different countries around the global and portrays the interactions between global firms. Indeed, the Leontief inverse matrix is essentially the structure of the global value chain network obtained by summing up in the limit the structure of the static (I), the first-order flows (A), and any higher-order flows ( A k , k > 1 ), i.e., B = lim n I + A + A 2 + + A n . And it is a limit summation of node connectivity in a dynamic flow network, which can be regarded as a special network analysis method. More importantly, the global Leontief inverse matrix, which includes the firm dimension, effectively captures the interconnected relationships between firms. It illustrates the production interactions of the intermediate goods that traverse borders or firm boundaries multiple times (Yue et al., 2024 [14]), enabling the measurement of relational GVCs. Further decomposition of the global Leontief inverse matrix yields:
B 1 1 B 1 2 B 1 G B 2 1 B 2 2 B 2 G B G 1 B G 2 B G G = L 1 1 0 0 0 L 2 2 0 0 0 L G G + 0 B 1 2 B 1 G B 2 1 0 B 2 G B G 1 B G 2 0 + F 1 1 0 0 0 F 2 2 0 0 0 F G G
where B G G = B d d GG B d f GG B f d GG B f f GG ; L G G = L d d GG L d f GG L f d GG L f f GG = E 0 0 E A d d GG A d f GG A f d GG A f f GG 1 ; F G G = F d d GG F d f GG F f d GG F f f GG = B d d GG B d f GG B f d GG B f f GG L d d GG L d f GG L f d GG L f f GG , E denotes a N × N unit matrix.
Equation (3) represents the production interaction relationship between enterprises based on the intermediate goods transactions. Among them, L represents the production interaction relationship among domestic enterprises, which characterizes the circular flow of intermediate goods among different enterprises in the country. Distinguishing between different types of inter-firm production interactions, L can be further categorized as:
L 1 1 0 0 0 L 2 2 0 0 0 L G G = K 1 1 0 0 0 K 2 2 0 0 0 K G G + H 1 1 0 0 0 H 2 2 0 0 0 H G G + D 1 1 0 0 0 D 2 2 0 0 0 D G G
where
L d d GG L d f GG L f d GG L f f GG L G G = K d d GG 0 0 K f f GG K G G + 0 L d f GG L f d GG 0 H G G + L d d GG K d d GG 0 0 L f f GG K f f GG D G G
Among them, K d d GG = I A d d GG 1 0 0 0 ; K f f GG = 0 0 0 I A f f GG 1 .
In Equation (5), the first item K G G is the interaction relationship between enterprises of the same type (DOEs or FIEs); the second item H G G is a chain-structured relationship, where the intermediate products circulate between DOEs and FIEs. This production structure is similar to the chain structure in complex networks. In this case, intermediate products move from DOEs to FIEs or from FIEs to DOEs like a chain; the third item D G G is a circle-structured relationship. In this case, the intermediate goods interaction starts and ends at the same point, either as “DOEs-DOEs” or “FIEs-FIEs”. Although the circle-structured relationship also represents a circular flow of intermediate goods between DOEs and FIEs, it is distinct from a chain structure, as it forms a closed loop. In order to distinguish it from a chain structure, we define it as a circle-structured relationship, as shown in Figure 1.
Correspondingly, the production interactions between domestic and foreign firms can also be categorized based on this. In Equation (3), the second term represents the chain-structured relationship. In this case, intermediate goods not only cross the border of enterprises but also cross-national borders, with the flow of intermediate goods beginning and ending with enterprises in different countries (national borders). The third item represents the circle-structured relationship. In this case, intermediate goods interactions begin and end with domestic firms, indicating a situation where intermediate goods cross the border (namely, export) and eventually return to the country.
By combining Equations (2)–(5), we can obtain:
X 1 X 2 X G = K 1 1 0 0 0 K 2 2 0 0 0 K G G + H 1 1 0 0 0 H 2 2 0 0 0 H G G + D 1 1 0 0 0 D 2 2 0 0 0 D G G Y 1 Y 2 Y G + 0 B 1 2 B 1 G B 2 1 0 B 2 G B G 1 B G 2 0 + F 1 1 0 0 0 F 2 2 0 0 0 F G G Y 1 Y 2 Y G
In order to investigate the environmental impacts of relational GVCs, this paper utilizes the decomposition model proposed by Yue et al. (2024) [14] and draws on the existing literature (Zhu et al., 2022 [3]; Hou et al., 2023a [37]). This study introduces carbon intensity coefficients ( e i S = E i S / X i S ) to obtain the column vectors of carbon emissions of each sector in different countries:
E i 1 E i 2 E i G = e i 1 0 0 0 e i 2 0 0 0 e i G X 1 X 2 X G
where E i S denotes the column vector of country S’s carbon emissions. Let B 1 = K d d S S ; B 2 = K f f S S ; B 3 = L d f S S + L f d S S ; B 4 = D d d S S + D f f S S ; B 5 = t ( B d d S T + B d f S T + B f d S T + B f f S T ) , T S ; B 6 = F d d S T + F d f S T + F f d S T + F f f S T . Combining Equations (6) and (7), the carbon emissions due to different production activities in an economy can be expressed as follows:
E S = e ^ S B 1 Y μ T 1 + e ^ S B 2 Y μ T 2 + e ^ S B 3 Y μ T 3 + e ^ S B 4 Y μ T 4 E _ G V C d + e ^ S B 5 Y μ T 5 + e ^ S B 6 Y μ T 6 E _ G V C f
Equation (8) categorizes an economy’s carbon emissions into six terms. Among them, T1 represents the emissions generated by the interaction between DOEs. This type of production activity is only related to DOEs, neither involving FDI nor is it cross-border; T2 represents the emissions generated by the interaction between FIEs; T3 represents the emissions generated by the chain-structured relationship activity between the DOEs and FIEs, which portrays the carbon emissions caused by the interaction between the DOEs and FIEs. For example, the production of Tesla’s Model Mode car in China requires the use of some parts and components produced by local Chinese enterprises, such as the electric pile structural parts and battery pack shells, resulting in carbon emissions. T4 represents the emissions generated by the circle-structured relationship between the DOEs and FIEs, which depicts the emissions generated by the complex interactive relationship between the DOEs and FIEs, and it is a special case of T3. T5 represents the emissions generated by the chain-structured relationship, which portrays the carbon emissions caused by the interaction activities between domestic and foreign firms, such as the carbon emissions caused by the American enterprise using the hard disk produced by the Chinese enterprise to manufacture smartphones for its own consumers. The Chinese enterprises here may be either DOEs or FIEs in China. T6 represents the emissions generated by the activities of the circle-structured relationship, which also measures the interactions among domestic and foreign firms, where the intermediate goods cross the border and eventually return to the country.
The distinction between G V C d and G V C f in Equation (8) is based on the scope of the Leontief inverse matrix. Specifically, T5–T6 represent traditional cross-border GVC production activities, measuring the carbon emissions from cross-border trade relationships for intermediate goods (i.e., cross-border GVC carbon emissions). On the other hand, T2–T4 are linked to FIEs, such as subsidiaries of multinational corporations, and measure the carbon emissions from production interactions involving these firms within the host country. As subsidiaries of multinational corporations in the host country involve foreign factors of production crossing borders but operate within the country, this paper categorizes them as domestic GVC emissions. The relational GVC emissions are then expressed as E _ G V C = E _ G V C d + E _ G V C f .

2.2. SDA Decomposition of Carbon Emissions Changes

In order to investigate the impact of relational GVCs on China’s environment, this paper analyzes the changes in carbon emissions by the SDA method, using the “two polar decomposition averaging method” (Dietzenbacher and Los, 1998 [60]), which is a common method for factor decomposition:
Δ E s = E t s E t 1 s = 1 2 ( e ^ t s e ^ t 1 s ) B t 1 s Y t 1 μ + ( e ^ t s e ^ t 1 s ) B t s Y t μ + 1 2 e ^ t s ( B t s B t 1 s ) Y t 1 μ + e ^ t 1 s ( B t s B t 1 s ) Y t μ + 1 2 e ^ t s B t s ( Y t Y t 1 ) μ + e ^ t 1 s B t 1 s ( Y t Y t 1 ) μ = C ( Δ e ^ s ) + C ( Δ B s ) + C ( Δ Y )
Further, combined with Equation (8), Equation (9) can be further decomposed into (Table 2):
Δ E s = C ( Δ e ^ d s ) + C ( Δ e ^ f s ) + C ( Δ T 1 ) + C ( Δ T 2 ) + C ( Δ T 3 ) + C ( Δ T 4 ) + C ( Δ T 5 ) + C ( Δ T 6 ) + C ( Δ Y d S ) + C ( Δ Y f S ) + C ( Δ Y ( S ) S ) + C ( Δ Y d S ) + C ( Δ Y f S ) + C ( Δ Y ( S ) ( S ) )

2.3. Description of Data

The relevant data were obtained from three databases. (1) The AMNE database, which contains ICIO tables distinguishing between DOEs and FIEs from 2005 to 2016, covers a total of 34 sectors (Cadestin et al., 2018 [29]). Each sector in the ICIO table between economies is disaggregated into DOEs and FIEs. The classification of DOEs and FIEs is based on the controlling ownership of at least 50%. (2) The OECD-ICIO table (version 2021) covers the input–output data between 1995 and 2018 for 67 economies, each of which contains 45 sectors (industries). (3) The environmental accounts contain CO2 emissions from 56 sectors (industries) in 43 countries (or regions), with the data years covering 2000–2016 (Corsatea et al., 2019 [61]). Combining the time intervals of the three databases, the sample period for this paper is, therefore, 2005–2016. Prior to data processing, we categorized and matched them into 34 sectors.
The databases mentioned do not differentiate between the carbon emissions from DOEs and FIEs. To address this issue, we drew on the methodology outlined by Hou et al. (2023a) [37] and Sun et al. (2023) [12] and classified the emissions based on the intermediate use of money in the relevant energy sectors, including “B Energy Production Product Mining and Extraction” and “C19 Coke and Refined Petroleum Products.” Using the corresponding monetary intermediate use of these two energy industries, the carbon emissions are proportionally decomposed according to the two types of enterprises. The descriptive statistics on carbon emissions by sector and by DOEs and FIEs are shown in Table 3.

3. Empirical Findings

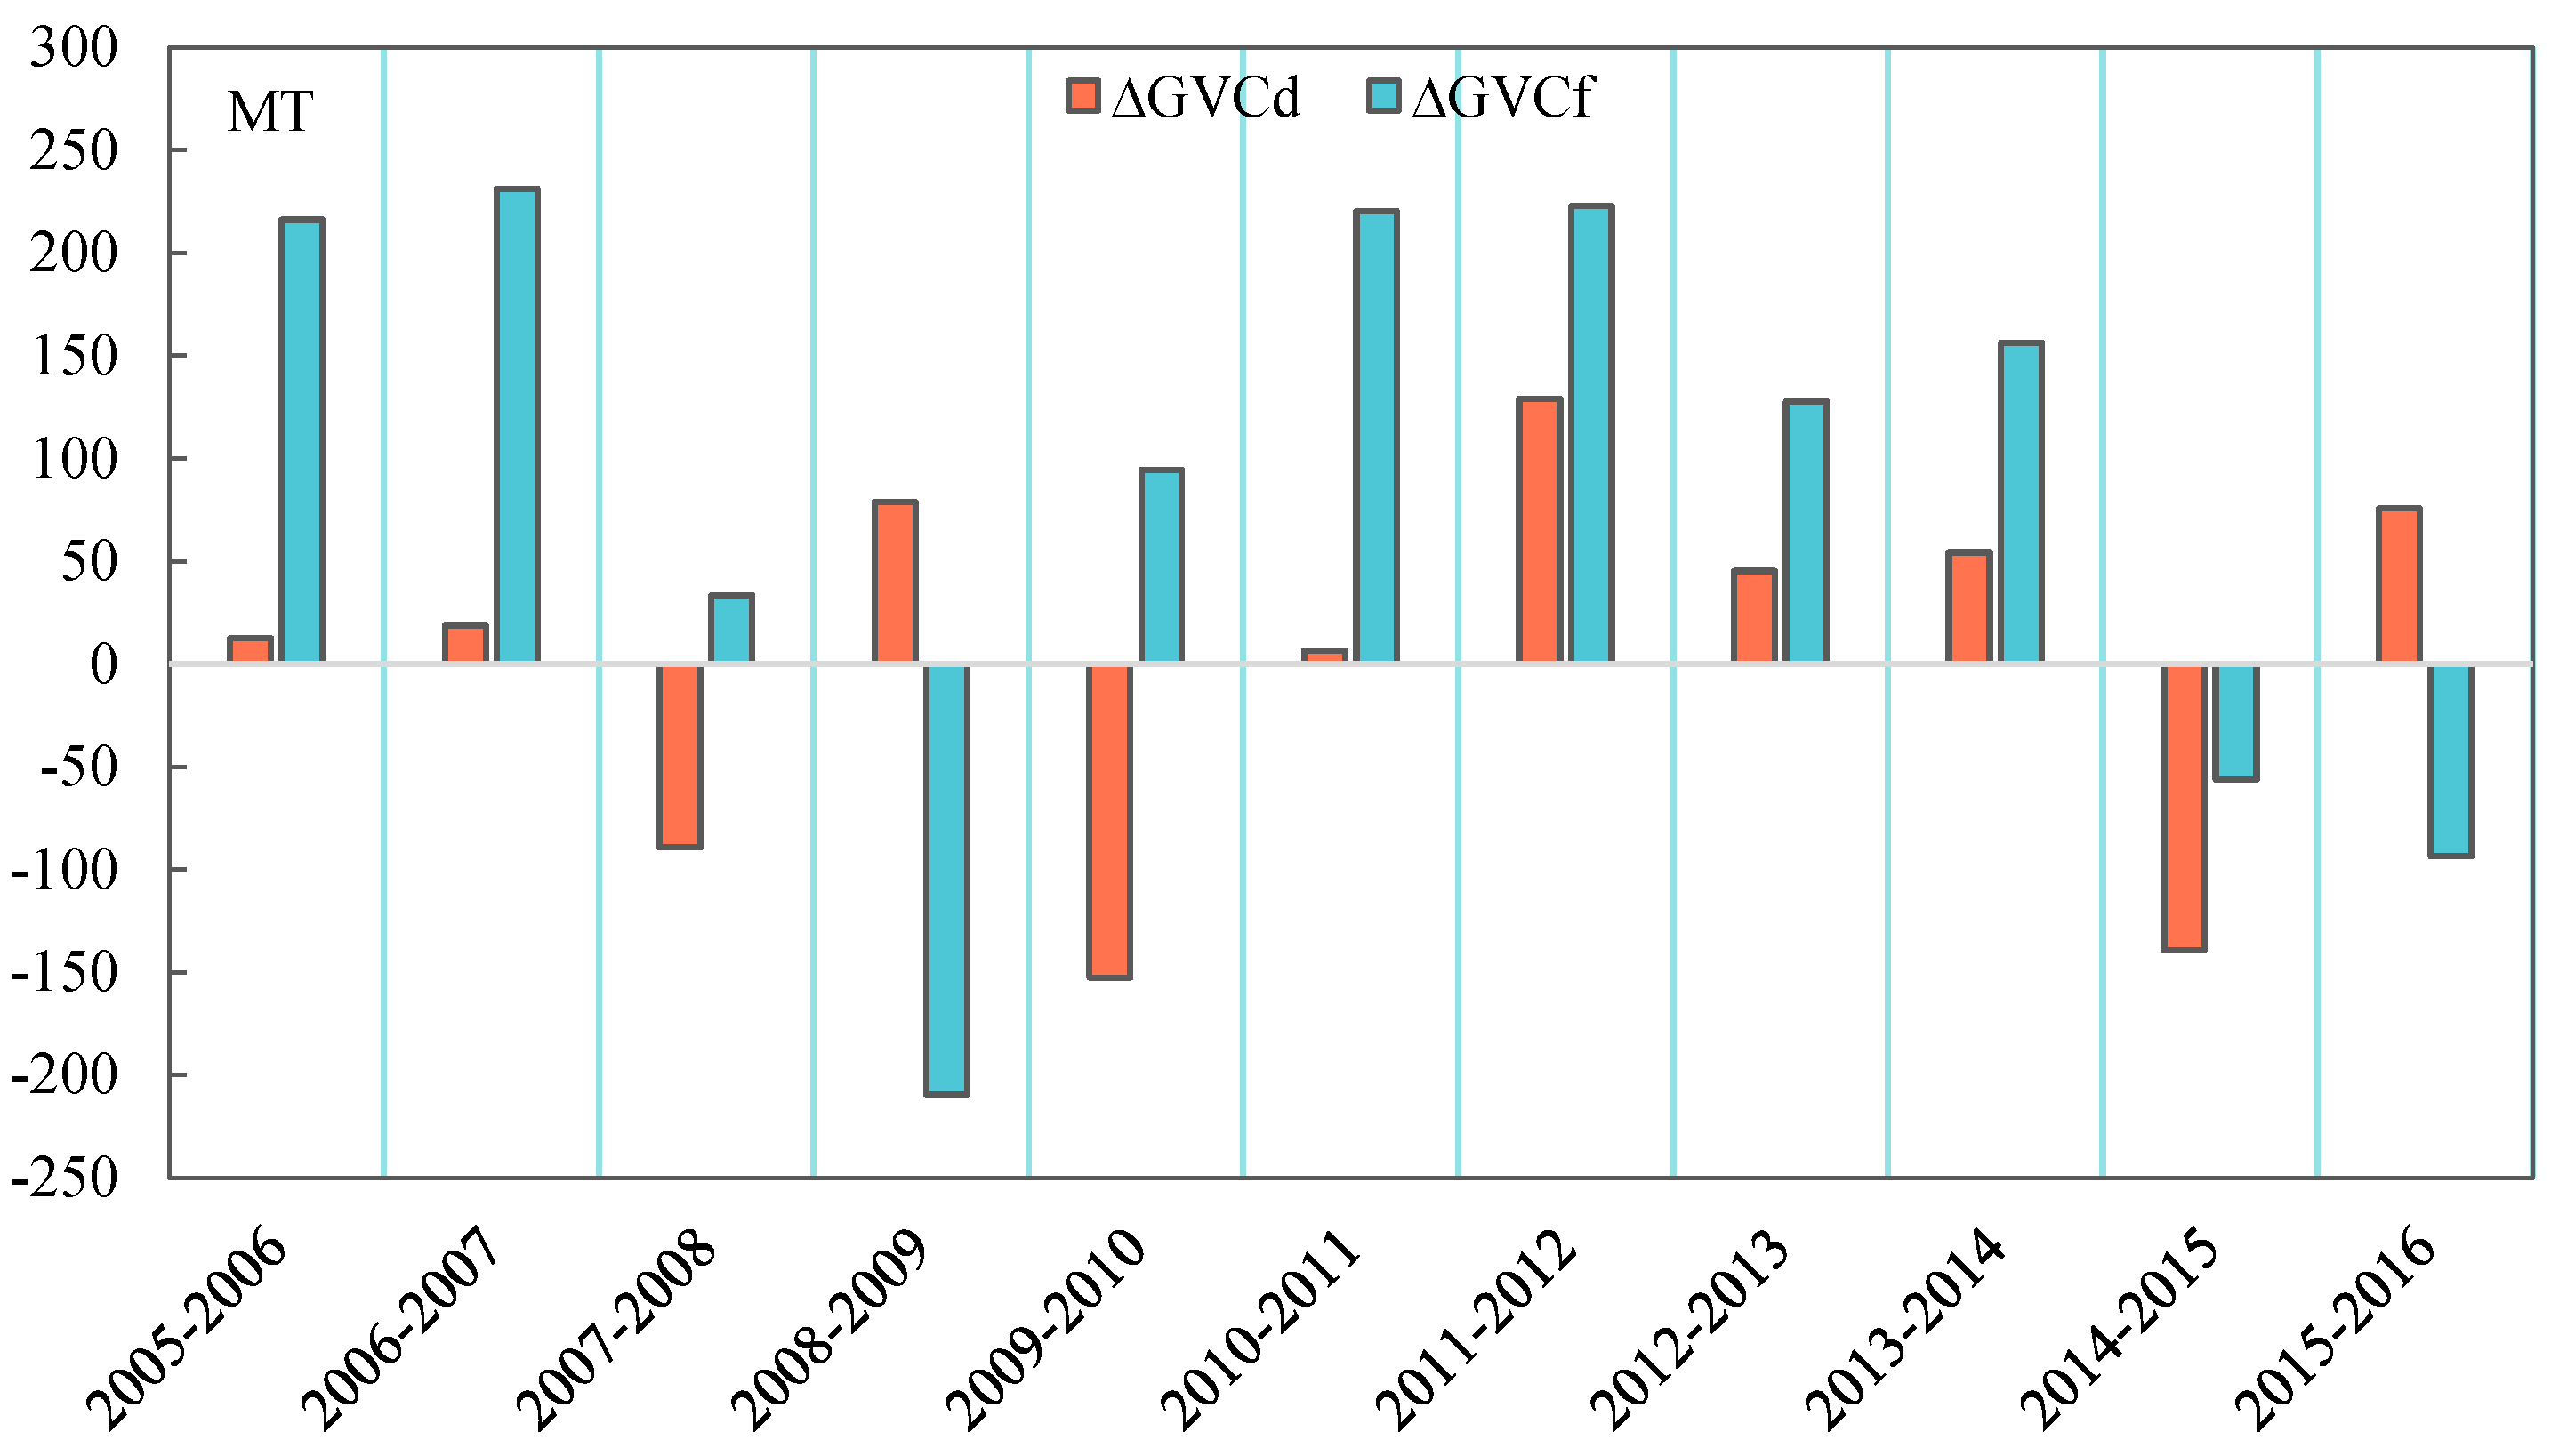
3.1. China’s Relational GVC Emissions: An Overall Analysis

As shown in Figure 2a, despite the fact that the emissions resulting from the interaction between DOEs remain the primary source of emissions, accounting for 69.77–75.89%, it is noteworthy that relational GVC activities have also become a significant contributor to China’s carbon emissions. Specifically, in 2016, relational GVC activities were responsible for 1981.6 million tons (MT) of carbon emissions, representing around 24.11% of the total carbon emissions. On average, this proportion was at 26.8% throughout the sample period. In terms of trends, the share of relational GVC emissions is on the decline (from 27.97% in 2005 to 24.11% in 2016), and this decline is mainly reflected in cross-border GVC activities. During the sample period, the share of cross-border GVC emissions decreased from 16.85% in 2005 to 11.87% in 2016. In stages, the decline in the share of cross-border GVC emissions mainly occurred during the financial crisis (2008–2009). After the financial crisis, although the share of cross-border GVC emissions rebounded, the overall trend remained downward. Notably, cross-border GVCs are closely related to GVC trade activities, and this result correlates with the decline in GVC trade activities after the financial crisis and the ensuing trend of slower globalization (Wang et al., 2021 [26]). In contrast, the overall share of domestic GVC emissions is increasing, from 11.12% in 2005 to 12.24% in 2016. In terms of scale, the scale of relational GVC emissions increased by 336.52 MT between 2005 and 2016, and this growth occurred mainly in domestic GVC emissions (+351.69 MT), while the scale of cross-border GVC emissions decreased by 15.17 MT. The comparative analysis found that although cross-border GVC emissions are overall higher than domestic GVC emissions, the scale of domestic GVC emissions has been expanding, reaching its highest point in 2014 (1215.55 MT), and domestic GVC emissions exceeded the cross-border GVC emissions in 2016. The above findings highlight the important role of domestic relational GVC activities in China’s implementation of carbon reduction policies. While it is important to explore the environmental impacts of a country’s global value chain division of labor, as reflected through international trade, inter-firm interactions related to FIEs with orderly inflows of capital from outside the country are also a form of international trade and economic exchange. These interactions have significant impacts on a country’s environment, which should not be underestimated. Zhu et al. (2022) [3] and Yan et al. (2023b) [6] also confirmed the important role of FDI-related production activities in global carbon mitigation. Neglecting to consider domestic GVC activities might lead to miscalculations of investment and environmental policies, which is not conducive to the realization of carbon peaking and carbon neutrality targets, ultimately affecting China’s sustainable development.
Further, different types of relational GVC emissions are considered, as shown in Figure 2b. The domestic GVC production network-induced carbon emissions are dominated by chain-structured relationship activities (T3), which accounted for 7.04% of the total carbon emissions in 2016. This was followed by the circle-structured (T4, 4.48%) and interaction relationship activities between FIEs (T2, 0.71%). Studies have shown that the multiplier effects of FIEs are smaller than their spillover effect, with MNE subsidiaries primarily influencing the sustainable development practices of the host country through interactions between DOEs and FIEs (Hou et al., 2023a) [37] and not just within FIEs themselves. Although chain-structured activities result in higher emissions compared to circle-structured activities, the proportion of emissions from circle-structured relations has shown a significant increase, particularly after 2010. The share of circle-structured relations leading to emissions rose from 3.30% in 2010 to 4.48% in 2016, while the share of chain-structured activities leading to emissions decreased during the same period. In cross-border GVC emissions, the chain-structured relationship activities are dominant (T5). In 2016, emissions induced by chain- and circle-structured relationships accounted for 11.46% and 0.41% of total carbon emissions, respectively. The trend analysis shows a significant decline in chain-structured relationship activities since 2008, with a noticeable downward trend continuing despite localized reversals after 2009. Correspondingly, emissions from circle-structured relationships have generally increased since 2009 and reached a peak of 50.28MT (0.51%) in 2014.
Figure 3 illustrates the annual growth rate of the carbon emissions resulting from relational GVCs relative to 2005. Relational GVC emissions increased by 20.46% (+336.52 MT) over the entire study period, which is mainly derived from the growth of domestic GVC emissions. Between 2005 and 2016, domestic GVC emissions increased by 53.77% (+351.69 MT) compared to 2005, while cross-border GVC emissions decreased by 1.53% (−15.17 MT). Drilling down to the relational GVC structural characteristics, it is observed that after 2009, compared with the fluctuating growth rates of chain-structured relationships in both domestic and cross-border GVC production networks (T3, T5), the growth rate of circle-structured relationship activities continued to increase and peaked in 2014 (T4, T6). In 2014, emissions caused by circle-structured relationships between DOEs and FIEs (T4) and between domestic and foreign firms (T6) increased by 106.06% and 134.54%, respectively, compared to 2005. Although there was a decline after 2014, the growth rate remained higher than that of chain-structured relationship activities in the same period. Although the chain-structured relationships result in higher carbon emissions than the circle-structured ones in terms of scale (Figure 2b), the circle-structured relationships show a higher potential for carbon growth in relational GVC emissions. Circle-structured relationship activities involve intermediate goods interactions between firms with the same starting and ending points, and circle-structured networks are resilient to control (Yue et al., 2024 [14]), making the inter-firm relationships involved in such production networks more “sticky’’, which makes it more challenging for the implementation of carbon emission reduction policies. In practice, Apple and Facebook have committed to becoming carbon neutral by 2030 and are pushing their production suppliers to hasten the adoption of carbon reduction measures. Therefore, when tracking carbon emissions in GVCs to develop reduction policies, it is crucial to consider the varying environmental impacts of different production network patterns.

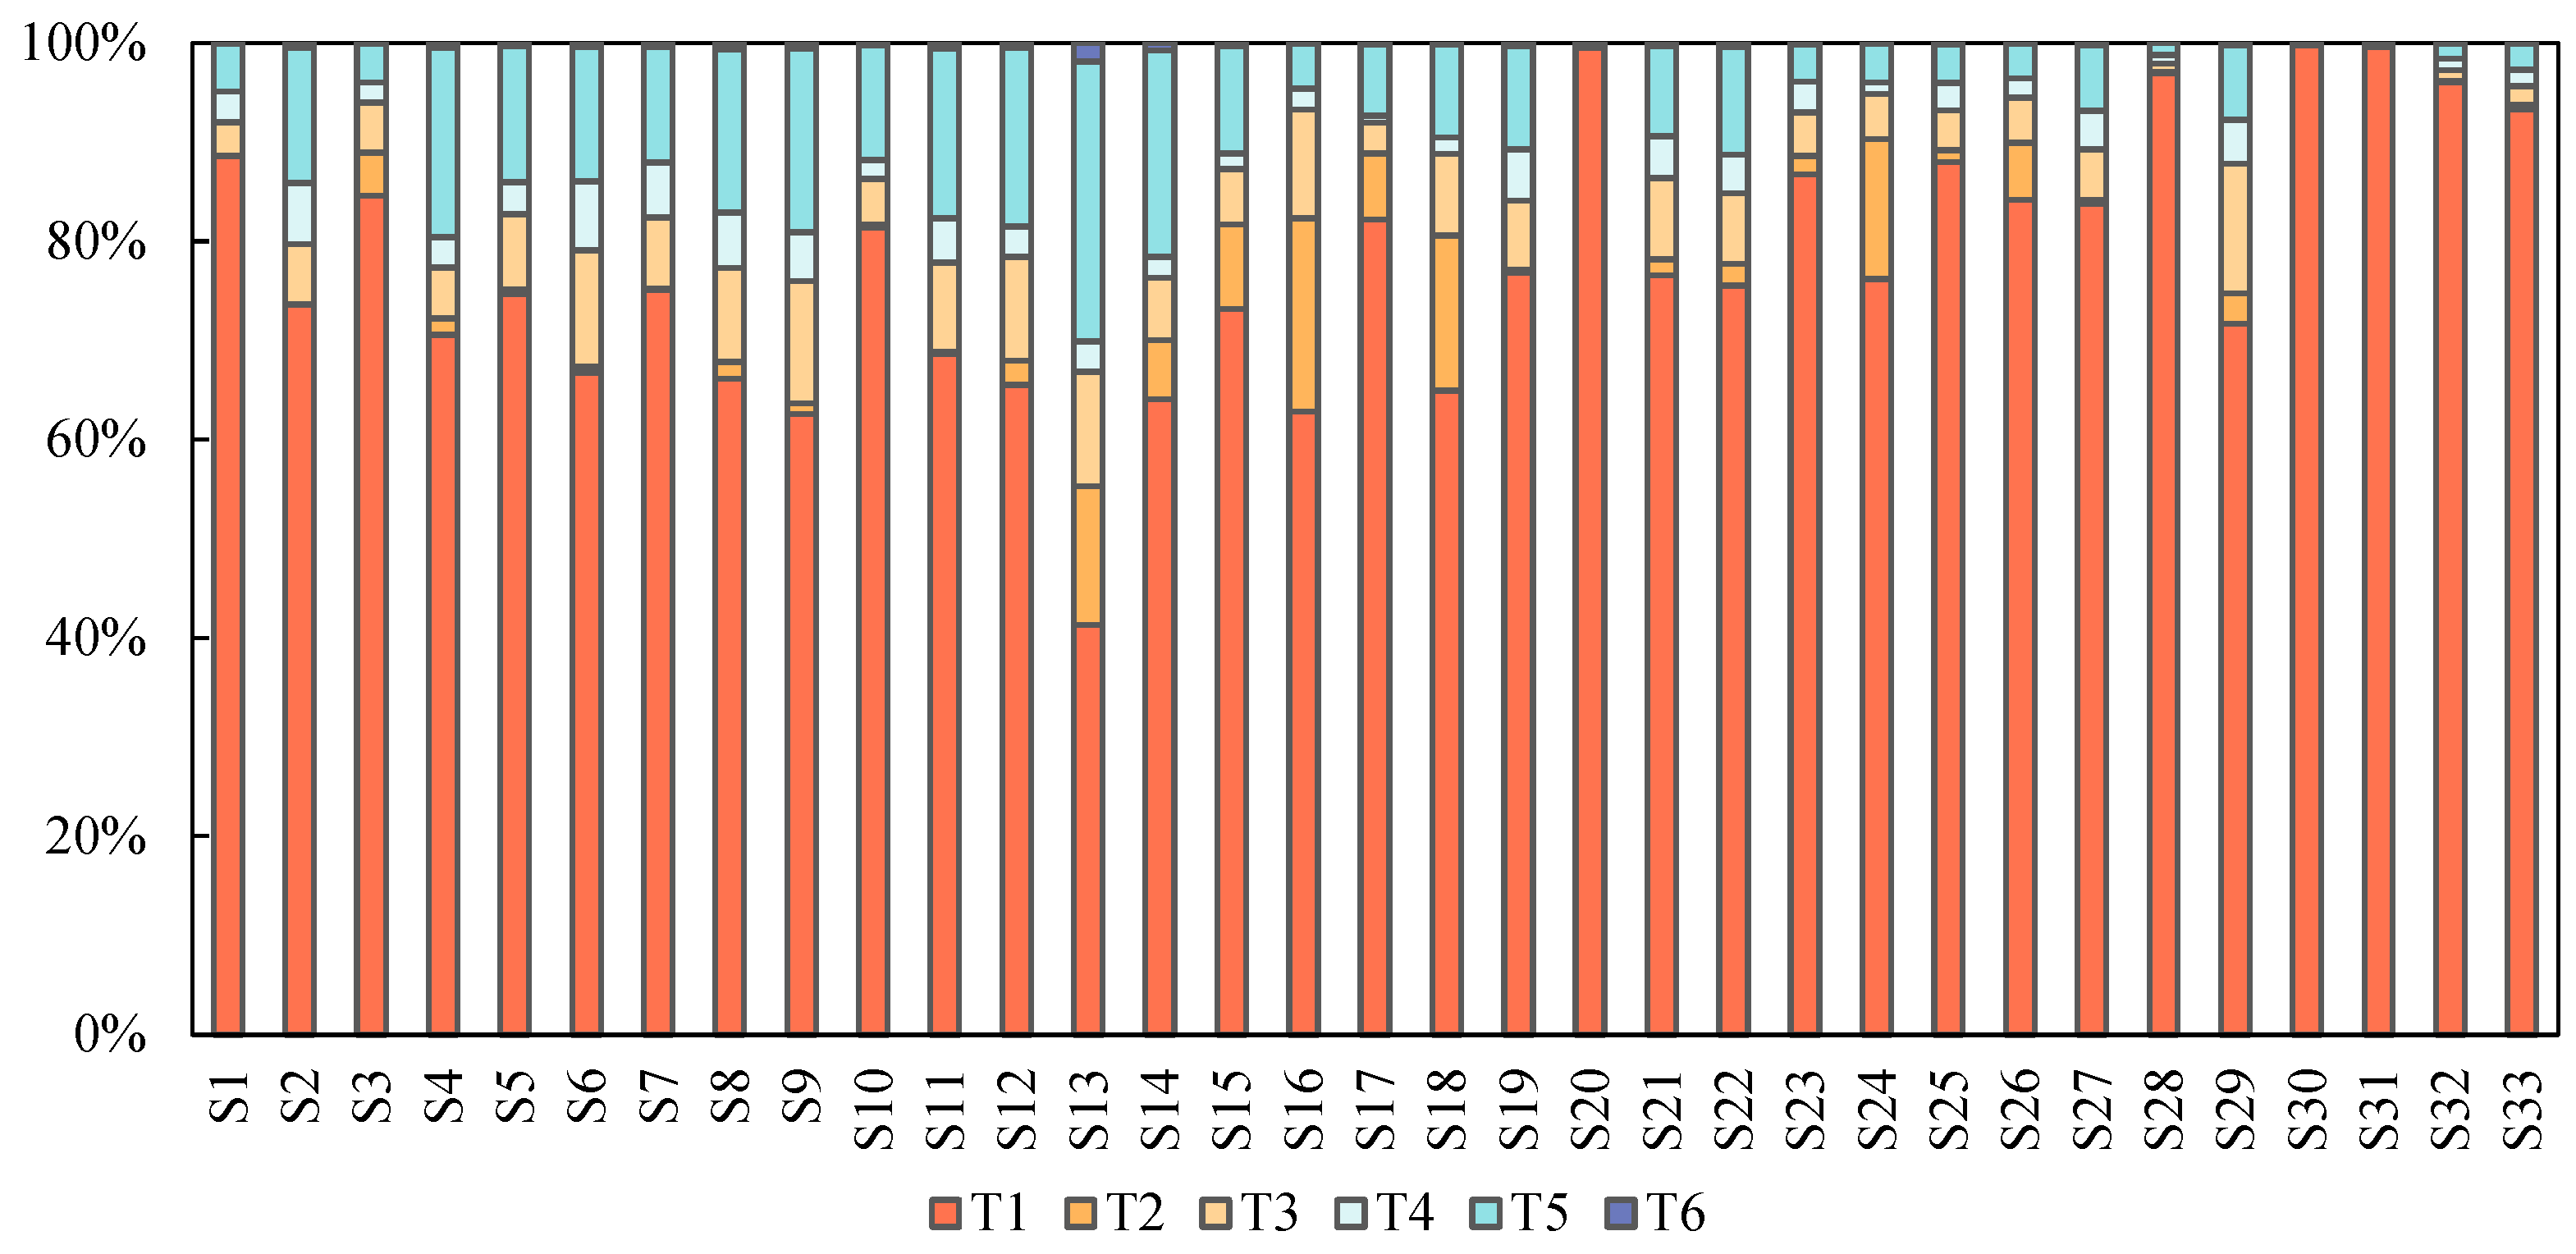
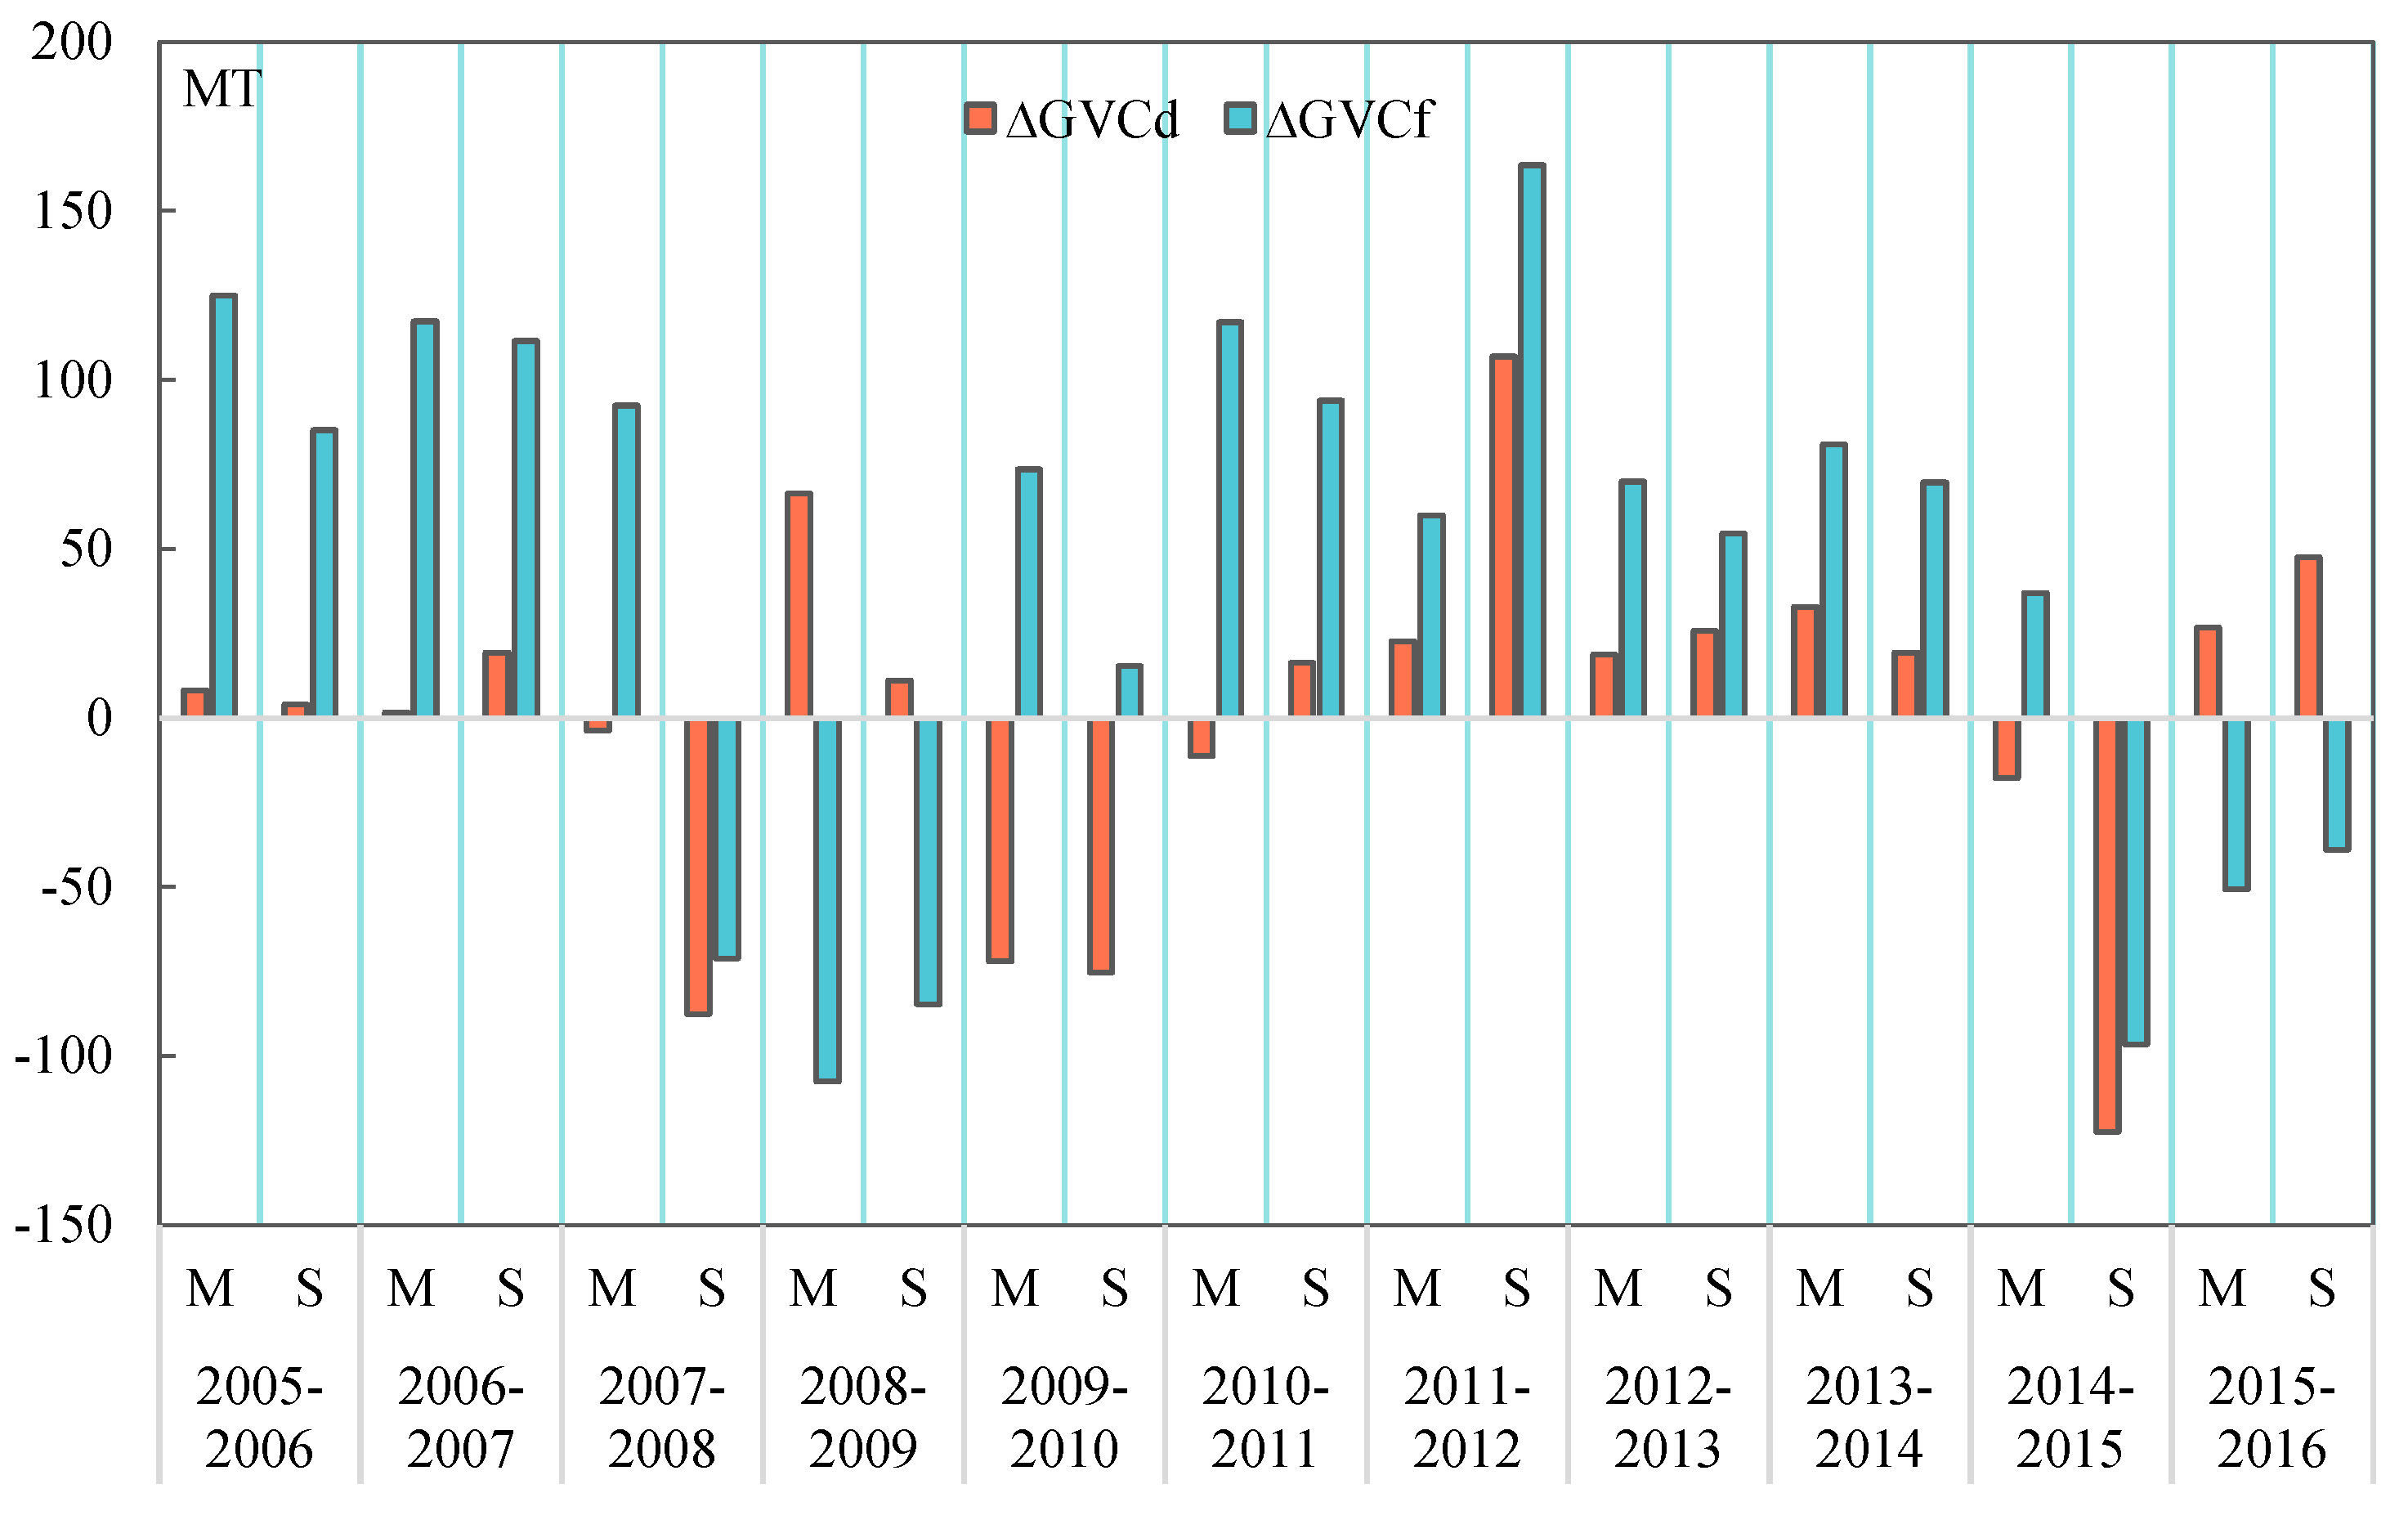
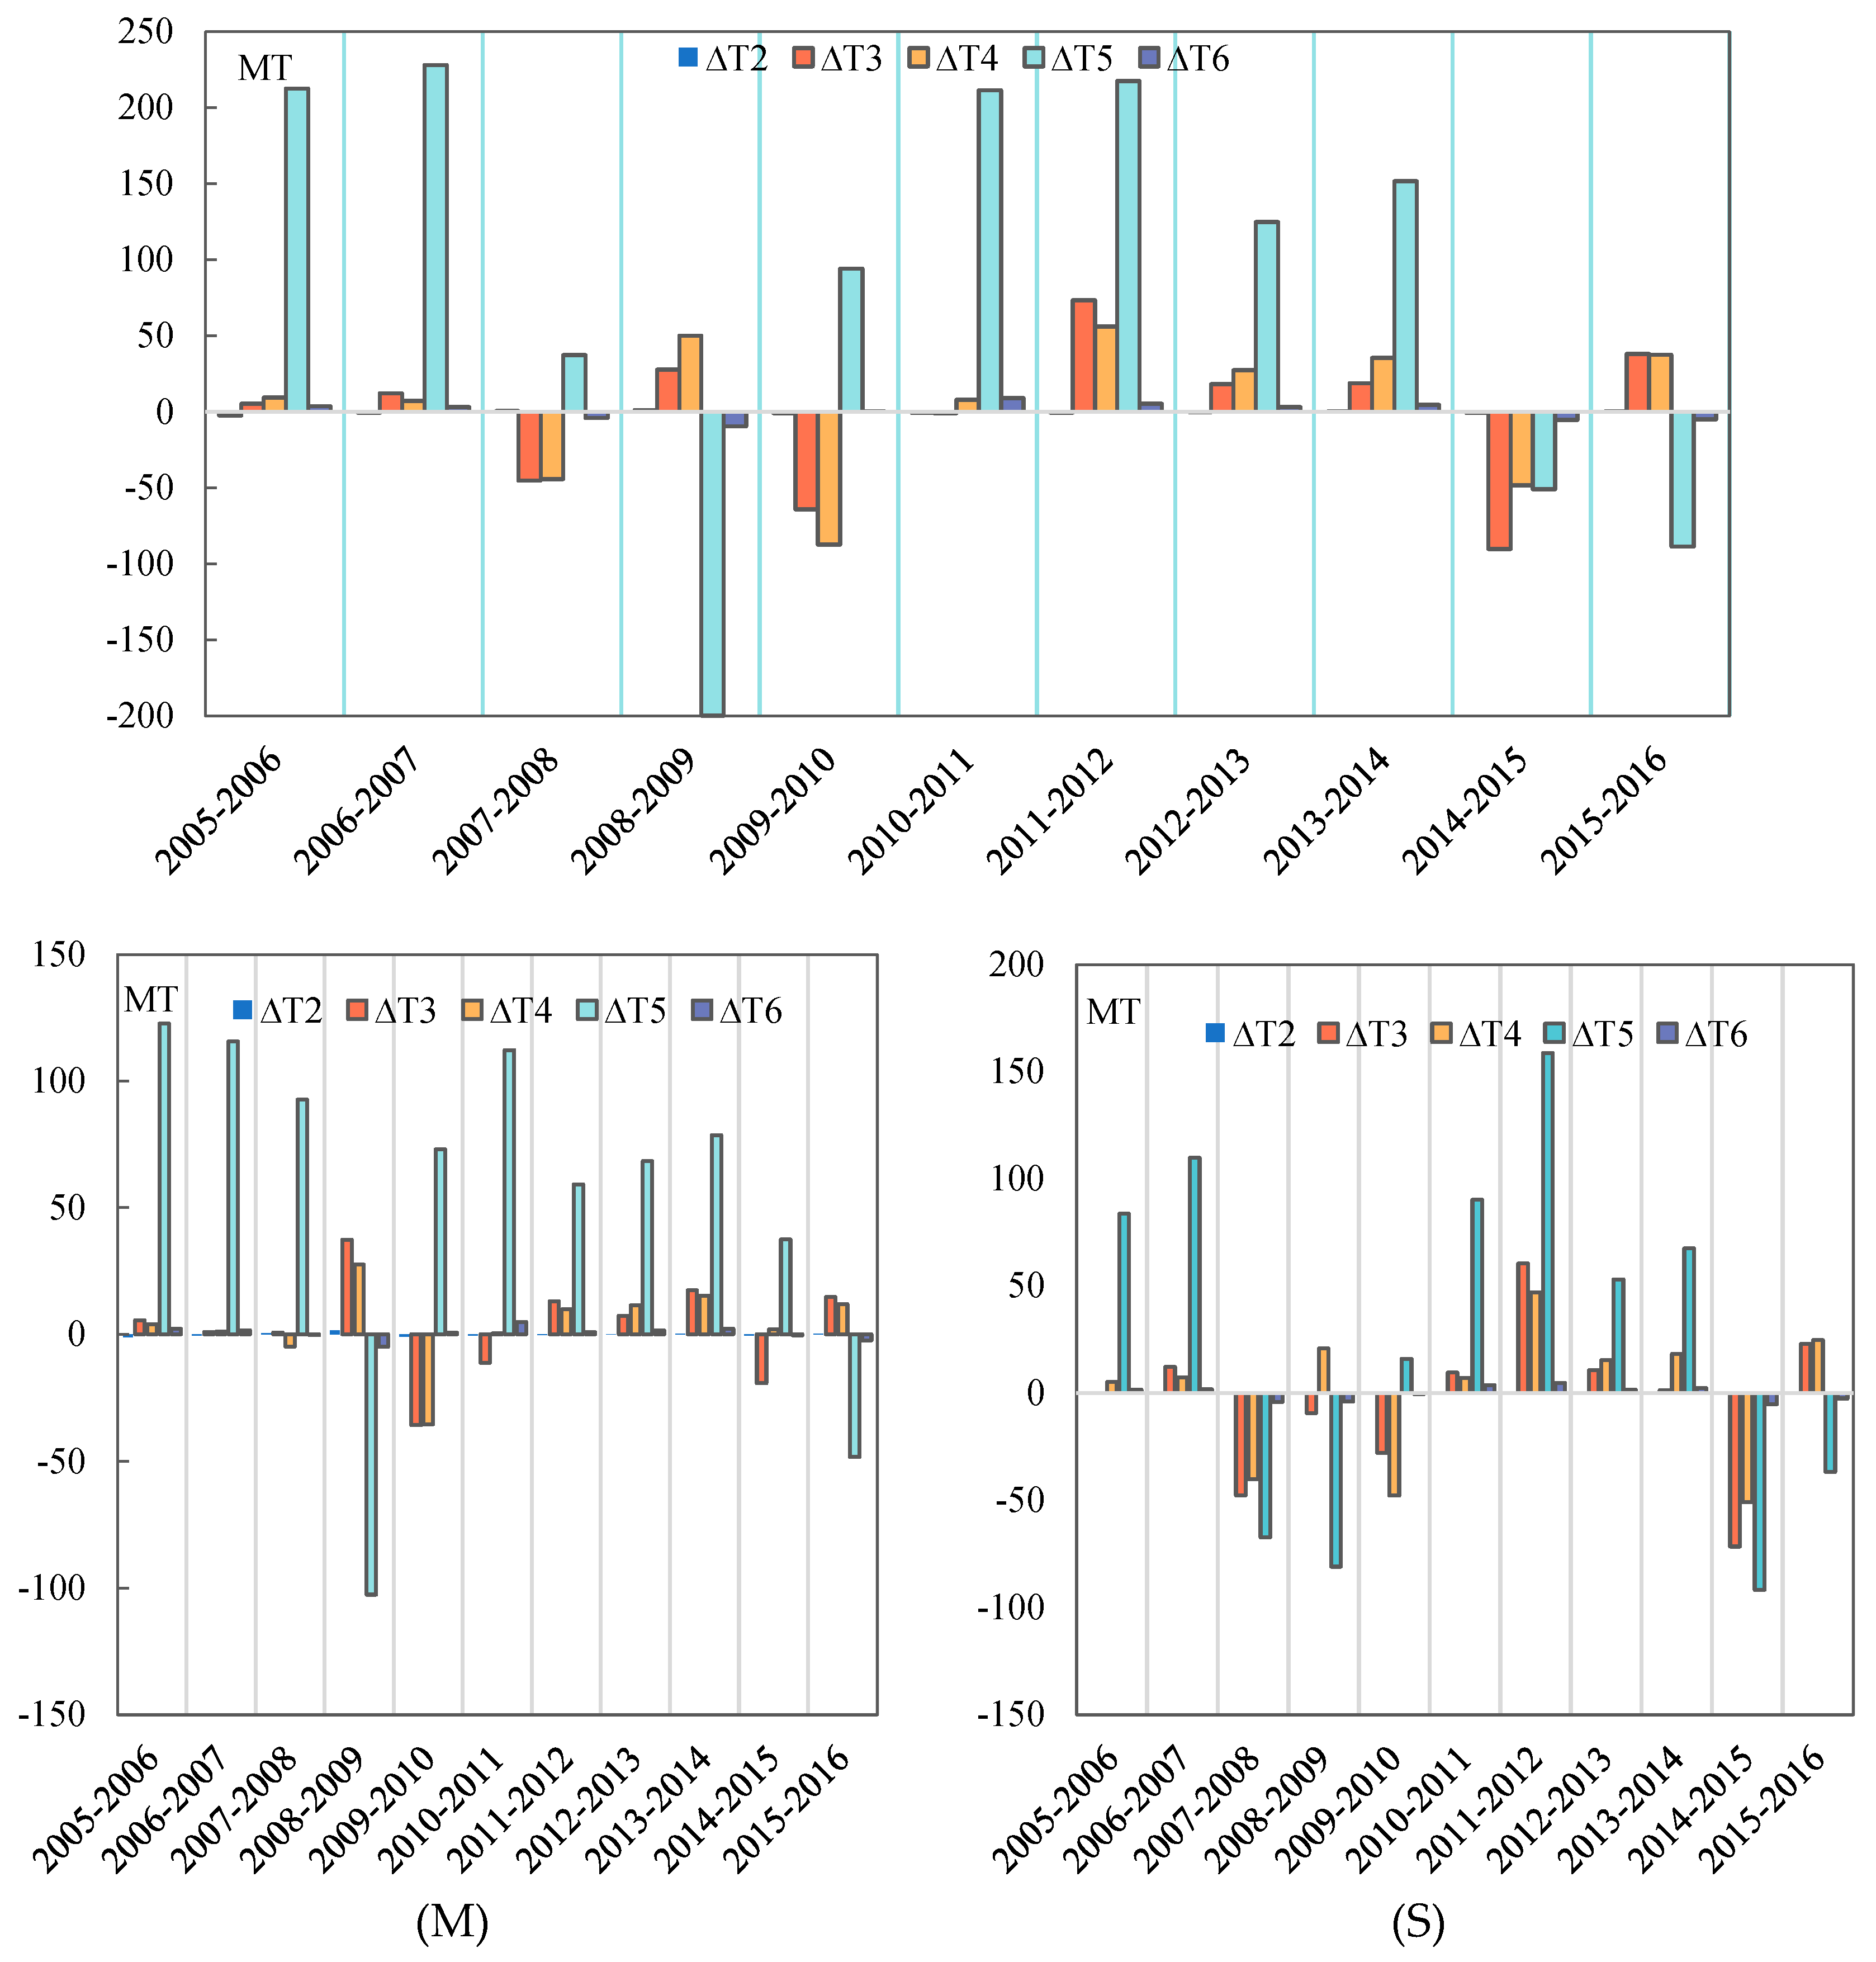
3.2. China’s Relational GVC Emissions: Sectoral Analysis

The sectoral analysis indicates (Figure 4) that the interactive activities between DOEs are the main source of emissions in each department. In 2016, the carbon emissions resulting from these activities accounted for more than 60% of each department, surpassing the proportion of relational GVC emissions. The information and communication technology sector (i.e., ICT manufacturing) is an exception, accounting for only 41.32% of the sector’s carbon emissions in 2016. This is mainly due to the fact that the ICT sector is a representative sector of GVC, with a typical “Made in the World” label (Xiao et al., 2020 [24]). In 2016, emissions from the ICT manufacturing sector (S13) were predominantly attributed to relational GVC-related activities, accounting for 58.68%. Up until now, China has become the world’s most influential producer, exporter and consumer of electronic products, evidenced by the rise of smartphones in China (Xing and Huang, 2021 [62]). Delving into the composition of carbon emissions by sector at a more disaggregated level, the activities of inter-firm interactions between FIEs in some sectors play an important role. For example, the interaction activities between FIEs in the ICT manufacturing industry (S13), automobile industry (S16), other manufacturing industries (S18), as well as the publishing, audio-visual and broadcasting industries (S24) account for 13.96%, 19.46%, 15.65% and 14.10% of the corresponding sectors’ carbon emissions, respectively. However, on the whole, the carbon emissions related to FIEs in each sector are more reflected in the chain and circle structures, with emissions from the chain structure being higher than those from the circle structure. In the cross-border GVC emissions, the carbon emissions of each department primarily originate from the chain-structured relationship, and the circle-structured relationship accounts for a relatively small proportion.
Domestic and cross-border GVC emissions exhibited varied structural characteristics in different sectors (Figure 5). In general, the carbon emissions from relational GVC activities are higher in the service sector (S19–S33) than in the manufacturing sector (S3–S18), with domestic GVC emissions being particularly pronounced. In 2016, the carbon emissions from domestic GVC activities in the service sector reached 476.38 MT, exceeding those of the manufacturing sector, which was 374.64 MT. Moreover, the domestic GVC emissions in all sectors of the service sector exceeded the cross-border GVC emissions, with the exception of the S19 sector, a feature that is most pronounced in the S24 and S29 sectors. This result is closely related to the reality that the establishment of subsidiaries of multinational enterprises in host countries is closely linked to domestic GVCs, with many of these subsidiaries providing services in host countries through foreign affiliates, resulting in the generation of carbon emissions. The existing literature tracing carbon emissions from GVCs focuses more on manufacturing emissions due to cross-border GVCs and overlooks the service emissions due to domestic GVC activities, which is not conducive to the formulation of relevant carbon reduction policies. Several studies have helped us to understand the domestic GVC production activities by tracing the CO2 emissions of MNEs (Yan et al., 2023a, 2023b [5,6]). For the manufacturing sector, overall, the cross-border GVC emissions are higher than the domestic GVC emissions, but they are different in the sub-sectors. In the automotive sector (S16), the domestic GVC emissions are significantly higher than the cross-border GVC emissions (7.07 times). This result is not only related to China’s mature utilization of foreign investment but also the strong demand in the domestic automotive market, resulting in increased carbon emissions.

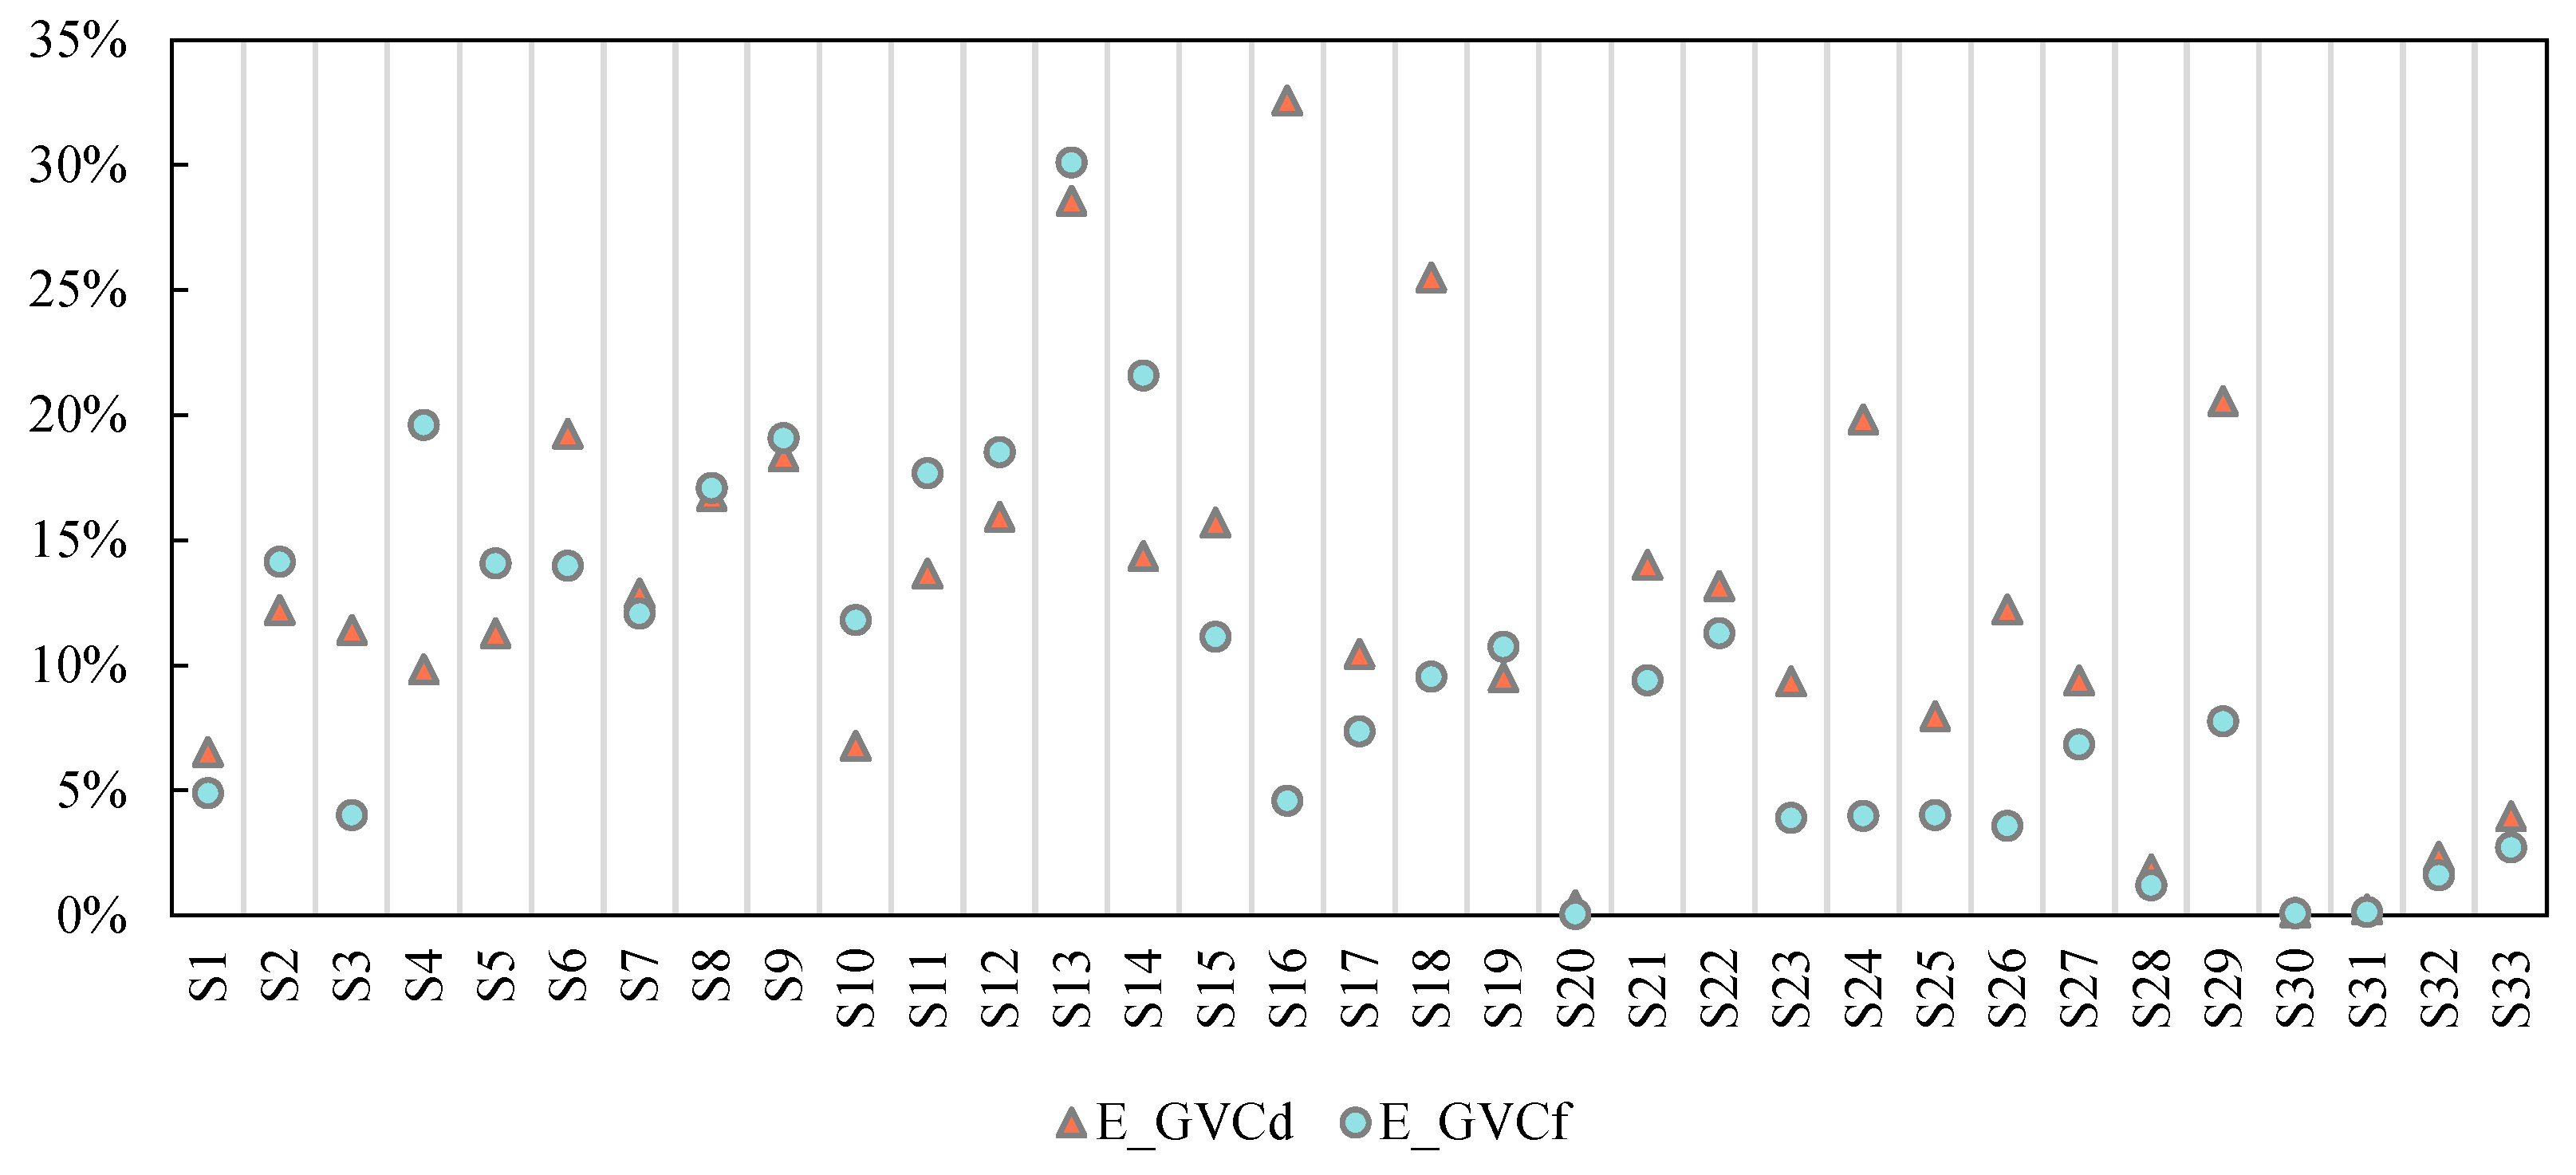
3.3. Relational GVC Activities in China: Economic and Environmental Trade-Offs

The economic and environmental trade-offs in relational GVC activities are examined in this study. Figure 6a depicts the trend of carbon intensity changes. While the carbon intensity of the FIEs in China is significantly lower than that of the DOEs, the decrease in energy intensity of the DOEs in China is higher (−72.13%) than that of the FIEs (−67.89%). The relatively low carbon of the FIEs presents an opportunity for the DOEs to decrease their carbon intensity by learning directly from the FIEs or indirectly through technological spillovers, and the environmental performance of the DOEs shows a continuous catch-up with the FIEs. This is mainly attributed to the spillover effects resulting from the ‘’stickiness’’ of domestic GVC relationships. Although the scale effects of GVCs can lead to negative environmental impacts through increased transportation, travel, waste generation and overexploitation of scarce resources, production linkages between firms upstream and downstream of the value chain promote the development, adoption and improvement of environmentally friendly production technologies (Xing et al., 2023 [21]). This process is carried out more through the production activities of the domestic GVCs, particularly those involving production interactions between the DOEs and FIEs (chain structure and circle structure). As shown in Figure 6b, the carbon intensity of domestic GVCs is lower than that of the cross-border GVCs. Compared to the cross-border GVCs, domestic GVCs are more likely to be a pathway for DOEs to obtain green technology spillovers from FIEs, generating positive economic and environmental trade-offs, i.e., the “greening of GVCs”. Previous studies have emphasized the presence of green technology spillovers among DOEs and FIEs within the same sector, particularly in developing countries (Cole et al., 2008 [63]; Hou et al., 2023a [37]).
In the domestic GVC activities (Figure 7), the circle-structured carbon intensity was higher than the chain structure, and this result indicates that the various forms of production networks established by firms participating in GVCs exhibit differing environmental performances, which will generate distinct economic and environmental trade-offs. Different network patterns among firms correspond to the production structures formed under the drive of different production strategies, which generate varying economic and environmental impacts. Further, although the circle-structured intensity is higher than the chain structure, the reduction in the carbon intensity of the circle-structured relationship during the study period (−70.65%) was overall more significant than that of the chain structure, revealing a higher potential for emission reductions. The previous section also supports the idea that circle-structured relationship activities have a greater impact on carbon emission growth compared to the chain structure. It is observed that, except for a rebound during the financial crisis period, both the chain- and circle-structured carbon intensities show a decreasing trend over time. Moreover, in cross-border GVC activities, the chain-structured pattern tends to be higher than the circle-structured pattern, with both patterns showing a decreasing trend.

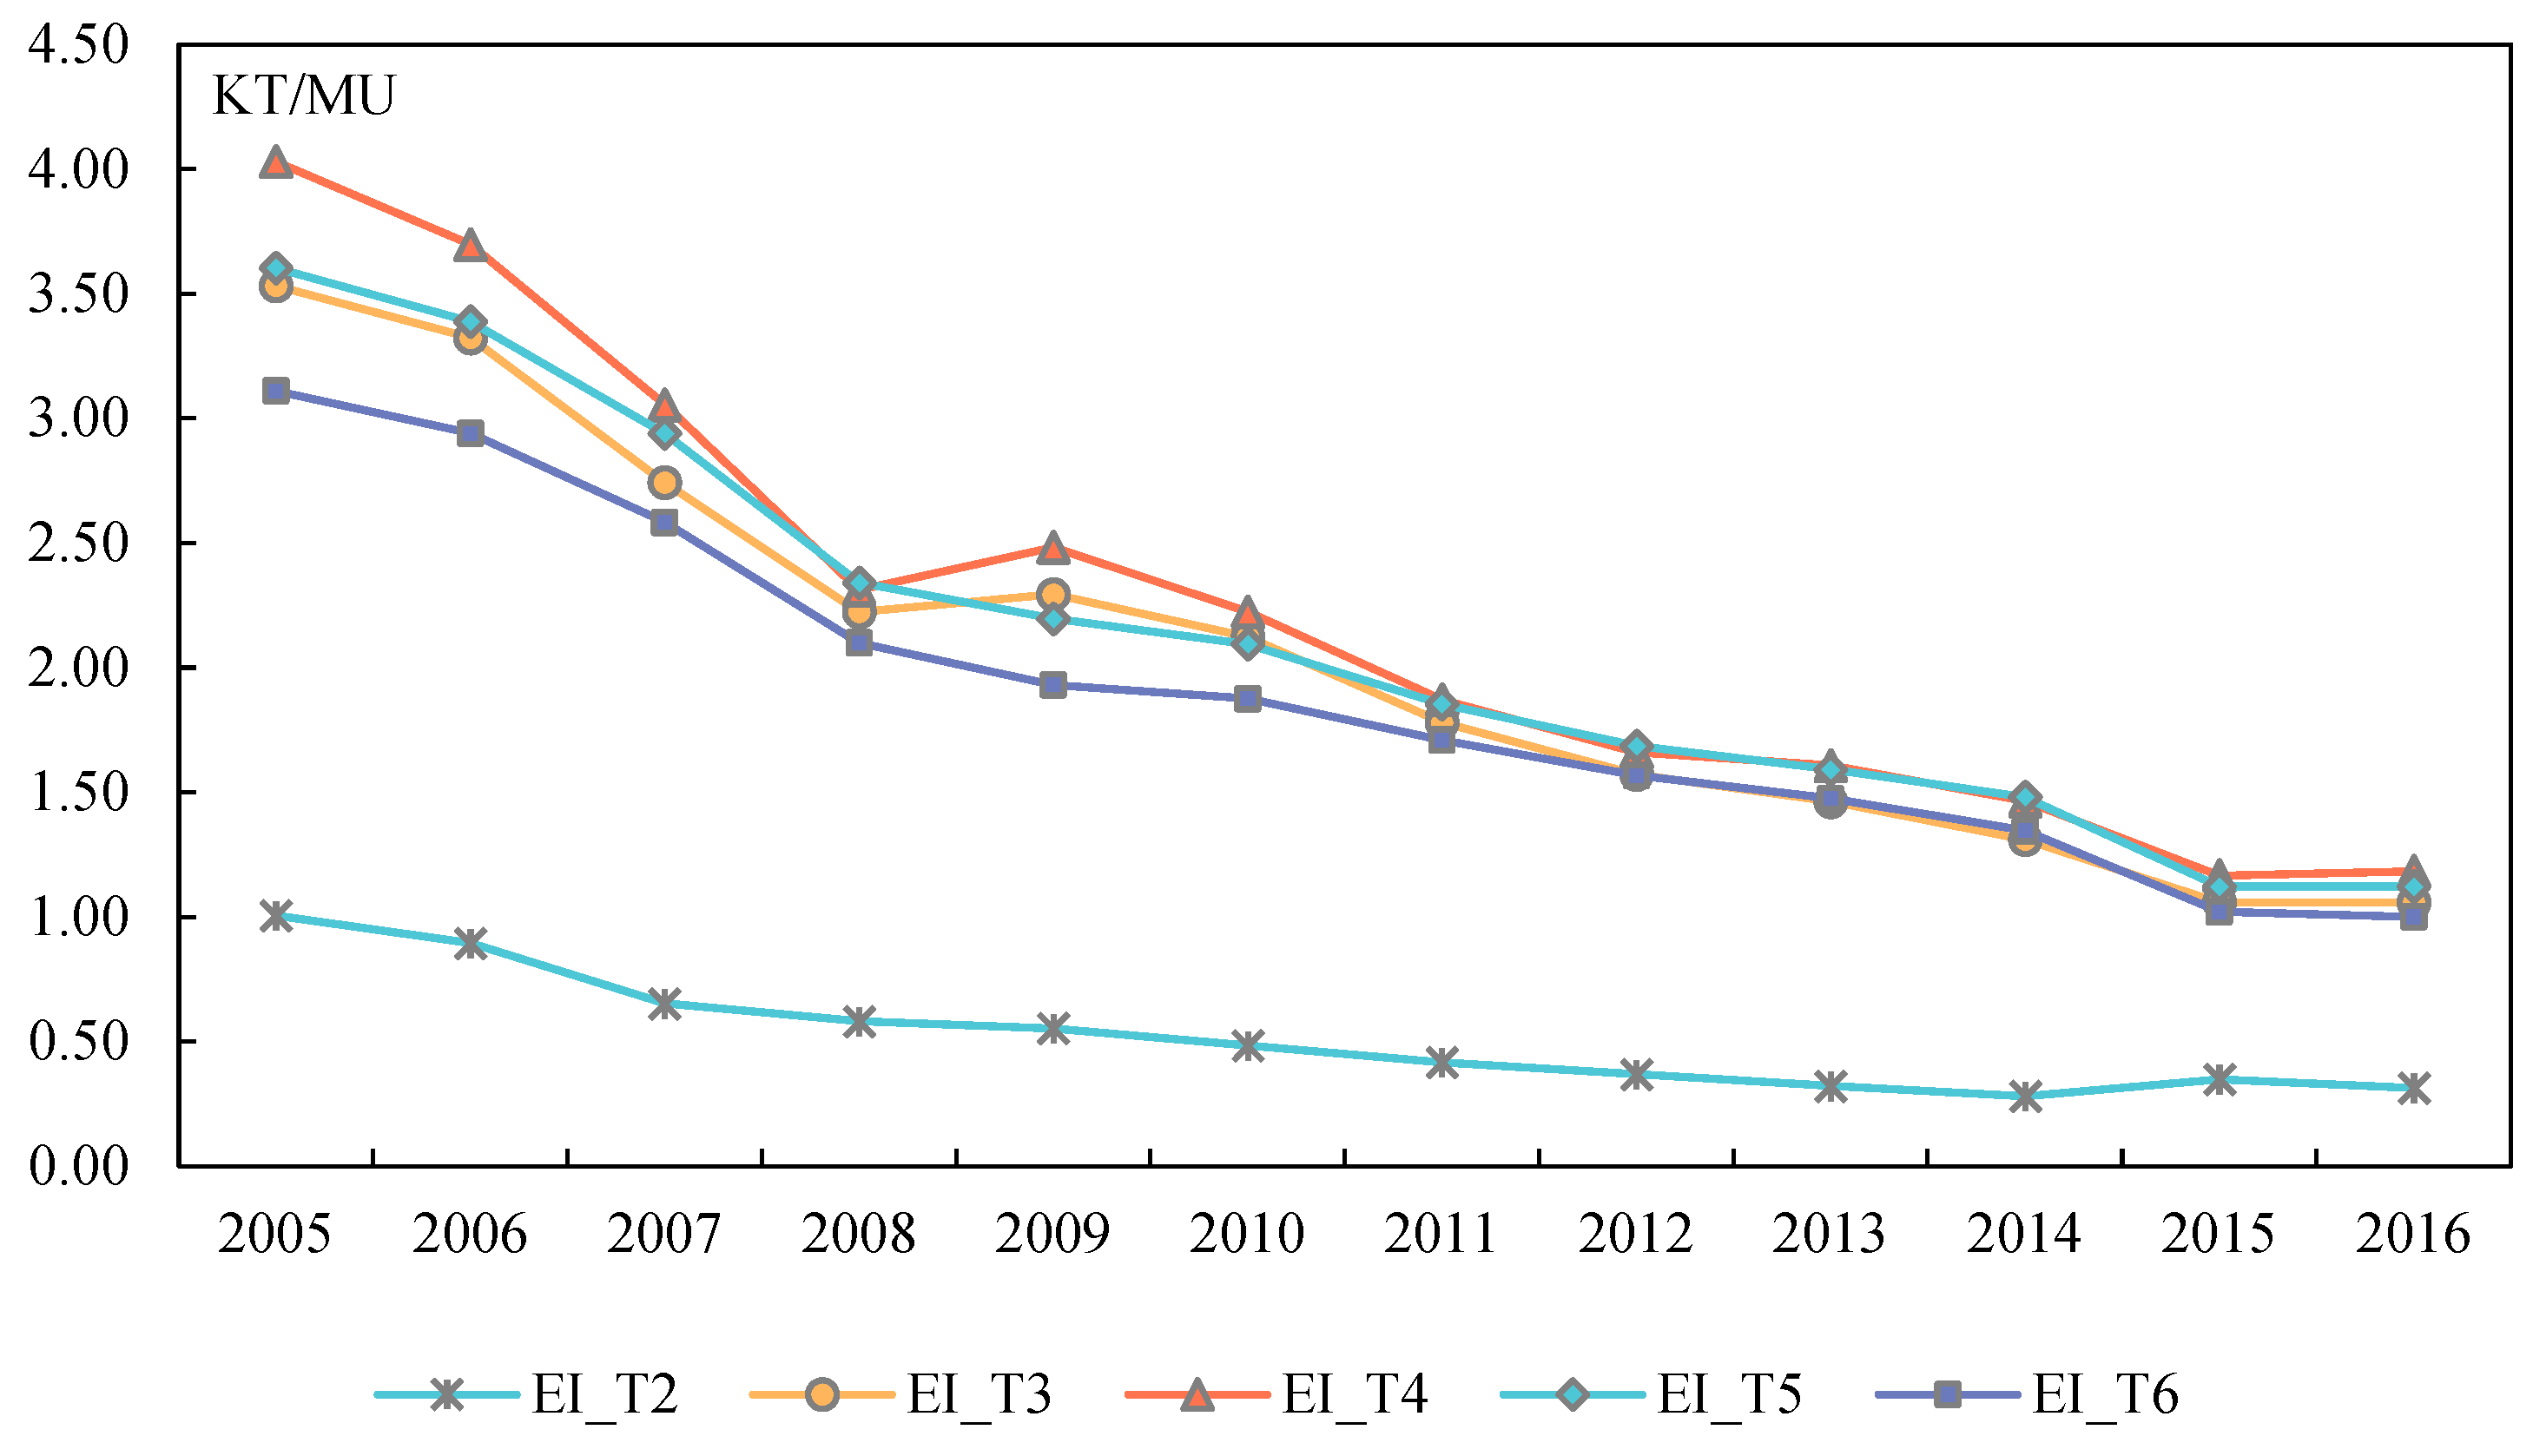
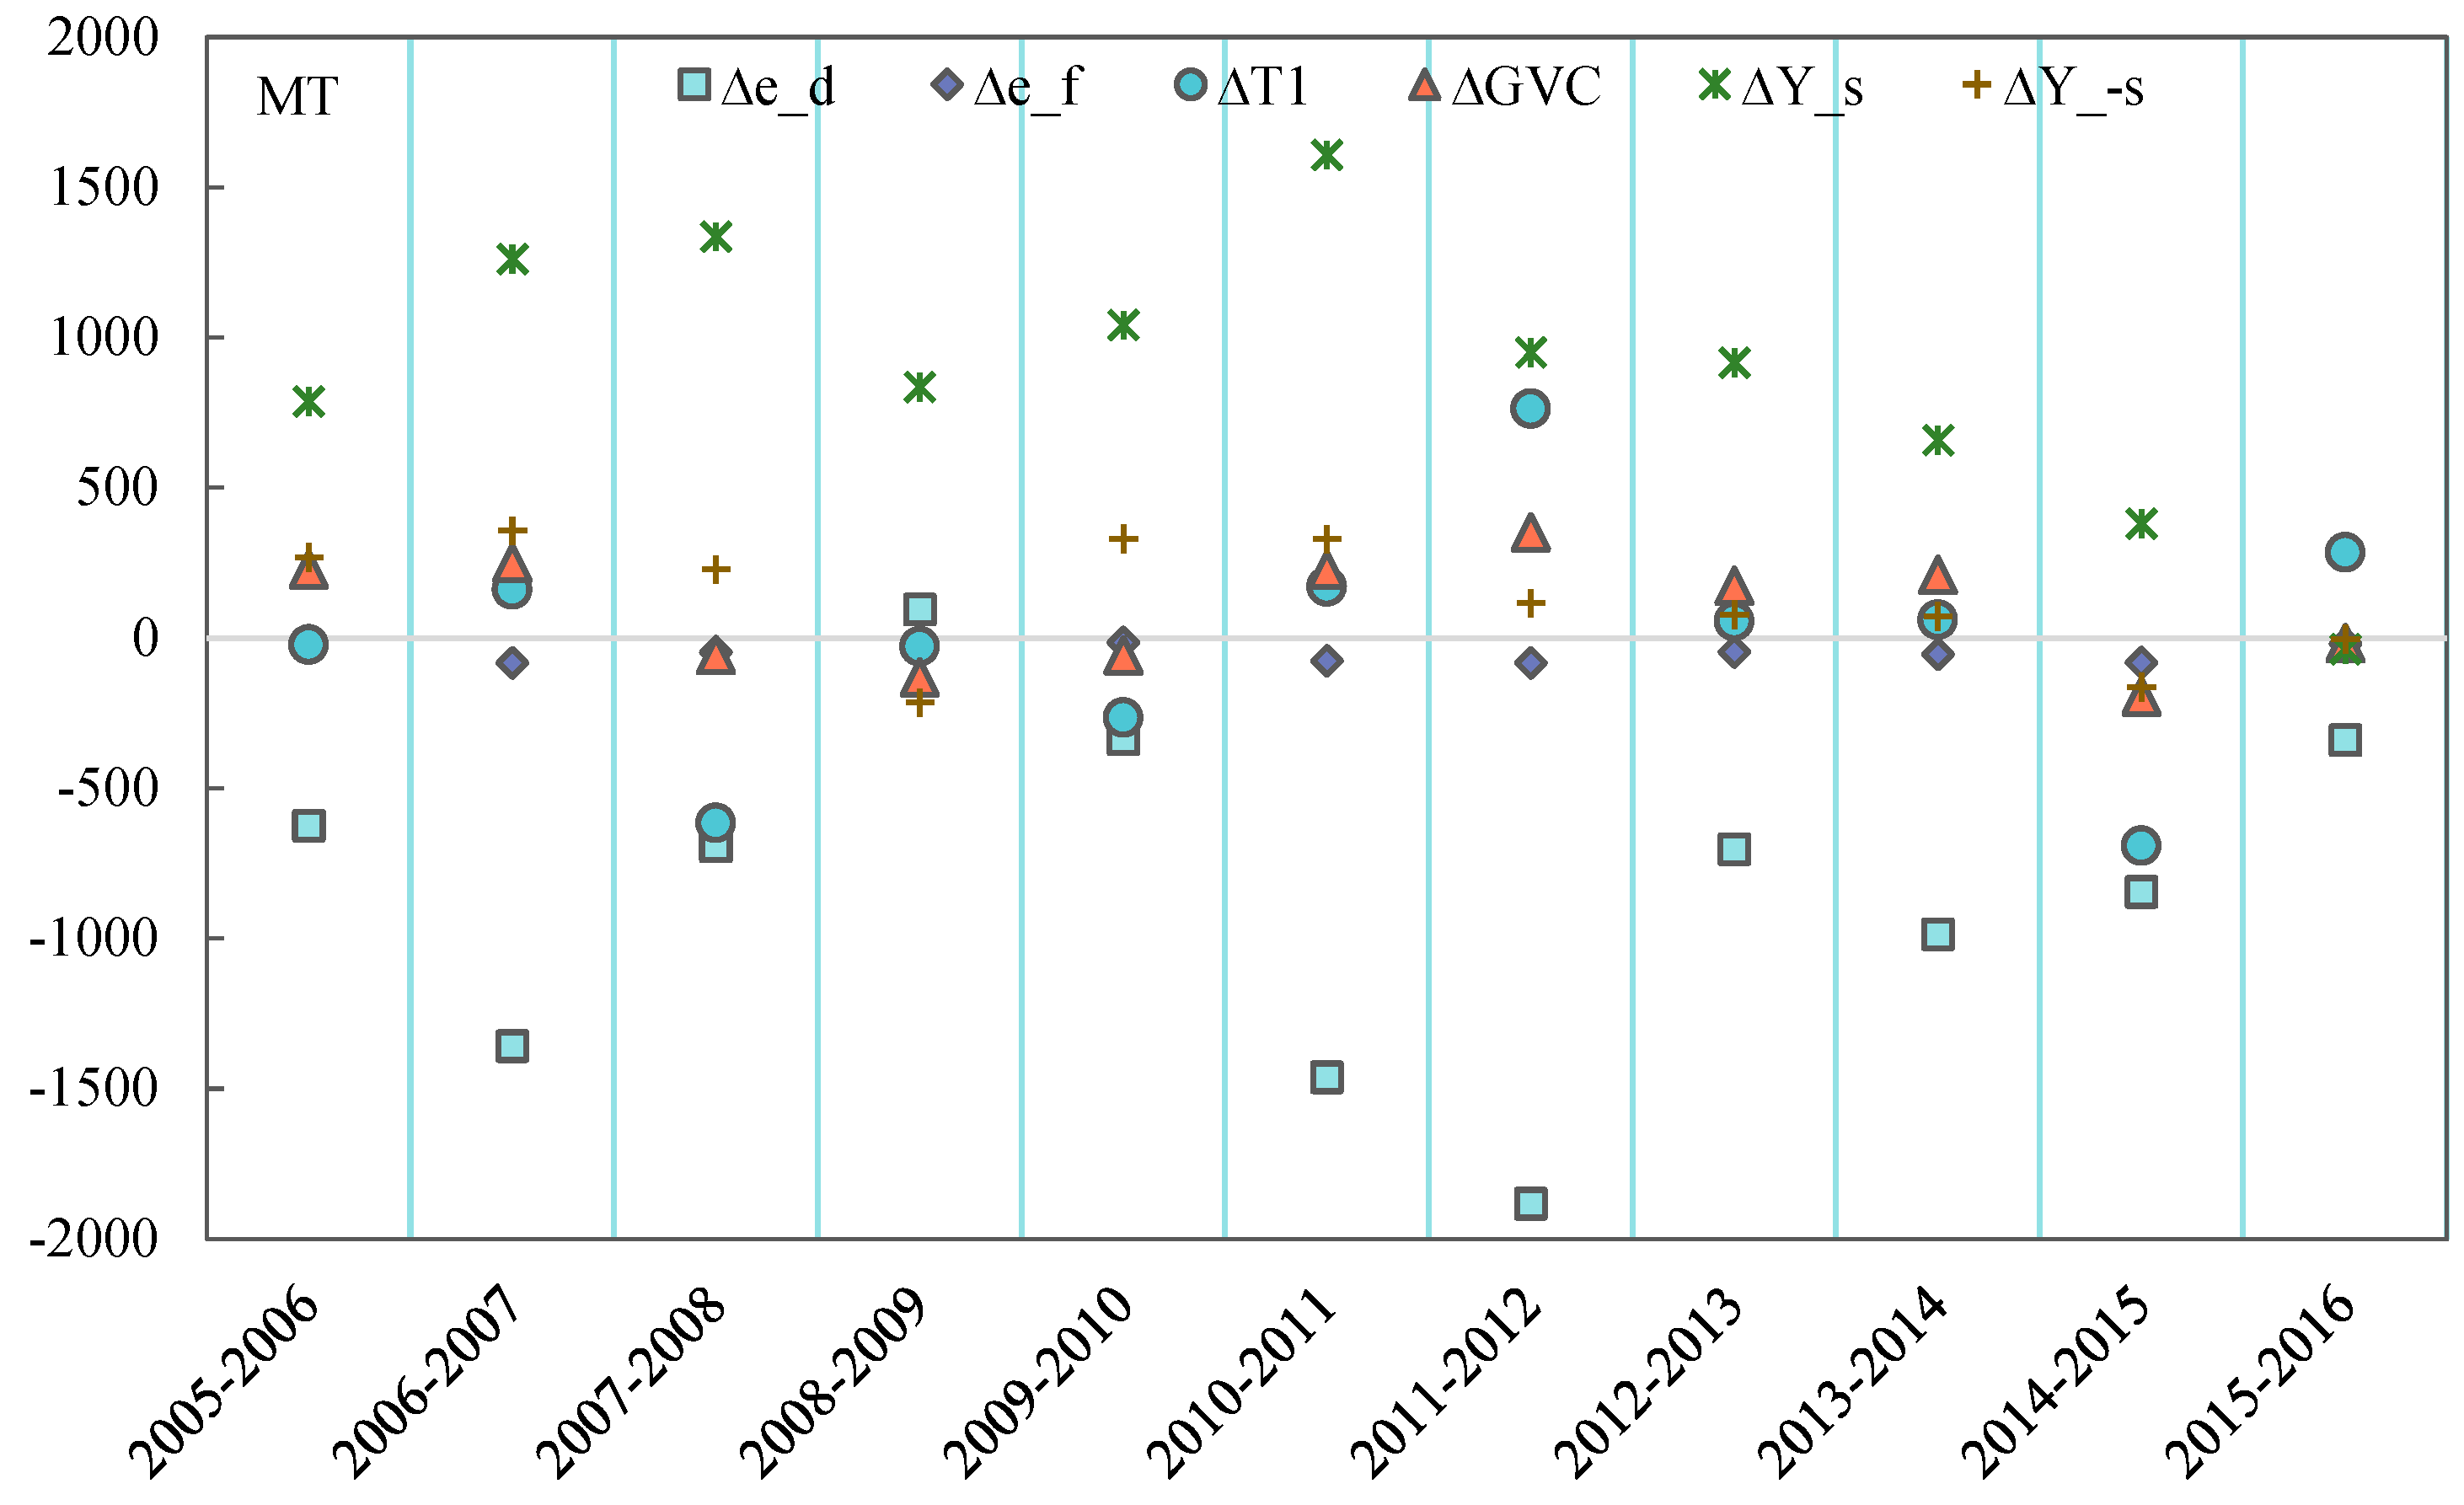
3.4. SDA Results of China’s Carbon Emission Changes

The results from the SDA suggest that the carbon intensity effect is the primary factor in reducing China’s carbon emissions, with the carbon intensity effect of DOEs playing a particularly significant role (see Figure 8). Over the sample period, the carbon intensity effect of DOEs has led to a reduction in emissions by 9136.79 MT, which was significantly higher than the contribution from other factors. In comparison, the carbon intensity effect of FIEs only resulted in a decrease of 516.73 MT. The domestic final demand effect (which includes the final product demand effect on DOEs, FIEs and foreign firms) is the main factor contributing to China’s carbon emission increase, totaling 9740.72 MT during the sample period. Additionally, the foreign final goods demand effect caused China’s carbon emissions to increase by 1399.91 MT. However, this boosting effect gradually weakened after 2011, indicating that the Chinese export structure of final goods was improved effectively.
In terms of the inter-firm interactions, the interactions between the DOEs effect inhibited China’s carbon emissions growth as a whole, totaling −132.4 MT between 2005 and 2016. However, this effect showed fluctuations in most years. Figure 8 illustrates that the relational GVC effect contributed to the carbon emissions increase in all the years except during specific periods like the financial crisis before and after (2007–2010) and the structural adjustment of China’s internal economy (2014–2016), which led to its negative effect, and it fell back after reaching the highest value of 351.74 MT in 2011–2012. The structural characteristics of interconnectedness between firms participating in GVCs are significant factors in understanding China’s carbon emissions changes (Figure 9). This study also revealed that the main source of relational GVC effects driving the increase in China’s carbon emissions is the cross-border GVC relational effects. These effects led to a total growth of 942.85 MT in carbon emissions over the sample period, of which the main role is in the manufacturing sector (614.4 MT, 65.16%). However, in terms of trends, especially after 2012, the impact of the cross-border GVC effects has been diminishing, while the domestic GVC effects have been on the rise. Despite the domestic GVC effect declining in 2014–2015 (mainly reflected in the service sector), it has rebounded swiftly. This phenomenon could be attributed to the ongoing deep adjustment of the world economy following the international financial crisis (Zhu et al., 2022 [3]), where the structural imbalance of economies remains unresolved. Meanwhile, China’s economy has transitioned into a “new normal” phase (Jiang et al., 2021 [64]). Previous research has primarily focused on the carbon emissions related to trade and less on the carbon emissions occurring within a country’s borders and associated with FIEs, which is not conducive to the realization of the overall emissions reduction target. Notably, domestic GVC emissions surpassed the cross-border GVC emissions in 2008–2009 and 2015–2016, a trend that is also evident in the manufacturing and service sectors. Given the challenges posed by external environmental pressures and internal economic transformations, it is imperative to prioritize our understanding of the environmental implications of domestic GVC activities.
In relational GVC effects, various network structure patterns have distinct effects on carbon emissions (Figure 10). Within the domestic GVC effects (∆T2–∆T4), the circle-structured effect led to an overall increase in China’s carbon emissions (+50.64 MT), especially in the manufacturing sector (+43.01 MT). Conversely, the chain-structured relational effect resulted in a reduction of 7.32MT over the study period, particularly evident in the service sector (−39.38 MT). This finding remains robust, even if the effects of the 2008–2009 financial crisis are excluded (i.e., the chain-structured relationship effect contributes to the reduction of carbon emissions overall, and the circle-structured relationship effect contributes to the growth of carbon emissions). Specifically for each year, the comparison found that the circle-structured relationship effect has a greater positive impact on the growth of carbon emissions in China than the chain-structured relationship effect in the time periods of 2005–2006, 2008–2009, 2010–2011, 2012–2013 and 2013–2014. During these periods, the circle-structured relationship effect exerts a more explicit impact on China’s carbon emission growth than the chain-structured relationship. In terms of trends, after 2012, the influence of the circle-structured effect on China’s carbon emission growth has been increasing, except for 2014–2015, and reached 37.5 MT in 2015–2016. In the cross-border GVC effect (∆T5–∆T6), the chain-structured effect exhibited a significantly larger positive impact on China’s carbon emission growth than the circle-structured effect, contributing to a total carbon emission growth of 938.01MT in the sample period. For the chain-structured effect between domestic and foreign firms, with the exception of the financial crisis (2008–2009, −199.86 MT) and the period when China’s economy entered the “new normal” with a structural adjustment (2014–2016, −51.03 MT), the chain-structured effect contributed to an increase in China’s carbon emissions.

4. Discussion

Since the value chain activities related to FIEs in host countries are “neglected” GVC activities, the interpretation of the environmental effects of GVCs should be based on the perspective of MNE-led GVC analysis. Our findings indicate that relational GVC emissions growth mainly arises from the expansion of domestic GVC emissions, particularly in the service sector. The oversight of domestic GVC emissions in conventional statistics and the failure to consider domestic GVC activities may lead to inaccuracies in investment and environmental policies, which is not conducive to the realization of China’s carbon peaking and carbon neutrality goals, and thus affects the process of China’s sustainable development.
Our findings contribute to the discussion about the “greening of GVCs”. GVCs have environmental impacts through three primary channels: scale, structural and technological effects (World Bank, 2020 [65]). Existing discussions suggest that the structural effects play a minor role, and the technological effects must override the scale effects to reduce the environmental impact of GVCs. Our research indicates that domestic GVC relational activities, particularly interactions and coordination between DOEs and FIEs, could serve as a potential policy instrument to promote GVC sustainability at the firm level. For example, the exchange of knowledge among firms within the value chain can foster the development, adoption and enhancement of eco-friendly production technologies (Xing et al., 2023 [21]), thereby facilitating the greening of GVCs. In practical terms, leading firms may transmit their environmental standards to their suppliers upstream and downstream through the cooperation and monitoring of suppliers’ environmental practices. For instance, Apple requires its upstream and downstream manufacturing suppliers to accelerate the implementation of carbon reduction measures.
This study has several policy implications. Firstly, the environmental impacts of relational GVCs need to be better understood and addressed. On the one hand, national and corporate actions at the global level are also crucial for carbon mitigation in China, as relational GVCs are characterized by cross-border and cross-firm boundaries and are reflected in upstream and downstream industrial linkages between firms in the value chain. For example, lead firms should establish partnerships with sustainable domestic firms to promote the greening of GVCs. On the other hand, the structural and sectoral differences between domestic and cross-border GVC emissions must be clearly recognized to avoid miscalculations of China’s industrial and environmental policies regarding its participation in GVCs. Given the important roles that domestic GVC activities and cross-border GVC activities play in carbon emissions from the service and manufacturing sectors, respectively, it is recommended that emission reductions from domestic GVC production networks should focus on the service sector, while emission reductions from cross-border GVC production networks should focus on the manufacturing sector. In addition, considering the great role of a carbon tax and carbon market in realizing emission reductions, China should continue to promote systematic research on carbon taxes and the construction of a carbon emission trading market.
Secondly, the interaction between DOEs and FIEs should be made more “sticky”. On the one hand, given that the interactions between DOEs and FIEs can be a potential policy tool to promote the greening of GVCs at the firm level, the government should reduce the transaction costs of participating in domestic GVCs by reducing institutional barriers to inter-firm interactions. For example, measures such as strengthening the dialogue between the government and investors to promote the adoption of responsible business behavior practices by enterprises, improving the direct linkage system of FIEs to enhance the opportunities for business matching between foreign investors and domestic suppliers, and addressing the institutional and institutional barriers that restrict the smooth flow of factors among enterprises while improving the modern market and circulation system are possible directions. On the other hand, while increasing the capacity of local firms to participate in the greening of GVCs and encouraging domestic firms to actively participate in MNEs’ supply chains, MNEs should be encouraged to engage in green innovation activities with domestic suppliers. For example, policymakers can provide tax incentives for green investment and green innovation behavior as part of the policies to promote foreign direct investment and green technology transfer; they can also establish regulatory frameworks that encourage all firms in domestic GVCs to engage in green GVC management.
Thirdly, attention should be paid to the heterogeneity of the environmental impacts of different network forms among participating GVC enterprises. The type of sequencing in the production process determines the dominant firm’s decision regarding value chain governance arrangements (Antràs and Chor, 2013 [66]) and different sequencing types characterized by distinct network patterns and value chain configurations among participating GVC firms, leading to different impacts on carbon emissions. Although the activities of chain-structured relationships between DOEs and FIEs lead to higher carbon emissions than circle-structured relationships, the impact of circle-structured relationships on the growth of carbon emissions is more sustainable as well as more potential for abatement. Therefore, the heterogeneity of different production network patterns should be considered when formulating enterprise-level emission reduction policies. Further, firms participating in GVCs are constrained by the cost of inter-firm coordination in organizing production (Baldwin and Venables, 2013) [33] and are associated with the production network structure. Compared to the chain structure, the circle structure is the structural basis for the feedback effect (Fan et al., 2021) [38], and the circle structure allows the connectivity of the production network to be greatly enhanced (Lou et al., 2018) [67], resulting in higher coordination costs. To address this, digital processing technologies can be utilized to enable interconnectivity and data exchange between firms, assessing the interdependence of the firms, the complexity of tasks, and specific configurations of suppliers’ capabilities, thereby reducing coordination costs and achieving carbon emission reductions. For example, supply chain environmental analysis techniques incorporating blockchain can trace the carbon footprint of a firm’s products, laying the foundation for reducing carbon emissions in the production network across the value chain.
In addition, it should be noted that the measurement of the carbon emission effect of relational GVCs in this paper strictly relies on the OECD-AMNE database and related input–output models. Due to the lack of detailed transactional data on the interactions between DOEs and FIEs, we characterized the interactions between firms by incorporating the global Leontief inverse matrix in the firm dimension and characterized the network structure between firms participating in GVCs by using the chain and circle structures of a complex network in order to characterize the relational nature of GVCs. On this basis, using the input–output SDA method, the influencing factors of the carbon emission changes in China are categorized into the carbon emission intensity effect, interactions between DOEs effect, relational GVC activity effect and the final product demand effect. Based on these assumptions, we provide an attempt to identify and measure relational GVC activities based on the existing data and frameworks, with room for further expansion in the future. For example, there is an urgent need for detailed transaction data on the interactions between DOEs and FIEs, as well as firms’ dimensional carbon emission data. In addition, due to the lack of data on intra-firm trade, we are unable to measure the relational GVC activities characterized by intra-firm trade, such as the interactions between parent firms of MNEs and host country firms. Given these factors, it is critical to develop the use of more reliable data to ensure that future explorations provide a more accurate and valid framework as well as additional insights for analyzing the interactions between firms involved in GVCs and their impacts on the environment.

5. Conclusions

The structural characteristics of the network between firms participating in GVCs play a crucial role in understanding the changes in carbon emissions in China. Regrettably, this aspect has not received adequate attention in the existing literature. This study aimed to investigate the network structure between GVC firms, utilize the data of inter-firm linkages in the OECD-AMNE database to portray relational GVC activities and differentiate the shape of the network structure between GVC firms, seeking to identify and quantify the relational GVC carbon emissions.
This study discovered that relational GVC activities significantly contribute to China’s carbon emissions, accounting for about 26.8% of China’s total carbon emissions. Further analysis indicates that the increase in relational GVC emissions mainly originates from the expansion of domestic GVC emissions. Although cross-border GVC emissions are, overall, higher than domestic GVC emissions, domestic GVC emissions have been expanding and surpassed cross-border GVC emissions in 2016. When distinguishing between different network structures of relational GVCs, it was observed that compared with the chain-structured relational activities, the circle-structured relational activities lead to emissions that maintain a consistent growth trend.
The sectoral results indicate that relational GVC activities result in higher carbon emissions within the service sector than the manufacturing sector, which is more evident in the domestic GVC emissions. Considering the economic and environmental trade-offs of relational GVC activities, domestic relational GVCs are more likely to be a pathway for DOEs to acquire green technology spillovers from FIEs, generating favorable economic and environmental trade-offs. This is manifested in a lower carbon intensity in domestic GVCs compared to cross-border GVCs, in which the circle-structured relationship reveals a higher potential for emissions reduction. The SDA reveals that the primary source of relational GVC effects contributing to China’s carbon emissions growth is the cross-border GVC relational effect, which is concentrated in the manufacturing sector. However, in terms of trends, the overall impact of the cross-border GVC emission effects on China’s carbon emissions has been diminishing since 2012, while the domestic GVC effects have been increasing and surpassing the cross-border GVC effects at the end of the period. Compared with the chain-structured relationship effect, the circle-structured relationship effect between the DOEs and FIEs has a noticeably pronounced impact on the growth of carbon emissions.

Author Contributions

Conceptualization, Y.Y.; Formal analysis, Y.Y.; Investigation, Y.Y.; Data curation, Y.Y.; Writing—original draft, Y.Y.; Writing—review & editing, N.Y. and H.W.; Visualization, Y.Y. and H.W.; Supervision, J.H.; Project administration, J.H. and N.Y.; Funding acquisition, J.H. and N.Y. All authors have read and agreed to the published version of the manuscript.

Funding

This research was supported by the Major Program of the National Social Science Fund of China (No. 17ZDA099) and the Major Program of Hunan Province Social Science Fund of China (No. 23ZDAJ004).

Institutional Review Board Statement

Not applicable.

Informed Consent Statement

Not applicable.

Data Availability Statement

Data are contained within the article.

Conflicts of Interest

The authors declare no conflicts of interest.

References

  1. Meng, B.; Peters, G.P.; Wang, Z.; Li, M. Tracing CO2 emissions in global value chains. Energy Econ. 2018, 73, 24–42. [Google Scholar] [CrossRef]
  2. Meng, B.; Liu, Y.; Gao, Y.; Li, M.; Wang, Z.; Xue, J.; Andrew, R.; Feng, K.; Qi, Y.; Sun, Y.; et al. Developing countries’ responsibilities for CO2 emissions in value chains are larger and growing faster than those of developed countries. One Earth 2023, 6, 167–181. [Google Scholar] [CrossRef]
  3. Zhu, K.; Guo, X.; Zhang, Z. Reevaluation of the carbon emissions embodied in global value chains based on an inter-country input-output model with multinational enterprises. Appl. Energy 2022, 307, 118220. [Google Scholar] [CrossRef]
  4. Li, M.; Meng, B.; Gao, Y.; Wang, Z.; Zhang, Y.; Sun, Y. Tracing CO2 emissions in global value chains: Multinationals vs. domestically-owned firms. Resour. Conserv. Recycl. 2023, 190, 106828. [Google Scholar] [CrossRef]
  5. Yan, Y.; Li, X.; Wang, R.; Pan, A. Global value chain and export-embodied carbon emissions: New evidence from foreign-invested enterprises. Econ. Model. 2023, 127, 106449. [Google Scholar] [CrossRef]
  6. Yan, Y.; Li, X.; Wang, R.; Zhao, Z.; Jiao, A. Decomposing the carbon footprints of multinational enterprises along global value chains. Struct. Change Econ. Dyn. 2023, 66, 13–28. [Google Scholar] [CrossRef]
  7. Kano, L.; Tsang, E.W.; Yeung, H.W.C. Global value chains: A review of the multi-disciplinary literature. J. Int. Bus. Stud. 2020, 51, 577–622. [Google Scholar] [CrossRef]
  8. Soontornthum, T.; Cui, L.; Lu, V.N.; Su, J. Enabling SMEs’ learning from global value chains: Linking the logic of power and the logic of embeddedness of interfirm relations. Manag. Int. Rev. 2020, 60, 543–571. [Google Scholar] [CrossRef]
  9. Lakhani, T.; Kuruvilla, S.; Avgar, A. From the firm to the network: Global value chains and employment relations theory. Br. J. Ind. Relat. 2013, 51, 440–472. [Google Scholar] [CrossRef]
  10. Alfaro-Urena, A.; Manelici, I.; Vasquez, J.P. The effects of joining multinational supply chains: New evidence from firm-to-firm linkages. Q. J. Econ. 2022, 137, 1495–1552. [Google Scholar] [CrossRef]
  11. Laari, S.; Wetzel, P.; Töyli, J.; Solakivi, T. Leveraging supply chain networks for sustainability beyond corporate boundaries: Explorative structural network analysis. J. Clean. Prod. 2022, 377, 134475. [Google Scholar] [CrossRef]
  12. Sun, K.; Ye, J.; Yue, Y.; Xiao, N. Tracing carbon emissions and intensity in relational global value chain activities. J. Clean. Prod. 2023, 429, 139579. [Google Scholar] [CrossRef]
  13. Henderson, J.; Dicken, P.; Hess, M.; Coe, N.; Yeung, H.W.C. Global production networks and the analysis of economic development. Rev. Int. Political Econ. 2002, 9, 436–464. [Google Scholar] [CrossRef]
  14. Yue, Y.; Hou, J.; Zhang, M.; Ye, J. Does the sticky relationships of global value chains help stabilize employment? Evidence from China. Struct. Change Econ. Dyn. 2024, 69, 632–651. [Google Scholar] [CrossRef]
  15. Allen, T. Information frictions in trade. Econometrica 2014, 82, 2041–2083. [Google Scholar] [CrossRef]
  16. Antràs, P.; Chor, D. Global Value Chains. In NBER Working Papers No.28549; NBER: Cambridge, MA, USA, 2021. [Google Scholar]
  17. Antràs, P. Conceptual aspects of global value chains. World Bank Econ. Rev. 2020, 34, 551–574. [Google Scholar] [CrossRef]
  18. Agostino, M.; Brancati, E.; Giunta, A.; Scalera, D.; Trivieri, F. Firms’ efficiency and global value chains: An empirical investigation on Italian industry. World Econ. 2020, 43, 1000–1033. [Google Scholar] [CrossRef]
  19. Gereffi, G.; Humphrey, J.; Sturgeon, T. The governance of global value chains. Rev. Int. Political Econ. 2005, 12, 78–104. [Google Scholar] [CrossRef]
  20. Cusolito, A.P.; Safadi, R.; Taglioni, D. Inclusive Global Value Chains: Policy Options for Small and Medium Enterprises and Low-Income Countries; OECD and World Bank Publications: Washington, DC, USA, 2016. [Google Scholar]
  21. Xing, Y.; Wang, R.; Dollar, D. Global Value Chain Development Report 2023: Resilient and Sustainable Gvcs. In Turbulent Times; Simon & Schuster: New York, NY, USA, 2023. [Google Scholar]
  22. Koopman, R.; Wang, Z.; Wei, S.J. Tracing value-added and double counting in gross exports. Am. Econ. Rev. 2014, 104, 459–494. [Google Scholar] [CrossRef]
  23. Miroudot, S.; Ye, M. Multinational production in value-added terms. Econ. Syst. Res. 2020, 32, 395–412. [Google Scholar] [CrossRef]
  24. Xiao, H.; Meng, B.; Ye, J.; Li, S. Are global value chains truly global? Econ. Syst. Res. 2020, 32, 540–564. [Google Scholar] [CrossRef]
  25. Wang, Z.; Wei, S.J.; Yu, X.; Zhu, K. Measures of participation in global value chains and global business cycles (No. w23222). In NBER Working Paper; NBER: Cambridge, MA, USA, 2017. [Google Scholar]
  26. Wang, Z.; Wei, S.J.; Yu, X.; Zhu, K. Tracing Value Added in the Presence of Foreign Direct Investment (No. w29335). In NBER Working Paper; NBER: Cambridge, MA, USA, 2021. [Google Scholar]
  27. Alfaro, L.; Chor, D.; Antras, P.; Conconi, P. Internalizing global value chains: A firm-level analysis. J. Political Econ. 2019, 127, 508–559. [Google Scholar] [CrossRef]
  28. Karabay, B. A new dimension in global value chains: Control vs. delegation in input procurement. J. Int. Econ. 2022, 137, 103584. [Google Scholar] [CrossRef]
  29. Cadestin, C.; De Backer, K.; Desnoyers-James, I.; Miroudot, S.; Rigo, D.; Ye, M. Multinational enterprises and global value chains: The OECD analytical AMNE database. In OECD Trade Policy Papers; OECD: Paris, France, 2018. [Google Scholar]
  30. Piccardi, C.; Riccaboni, M.; Tajoli, L.; Zhu, Z. Random walks on the world input–output network. J. Complex Netw. 2018, 6, 187–205. [Google Scholar] [CrossRef]
  31. Pu, Y.; Li, Y.; Zhang, J. Features and evolution of the ‘Belt and Road’ regional value chain: Complex network analysis. World Econ. 2022, 46, 2134–2156. [Google Scholar] [CrossRef]
  32. Hong, W.; Ma, T.; Guo, R.; Yang, X.; Li, X.; Sun, M.; Chen, Y.; Zhong, Y. Carbon emission characteristics of urban trip based on multi-layer network modeling. Appl. Geogr. 2023, 159, 103091. [Google Scholar] [CrossRef]
  33. Baldwin, R.; Venables, A.J. Spiders and snakes: Offshoring and agglomeration in the global economy. J. Int. Econ. 2013, 90, 245–254. [Google Scholar] [CrossRef]
  34. Yang, P.; Mi, Z.; Yao, Y.F.; Cao, Y.F.; Coffman, D.M.; Liu, L.C. Solely economic mitigation strategy suggests upward revision of nationally determined contributions. One Earth 2021, 4, 1150–1162. [Google Scholar] [CrossRef]
  35. Wang, L.; Yue, Y.; Xie, R.; Wang, S. How global value chain participation affects China’s energy intensity. J. Environ. Manag. 2020, 260, 110041. [Google Scholar] [CrossRef]
  36. Gao, Y.; Meng, B.; Suder, G.; Ye, J.; Sun, Y. Making global value chains visible: Transnational corporations versus domestically owned firms. Transnatl. Corp. J. 2023, 30, 1–47. [Google Scholar] [CrossRef]
  37. Hou, J.; Yue, Y.; Wang, Q.; Ye, J.; Zhang, M. Spillover-feedback effects of employment, energy, economy and environment (4E) between domestic-owned and foreign-invested enterprises: Taking China as an example. J. Clean. Prod. 2023, 382, 135276. [Google Scholar] [CrossRef]
  38. Fan, T.; Lü, L.; Shi, D.; Zhou, T. Characterizing cycle structure in complex networks. Commun. Phys. 2021, 4, 272. [Google Scholar] [CrossRef]
  39. Fortanier, F.; Miao, G.; Kolk, A.; Pisani, N. Accounting for firm heterogeneity in global value chains. J. Int. Bus. Stud. 2020, 51, 432–453. [Google Scholar] [CrossRef]
  40. Hou, J.; Yue, Y.; Wang, Y.; Ye, J. Decarbonization without borders: Evidence from China. Sci. Total Environ. 2023, 892, 164653. [Google Scholar] [CrossRef] [PubMed]
  41. Meng, B.; Gao, Y.; Ye, J.; Zhang, M.; Xing, Y. Trade in factor income and the US-China trade balance. China Econ. Rev. 2022, 73, 101792. [Google Scholar] [CrossRef]
  42. Su, B.; Ang, B.W.; Li, Y. Input-output and structural decomposition analysis of Singapore’s carbon emissions. Energy Policy 2017, 105, 484–492. [Google Scholar] [CrossRef]
  43. Su, B.; Ang, B.W. Structural decomposition analysis applied to energy and emissions: Frameworks for monthly data. Energy Econ. 2023, 126, 106977. [Google Scholar] [CrossRef]
  44. Xiao, Y.; Yong, C.; Hu, W.; Wang, H. Factors Influencing Carbon Emissions in High Carbon Industries in the Zhejiang Province and Decoupling Effect Analysis. Sustainability 2023, 15, 15975. [Google Scholar] [CrossRef]
  45. Wang, W.; Hu, Y.; Lu, Y. Driving forces of China’s provincial bilateral carbon emissions and the redefinition of corresponding responsibilities. Sci. Total Environ. 2023, 857, 159404. [Google Scholar] [CrossRef]
  46. Wang, H.; Shang, L.; Tang, D.; Li, Z. Research Themes, Evolution Trends, and Future Challenges in China’s Carbon Emission Studies. Sustainability 2024, 16, 2080. [Google Scholar] [CrossRef]
  47. Miller, R.E.; Blair, P.D. Input-Output Analysis: Foundations and Extensions; Cambridge University Press: Cambridge, UK, 2009. [Google Scholar]
  48. Liu, Y.; Ma, R.; Guan, C.; Chen, B.; Zhang, B. Global trade network and CH4 emission outsourcing. Sci. Total Environ. 2022, 803, 150008. [Google Scholar] [CrossRef] [PubMed]
  49. Ferrarini, B. Vertical trade maps. Asian Econ. J. 2013, 27, 105–123. [Google Scholar] [CrossRef]
  50. Ferrantino, M.J.; Taglioni, D. Global value chains in the current trade slowdown. World Bank Econ. Premise 2014, 137, 30. [Google Scholar]
  51. Jiang, M.; An, H.; Gao, X.; Liu, S.; Xi, X. Factors driving global carbon emissions: A complex network perspective. Resour. Conserv. Recycl. 2019, 146, 431–440. [Google Scholar] [CrossRef]
  52. Li, C.; Zhang, X. The Influencing Mechanisms on Global Industrial Value Chains Embedded in Trade Implied Carbon Emissions from a Higher-Order Networks Perspective. Sustainability 2022, 14, 15138. [Google Scholar] [CrossRef]
  53. Fang, G.; Huang, M.; Zhang, W.; Tian, L. Exploring global embodied carbon emissions transfer network—An analysis based on national responsibility. Technol. Forecast. Soc. Chang. 2024, 202, 123284. [Google Scholar] [CrossRef]
  54. Huang, X.; Zhao, X.; Jiao, A.; Zheng, J. Network Effects in Global Carbon Transfer: New Evidence from a Carbon-Connectedness Network Centered on China. Sustainability 2024, 16, 4116. [Google Scholar] [CrossRef]
  55. Jiang, M.; Gao, X.; Guan, Q.; Hao, X.; An, F. The structural roles of sectors and their contributions to global carbon emissions: A complex network perspective. J. Clean. Prod. 2019, 208, 426–435. [Google Scholar] [CrossRef]
  56. Zheng, H.; Gao, X.; Zhou, J.; Liu, D.; Xi, X.; Sun, X. Characteristics of industrial driving effects network and impacts on carbon emissions. J. Environ. Plan. Manag. 2021, 1–25. [Google Scholar] [CrossRef]
  57. Cheng, Y.; Zhao, L.; Yi, H.; Wang, C.; Wang, K.; Zhen, J. What network roles affect the decline of the embodied carbon emission reduction pressure in China’s manufacturing sector foreign trade? J. Clean. Prod. 2024, 449, 141771. [Google Scholar] [CrossRef]
  58. Kano, L. Global value chain governance: A relational perspective. J. Int. Bus. Stud. 2018, 49, 684–705. [Google Scholar] [CrossRef]
  59. Tsekeris, T. Global value chains: Building blocks and network dynamics. Phys. A Stat. Mech. Its Appl. 2017, 488, 187–204. [Google Scholar] [CrossRef]
  60. Dietzenbacher, E.; Los, B. Structural decomposition techniques: Sense and sensitivity. Econ. Syst. Res. 1998, 10, 307–324. [Google Scholar] [CrossRef]
  61. Corsatea, T.D.; Lindner, S.; Arto, I.; Román, M.V.; Rueda-Cantuche, J.M.; Velázquez Afonso, A.; Amores, F.; Neuwahl, F. World Input-Output Database Environmental Accounts. Update 2000–2016; Publications Office of the European Union: Luxembourg, 2019. [Google Scholar]
  62. Xing, Y.; Huang, S. Value captured by China in the smartphone GVC–A tale of three smartphone handsets. Struct. Chang. Econ. Dyn. 2021, 58, 256–266. [Google Scholar] [CrossRef]
  63. Cole, M.A.; Elliott, R.J.; Strobl, E. The environmental performance of firms: The role of foreign ownership, training, and experience. Ecol. Econ. 2008, 65, 538–546. [Google Scholar] [CrossRef]
  64. Jiang, X.; Shen, J.H.; Lee, C.C.; Chen, C. Supply-side structural reform and dynamic capital structure adjustment: Evidence from Chinese-listed firms. Pac. Basin Financ. J. 2021, 65, 101482. [Google Scholar] [CrossRef]
  65. World Bank. World Development Report 2020: Trading for Development in the Age of Global Value Chains; The World Bank: Washington, DC, USA, 2020. [Google Scholar]
  66. Antràs, P.; Chor, D. Organizing the global value chain. Econometrica 2013, 81, 2127–2204. [Google Scholar]
  67. Lou, Y.; Wang, L.; Chen, G. Toward stronger robustness of network controllability: A snapback network model. IEEE Trans. Circuits Syst. I Regul. Pap. 2018, 65, 2983–2991. [Google Scholar] [CrossRef]
Figure 1. The network structure relationships of two production interactions between DOEs and FIEs.
Sustainability 16 06940 g001
Figure 2. The carbon emissions originating from different production activities (a) and the proportion of carbon emissions originating from different production activities in China’s total carbon emissions (b). Note: E _ G V C = E _ G V C d + E _ G V C f .
Sustainability 16 06940 g002
Figure 3. Annual growth rate of different types of relational GVC emissions.
Sustainability 16 06940 g003
Figure 4. The percentage of breakdown composition of carbon emissions by sector in China, 2016. Note: In the AMNE-ICIO table, S34 has all zero values and is not discussed in this paper.
Sustainability 16 06940 g004
Figure 5. Domestic GVC emissions vs. cross-border GVC emissions by sector in 2016.
Sustainability 16 06940 g005
Figure 6. Carbon intensity of different types of enterprises (a) and carbon intensity of different production activities (b). Note: EI stands for carbon intensity.
Sustainability 16 06940 g006
Figure 7. Carbon intensity of different types of relational GVC activities.
Sustainability 16 06940 g007
Figure 8. SDA results of China’s carbon emissions.
Sustainability 16 06940 g008
Figure 9. Domestic and cross-border GVC effects on China’s carbon emissions. Note: M—manufacturing sectors, S—service sectors.
Sustainability 16 06940 g009aSustainability 16 06940 g009b
Figure 10. Impact of different types of relational GVC emission effects on carbon emissions changes in China. Note: M—manufacturing sector, S—service sector.
Sustainability 16 06940 g010
Table 1. ICIO table distinguishing between different types of enterprises.
OutputIntermediate UseFinal DemandTotal Output
Iutput 12 G12 G
Intermediate Inputs1 Z D D 11 Z D F 11 Z D D 12 Z D F 12 Z D D 1 G Z D F 1 G Y D 11 Y D 12 Y D 1 G X D 1
Z F D 11 Z F F 11 Z F D 12 Z F F 12 Z F D 1 G Z F F 1 G Y F 11 Y F 12 Y F 1 G X F 1
2 Z D D 21 Z D F 21 Z D D 22 Z D F 22 Z D D 2 G Z D F 2 G Y D 21 Y D 22 Y D 2 G X D 2
Z F D 21 Z F F 21 Z F D 22 Z F F 22 Z F D 2 G Z F F 2 G Y F 21 Y F 22 Y F 2 G X F 2
G Z D D G 1 Z D F G 1 Z D D G 2 Z D F G 2 Z D D G G Z D F G G Y D G 1 Y D G 2 Y D G X D G
Z F D G 1 Z F F G 1 Z F D G 2 Z F F G 2 Z F D G G Z F F G G Y F G 1 Y F G 2 Y F G G X F G
Value added V a D 1 V a F 1 V a D 2 V a F 2 V a D G V a F G
Total input ( X D 1 ) ( X F 1 ) ( X D 2 ) ( X F 2 ) ( X D G ) ( X F G )
Note: 1, 2, …, G represent different countries; D and F represent DOEs and FIEs, respectively.
Table 2. The specific meanings of each factor.
AbbreviationVariable Explanation
Carbon intensity effect C ( Δ e ^ d s ) Carbon intensity effect of DOEs
C ( Δ e ^ f s ) Carbon intensity effect of FIEs
Input–output structural effectInteraction effect between DOEs C ( Δ B 1 ) Interaction effect between DOEs
Domestic GVC relationship effect C ( Δ B 2 ) Interaction effect between FIEs
C ( Δ B 3 ) Chain structure effect between DOEs and FIEs
C ( Δ B 4 ) Circle structure effect between DOEs and FIEs
Cross-border GVC relationship effect C ( Δ B 5 ) Chain structure effect between domestic and foreign firms
C ( Δ B 6 ) Circle structure effect between domestic and foreign firms
Final demand effectDomestic final product demand effect C ( Δ Y d S ) Final product demand effect on DOEs
C ( Δ Y f S ) Final product demand effect on FIEs
C ( Δ Y ( S ) S ) Final product demand effect on foreign firms
Foreign final product demand effect C ( Δ Y d S ) Final product demand of foreign countries on DOEs
C ( Δ Y f S ) Final product demand of foreign countries on FIEs
C ( Δ Y ( S ) ( S ) ) Final product demand of foreign countries on foreign firms
Table 3. Descriptive statistics of the data.
VariableObsMeanStd. Dev.MinMax
Carbon emissionsDOEs408228,875.4636,100.604,185,184.2
FIEs40812,198.125,416.50149,911.2
Total408241,073.5659,510.904,311,789.9
Disclaimer/Publisher’s Note: The statements, opinions and data contained in all publications are solely those of the individual author(s) and contributor(s) and not of MDPI and/or the editor(s). MDPI and/or the editor(s) disclaim responsibility for any injury to people or property resulting from any ideas, methods, instructions or products referred to in the content.

