Analyzing the Spatiotemporal Pattern and Interaction of SDGs for Sustainable Development in Inner Mongolia


Abstract
1. Introduction
2. Study Area
3. Materials and Methods
3.1. Principles for Constructing a Sustainable Development Evaluation Indicator System
3.2. Selection of Evaluation Indicators
3.3. Data Collection and Process
3.4. Calculating SDGs Scores at the Provincial and League Levels
3.5. Using SDGs Dashboards to Evaluate the Development Levels of Different Goals by Regions
3.6. Sen Trend Analyses and Mann–Kendall Test
3.7. Spearman Correlation Analysis and Network Analysis
3.8. Hot and Cold Spots Analysis
4. Results
4.1. Inter-Annual Change of SDG Scores at the Provincial Level
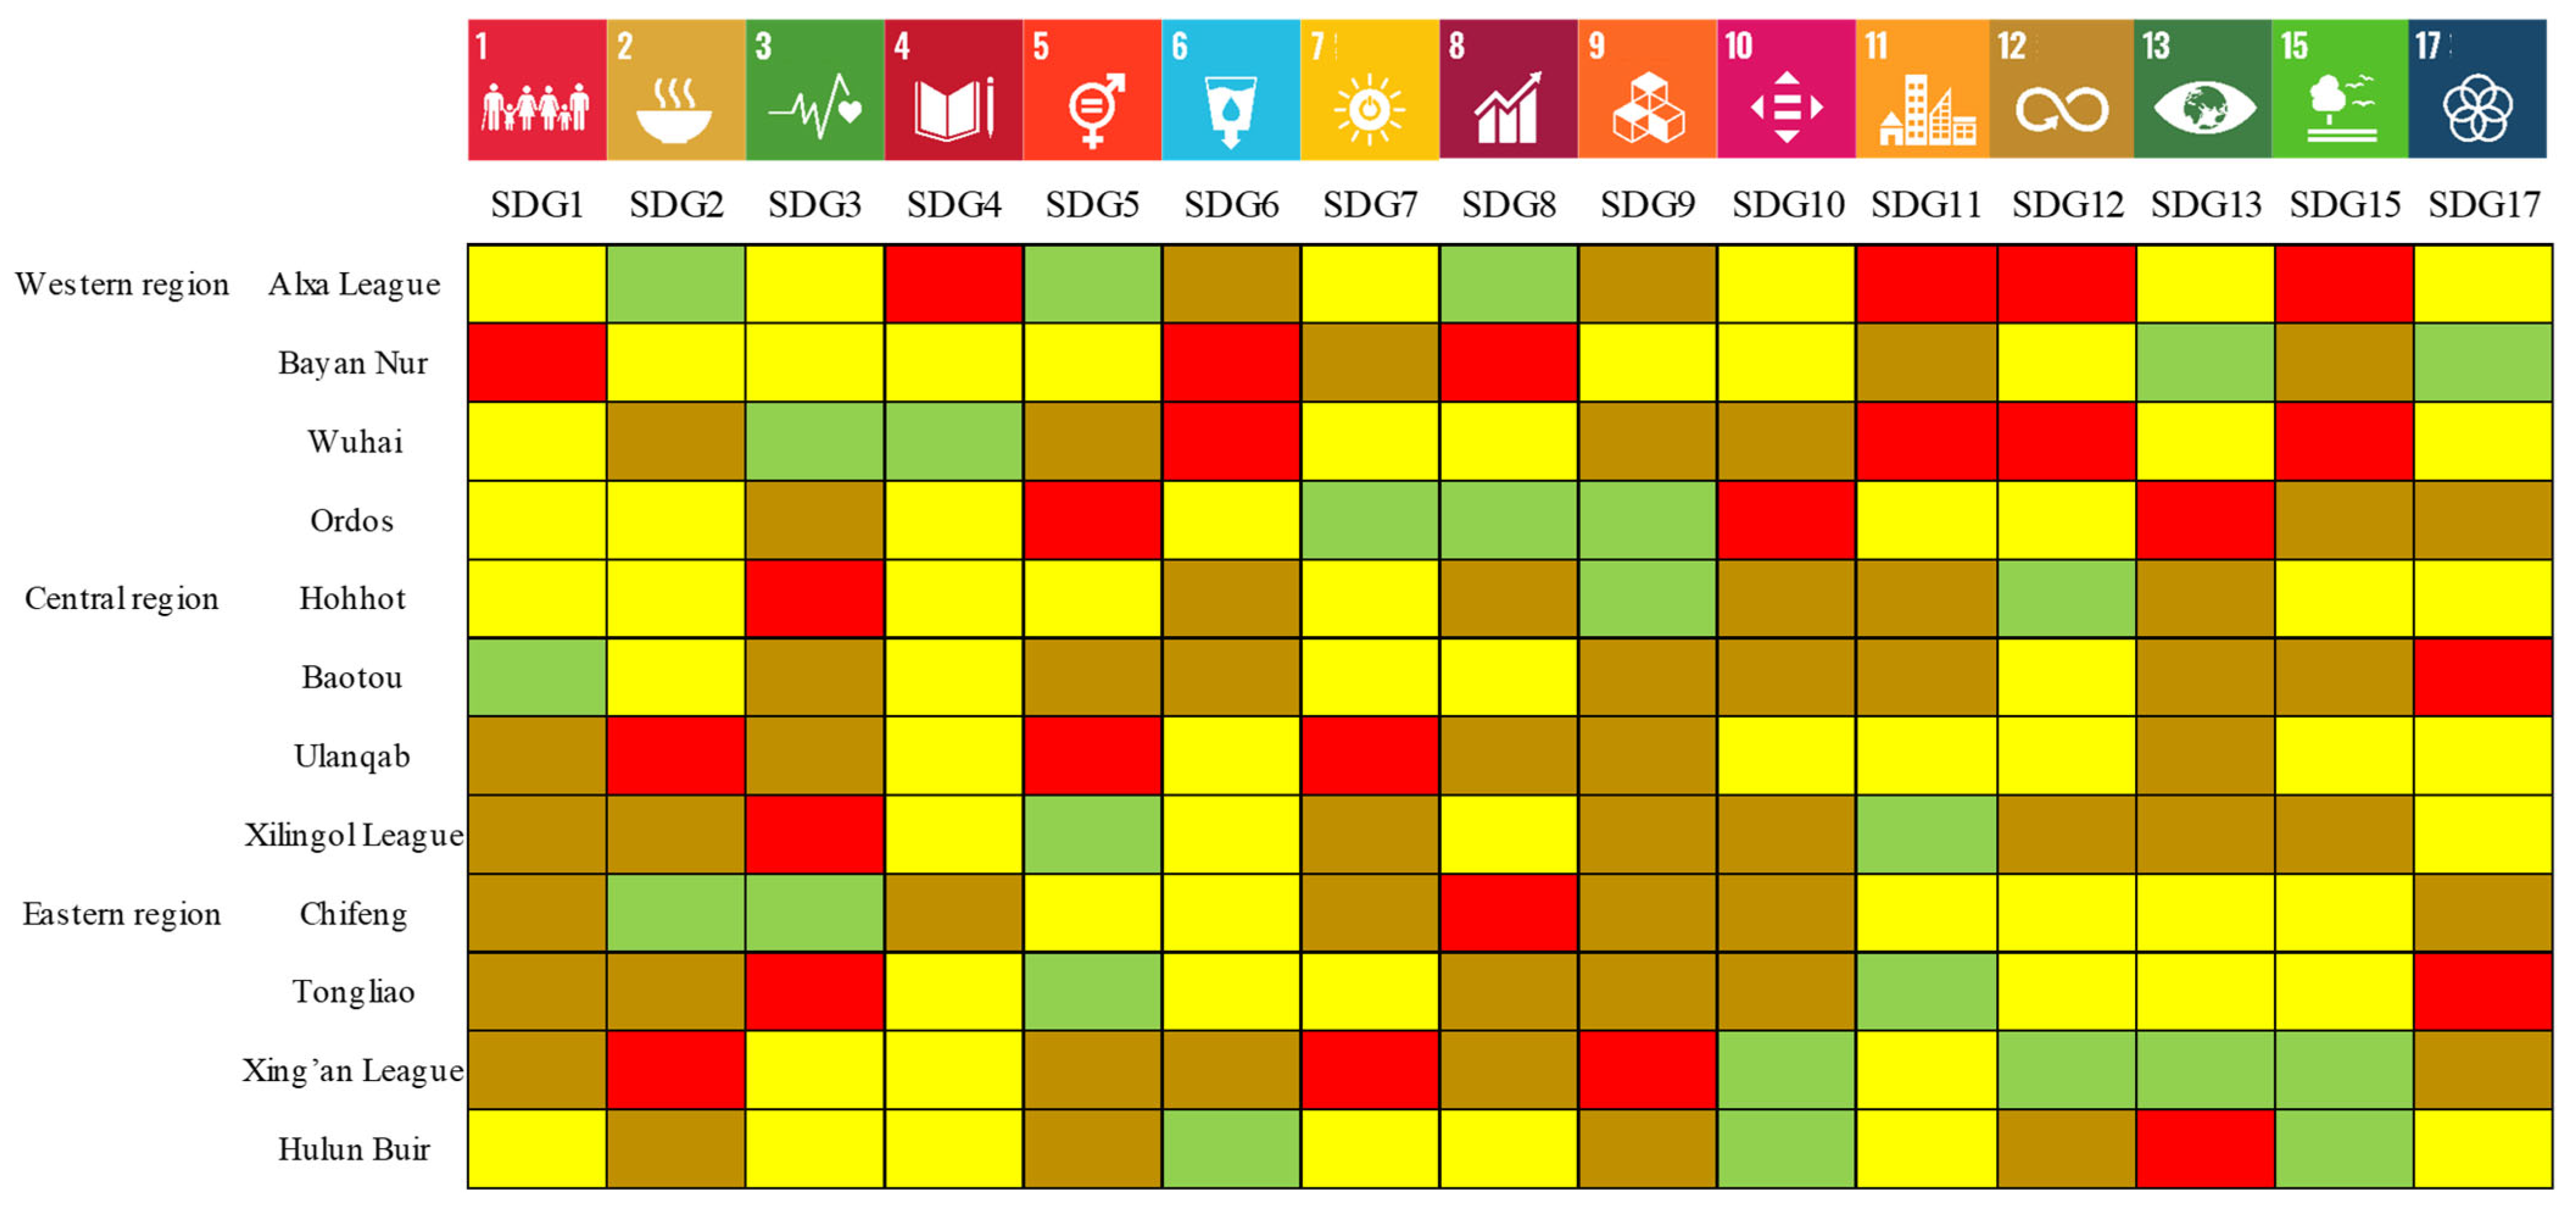
4.2. SDGs Scores at the Municipal Level in 2020
4.3. Hot and Cold Spots of SDGs at the Municipal Level in 2020
4.4. Interactions between SDGs and between the Indicators at the Principal Level in 2020
4.4.1. Interactions between Indicators
4.4.2. Interactions among Different Indicators of SDGs
5. Discussions
5.1. Increasing Trend of Sustainable Development in Inner Mongolia
5.2. Obvious Regional Differentiation of Sustainable Development in Inner Mongolia
5.3. Reasonable Improvement Required Clarifying Coordination and Trade-Offs among SDGs
5.4. Position and Future Prospects of This Study
6. Conclusions
- (1)
- At the provincial level, compared to other goals, the development of good medical conditions (SDG3) and sustainable energy use (SDG7) increased obviously, and the development of challenges in education (SDG4) decreased significantly from 2001 to 2020.
- (2)
- Different goals distributed divergently in different regions. Gender equality (SDG5), clean water and environmental sanitation (SDG6), social equality (SDG10), sustainable cities (SDG11), and sustainable use of terrestrial ecosystems (SDG15) got cold spots in the western region and hot spots in the eastern region. Decent work (SDG8) and infrastructure and sustainable industrialization (SDG9) got hot spots in the western regions.
- (3)
- For most SDGs and their indicators, synergies outweigh trade-offs. Of all the relationships among SDGs, the synergistic effect between good medical conditions (SDG3) and sustainable energy use (SDG7) was the strongest, and gender equality (SDG5) was the most important in the entire network. A total of 33.58% of the indicators had synergies, and 25.99% of the indicators had trade-offs. Of all the indicators, insurance participation ratio (SOC2), per capita disposable income of rural residents (ECO1), per capita GDP (ECO4), and per capita salary of employed personnel (ECO5) had the strongest synergies with each other, and land use rate (ECO15) and the proportion of desertified land to total land area (ENV20) had the strongest trade-off. Energy intensity (ECO2) was the most important indicator in the entire network.
Author Contributions
Funding
Institutional Review Board Statement
Informed Consent Statement
Data Availability Statement
Conflicts of Interest
References
- Reid, W.V.; Chen, D.; Goldfarb, L.; Hackmann, H.; Lee, Y.T.; Mokhele, K.; Ostrom, E.; Raivio, K.; Rockström, J.; Schellnhuber, H.J.; et al. Environment and development. Earth system science for global sustainability: Grand challenges. Science 2010, 330, 916–917. [Google Scholar] [CrossRef]
- UN. The Sustainable Development Goals Report 2020; UN: New York, NY, USA, 2020. [Google Scholar]
- Gupta, J.; Vegelin, C. Sustainable development goals and inclusive development. Int. Environ. Agreem. Politics Law Econ. 2016, 16, 433–448. [Google Scholar] [CrossRef]
- Aitsi-Selmi, A.; Murray, V.; Wannous, C.; Dichinson, C.; Johhston, D.; Kawasaki, A.; Stevance, A.; Yeung, T. Reflections on a science and technology agenda for 21st century disaster risk reduction. Int. J. Disast. Risk Sci. 2016, 7, 1–29. [Google Scholar] [CrossRef]
- Sachs, J.; Schmidt-Traub, G.; Kroll, C.; Durand-Delacre, D.; Teksoz, K. SDG Index and Dashboards-Global Report; Bertelsmann Stiftung and Sustainable Development Solutions Network (SDSN): New York, NY, USA, 2016. [Google Scholar]
- Ali, S.M.; Appolloni, A.; Cavallaro, F.; D’Adamo, I.; Di Vaio, A.; Ferella, F.; Gastaldi, M.; Ikram, M.; Kumar, N.M.; Martin, M.A.; et al. Development goals towards sustainability. Sustainability 2023, 15, 9443. [Google Scholar] [CrossRef]
- Xu, Z.; Chau, S.N.; Chen, X.; Zhang, J.; Li, Y.; Dietz, T.; Wang, J.; Winkler, J.A.; Fan, F.; Huang, B.; et al. Assessing progress towards sustainable development over space and time. Nature 2020, 577, 74–78. [Google Scholar] [CrossRef]
- Wang, Z.; Gao, Y.; Wang, X.; Lin, Q.; Li, L. A new approach to land use optimization and simulation considering urban development sustainability: A case study of Bortala, China. Sustain. Cities Soc. 2022, 87, 104135. [Google Scholar] [CrossRef]
- Dong, J.; Wang, Y.; Wang, L.; Zhao, W.; Huang, C. Assessment of PM2.5 exposure risk towards SDG indicator 11.6.2—A case study in Beijing. Sustain. Cities Soc. 2022, 82, 103864. [Google Scholar] [CrossRef]
- He, R.; Shao, C.; Liu, D.; Luo, B.; Tang, S. Study on evaluation of ecological civilization development in Sichuan Province based on sustainable development goals. Environ. Pollut. Control 2022, 44, 1121–1126. [Google Scholar]
- Cheng, Q.; Zhong, F.; Zuo, X.; Yang, C. Evaluation of Water Resources Carrying Capacity of Heihe River Basin Combining Beautiful China with SDGs. J. Desert Res. 2020, 1, 204–214. [Google Scholar]
- Måns, N.; Dave, G.; Martin, V. Policy: Map the interactions between sustainable development goals. Nature 2016, 534, 320–322. [Google Scholar]
- Lusseau, D.; Mancini, F. Income-based variation in sustainable development goal interaction networks. Nat. Sustain. 2019, 2, 242–247. [Google Scholar] [CrossRef]
- Wu, X.; Fu, B.; Wang, S.; Song, S.; Li, Y.J.; Xu, Z.C.; Wei, Y.P.; Liu, J.G. Decoupling of SDGs followed by re-coupling as sustainable development progresses. Nat. Sustain. 2022, 5, 452–459. [Google Scholar] [CrossRef]
- Xiao, H.; Liu, Y.; Ren, J. Synergies and trade-offs across sustainable development goals: A novel method incorporating indirect interactions analysis. Sustain. Dev. 2023, 31, 1135–1148. [Google Scholar] [CrossRef]
- Zhang, J.; Wang, S.; Zhao, W.; Meadows, M.E.; Fu, B. Finding pathways to synergistic development of sustainable development goals in China. Humanit. Soc. Sci. Commun. 2022, 9, 21. [Google Scholar] [CrossRef]
- Wang, M.; Janssen, A.B.G.; Bazin, J.; Strokal, M.; Ma, L.; Kroeze, C. Accounting for interactions between Sustainable Development Goals is essential for water pollution control in China. Nat. Commun. 2022, 13, 730. [Google Scholar] [CrossRef] [PubMed]
- Hansson, S.; Helen, A.; David, S. Governance for sustainable urban development: The double function of SDG indicators. Area Dev. Policy 2019, 4, 217–235. [Google Scholar] [CrossRef]
- Xu, Z.C.; Liu, H.M.; Han, P.; Lu, X.Y.; Wang, L.X.; Wen, L. Analysis of the characteristics and driving forces of the temporal and spatial evolution of ecological security in Inner Mongolia. Acta Ecol. Sin. 2021, 11, 4354–4366. [Google Scholar]
- Zhou, Y.J.; Liu, T.X.; Duan, L.M.; Wang, Y.X.; Li, X.; Li, M.Y. Driving force analysis and landscape pattern evolution in the upstream valley of Xilin River Basin. Arid Zone Res. 2020, 37, 580–590. [Google Scholar]
- Feng, Y.W.; Zhen, J.H.; Ma, C.Y. Evaluation of ecological carrying capacity and optimization of ecological security pattern in Inner Mongolia. Geo. Res. 2021, 40, 1096–1110. [Google Scholar]
- Shao, C.F.; Chen, S.H.; Gao, J.L.; He, Y.; Zhou, H.L. Design of China’s sustainable development evaluation index system based on the SDGs. Chin. J. Popul. Resour. Environ. 2021, 31, 1–12. [Google Scholar]
- Wei, D.S.; Liu, B.; Duan, Z.G.; Yang, W.T. Measuring local progress of the 2030 agenda for SDGs in the Yangtze River economic zone, China. Environ. Dev. Sustain. 2022, 24, 7178–7194. [Google Scholar] [CrossRef]
- Xu, Z.H.; Peng, J.; Liu, Y.X.; Qiu, S.J.; Zhang, H.B.; Dong, J.Q. Exploring the combined impact of ecosystem services and urbanization on SDGs realization. Appl. Geogr. 2023, 153, 102907. [Google Scholar] [CrossRef]
- Zhang, X.; Liu, L.; Chen, X.; Gao, Y.; Mi, J. Glc_fcs30: Global land-cover product with fine classification system at 30 m using time-series Landsat imagery. Earth Syst. Sci. Data 2021, 13, 2753–2776. [Google Scholar] [CrossRef]
- Chen, J.; Ding, T.; Li, M.; Wang, H. Multi-Objective Optimization of a Regional Water–Energy–Food System Considering Environmental Constraints: A Case Study of Inner Mongolia, China. Int. J. Environ. Res. Public Health 2020, 17, 6834. [Google Scholar] [CrossRef]
- Xu, X.; Wang, Y.Y. Measurement, regional difference and dynamics evolution of rural revitalization level in China. J. Quant. Technol. Econ. 2022, 39, 64–83. [Google Scholar]
- Arrieta-Castro, M.; Donado-Rodríguez, A.; Acuña, G.J.; Canales, F.A.; Kamierczak, B. Analysis of streamflow variability and trends in the Meta River, Colombia. Water 2020, 12, 1451. [Google Scholar] [CrossRef]
- Pradhan, P.; Costa, L.; Rybski, D.; Lucht, W.; Kropp, J.P. A systematic study of sustainable development goal (SDG) interactions. Earth’s Future 2017, 5, 1169–1179. [Google Scholar] [CrossRef]
- Sebestyén, V.; Bulla, M.; Rédey, A.; Abonyi, J. Data-driven multilayer complex networks of sustainable development goals. Data Brief 2019, 25, 104049. [Google Scholar] [CrossRef] [PubMed]
- Shao, H.Q.; Wang, Z.F. Spatial network structure of transportation carbon emissions efficiency in China and its influencing factors. Chin. J. Popul. Resour. Environ. 2021, 4, 32–41. [Google Scholar] [CrossRef]
- Yang, K.; Fujisaki, I.; Ueda, K. Cooperation patterns of members in networks during co-creation. Sci. Rep. Vol. 2021, 11, 11588. [Google Scholar] [CrossRef]
- Gong, M.; Yu, K.; Xu, Z.; Xu, M.; Qu, S. Unveiling complementarities between national sustainable development strategies through network analysis. J. Environ. Manag. 2024, 350, 119531. [Google Scholar] [CrossRef]
- Wang, M.S.; Chen, Z.Y.; Mu, L.; Zhang, X. Road network structure and ride-sharing accessibility: A network science perspective. Comput. Environ. Urban 2020, 80, 101430. [Google Scholar] [CrossRef]
- Wei, Y.; Zhong, F.L.; Song, X.Y.; Huang, C.L. Exploring the impact of poverty on the sustainable development goals: Inhibiting synergies and magnifying trade-offs. Sustain. Cities Soc. 2023, 89, 104367. [Google Scholar] [CrossRef]
- Olusola, B.; Oluwasegun, O.; Nasser, Y.; Humphrey, A.; Jian, L.; Sandra, O.; Qi, H. Comprehensive functional data analysis of China’s dynamic energy security index. Energy Rep. 2021, 7, 6246–6259. [Google Scholar]
- Zong, J.; Zhang, Y.; Mu, X.; Wang, L.; Lu, C.; Du, Y.; Ji, X.; Wang, Q. Prioritizing sustainable development goals in China based on a comprehensive assessment accounting for indicator interlinkages. Heliyon 2023, 9, e22751. [Google Scholar] [CrossRef] [PubMed]
- Ortuño-Padilla, A.; Espinosa-Flor, A.; Cerdán-Aznar, L. Development strategies at station areas in Southwestern China: The case of Mianyang city. Land Use Pol. 2017, 68, 660–670. [Google Scholar] [CrossRef]
- Liu, Y.; Du, J.; Ding, B.; Liu, Y.; Liu, W.; Xia, A.; Huo, R.; Ran, Q.; Hao, Y.; Cui, X.; et al. Water resource conservation promotes synergy between economy and environment in China’s northern drylands. Front. Environ. Sci. Eng. 2022, 16, 28. [Google Scholar] [CrossRef]
- Zhao, F.; Sun, Y.; Zhang, J. Does industrial agglomeration and environmental pollution have a spatial spillover effect? taking panel data of resource-based cities in China as an example. Environ. Sci. Pollut. Res. 2023, 30, 7629–76841. [Google Scholar] [CrossRef]
- Hoek Van Dijke, A.J.H.; Herold, M.; Mallick, K.; Benedict, I.; Machwitz, M.; Schlerf, M.; Pranindita, A.; Teeuwen, J.J.E.; Bastin, J.; Teuling, A. Shifts in regional water availability due to global tree restoration. Nat. Geosci. 2022, 15, 363–368. [Google Scholar] [CrossRef]
- Fu, B.; Wang, S.; Zhang, J.; Zhou, J.L. Unravelling the complexity in achieving the 17 sustainable-development goals. Natl. Sci. Rev. 2019, 6, 386–388. [Google Scholar] [CrossRef]
- Pham-Truffert, M.; Metz, F.; Fischer, M.; Rueff, H.; Messerli, P. Interactions among sustainable development goals: Knowledge for identifying multipliers and virtuous cycles. Sustain. Dev. 2020, 28, 1236–1250. [Google Scholar] [CrossRef]


| Subsystem | Goal | Indicator | Indicator Number | Role * |
|---|---|---|---|---|
| Society | SDG1 | Population proportion covered by unemployment insurance (%) | SOC1 | Positive |
| SDG1 | Insurance participation ratio (%) | SOC2 | Positive | |
| SDG1 | The proportion of education expenditure to fiscal budget expenditure (%) | SOC3 | Positive | |
| SDG2 | Grain yield per hectare (kg/ha) | SOC4 | Positive | |
| SDG2 | Growth rate of grain production (%) | SOC5 | Positive | |
| SDG2 | Per capita arable land area (km2/10,000 people) | SOC6 | Positive | |
| SDG3 | Basic medical insurance coverage rate (%) | SOC7 | Positive | |
| SDG3 | Engel’s coefficient (%) | SOC8 | Negative | |
| SDG3 | Death toll from traffic injuries per 100,000 people | SOC9 | Negative | |
| SDG3 | The proportion of local medical and health expenditure to fiscal budget expenditure (%) | SOC10 | Positive | |
| SDG3 | Number of people involved in medical services per 10,000 people | SOC11 | Positive | |
| SDG3 | Number of beds in medicine treatment institutions per 10,000 people | SOC12 | Positive | |
| SDG4 | Enrollment rate of school-age children (%) | SOC13 | Positive | |
| SDG4 | The ratio of the number of teachers to the number of students in higher education institutions (%) | SOC14 | Positive | |
| SDG5 | Mobile phone penetration rate (unit/100 households) | SOC15 | Positive | |
| SDG5 | The proportion of female employees (%) | SOC16 | Positive | |
| SDG6 | Popularity rate of rural sanitary toilets (%) | SOC17 | Positive | |
| SDG7 | Urban gas penetration rate (%) | SOC18 | Positive | |
| SDG8 | Work injury insurance coverage rate (%) | SOC19 | Positive | |
| SDG11 | Bus ownership per 10,000 people | SOC20 | Positive | |
| SDG11 | The ratio of built-up area growth rate to population growth rate (%) | SOC21 | Positive | |
| SDG11 | Population density (person/km2) | SOC22 | Positive | |
| SDG11 | Per capita construction land area (km2/10,000 people) | SOC23 | Positive | |
| SDG17 | Internet penetration rate (unit/100 households) | SOC24 | Positive | |
| Economy | SDG2 | Per capita disposable income of rural residents (¥) | ECO1 | Positive |
| SDG7 | Energy intensity (ton of standard coal/10,000 ¥) | ECO2 | Negative | |
| SDG8 | Real per capita GDP annual average growth rate (%) | ECO3 | Positive | |
| SDG8 | Per capita GDP (¥) | ECO4 | Positive | |
| SDG8 | Per capita salary of employed personnel (¥) | ECO5 | Positive | |
| SDG8 | Urban registered unemployment rate (%) | ECO6 | Negative | |
| SDG8 | Annual growth rate of tourism industry revenue (%) | ECO7 | Positive | |
| SDG8 | The proportion of tourism industry revenue to GDP (%) | ECO8 | Positive | |
| SDG9 | Highway passenger volume (10,000 people) | ECO9 | Negative | |
| SDG9 | Highway freight volume (10,000 tons) | ECO10 | Positive | |
| SDG9 | Number of researchers per million population | ECO11 | Positive | |
| SDG10 | Annual growth rate of per capita disposable income of urban residents (%) | ECO12 | Positive | |
| SDG10 | Annual growth rate of per capita disposable income of rural residents (%) | ECO13 | Positive | |
| SDG10 | The proportion of total wages of urban unit employees to GDP (%) | ECO14 | Positive | |
| SDG11 | Land use rate (%) | ECO15 | Positive | |
| SDG17 | The proportion of local general public budget revenue to GDP (%) | ECO16 | Positive | |
| SDG17 | The proportion of total exports to GDP (%) | ECO17 | Positive | |
| Environment | SDG2 | Fertilizer application intensity (t/km2) | ENV1 | Negative |
| SDG6 | Per capita water resources (m3) | ENV2 | Positive | |
| SDG6 | Popularization rate of safe drinking water (%) | ENV3 | Positive | |
| SDG6 | Urban sewage treatment rate (%) | ENV4 | Positive | |
| SDG6 | Water consumption per 10,000 yuan of GDP (m3/10,000 ¥) | ENV5 | Negative | |
| SDG6 | Water resource pressure (proportion of total water use to total water resources) (%) | ENV6 | Negative | |
| SDG6 | Change rate of water area (%) | ENV7 | Positive | |
| SDG11 | Harmless treatment rate of household waste (%) | ENV8 | Positive | |
| SDG11 | Annual mean concentration of PM2.5 (mg/m3) | ENV9 | Negative | |
| SDG11 | Per capita park green space area (m2) | ENV10 | Positive | |
| SDG12 | Per capita industrial wastewater discharge (tons/person) | ENV11 | Negative | |
| SDG12 | Per capita industrial sulfur dioxide emissions (kg/person) | ENV12 | Negative | |
| SDG12 | Total sulfur dioxide emissions per unit GDP (t/billion ¥) | ENV13 | Negative | |
| SDG13 | Carbon dioxide emissions (million tons) | ENV14 | Negative | |
| SDG13 | Total SO2 emissions (t) | ENV15 | Negative | |
| SDG13 | Carbon intensity per unit GDP (t/10,000 ¥) | ENV16 | Negative | |
| SDG15 | Forest coverage rate (%) | ENV17 | Positive | |
| SDG15 | The proportion of wetland area to total land area (%) | ENV18 | Positive | |
| SDG15 | Afforestation area (thousand ha) | ENV19 | Positive | |
| SDG15 | The proportion of desertified land to total land area (%) | ENV20 | Negative | |
| SDG15 | The proportion of forest ecosystem nature reserve area to nature reserve area (%) | ENV21 | Positive | |
| SDG15 | The proportion of grassland ecosystem nature reserve area to nature reserve area (%) | ENV22 | Positive | |
| SDG15 | The proportion of the area of wildlife nature reserves to the area of nature reserves (%) | ENV23 | Positive |
| SDGs | Trend | Sen Slope (per Year) | Z Value |
|---|---|---|---|
| SDG1 | Increasing | 3.540 ** | 4.185 |
| SDG2 | Increasing | 2.651 ** | 4.445 |
| SDG3 | Increasing | 5.616 ** | 5.568 |
| SDG4 | Decreasing | −0.838 ** | −2.727 |
| SDG5 | Increasing | 3.055 ** | 5.808 |
| SDG6 | Increasing | 3.135 ** | 4.185 |
| SDG7 | Increasing | 5.873 ** | 5.483 |
| SDG8 | Increasing | 2.613 ** | 5.353 |
| SDG9 | Increasing | 5.003 ** | 5.353 |
| SDG10 | Insignificance | −0.998 | −1.59 |
| SDG11 | Increasing | 3.815 ** | 5.288 |
| SDG12 | Insignificance | 1.34 | 1.395 |
| SDG13 | Insignificance | 1.068 | 1.136 |
| SDG15 | Insignificance | −0.05 | −0.487 |
| SDG17 | Increasing | 1.672 ** | 2.693 |
| SDGs | Hub Centrality | Betweenness Centrality | Proximity Centrality | Eigenvector Centrality | K-Kernel |
|---|---|---|---|---|---|
| SDG5 | 11 | 18.25 | 1 | 0.328 | 8 |
| SDG2 | 9 | 0.536 | 0.846154 | 0.321 | 8 |
| SDG3 | 9 | 0.536 | 0.846154 | 0.321 | 8 |
| SDG6 | 9 | 0.536 | 0.846154 | 0.321 | 8 |
| SDG7 | 9 | 0.536 | 0.846154 | 0.321 | 8 |
| SDG8 | 9 | 0.536 | 0.846154 | 0.321 | 8 |
| SDG9 | 9 | 0.25 | 0.846154 | 0.321 | 8 |
| SDG11 | 9 | 0.25 | 0.846154 | 0.321 | 8 |
| SDG1 | 8 | 0.286 | 0.785714 | 0.291 | 8 |
| SDG17 | 8 | 0.25 | 0.785714 | 0.291 | 8 |
| SDG10 | 1 | 0 | 0.52381 | 0.037 | 1 |
| SDG15 | 1 | 0 | 0.52381 | 0.037 | 1 |
| SDG12 | 1 | 0 | 1 | 0 | 1 |
| SDG13 | 1 | 0 | 1 | 0 | 1 |
| SDG4 | 0 | 0 | 0 | 0 | 0 |
| Indicator | Hub Centrality | Betweenness Centrality | Proximity Centrality | Eigenvector Centrality | K-Kernel |
|---|---|---|---|---|---|
| ECO2 | 52 | 27.513 | 0.948 | 0.147 | 36 |
| SOC11 | 51 | 12.563 | 0.932 | 0.147 | 36 |
| ENV13 | 51 | 12.563 | 0.932 | 0.147 | 36 |
| SOC4 | 50 | 5.194 | 0.917 | 0.146 | 36 |
| SOC9 | 50 | 5.194 | 0.917 | 0.146 | 36 |
| SOC2 | 49 | 1.788 | 0.902 | 0.146 | 36 |
| SOC7 | 49 | 1.788 | 0.902 | 0.146 | 36 |
| SOC8 | 49 | 1.788 | 0.902 | 0.146 | 36 |
| SOC10 | 49 | 1.788 | 0.902 | 0.146 | 36 |
| SOC12 | 49 | 1.788 | 0.902 | 0.146 | 36 |
| SOC13 | 49 | 1.788 | 0.902 | 0.146 | 36 |
| SOC15 | 49 | 1.788 | 0.902 | 0.146 | 36 |
| SOC17 | 49 | 1.788 | 0.902 | 0.146 | 36 |
| SOC18 | 49 | 1.788 | 0.902 | 0.146 | 36 |
| SOC19 | 49 | 1.788 | 0.902 | 0.146 | 36 |
| SOC23 | 49 | 1.788 | 0.902 | 0.146 | 36 |
| SOC24 | 49 | 1.788 | 0.902 | 0.146 | 36 |
| ECO1 | 49 | 1.788 | 0.902 | 0.146 | 36 |
| ECO4 | 49 | 1.788 | 0.902 | 0.146 | 36 |
| ECO5 | 49 | 1.788 | 0.902 | 0.146 | 36 |
| ECO8 | 49 | 1.788 | 0.902 | 0.146 | 36 |
| ECO10 | 49 | 1.788 | 0.902 | 0.146 | 36 |
| ECO11 | 49 | 1.788 | 0.902 | 0.146 | 36 |
| ENV3 | 49 | 1.788 | 0.902 | 0.146 | 36 |
| ENV4 | 49 | 1.788 | 0.902 | 0.146 | 36 |
| ENV8 | 49 | 1.788 | 0.902 | 0.146 | 36 |
| ENV10 | 49 | 1.788 | 0.902 | 0.146 | 36 |
| ENV17 | 49 | 1.788 | 0.902 | 0.146 | 36 |
| SOC14 | 49 | 1.788 | 0.902 | 0.146 | 6 |
| ENV14 | 49 | 1.788 | 0.902 | 0.146 | 6 |
Disclaimer/Publisher’s Note: The statements, opinions and data contained in all publications are solely those of the individual author(s) and contributor(s) and not of MDPI and/or the editor(s). MDPI and/or the editor(s) disclaim responsibility for any injury to people or property resulting from any ideas, methods, instructions or products referred to in the content. |
© 2024 by the authors. Licensee MDPI, Basel, Switzerland. This article is an open access article distributed under the terms and conditions of the Creative Commons Attribution (CC BY) license (https://creativecommons.org/licenses/by/4.0/).
Share and Cite
Yan, M.; Tian, Y.; Wu, L.; Zheng, H. Analyzing the Spatiotemporal Pattern and Interaction of SDGs for Sustainable Development in Inner Mongolia. Sustainability 2024, 16, 6899. https://doi.org/10.3390/su16166899
Yan M, Tian Y, Wu L, Zheng H. Analyzing the Spatiotemporal Pattern and Interaction of SDGs for Sustainable Development in Inner Mongolia. Sustainability. 2024; 16(16):6899. https://doi.org/10.3390/su16166899
Chicago/Turabian StyleYan, Mengxuan, Yuhong Tian, Lizhu Wu, and Huichao Zheng. 2024. "Analyzing the Spatiotemporal Pattern and Interaction of SDGs for Sustainable Development in Inner Mongolia" Sustainability 16, no. 16: 6899. https://doi.org/10.3390/su16166899
APA StyleYan, M., Tian, Y., Wu, L., & Zheng, H. (2024). Analyzing the Spatiotemporal Pattern and Interaction of SDGs for Sustainable Development in Inner Mongolia. Sustainability, 16(16), 6899. https://doi.org/10.3390/su16166899