
Research on the Spatial Structure of Xinjiang Port Cities Based on Multi-Source Geographic Big Data—A Case of Central Kashi City

Abstract
1. Introduction
2. Study Area and Data Sources
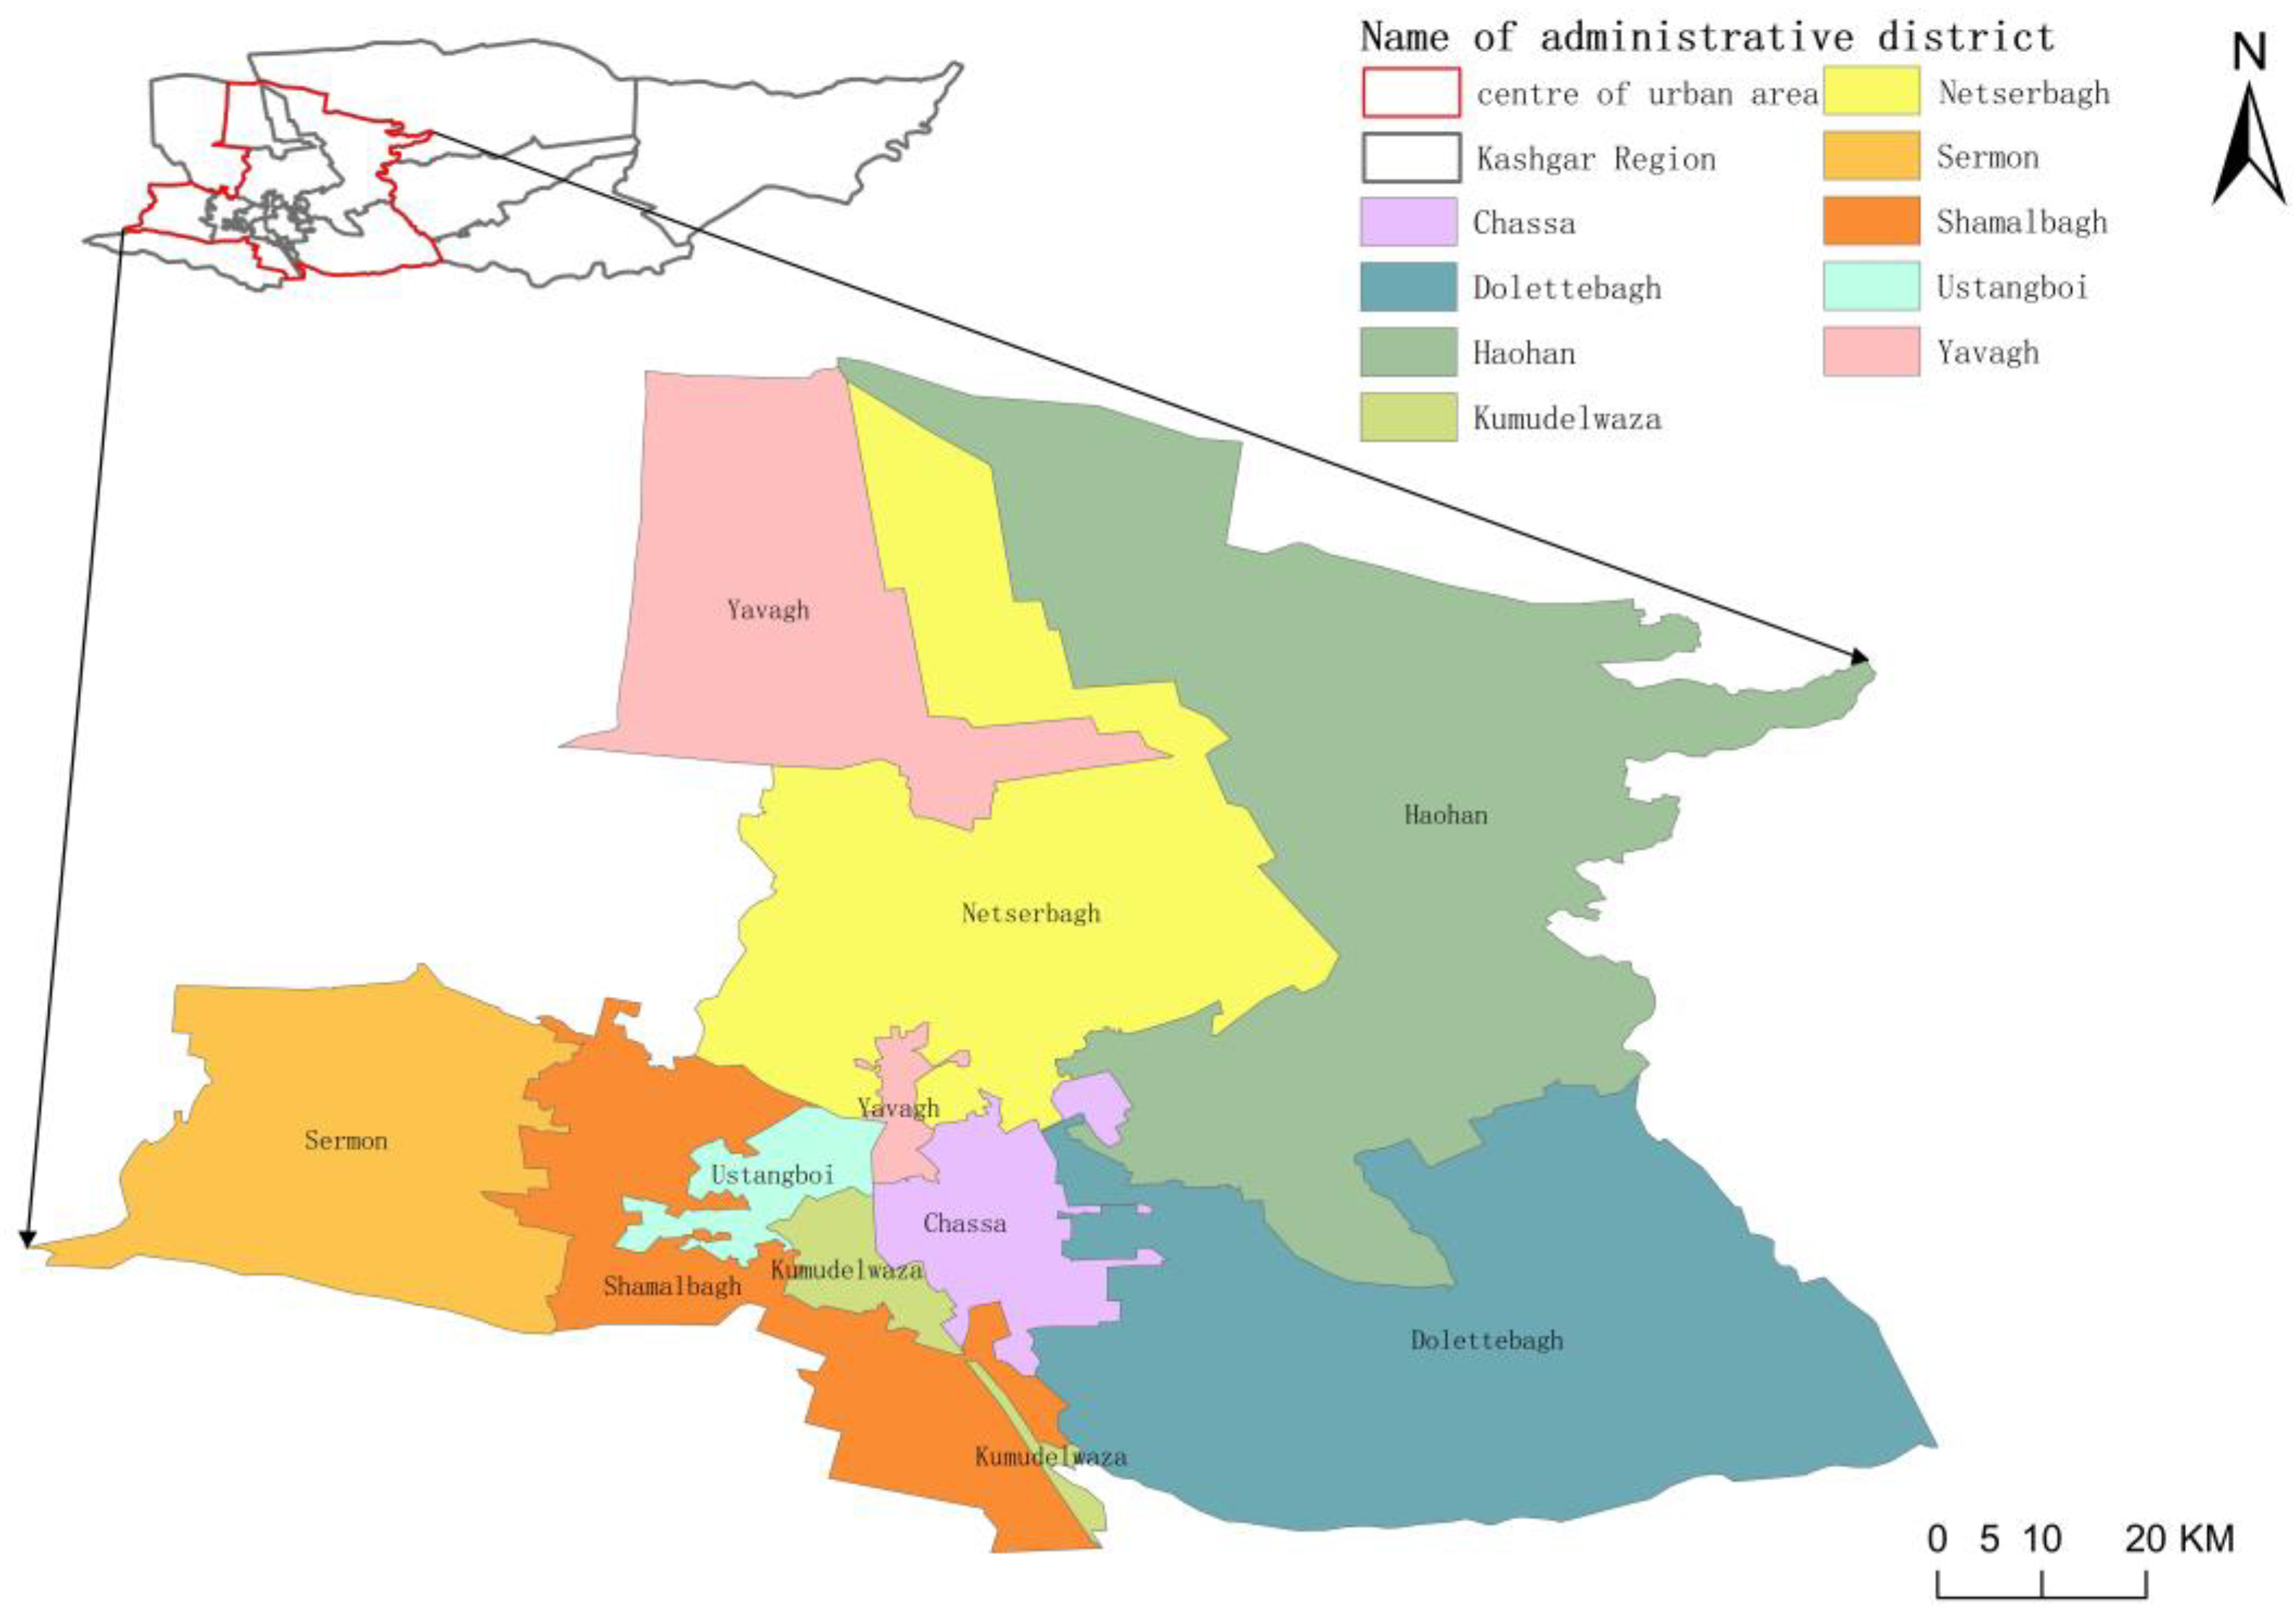
2.1. Overview of the Study Area
2.2. Data Sources
- (1)
- POI data. POI are special places or interesting locations marked on a map. They usually include a variety of commercial, cultural, recreational, and social service locations. The POI data used in this paper comes from the API interface provided by the 2022 Kashi Gaode Map, which provides a total of 14 major categories of POI data in Kashi, totalling 14,751 pieces of data, specifically including food and beverage services, shopping services, science, education and cultural services, scenic spots, public facilities, companies and enterprises, transport facility services, business and residential, living services, sports and leisure services, healthcare services, government organisations and social groups, and accommodation services. In order to facilitate the spatial coupling analysis with the nighttime lighting data and OSM road network data at a later stage, the toponymic addresses, ATMs, public toilets, entrances, and exits, which are not very relevant to this study, were deleted to obtain the required study data.
- (2)
- Nighttime lighting data. NTL data refer to the collection and recording of data on the quantity, brightness, and distribution of nighttime lighting in a city or region, which is important for comparing the level of development of different regions, monitoring urban sprawl, and improving urban planning. The remote sensing data source for nighttime lighting in this paper is the NPP—VIIRS “Nighttime Lights Data set” published by the National Earth System Science Data Centre (NESDC) at a “global resolution of 500 m”, which was the global NPP-VIIRS long time series night light data obtained by scholars Chen Zuoqi et al. [29] based on cross-sensor calibration, with a spatial resolution of about 500 m.
- (3)
- OSM road network data. The OSM data in this article was sourced from the official Open Street Map website and covers geographic information data on roads and transport networks around the world. OSM roads have very high positioning accuracy and topological relationships and contain basic spatial information such as latitude and longitude as well as attribute information such as road name, road type, maximum travelling speed, and one-way streets. The irregular grid constituted by the road network is the basic unit to undertake the socio-economic functions of urban management and urban planning, and the final required research unit is generated by extending, deleting, topology checking, and conducting other operations on the 0SM road network data and topologising the processed road network data into surfaces. Detailed data sources are shown in Table 1.
3. Research Methodology
3.1. Kernel Density Analysis
3.2. Raster Data Grid Analysis
3.3. Two-Factor Mapping
3.4. Delineation of Land Use Units Based on OSM
3.5. Identification of Urban Functional Areas
4. Analysis of Spatial Integration Results
4.1. Analysis of NTL and POI Integration
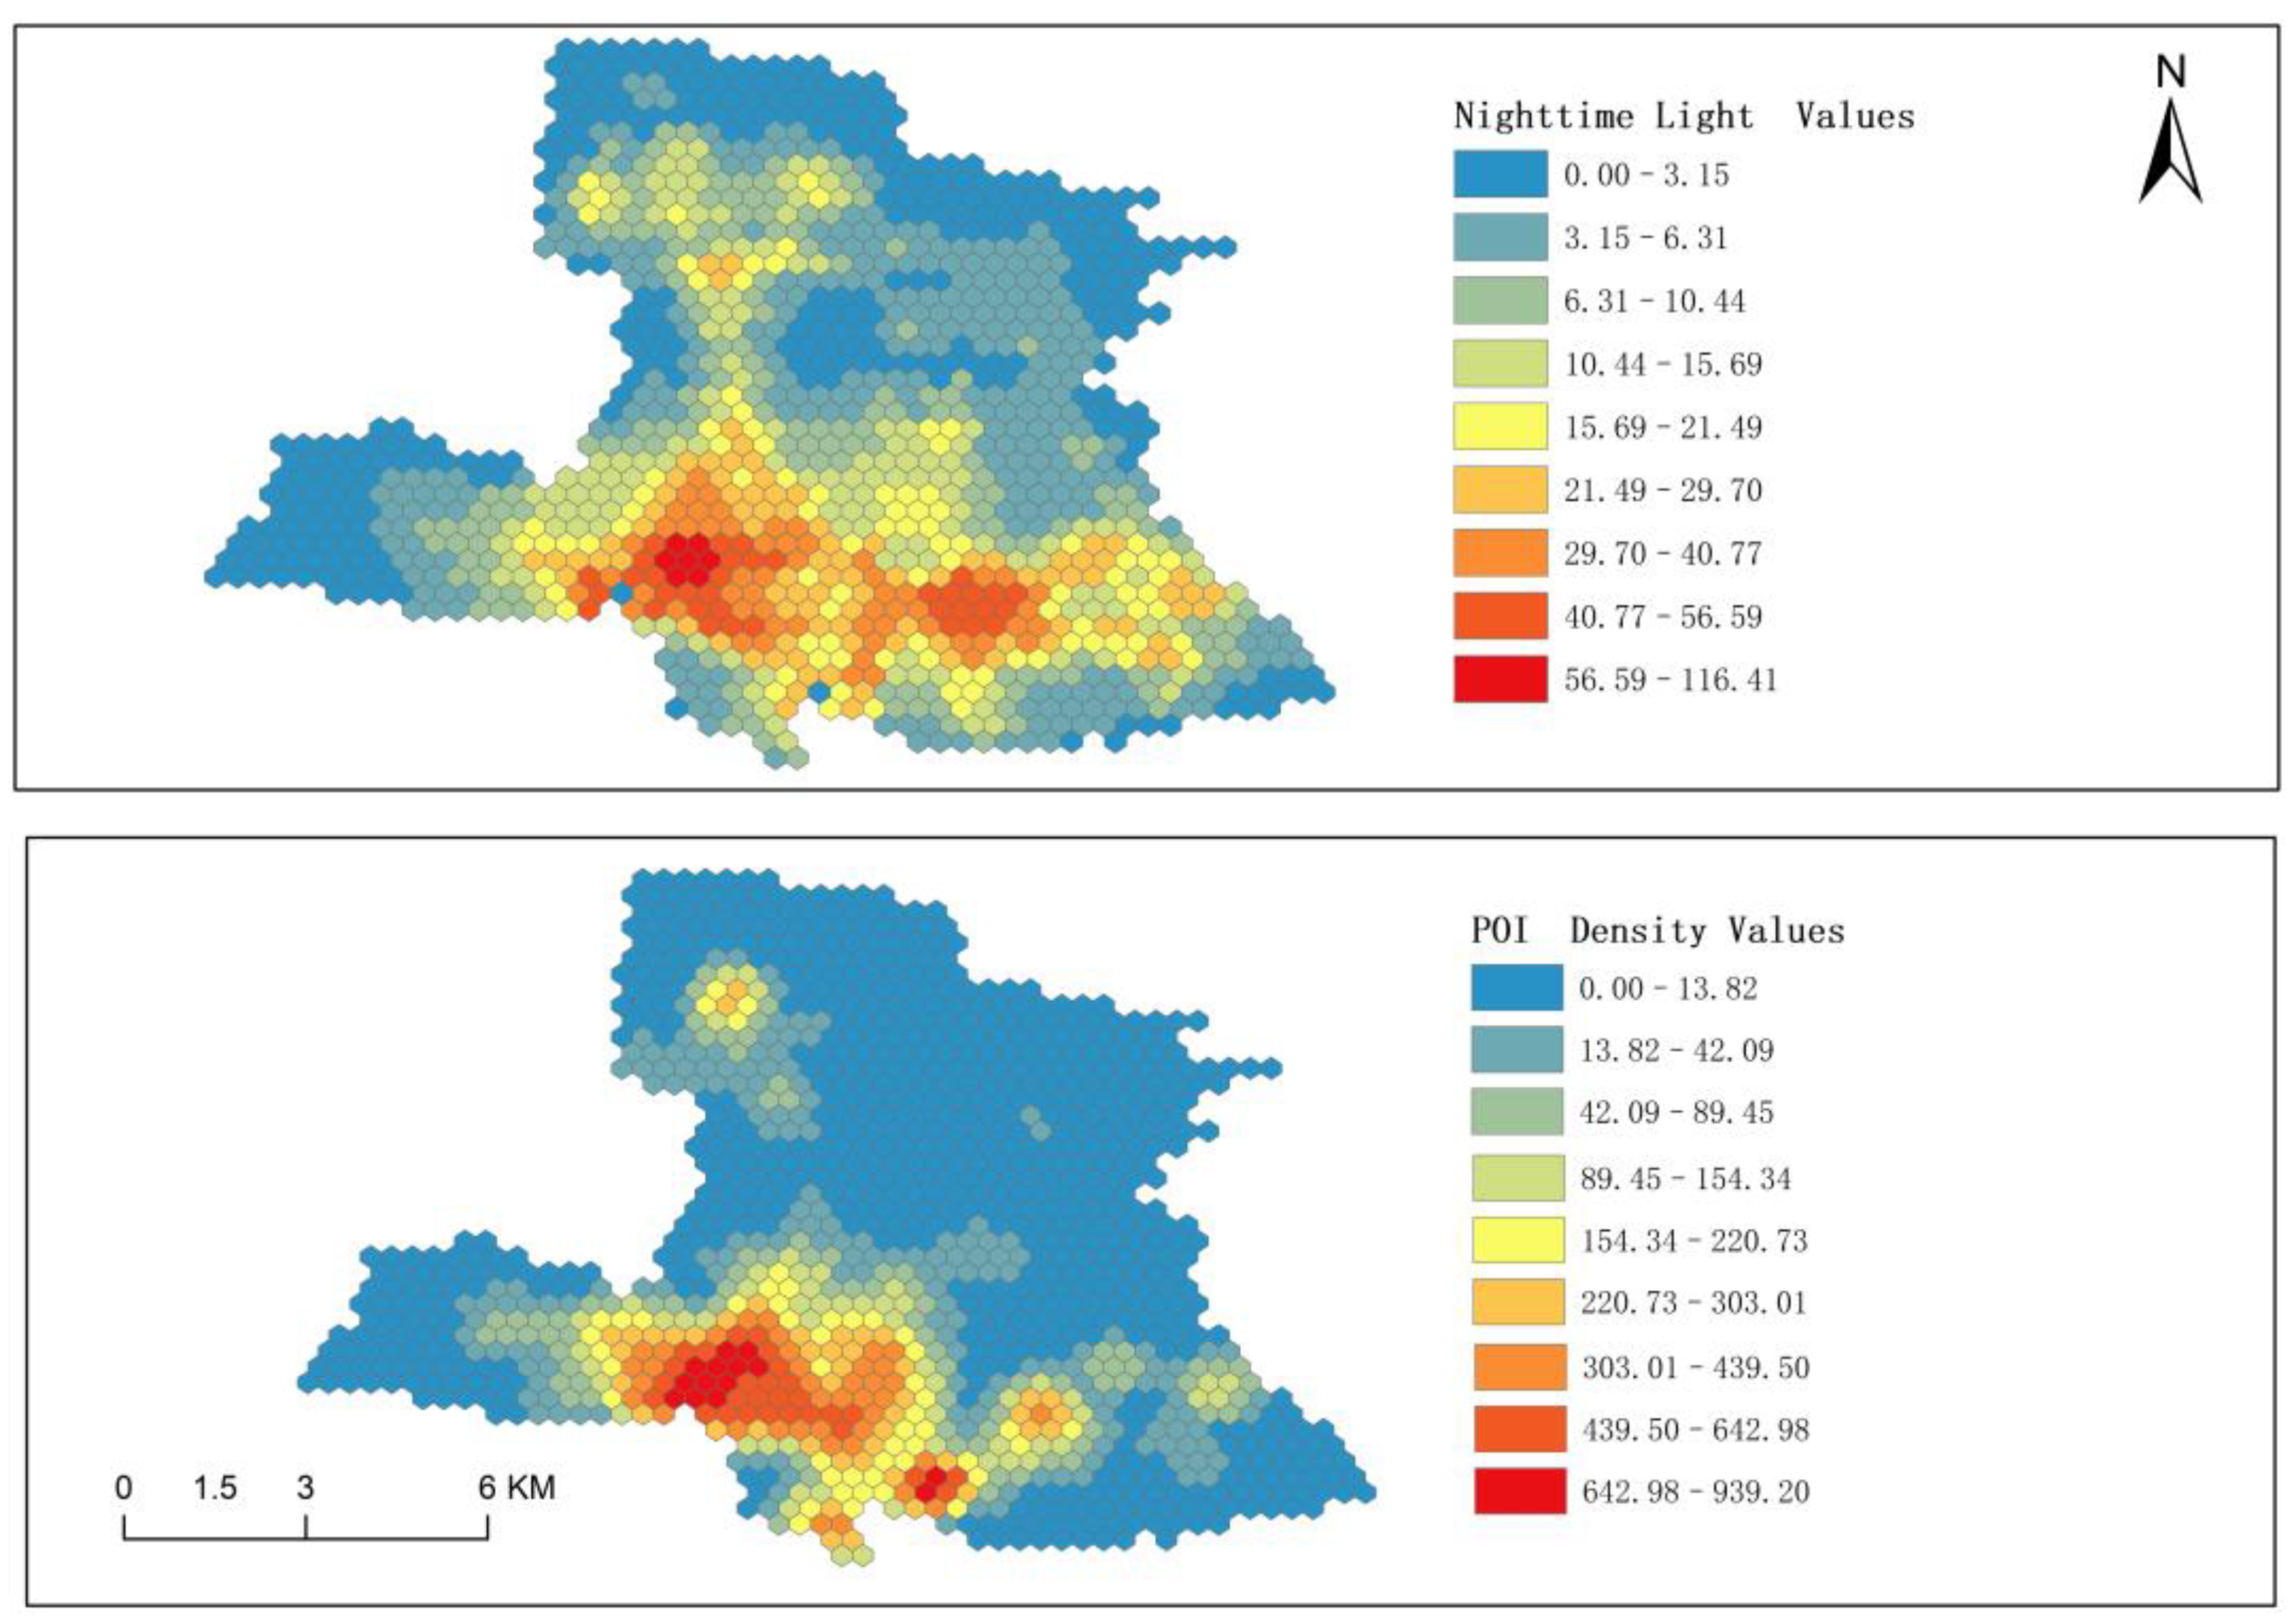
4.1.1. Overall Distribution Characteristics of NTL and POI Values
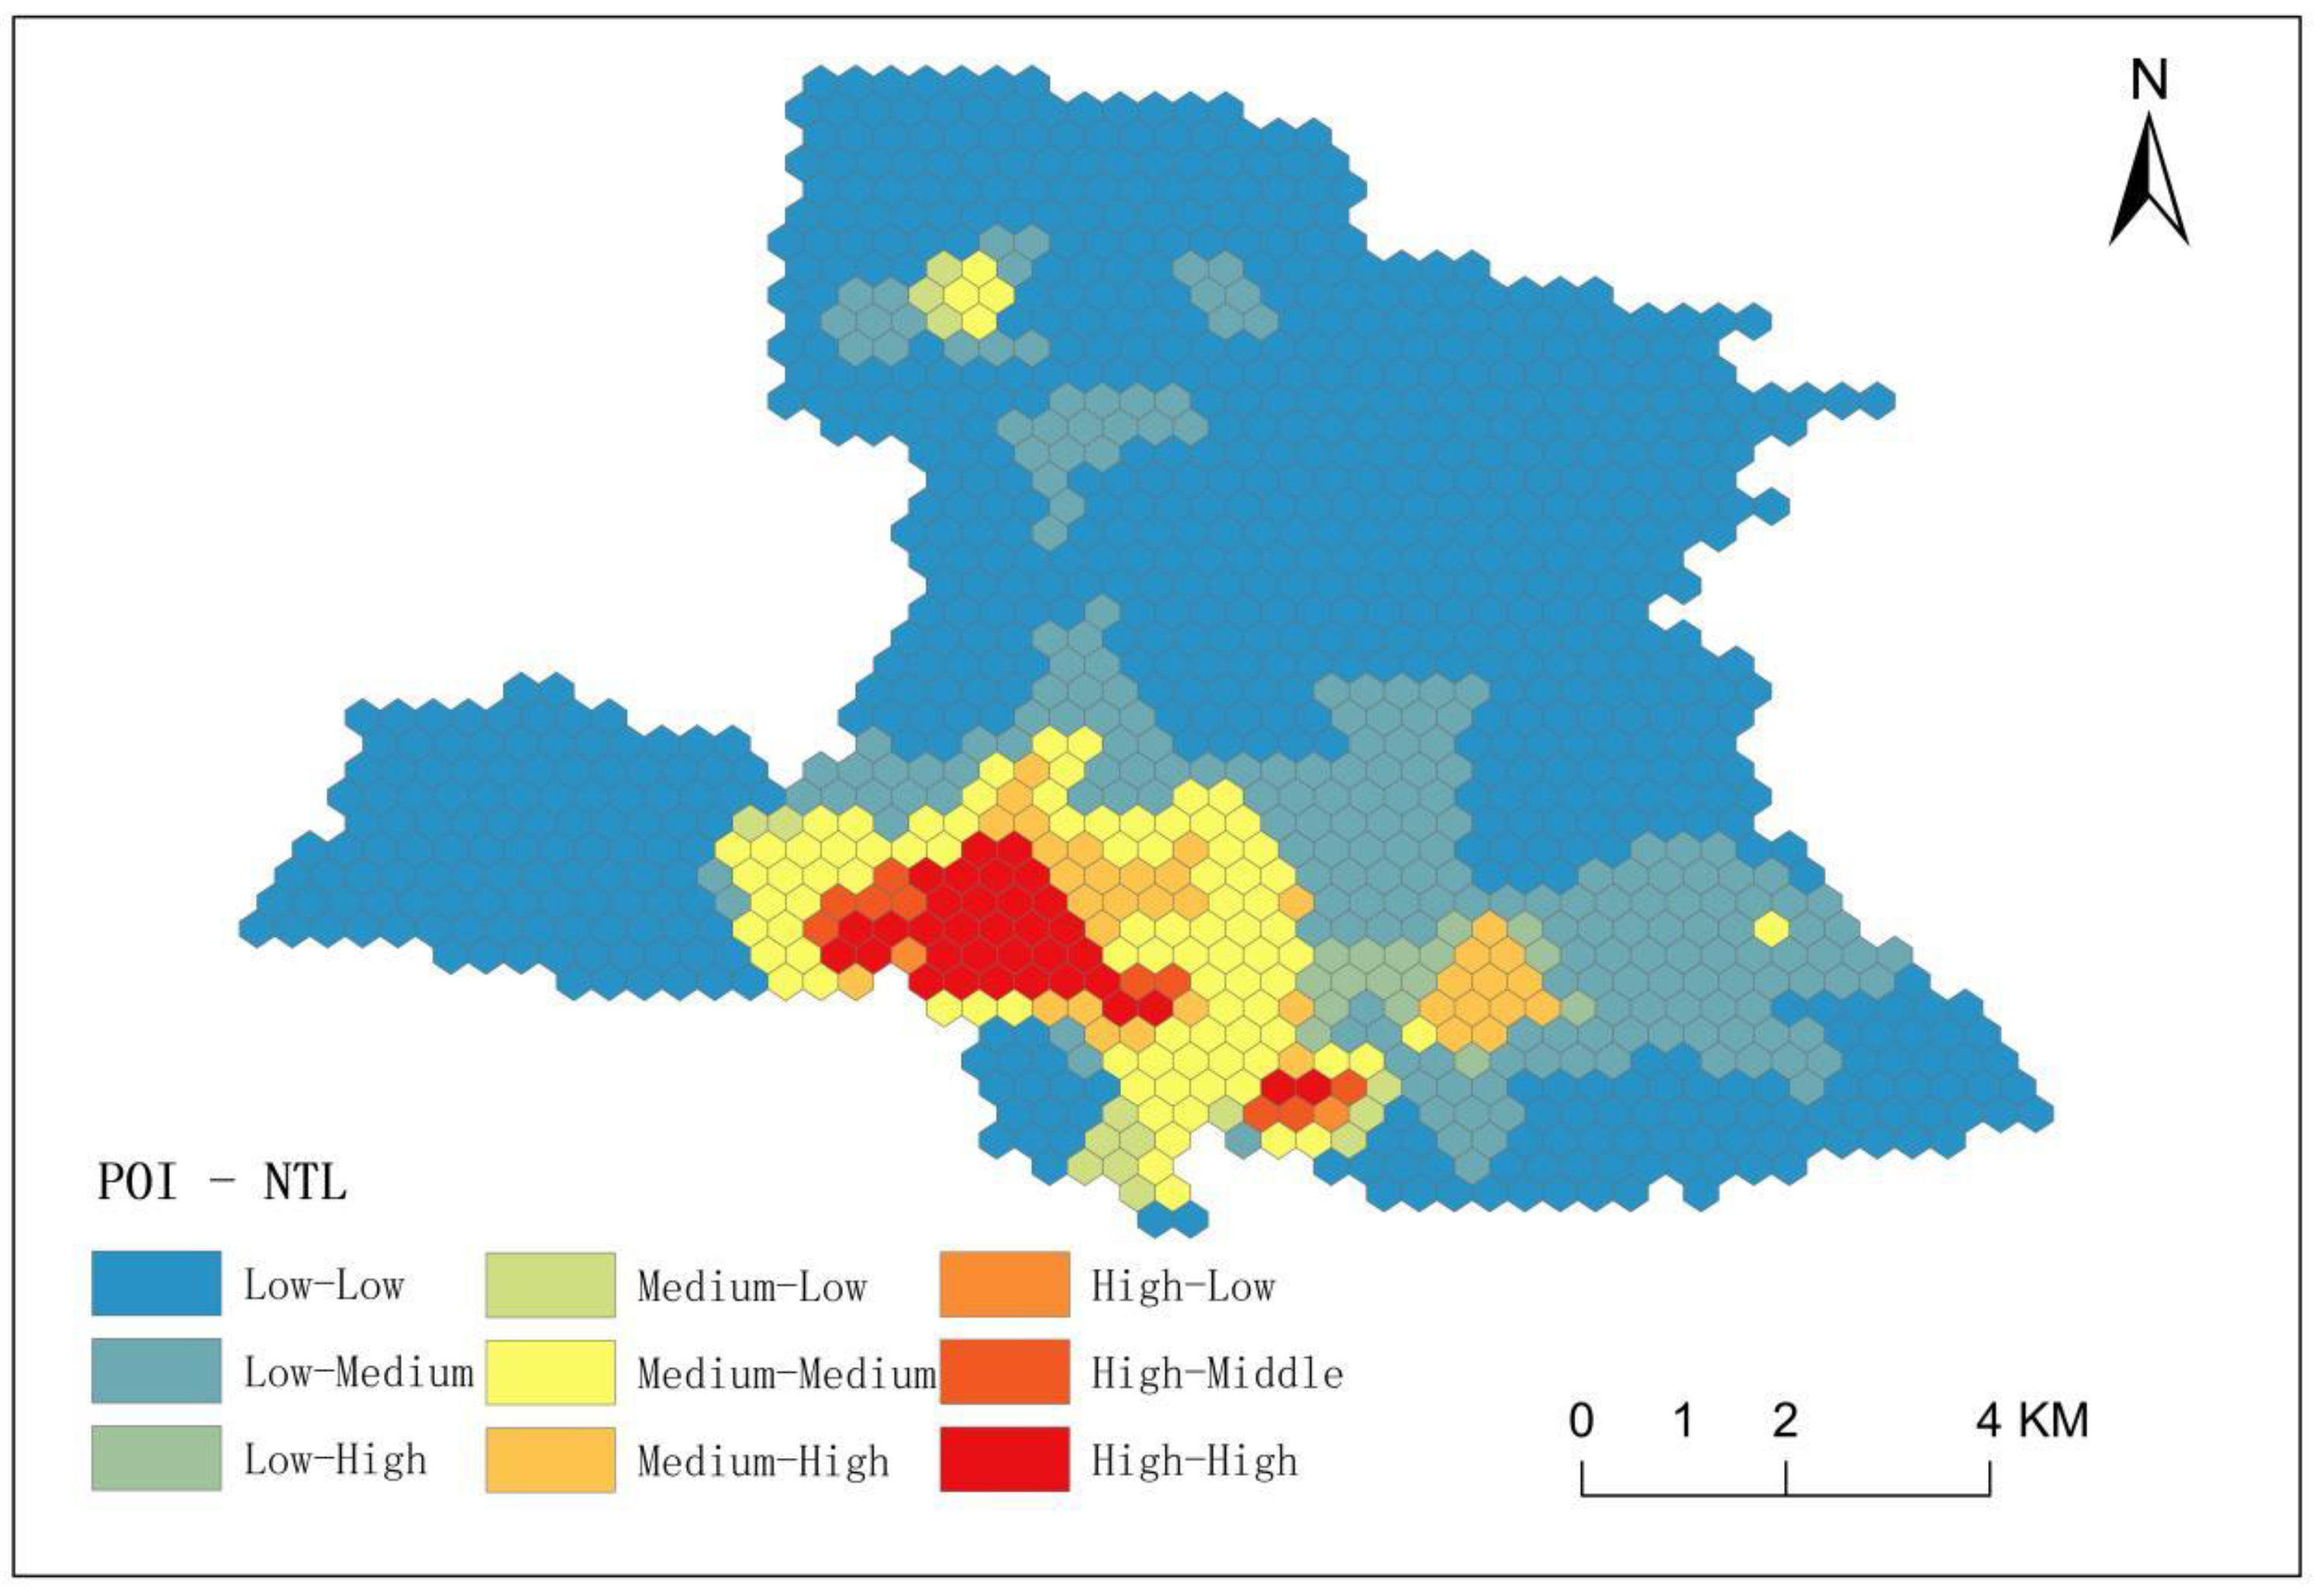
4.1.2. The POI and NTL Coupling Relationship Is the Same
4.1.3. POI Is Lower Than NTL
4.1.4. POI Is Higher Than NTL
4.2. Analysis of POI and OSM Road Network Convergence
4.2.1. Single Functional Area Identification Analysis
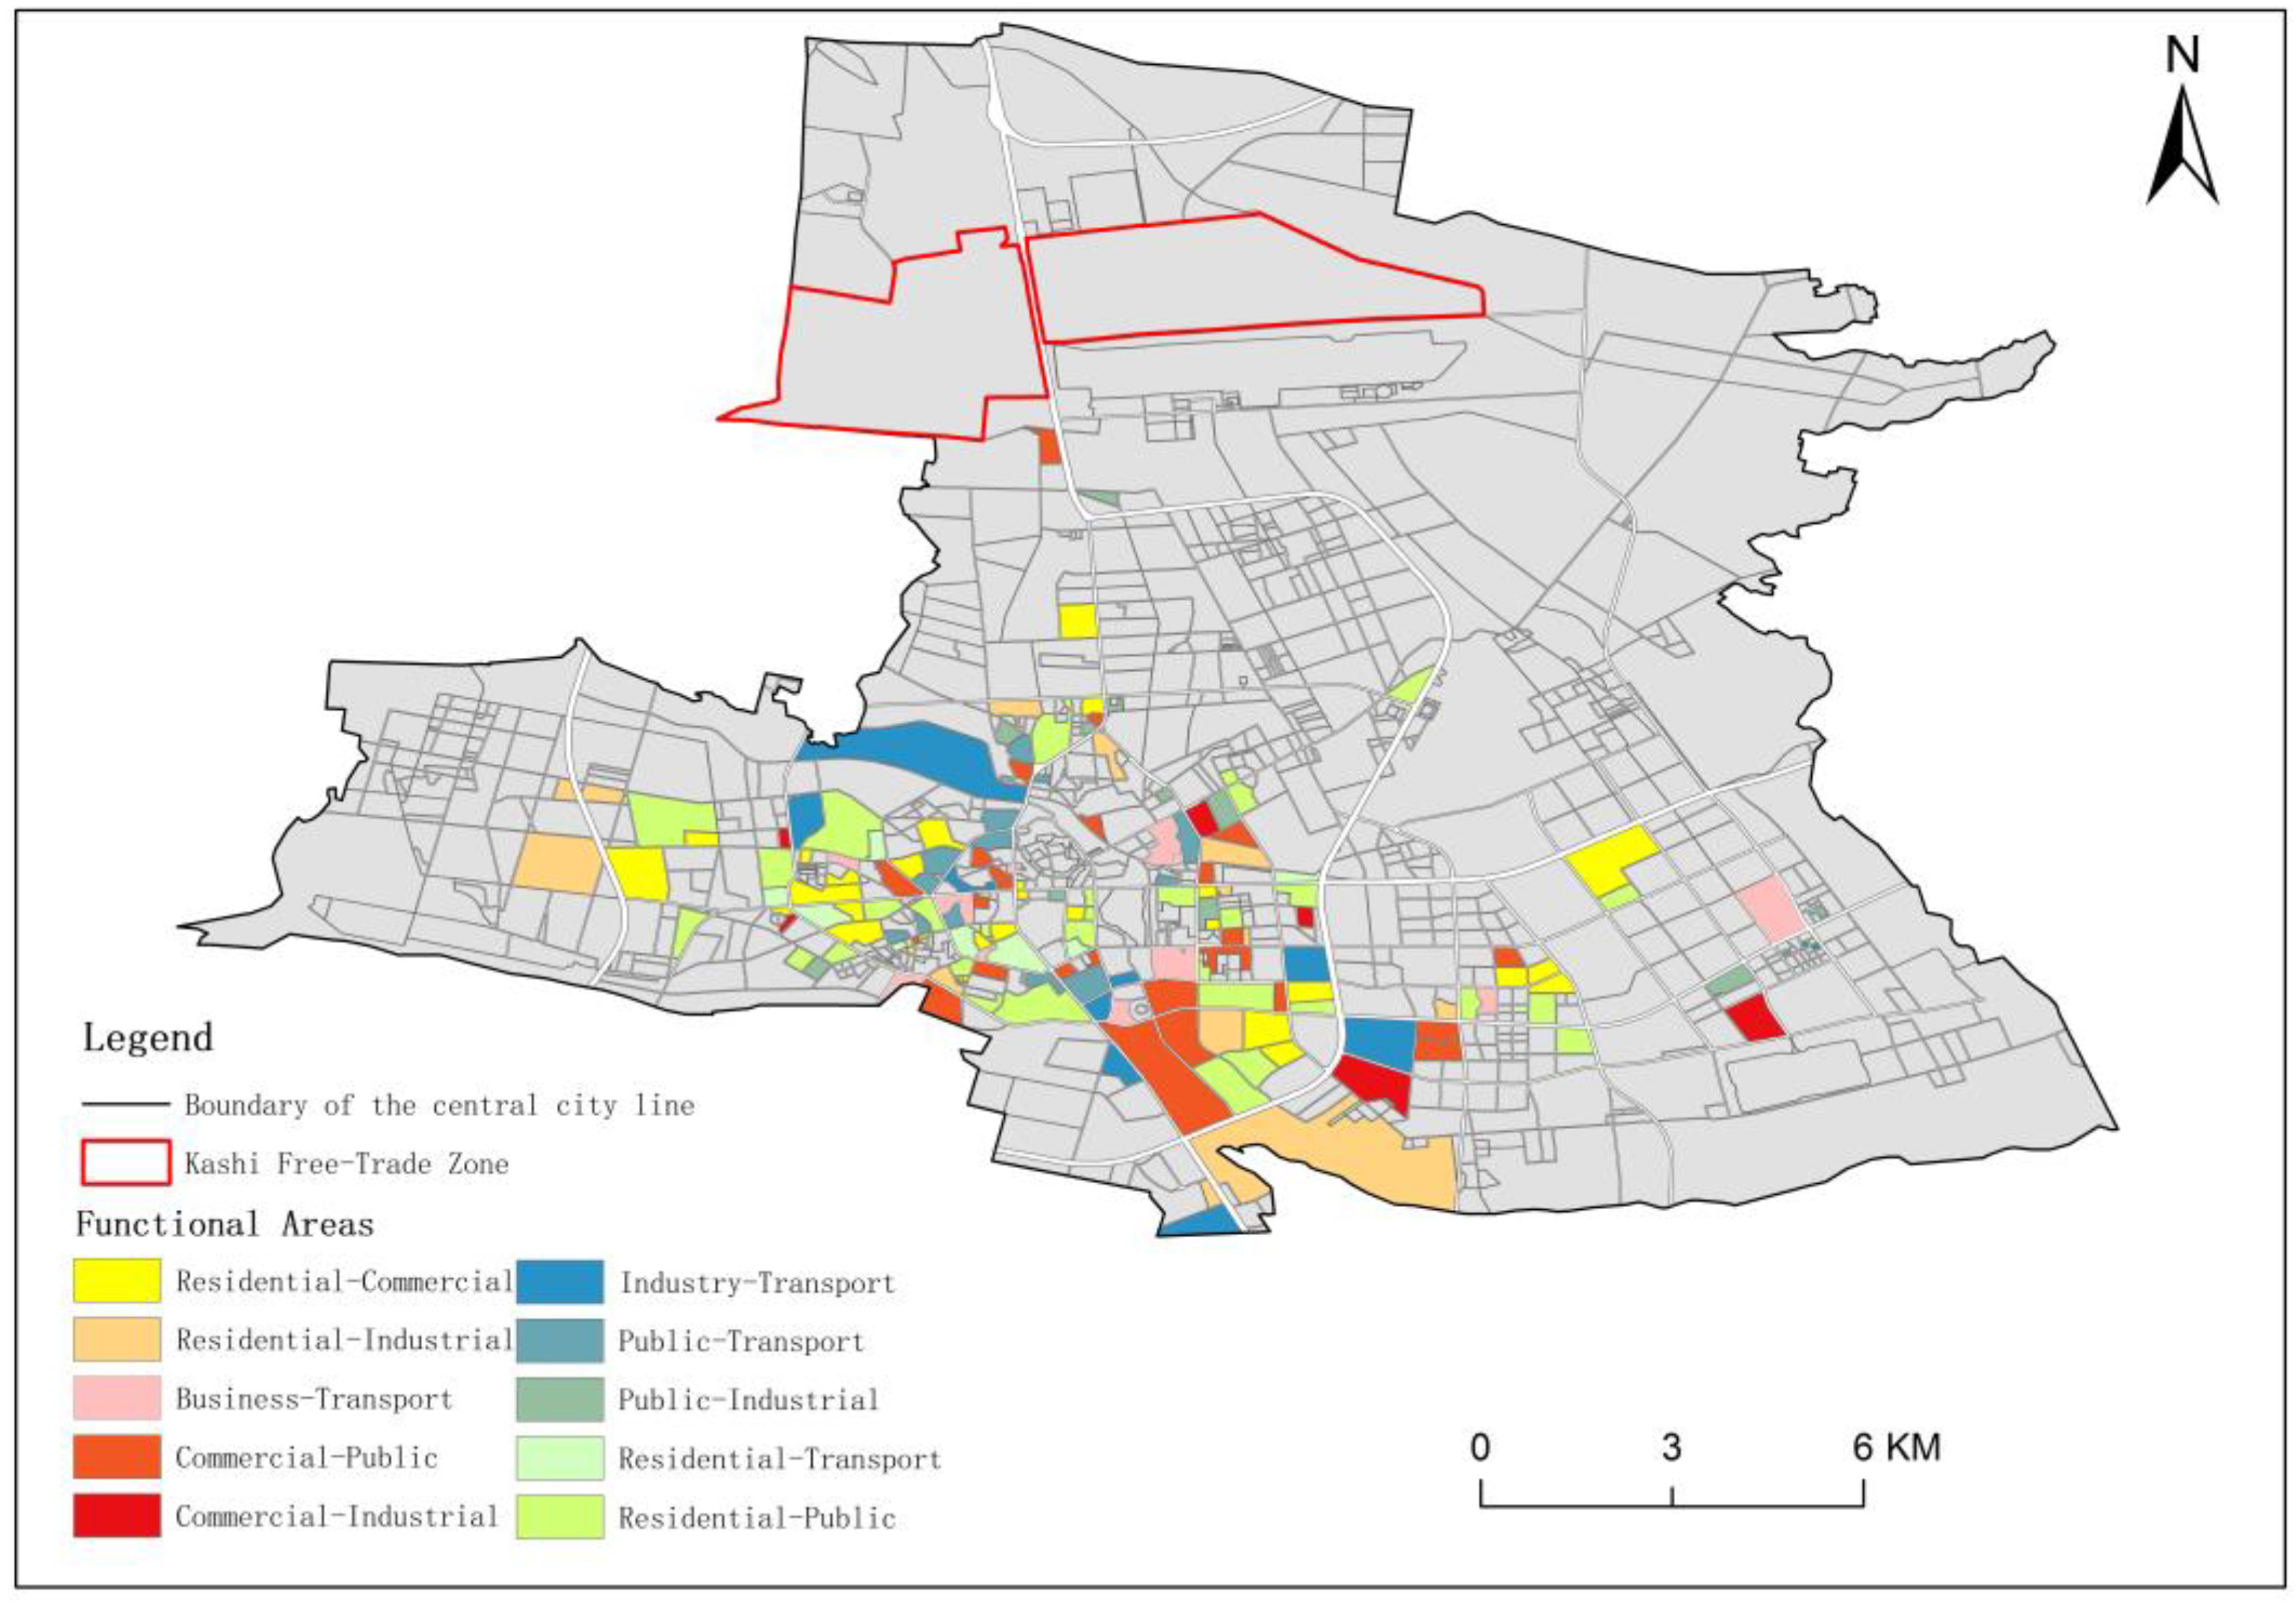
4.2.2. Mixed Functional Area Identification Analysis
5. Discussion
6. Conclusions
- (1)
- The spatial coupling relationship between POI and NTL data was good and had high consistency. The overall spatial distributions of the two types of data in the central urban area of Kashi were consistent, and the percentage of areas with the same spatial coupling relationship was 75.47%. Both data types better characterise the spatial structure of the central urban area with one main body and two sub-branches.
- (2)
- The spatial distribution characteristics of POI and night lighting data were somewhat different. POI data were less distributed in economic development zones, new towns, airports, and other areas, while they were distributed in places with concentrated commercial and human flows. NTL data were more intense in areas with better road infrastructure, such as urban core areas, economic development zones, airports, etc., and had a significant “spillover” effect.
- (3)
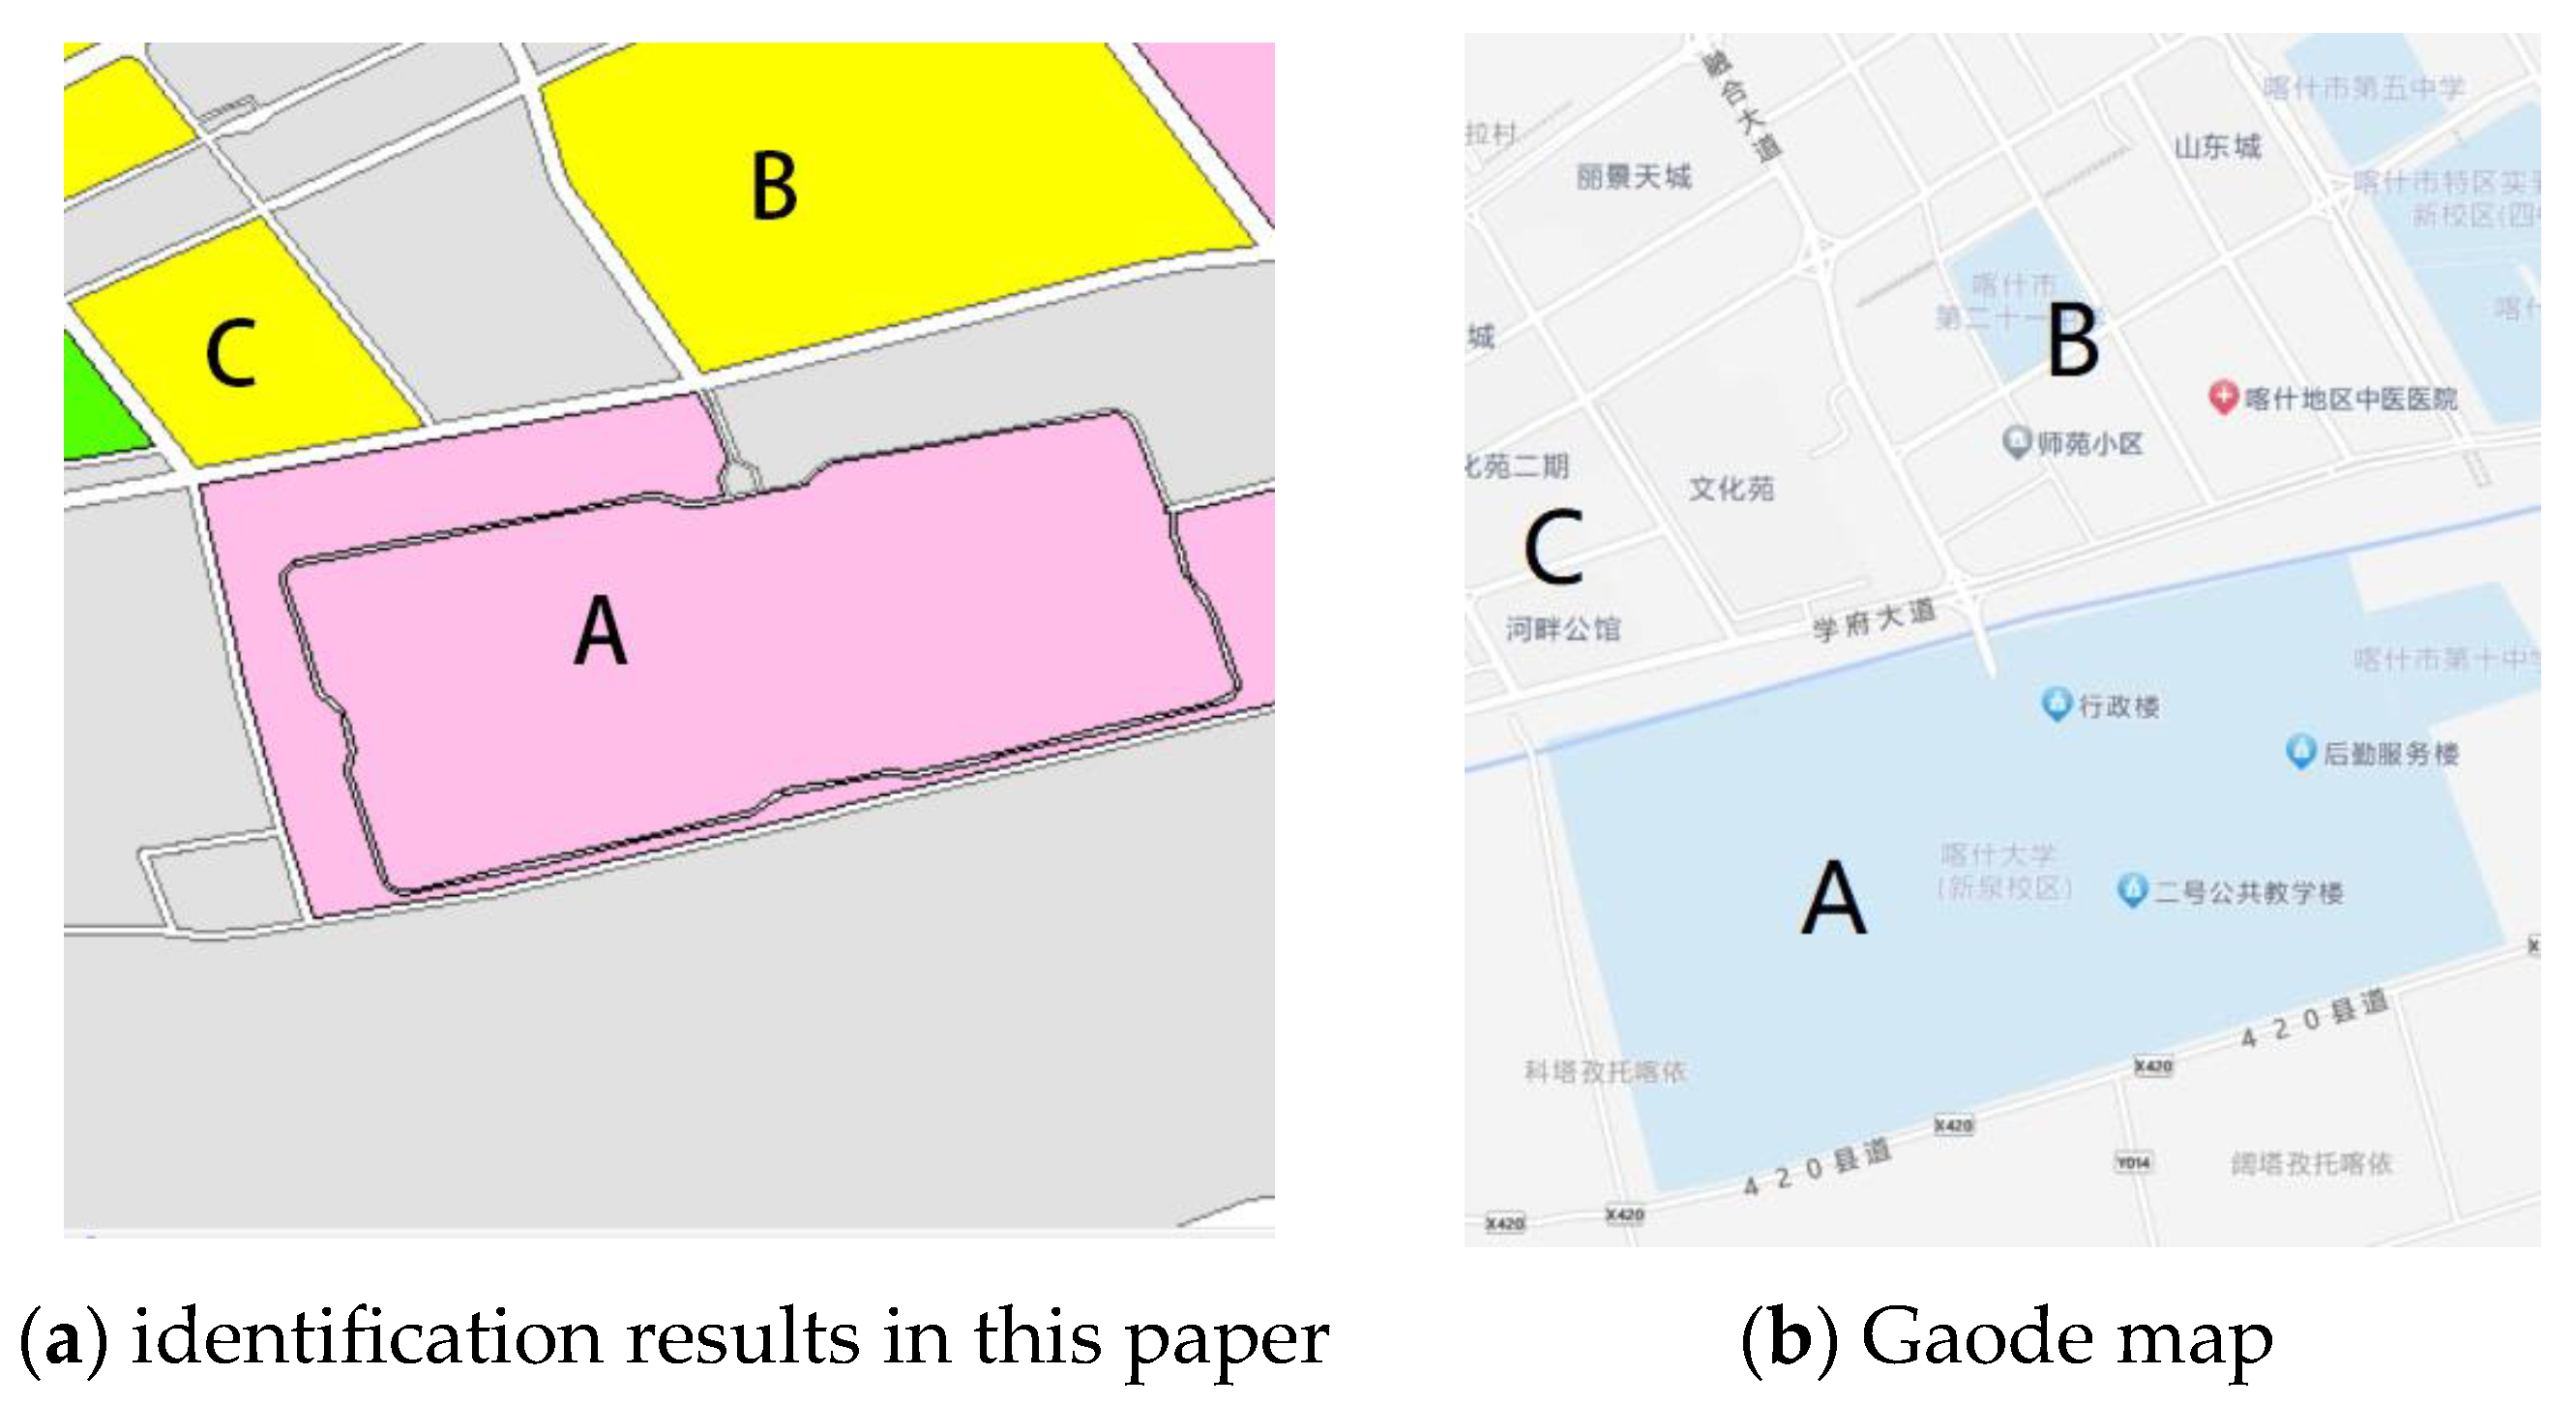
- The fusion of POI data with OSM road network data enabled the quantitative identification of urban single-function and mixed-function areas. Compared with the urban planning map for a single type of functional area, the functional area identification results of central Kashi City were more accurate and better identified mixed land use and integrated land use types. They delineated the different land use units, and the identification of the spatial structure characteristics of the central city was more detailed.
Author Contributions
Funding
Institutional Review Board Statement
Informed Consent Statement
Data Availability Statement
Conflicts of Interest
References
- Zhang, T. Changes in the spatial structure of Chinese cities in the 1990s and its driving mechanism. Urban Plan. 2001, 25, 7–14. [Google Scholar]
- Gao, Y.; Xing, H.; Zhang, H. Analysis of urban spatial structure in the coupling relationship between night-light remote sensing and POI data—Taking Shenzhen as an example. J. Guilin Univ. Technol. 2022, 42, 122–130. [Google Scholar]
- Cheng, C.; Shi, P.; Song, C.; Gao, J. Geographic big data provides new opportunities for geographic complexity research. J. Geogr. 2018, 73, 1397–1406. [Google Scholar]
- Li, J.; Yan, L.; Wang, X. Research on spatial clustering of service industry in Zhengdong New Area based on POI data. Geogr. Res. 2018, 37, 145–157. [Google Scholar]
- Hao, F.; Wang, S.; Feng, Z.; Yu, T.; Ma, L. Commercial spatial pattern and industry distribution in Changchun based on POI data. Geogr. Res. 2018, 37, 366–378. [Google Scholar]
- Duan, Y.; Liu, Y.; Liu, X.; Wang, H. Multicentre identification of Chongqing main urban area based on POI big data. J. Nat. Resour. 2018, 33, 788–800. [Google Scholar]
- Gao, Z.; Sun, W.; Cheng, P.; Yang, G.; Meng, X. Multi-feature latent semantic information fusing high-resolution remote sensing imagery and POI data for identifying urban functional areas. Remote Sens. Technol. Appl. 2021, 36, 618–626. [Google Scholar]
- Xu, Z.; Gao, X. Urban built-up area boundary identification method based on electronic map interest points. J. Geogr. 2016, 71, 928–939. [Google Scholar]
- Yue, Y.; Zhuang, Y.; Yeh, A.G.-O.; Xie, J.-Y.; Ma, C.-L.; Li, Q.-Q. Measurements of POI-based mixed use and their relationships with neighbourhood vibrancy. Int. J. Geogr. Inf. Sci. 2017, 31, 658–675. [Google Scholar] [CrossRef]
- Wang, L.; Feng, C. Spatial expansion pattern of Beijing-Tianjin-Hebei urban agglomeration and its dynamic mechanism during the transition period-Based on NTLing data method. J. Geogr. 2016, 71, 2155–2169. [Google Scholar]
- Dong, H.; Li, R.; Li, J.; Li, S. Spatial and temporal patterns of urban spatial expansion in three major urban agglomerations in China based on DMSP-OLS and NPP-VIIRS integrated data. J. Geo-Inf. Sci. 2020, 22, 1161–1174. [Google Scholar]
- Wu, J.; Liu, H.; Peng, J.; Ma, L. Hierarchical structure of China’s urban system and its spatial pattern-empirical evidence based on DMSP/OLS NTLing data. J. Geogr. 2014, 69, 759–770. [Google Scholar]
- Zhang, C.; Wang, C.; Lv, Y.; Shen, T. Spatial structure of urban system in the Yangtze River Economic Belt—A study based on NTLing data. Urban Dev. Res. 2015, 22, 19–27. [Google Scholar]
- Zou, Y.; Yan, Q.; Huang, J.; Li, F. Study on spatialisation of population in Su-Wuxi-Chang area based on LJ1-01 night light image. Yangtze River Basin Resour. Environ. 2020, 29, 1086–1094. [Google Scholar]
- Chen, Y.; Liu, X.; Li, X. Analyzing parcel-level relationships between urban land expansion and activity changes by integrating Landsat and Nighttime Light Data. Remote Sens. 2017, 9, 164. [Google Scholar] [CrossRef]
- Yao, Y.; Li, X.; Liu, X.; Liu, P.; Liang, Z.; Zhang, J.; Mai, K. Sensing spatial distribution of urban land use by integrating points-of-interest and Google Word2Vec model. Int. J. Geogr. Inf. Sci. 2016, 31, 825–848. [Google Scholar] [CrossRef]
- Du, S.; Du, S.; Liu, B.; Zhang, X.; Zheng, Z. Large-scale urban functional zone mapping by integrating remote sensing images and open social data. GIScience Remote Sens. 2020, 57, 411–430. [Google Scholar] [CrossRef]
- Cai, J.; Huang, B.; Song, Y. Using multi-source geospatial big data to identify the structure of polycentric cities. Remote Sens. Environ. 2017, 202, 210–221. [Google Scholar] [CrossRef]
- Li, H.; Xu, X.; Li, X.; Ma, S.; Zhang, H. Characterising the urban spatial structure using taxi trip big data and implications for urban planning. Front. Earth Sci. 2021, 15, 70–80. [Google Scholar] [CrossRef]
- Yu, B.C.; Liu, Y.X.; Chen, G. Research on the spatial structure of port city in South China Sea based on the spatial coupling relationship between night-light remote sensing and POI data. J. Geo-Inf. Sci. 2018, 20, 854–861. [Google Scholar]
- Wang, Y.; Wang, Z.; Deng, Z.; Cheng, P.; Li, Y. Spatial coupling analysis of points of interest, night-light remote sensing and microblog check-in—A case study of Beijing City. Remote Sens. Inf. 2019, 34, 18–26. [Google Scholar]
- Chen, B.; Xu, S.; Zhou, Y.; Xu, F.; Wang, H. Analysis of urban spatial structure under the spatial coupling relationship between POI and NPP/VIIRS night-lighting data-taking Wuhan main urban area as an example. Surv. Mapp. Bull. 2020, 7, 70–75. [Google Scholar]
- Liang, L.; Tan, B.; Ma, Y.; Chen, Y.; Liu, X. Research on urban spatial structure based on multi-source geographic big data. Remote Sens. Technol. Appl. 2021, 36, 1446–1456. [Google Scholar]
- Chi, J.; Jiao, L.; Dong, T.; Gu, Y.; Ma, Y. Quantitative identification of urban functional areas and their visualisation based on POI data. Surv. Mapp. Geogr. Inf. 2016, 41, 68–73. [Google Scholar]
- Kang, Y.; Wang, Y.; Xia, Z.; Chi, J.; Jiao, L.; Wei, Z. Division and identification of Wuhan urban functional areas using POI data. Surv. Mapp. Geogr. Inf. 2018, 43, 81–85. [Google Scholar]
- Wang, J.; Ye, Y.; Fang, F. Research on urban functional zoning based on kernel density and fusion data. Geogr. Geogr. Inf. Sci. 2019, 35, 66–71. [Google Scholar]
- Ding, Y.; Xu, H.; Wang, C. Research on urban functional area identification by integrating OSM road network and POI data. Geogr. Geogr. Inf. Sci. 2020, 36, 57–63. [Google Scholar]
- Ali Khan, M. Study on the Impact of “One Belt, One Road” on China-Pakistan Economic Corridor. Master’s Thesis, Harbin Normal University, Harbin, China, 2020. [Google Scholar]
- Chen, Z.; Yu, B.; Yang, C.; Zhou, Y.; Qian, X.; Wang, C.; Wu, B.; Wu, J. An Extended Time Series (2000–2018) of Global NPP-VIIRS-Like Nighttime Light Data from a Cross-Sensor Calibration. Earth Syst. Sci. Data 2021, 13, 889–906. [Google Scholar] [CrossRef]
- Younes, A.; Mohamadi, B.; AbuGhazala, M.O. Terrorism in Egypt: A comprehensive spatial, spatio-temporal, and statistical analysis. GeoJournal 2023, 88, 6339–6364. [Google Scholar] [CrossRef]
- Qu, B.S.; Zhao, Z.; Deng, Y.; Zhang, Y. A study on the multi-scale spatial and temporal pattern of “two robberies and one theft” in the main urban area of Chengdu. J. Zhejiang Univ. (Sci. Ed.) 2019, 46, 745–754. [Google Scholar]
- Gao, Y.; Yang, Q.; Liang, L.; Zhao, Y. Research on spatial pattern and influencing factors of retail industry in Xi’an based on POI data. Geoscience 2020, 40, 710–719. [Google Scholar]
- Wang, P.; Wang, H.; Yang, S.; Sui, X.; Liu, Z. GIS-based cultural landscape analysis of the geographical names of settlements on the northern slope of Tianshan Mountain. Arid. Land Geogr. 2020, 43, 516–524. [Google Scholar]
- Luo, H.; Zhao, Z. Analysis of urban spatial structure under the coupling relationship between points of interest and night-light data—Taking Kunming City as an example. Henan Sci. 2021, 39, 619–625. [Google Scholar]
- Gao, S.; Janowicz, K.; Montello, D.R.; Hu, Y.; Yang, J.-A.; McKenzie, G.; Ju, Y.; Gong, L.; Adams, B.; Yan, B. A data-synthesis-driven method for detecting and extracting vague cognitive regions. Int. J. Geogr. Inf. Sci. 2017, 31, 1245–1271. [Google Scholar] [CrossRef]
- Huang, Y.; Shao, S.; Lei, Y.; Tian, J. Identifying urban functional areas using network kernel density estimation and kriging interpolation. Surv. Mapp. Geogr. Inf. 2019, 44, 14–18. [Google Scholar]
- Luo, S.; Liu, Y.; Gao, S.; Wang, P. Quantitative identification of urban functional areas based on spatial grids. Surv. Mapp. Bull. 2020, 1, 214–217. [Google Scholar]
- Zhu, J.; Tang, C.; Feng, Y. Research on quantitative identification of Yichun urban functional areas based on interest point data. Urban Archit. 2018, 20, 21–23. [Google Scholar]
- Gu, M. Research on the Spatial Pattern of Modern Service Industry in Guiyang City Based on POI Data. Master’s Thesis, Guizhou Normal University, Guiyang, China, 2020. [Google Scholar]
- Li, N.; Wu, K. Research on identification and distribution characteristics of urban functional areas based on POI data. Remote Sens. Technol. Appl. 2022, 37, 1482–1491. [Google Scholar]
- State Council. Circular of the State Council on the Issuance of the Overall Programme of China (Xinjiang) Pilot Free Trade Zone. 21 October 2023. Available online: https://www.gov.cn/zhengce/content/202310/content_6912936.htm (accessed on 21 April 2024).
- Wu, Y.; Yuan, J. Is There a Regulation in the Expansion of Urban Spatial Structure? Empirical Study from the Main Urban Area in Zhengzhou, China. Sustainability 2022, 14, 2883. [Google Scholar] [CrossRef]


| Data Name | Resource |
|---|---|
| POI | Gaode Open Platform (https://lbs.amap.com/tools/picker, accessed on 25 December 2023) |
| NPP/VIIRS NTL data | National Earth System Science Data Centre—Yangtze River Delta Sub-centre (http://geodata.nnu.edu.cn/, accessed on 27 December 2023) |
| OSM | Open Street Map (https://www.openstreetmap.org, accessed on 10 January 2024) |
Disclaimer/Publisher’s Note: The statements, opinions and data contained in all publications are solely those of the individual author(s) and contributor(s) and not of MDPI and/or the editor(s). MDPI and/or the editor(s) disclaim responsibility for any injury to people or property resulting from any ideas, methods, instructions or products referred to in the content. |
© 2024 by the authors. Licensee MDPI, Basel, Switzerland. This article is an open access article distributed under the terms and conditions of the Creative Commons Attribution (CC BY) license (https://creativecommons.org/licenses/by/4.0/).
Share and Cite
Wang, G.; Hu, J.; Wang, M.; Zhang, S. Research on the Spatial Structure of Xinjiang Port Cities Based on Multi-Source Geographic Big Data—A Case of Central Kashi City. Sustainability 2024, 16, 6852. https://doi.org/10.3390/su16166852
Wang G, Hu J, Wang M, Zhang S. Research on the Spatial Structure of Xinjiang Port Cities Based on Multi-Source Geographic Big Data—A Case of Central Kashi City. Sustainability. 2024; 16(16):6852. https://doi.org/10.3390/su16166852
Chicago/Turabian StyleWang, Guiqin, Jiangling Hu, Mengjie Wang, and Saisai Zhang. 2024. "Research on the Spatial Structure of Xinjiang Port Cities Based on Multi-Source Geographic Big Data—A Case of Central Kashi City" Sustainability 16, no. 16: 6852. https://doi.org/10.3390/su16166852
APA StyleWang, G., Hu, J., Wang, M., & Zhang, S. (2024). Research on the Spatial Structure of Xinjiang Port Cities Based on Multi-Source Geographic Big Data—A Case of Central Kashi City. Sustainability, 16(16), 6852. https://doi.org/10.3390/su16166852