
Spatial–Temporal Evolution and Driving Factors of Agricultural Green Development in China: Evidence from Panel Quantile Approaches


Abstract
1. Introduction
2. Literature Review
2.1. Measurement of Agricultural Green Development
2.2. Driving Factors of Agricultural Green Development
2.3. Literature Summary
3. Data and Methodology
3.1. Sample and Data Source
3.2. Entropy Method
3.3. Nonparametric Kernel Density Estimation Analysis
3.4. Panel Quantile Regression
4. Spatial–Temporal Evolution Analysis of Agricultural Green Development
4.1. Evaluation Indicator System for Agricultural Green Development
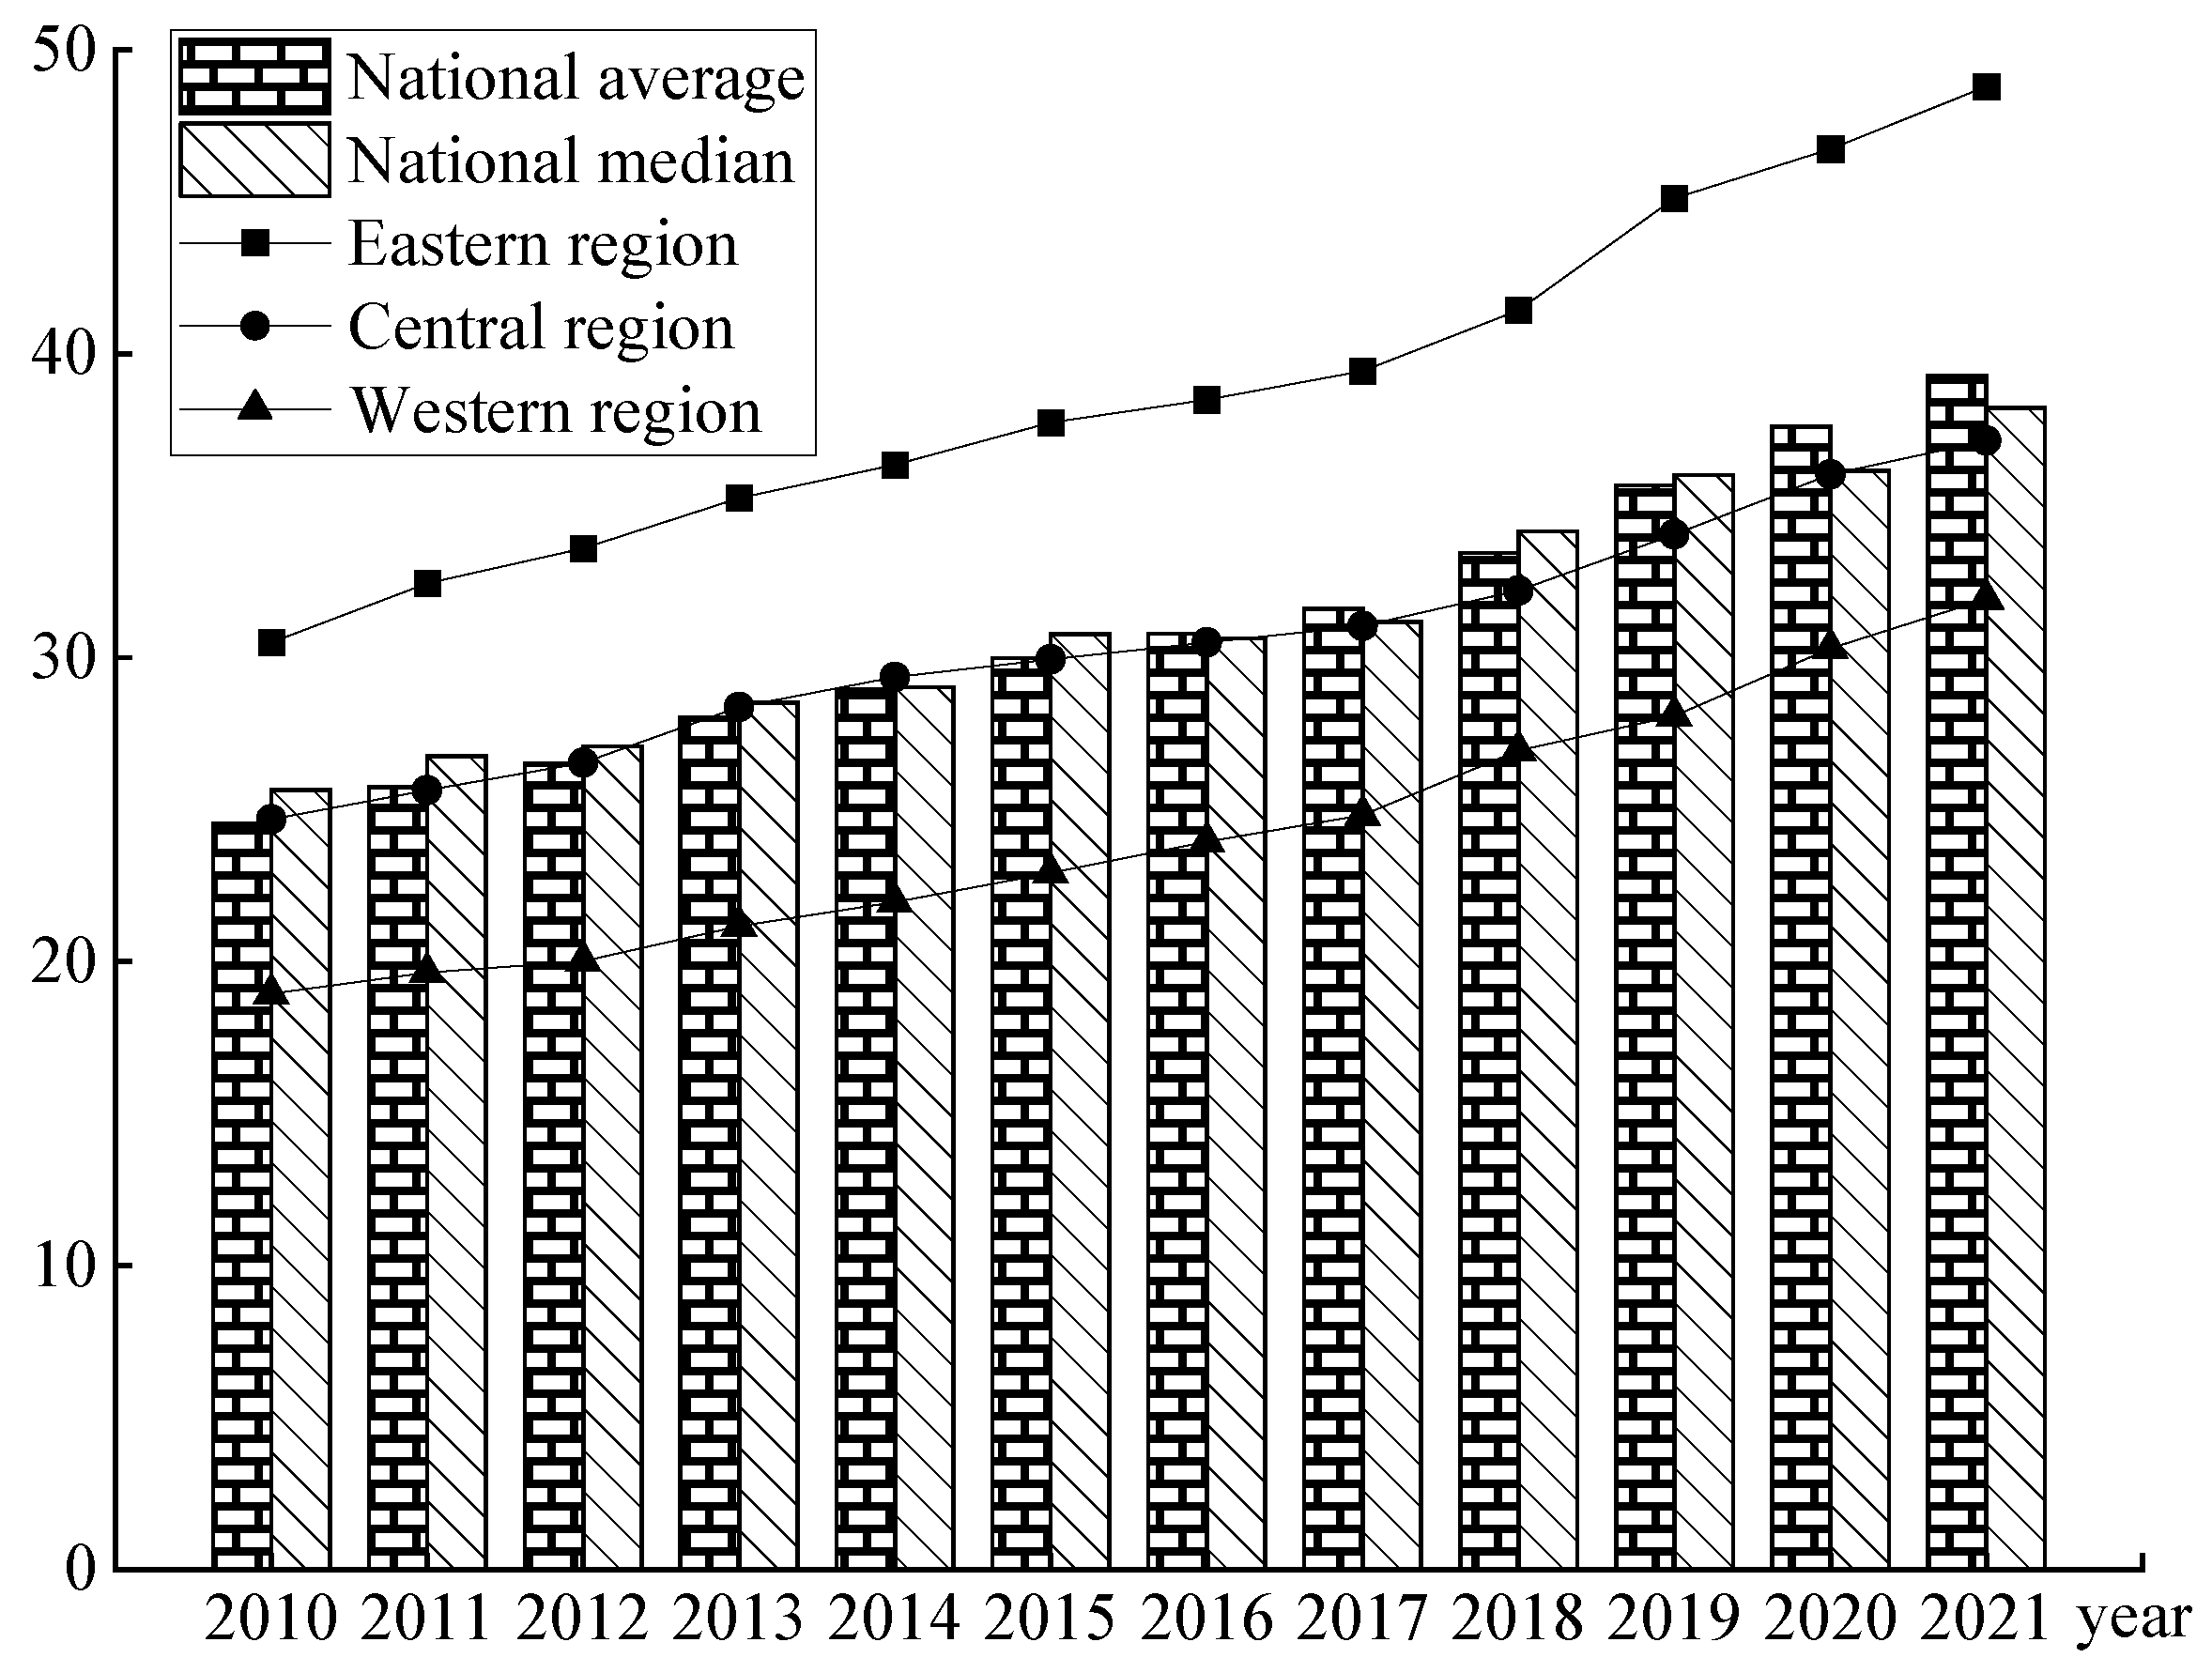
4.2. Temporal Distribution Evolution of Agricultural Green Development
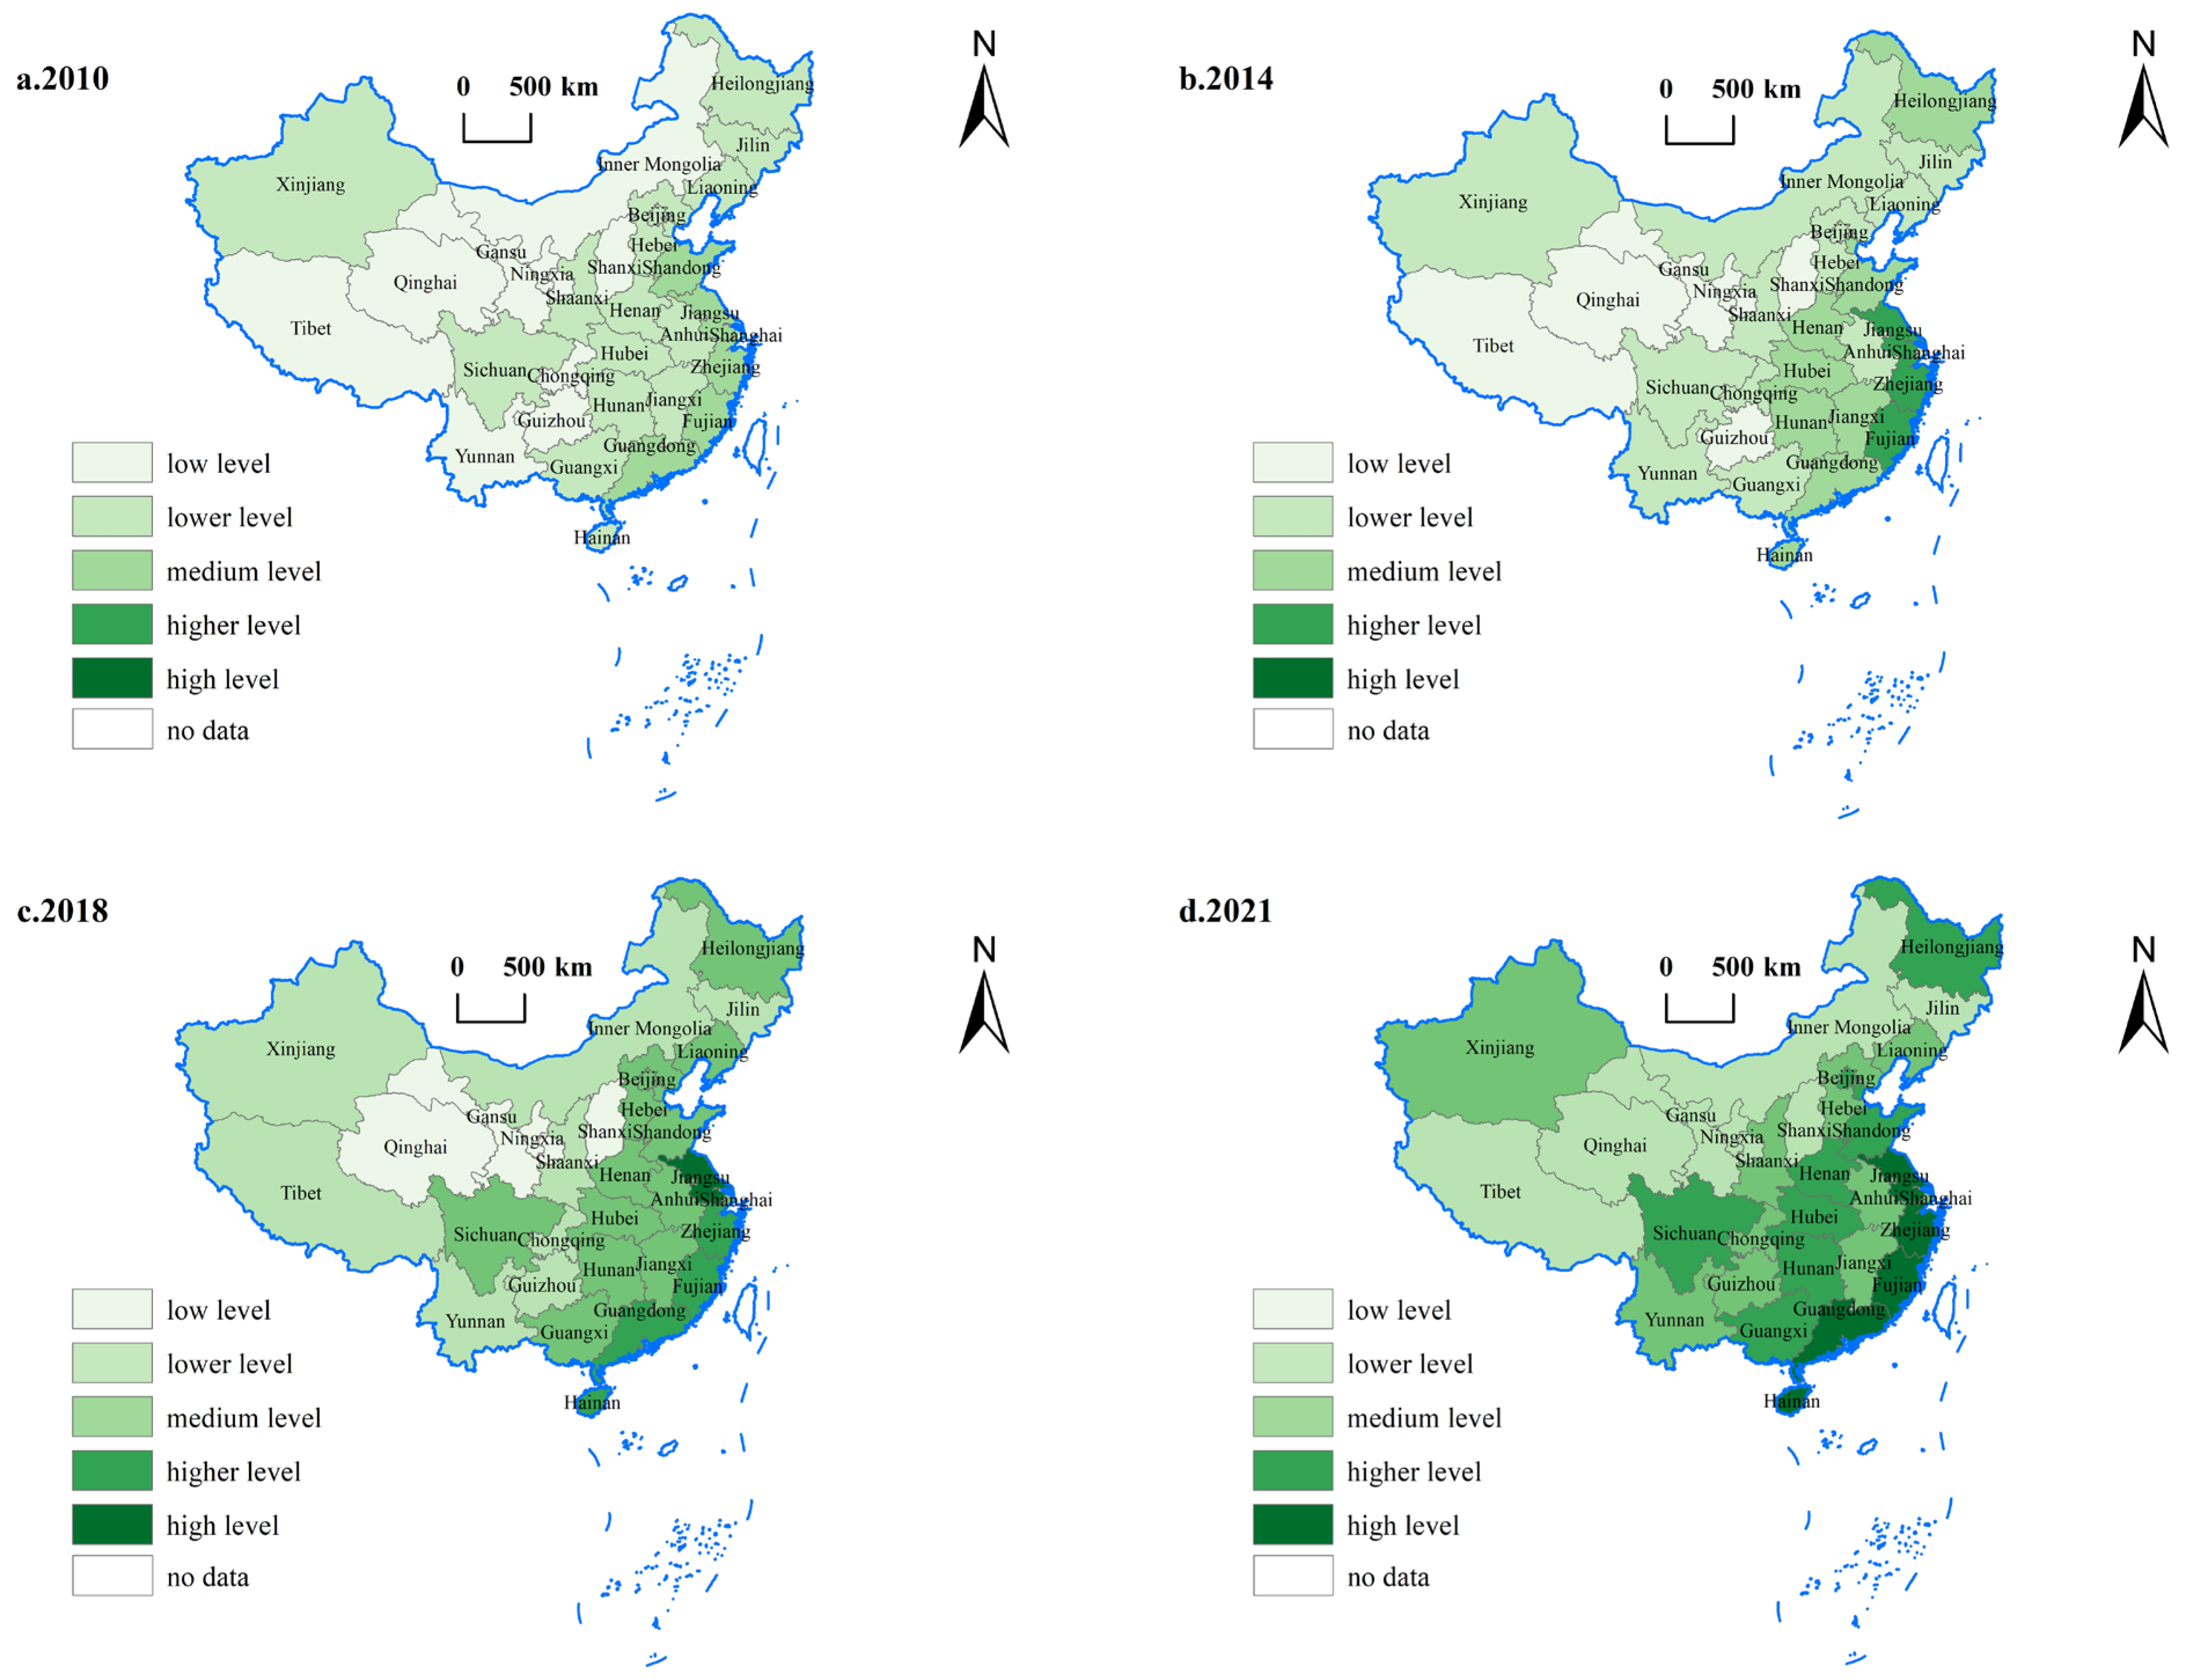
4.3. Spatial Distribution Evolution of Agricultural Green Development
5. Driving Factors of Agricultural Green Development
5.1. Definition of Variables
5.1.1. Dependent Variable
5.1.2. Independent Variables
5.2. Analysis of Results of the Quantile Regression Model with Nonadditive Fixed Effects
6. Discussion
7. Conclusions and Policy Implications
7.1. Conclusions
7.2. Policy Implications
Author Contributions
Funding
Institutional Review Board Statement
Informed Consent Statement
Data Availability Statement
Conflicts of Interest
References
- Kakwani, N.; Wang, X.; Xue, N.; Zhan, P. Growth and common prosperity in China. China World Econ. 2022, 30, 28–57. [Google Scholar] [CrossRef]
- Xu, B.; Lin, B. Factors affecting CO2 emissions in China’s agriculture sector: Evidence from geographically weighted regression model. Energy Pol. 2017, 104, 404–414. [Google Scholar] [CrossRef]
- Li, Z.; Jin, M.; Cheng, J. Economic growth of green agriculture and its influencing factors in China: Based on emergy theory and spatial econometric model. Environ. Dev. Sustain. 2021, 23, 15494–15512. [Google Scholar] [CrossRef]
- Huang, X.; Xu, X.; Wang, Q.; Zhang, L.; Gao, X.; Chen, L. Assessment of Agricultural Carbon Emissions and Their Spatiotemporal Changes in China, 1997–2016. Int. J. Environ. Res. Public Health 2019, 16, 3105. [Google Scholar] [CrossRef] [PubMed]
- Xu, J.; Zhang, Z.; Zhang, X.; Ishfaq, M.; Zhong, J.; Li, W.; Zhang, F.; Li, X. Green Food Development in China: Experiences and Challenges. Agriculture 2020, 10, 614–623. [Google Scholar] [CrossRef]
- Guo, H.; Li, S. Environmental Regulation, Special Effect and Agricultural Green Development. R D Manag. 2022, 34, 54–67. [Google Scholar]
- Zhang, X.; Chen, H. Green agricultural development based on information communication technology and the panel space measurement model. Sustainability 2021, 13, 1147. [Google Scholar] [CrossRef]
- Cao, Y.; Chai, L.; Yan, X.; Liang, Y. Drivers of the Growing Water, Carbon and Ecological Footprints of the Chinese Diet from 1961 to 2017. Int. J. Environ. Res. Public Health 2020, 17, 1803–1812. [Google Scholar] [CrossRef] [PubMed]
- Qin, Q.; Yan, H.; Liu, J.; Chen, X.; Ye, B. China’s agricultural GHG emission efficiency: Regional disparity and spatial dynamic evolution. Environ. Geochem. Health 2022, 44, 2863–2879. [Google Scholar] [CrossRef] [PubMed]
- Shen, J.; Zhu, Q.; Jiao, X.; Ying, H.; Wang, H.; Wen, X.; Xu, W.; Li, T.; Cong, W.; Liu, X.; et al. Agricultural green development: A model for China and the world. Front. Agr. Sci. Eng. 2020, 7, 5–13. [Google Scholar] [CrossRef]
- Chen, Y.; Liu, B.; Shen, Y.; Wang, X. Spatial analysis of change trend and influencing factors of total factor productivity in China’s regional construction industry. Appl. Econ. 2018, 50, 2824–2843. [Google Scholar] [CrossRef]
- Feng, C.; Huang, J.-B.; Wang, M. Analysis of green total-factor productivity in China’s regional metal industry: A meta-frontier approach. Resour. Policy 2018, 58, 219–229. [Google Scholar] [CrossRef]
- Wang, K.-L.; Pang, S.-Q.; Ding, L.-L.; Miao, Z. Combining the biennial Malmquist–Luenberger index and panel quantile regression to analyze the green total factor productivity of the industrial sector in China. Sci. Total Environ. 2020, 739, 140280–140286. [Google Scholar] [CrossRef] [PubMed]
- Baležentis, T.; Blancard, S.; Shen, Z.; Štreimikiene, D. Analysis of environmental total factor productivity evolution in European agricultural sector. Decis. Sci. 2019, 52, 365–373. [Google Scholar] [CrossRef]
- Belaïd, F.; Elsayed, A.H.; Omri, A. Key drivers of renewable energy deployment in the MENA Region: Empirical evidence using panel quantile regression. Struct. Change Econ. Dyn. 2021, 57, 225–238. [Google Scholar] [CrossRef]
- Koenker, R.; Bassett, G., Jr. Regression quantiles. Econometrical 1978, 46, 33–50. [Google Scholar] [CrossRef]
- Yan, D.; Kong, Y.; Ren, X.; Shi, Y.; Chiang, S. The determinants of urban sustainability in Chinese resource-based cities: A panel quantile regression approach. Sci. Total Environ. 2019, 686, 1210–1219. [Google Scholar] [CrossRef] [PubMed]
- Priya, E.; Sarkar, S.; Maji, P.K.A. Review on Slow-Release Fertilizer: Nutrient Release Mechanism and Agricultural Sustainability. J. Environ. Chem. Eng. 2024, 12, 113211. [Google Scholar] [CrossRef]
- Baraj, B.; Mishra, M.; Sudarsan, D.; da Silva, R.M.; Santos, C.A.G. Climate change and resilience, adaptation, and sustainability of agriculture in India: A bibliometric review. Heliyon 2024, 10, e29586. [Google Scholar] [CrossRef] [PubMed]
- Rakholia, R.; Tailor, J.; Prajapati, M.; Shah, M.; Saini, J.R. Emerging Technology Adoption for Sustainable Agriculture in India–A Pilot Study. J. Agric. Food Res. 2024, 17, 101238. [Google Scholar] [CrossRef]
- Raihan, A.; Hasan, M.A.; Voumik, L.C.; Pattak, D.C.; Akter, S.; Ridwan, M. Sustainability in Vietnam: Examining Economic Growth, Energy, Innovation, Agriculture, and Forests’ Impact on CO2 Emissions. World Dev. Sustain. 2024, 4, 100164. [Google Scholar] [CrossRef]
- Shen, N.; Liao, H.; Deng, R.; Wang, Q. Different types of environmental regulations and the heterogeneous influence on the environmental total factor productivity: Empirical analysis of China’s industry. J. Clean. Prod. 2019, 211, 171–184. [Google Scholar] [CrossRef]
- Li, M.; Wang, J. Spatial-temporal distribution characteristics and driving mechanism of green total factor productivity in China’s logistics industry. Pol. J. Environ. Stud. 2020, 30, 201–213. [Google Scholar] [CrossRef] [PubMed]
- Zhang, F.; Wang, F.; Hao, R.; Wu, L. Agricultural Science and Technology Innovation, Spatial Spillover and Agricultural Green Development—Taking 30 Provinces in China as the Research Object. Appl. Sci. 2022, 12, 845. [Google Scholar] [CrossRef]
- Liu, Y.; Deng, Y.; Peng, B.Y. The Impact of Digital Financial Inclusion on Green and Low-Carbon Agricultural Development. Agriculture 2023, 13, 1748. [Google Scholar] [CrossRef]
- Chen, Z.; Li, X.; Xia, X. Measurement and spatial convergence analysis of China’s agricultural green development index. Environ. Sci. Pollut. Res. 2021, 16, 19694–19709. [Google Scholar] [CrossRef] [PubMed]
- Yan, J.; Tang, Z.; Guan, Y.; Xie, M.; Huang, Y. Analysis of Measurement, Regional Differences, Convergence and Dynamic Evolutionary Trends of the Green Production Level in Chinese Agriculture. Agriculture 2023, 13, 2016. [Google Scholar] [CrossRef]
- Veisi, H.; Liaghati, H.; Alipour, A. Developing an ethics-based approach to indicators of sustainable agriculture using analytic hierarchy process (AHP). Ecol. Indic. 2016, 60, 644–654. [Google Scholar] [CrossRef]
- Benyam, A.; Soma, T.; Fraser, E. Digital agricultural technologies for food loss and waste prevention and reduction: Global trends, adoption opportunities and barriers. J. Clean. Prod. 2021, 323, 129099. [Google Scholar] [CrossRef]
- Shen, Z.; Wang, S.; Boussemart, J.-P. Digital transition and green growth in Chinese agriculture. Technol. Forecast. Soc. Change 2022, 181, 121742. [Google Scholar] [CrossRef]
- Chen, Y.; Sumin Hu, S.; Wu, H. The Digital Economy, Green Technology Innovation, and Agricultural Green Total Factor Productivity. Agriculture 2023, 13, 1961. [Google Scholar] [CrossRef]
- Xiao, S.; He, Z.; Zhang, W.; Qin, X. The agricultural green production following the technological progress: Evidence from China. Int. J. Environ. Res. Public Health 2022, 19, 9876. [Google Scholar] [CrossRef] [PubMed]
- Guo, Z.; Chen, X.; Zhang, Y. Impact of environmental regulation perception on farmers’ agricultural green production technology adoption: A new perspective of social capital. Technol. Soc. 2022, 71, 102085. [Google Scholar] [CrossRef]
- Tang, M.; Cao, A.; Guo, L.; Li, H. Improving agricultural green total factor productivity in China: Do environmental governance and green low-carbon policies matter? Environ. Sci. Pollut. Res. 2023, 30, 52906–52922. [Google Scholar] [CrossRef] [PubMed]
- Li, G.; Jia, X.; Khan, A.A.; Khan, S.U.; Ali, M.A.S.; Luo, J. Does green finance promote agricultural green total factor productivity? Considering green credit, green investment, green securities, and carbon finance in China. Environ. Sci. Pollut. Res. 2023, 30, 36663–36679. [Google Scholar] [CrossRef] [PubMed]
- Du, Y.; Wang, W. The role of green financing, agriculture development, geopolitical risk, and natural resource on environmental pollution in China. Resour. Policy 2023, 82, 103440. [Google Scholar] [CrossRef]
- Huang, T.; Xiong, B. Space Comparison of Agricultural Green Growth in Agricultural Modernization: Scale and Quality. Agriculture 2022, 12, 1067. [Google Scholar] [CrossRef]
- Ahmed, N.; Hamid, Z.; Mahboob, F.; Rehman, K.U.; Ali, M.S.E.; Senkus, P.; Wysokińska-Senkus, A.; Siemiński, P.; Skrzypek, A. Causal Linkage among Agricultural Insurance, Air Pollution, and Agricultural Green Total Factor Productivity in United States: Pairwise Granger Causality Approach. Agriculture 2022, 12, 1320. [Google Scholar] [CrossRef]
- Hou, D.; Wang, X. Inhibition or Promotion?—The Effect of Agricultural Insurance on Agricultural Green Development. Front. Public Health 2022, 10, 910534. [Google Scholar] [CrossRef] [PubMed]
- Chen, Z.; Sarkar, A.; Rahman, A.; Li, X.; Xia, X. Exploring the drivers of green agricultural development (GAD) in China: A spatial association network structure approaches. Land Use Policy 2022, 112, 105827. [Google Scholar] [CrossRef]
- Zhou, B.; Ma, X.; Luo, Y.; Yang, D. Wind power prediction based on LSTM networks and nonparametric kernel density estimation. IEEE Access 2019, 7, 165279–165292. [Google Scholar] [CrossRef]
- Powell, D. Quantile Regression with Nonadditive Fixed Effects. Empir. Econ. 2022, 63, 2675–2691. [Google Scholar] [CrossRef]
- OECD–The Organization for Economic Co-Operation and Development. Towards Green Growth; OECD Publishing: Paris, France, 2011. [Google Scholar]
- Capozza, I.; Samson, R. Towards Green Growth in Emerging Market Economies: Evidence from Environmental Performance Reviews; OECD Green Growth Papers, 2019–01; OECD Publishing: Paris, France, 2019. [Google Scholar]
- Rosenbaum, E. Green Growth—Magic Bullet or Damp Squib? Sustainability 2017, 9, 1092. [Google Scholar] [CrossRef]
- Zhang, H.; Zhang, J.; Song, J. Analysis of the threshold effect of agricultural industrial agglomeration and industrial structure upgrading on sustainable agricultural development in China. J. Clean. Prod. 2022, 341, 130818. [Google Scholar] [CrossRef]
- Volkov, A.; Morkunas, M.; Balezentis, T.; Streimikiene, D. Are agricultural sustainability and resilience complementary notions? Evidence from the North European agriculture. Land Use Policy 2022, 112, 105791. [Google Scholar] [CrossRef]
- Horowitz, J.K.; Lichtenberg, E. Insurance, moral hazard, and chemical use in agriculture. Am. J. Agric. Econ. 1993, 75, 926–935. [Google Scholar] [CrossRef]
- Niu, Z.H.; Feng, Y.; Chen, C. Agricultural insurance and agricultural fertilizer non-point source pollution: Evidence from China’s policy-based agricultural insurance pilot. Sustainability 2022, 14, 2800. [Google Scholar] [CrossRef]
- Zaman, K.; Khan, M.M.; Ahmad, M.; Rustam, R. The relationship between agricultural technology and energy demand in Pakistan. Energy Pol. 2022, 44, 268–279. [Google Scholar] [CrossRef]
- Chen, Y.; Miao, J.; Zhu, Z. Measuring green total factor productivity of China’s agricultural sector: A three-stage SBM-DEA model with non-point source pollution and CO2 emissions. J. Clean. Prod. 2021, 318, 128543. [Google Scholar] [CrossRef]
- Yu, C.; Liu, W.; Khan, S.U.; Yu, C.; Zhu, Z.; Yue, D.; Zhao, M. Regional differential decomposition and convergence of rural green development efficiency: Evidence from China. Environ. Sci. Pollut. Res. 2020, 27, 22364–22379. [Google Scholar] [CrossRef]


| Form | Indicator | Indicator Meaning | Attribute | Weight |
|---|---|---|---|---|
| Resource conservation | Farmland multiple cropping index | Area sown under crops/cultivated land area | negative | 0.0107 |
| Water use efficiency | Effective irrigated area/cultivated land area | positive | 0.1077 | |
| Energy use efficiency | Total power of agricultural machinery/area sown under crops | negative | 0.0057 | |
| Environmental preservation | Pesticide use intensity | Pesticide use/area sown under crops | negative | 0.0106 |
| Fertilizer use intensity | Fertilizer use/area sown under crops | negative | 0.0243 | |
| Agricultural film use intensity | Agricultural film use/area sown under crops | negative | 0.0155 | |
| Ecological protection | Wetland area cover | Wetland area/total area | positive | 0.1742 |
| Forest cover | Forest area/total land area | positive | 0.1108 | |
| Production efficiency | Land productivity | Total agricultural output/area sown under crops | positive | 0.1026 |
| Labor productivity | Total output value of agriculture, forestry, animal husbandry, and fishery/employees in the primary industry | positive | 0.1162 | |
| Agricultural machinery productivity | Total agricultural output/total power of agricultural machinery | positive | 0.0765 | |
| Economic benefit | Rural income | Per capita disposable income of rural residents | positive | 0.0949 |
| Agricultural output | Total agricultural output | positive | 0.1503 |
| Region | Province | 2010 | 2011 | 2012 | 2013 | 2014 | 2015 | 2016 | 2017 | 2018 | 2019 | 2020 | 2021 | Mean |
|---|---|---|---|---|---|---|---|---|---|---|---|---|---|---|
| Eastern Region | Beijing | 28.71 | 29.76 | 31.27 | 31.52 | 30.83 | 32.78 | 32.84 | 32.71 | 34.39 | 41.64 | 43.45 | 42.50 | 34.37 |
| Tianjin | 27.06 | 27.26 | 28.16 | 34.68 | 35.49 | 36.30 | 37.10 | 37.93 | 40.23 | 43.60 | 45.67 | 47.41 | 36.74 | |
| Hebei | 26.97 | 26.81 | 27.99 | 28.54 | 28.78 | 30.22 | 29.59 | 30.50 | 32.55 | 33.83 | 35.86 | 37.49 | 30.76 | |
| Liaoning | 25.46 | 26.27 | 27.09 | 28.52 | 29.03 | 30.80 | 30.65 | 31.19 | 32.77 | 34.07 | 35.46 | 37.08 | 30.70 | |
| Shanghai | 28.63 | 29.56 | 29.73 | 30.06 | 30.78 | 30.91 | 30.53 | 31.15 | 34.16 | 36.01 | 36.14 | 38.21 | 32.16 | |
| Jiangsu | 34.39 | 36.61 | 39.15 | 48.18 | 49.64 | 51.84 | 52.57 | 53.75 | 54.24 | 56.56 | 58.53 | 61.09 | 49.71 | |
| Zhejiang | 34.98 | 46.20 | 47.51 | 40.60 | 41.33 | 43.00 | 44.27 | 46.48 | 48.07 | 54.11 | 56.43 | 58.19 | 46.76 | |
| Fujian | 31.90 | 33.58 | 34.92 | 40.03 | 41.61 | 42.15 | 44.18 | 45.62 | 49.50 | 54.96 | 57.18 | 59.49 | 44.59 | |
| Shandong | 31.94 | 32.68 | 33.37 | 34.64 | 36.08 | 36.83 | 37.21 | 37.75 | 39.40 | 42.10 | 43.55 | 46.74 | 37.69 | |
| Guangdong | 34.88 | 36.17 | 36.50 | 38.92 | 40.08 | 42.61 | 44.04 | 45.34 | 47.57 | 53.46 | 54.02 | 57.39 | 44.25 | |
| Hainan | 30.56 | 32.07 | 33.89 | 32.00 | 36.22 | 37.61 | 40.43 | 41.37 | 42.92 | 45.80 | 47.83 | 51.13 | 39.32 | |
| Central Region | Shanxi | 13.92 | 14.68 | 15.26 | 15.34 | 15.81 | 16.04 | 17.32 | 18.57 | 19.51 | 20.33 | 21.81 | 21.58 | 17.51 |
| Jilin | 22.07 | 22.16 | 22.98 | 22.48 | 23.04 | 23.29 | 22.72 | 22.68 | 23.66 | 24.72 | 26.44 | 26.58 | 23.57 | |
| Heilongjiang | 26.09 | 28.59 | 30.64 | 34.93 | 36.34 | 36.31 | 36.99 | 38.54 | 39.62 | 41.07 | 42.03 | 42.79 | 36.16 | |
| Anhui | 24.75 | 25.57 | 26.23 | 27.92 | 28.73 | 29.50 | 29.88 | 30.93 | 31.54 | 33.04 | 35.05 | 36.77 | 29.99 | |
| Jiangxi | 28.07 | 28.32 | 28.61 | 31.13 | 31.89 | 33.85 | 34.34 | 34.95 | 36.41 | 38.00 | 38.99 | 40.21 | 33.73 | |
| Henan | 26.19 | 26.76 | 26.76 | 29.29 | 31.03 | 31.84 | 31.86 | 32.72 | 34.99 | 37.86 | 41.45 | 42.95 | 32.81 | |
| Hubei | 26.94 | 29.04 | 30.20 | 34.99 | 35.74 | 36.17 | 37.37 | 35.65 | 36.63 | 38.85 | 40.68 | 43.29 | 35.46 | |
| Hunan | 29.44 | 30.00 | 31.62 | 30.92 | 32.26 | 32.52 | 33.49 | 34.27 | 35.32 | 38.62 | 41.83 | 42.93 | 34.44 | |
| Western Region | Inner Mongolia | 17.69 | 19.13 | 19.13 | 21.04 | 21.64 | 21.92 | 22.53 | 22.61 | 23.65 | 23.97 | 25.18 | 26.42 | 22.08 |
| Guangxi | 23.47 | 25.28 | 25.90 | 27.78 | 28.58 | 30.55 | 31.13 | 32.48 | 34.50 | 38.14 | 39.97 | 42.27 | 31.67 | |
| Chongqing | 17.96 | 18.69 | 19.57 | 22.00 | 22.76 | 24.71 | 25.31 | 25.96 | 28.07 | 30.16 | 33.94 | 34.11 | 25.27 | |
| Sichuan | 25.65 | 27.80 | 29.39 | 28.51 | 29.51 | 30.78 | 33.02 | 34.57 | 36.03 | 38.71 | 40.63 | 42.65 | 33.10 | |
| Guizhou | 19.57 | 19.02 | 16.39 | 18.05 | 20.13 | 23.10 | 25.10 | 26.42 | 29.16 | 30.63 | 35.76 | 35.61 | 24.91 | |
| Yunnan | 19.33 | 19.48 | 20.85 | 23.04 | 23.95 | 24.35 | 25.07 | 25.83 | 29.39 | 32.72 | 34.40 | 37.58 | 26.33 | |
| Tibet | 20.04 | 20.56 | 21.19 | 16.39 | 17.07 | 17.40 | 17.04 | 18.55 | 24.24 | 20.27 | 22.00 | 22.85 | 19.80 | |
| Shaanxi | 21.65 | 22.65 | 23.54 | 24.25 | 25.36 | 25.73 | 27.49 | 28.31 | 30.72 | 32.63 | 35.75 | 37.54 | 27.97 | |
| Gansu | 12.95 | 12.43 | 12.99 | 13.85 | 14.21 | 14.63 | 15.82 | 16.75 | 17.63 | 18.90 | 19.95 | 21.52 | 15.97 | |
| Qinghai | 14.37 | 14.47 | 15.11 | 18.68 | 18.87 | 19.23 | 19.90 | 20.42 | 20.99 | 22.55 | 23.72 | 24.32 | 19.39 | |
| Ningxia | 12.12 | 12.96 | 12.94 | 14.14 | 14.55 | 15.42 | 16.57 | 17.04 | 18.50 | 19.22 | 21.30 | 23.58 | 16.53 | |
| Xinjiang | 22.57 | 23.24 | 23.12 | 26.32 | 26.81 | 27.21 | 28.29 | 28.90 | 30.41 | 29.03 | 31.09 | 34.79 | 27.65 |
| Variable | Meaning | Formula | Mean | Standard Deviation | Min | Max |
|---|---|---|---|---|---|---|
| mark | Agricultural marketization level | Total output value of agriculture, forestry, animal husbandry, and fishery/local fiscal expenditure on agriculture, forestry, and water affairs | 6.322 | 3.076 | 0.482 | 16.661 |
| fina | Financial support for agriculture | Total agricultural loans/total output value of agriculture, forestry, animal husbandry, and fishery | 3.021 | 2.214 | 0.662 | 13.538 |
| insu | Agricultural insurance level | Total agricultural insurance/total output value of agriculture, forestry, animal husbandry, and fishery | 0.579 | 0.620 | 0.009 | 4.842 |
| tech | Technology development level | log (number of rural technical personnel) | 9.647 | 1.026 | 6.966 | 11.475 |
| info | Rural informatization level | log (average number of mobile phones owned per hundred rural households) | 5.406 | 0.208 | 4.435 | 5.746 |
| pgdp | Per capita GDP | GDP/total population | 5.409 | 2.887 | 1.299 | 18.751 |
| urba | Urbanization rate | Urban population/rural population | 58.950 | 12.464 | 33.803 | 89.583 |
| stru | Industrial structure upgrading level | Added value of tertiary industry/added value of secondary industry | 1.314 | 0.724 | 0.527 | 5.244 |
| Variable | (1) | (2) | (3) | (4) | (5) |
|---|---|---|---|---|---|
| 10 | 30 | 50 | 70 | 90 | |
| mark | 0.581 *** | 0.646 *** | 0.473 *** | 1.339 *** | 1.51 *** |
| (88.910) | (31.550) | (11.890) | (16.610) | (62.890) | |
| fina | 0.127 *** | 0.223 *** | 0.468 *** | 0.076 | 0.373 *** |
| (67.640) | (6.090) | (14.070) | (0.690) | (23.090) | |
| insu | −1.451 *** | −3.653 *** | −4.661 *** | −4.31 *** | −1.687 *** |
| (−63.860) | (−29.100) | (−23.180) | (−11.000) | (−33.170) | |
| tech | 5.398 *** | 4.181 *** | 4.383 *** | 3.426 *** | 2.936 *** |
| (656.550) | (67.240) | (25.110) | (18.840) | (86.660) | |
| info | 5.81 *** | 4.142 *** | 2.912 *** | 0.342 | 7.21 *** |
| (96.170) | (19.500) | (4.04) | (0.240) | (37.080) | |
| perg | 1.762 *** | 2.605 *** | 2.338 *** | 2.813 *** | 1.569 *** |
| (337.280) | (85.080) | (30.990) | (11.690) | (90.360) | |
| urba | 0.115 *** | 0.057 *** | 0.021 *** | 0.119 *** | 0.193 *** |
| (110.430) | (10.030) | (4.030) | (5.640) | (49.830) | |
| stru | 0.364 *** | 0.481 *** | 1.004 *** | 6.879 *** | 7.588 *** |
| (18.610) | (3.860) | (4.360) | (18.900) | (133.660) | |
| Number of observations | 360 | 360 | 360 | 360 | 360 |
Disclaimer/Publisher’s Note: The statements, opinions and data contained in all publications are solely those of the individual author(s) and contributor(s) and not of MDPI and/or the editor(s). MDPI and/or the editor(s) disclaim responsibility for any injury to people or property resulting from any ideas, methods, instructions or products referred to in the content. |
© 2024 by the authors. Licensee MDPI, Basel, Switzerland. This article is an open access article distributed under the terms and conditions of the Creative Commons Attribution (CC BY) license (https://creativecommons.org/licenses/by/4.0/).
Share and Cite
Pan, F.; Deng, H.; Chen, M.; Zhao, L.; Qian, W.; Wan, X. Spatial–Temporal Evolution and Driving Factors of Agricultural Green Development in China: Evidence from Panel Quantile Approaches. Sustainability 2024, 16, 6345. https://doi.org/10.3390/su16156345
Pan F, Deng H, Chen M, Zhao L, Qian W, Wan X. Spatial–Temporal Evolution and Driving Factors of Agricultural Green Development in China: Evidence from Panel Quantile Approaches. Sustainability. 2024; 16(15):6345. https://doi.org/10.3390/su16156345
Chicago/Turabian StylePan, Fanghui, Haonan Deng, Miao Chen, Lijuan Zhao, Wei Qian, and Xiangrong Wan. 2024. "Spatial–Temporal Evolution and Driving Factors of Agricultural Green Development in China: Evidence from Panel Quantile Approaches" Sustainability 16, no. 15: 6345. https://doi.org/10.3390/su16156345
APA StylePan, F., Deng, H., Chen, M., Zhao, L., Qian, W., & Wan, X. (2024). Spatial–Temporal Evolution and Driving Factors of Agricultural Green Development in China: Evidence from Panel Quantile Approaches. Sustainability, 16(15), 6345. https://doi.org/10.3390/su16156345