

Measurement of Tourism Ecological Efficiency and Analysis of Influencing Factors under the Background of Climate Change: A Case Study of Three Provinces in China’s Cryosphere


Abstract
1. Introduction
2. Materials and Methods
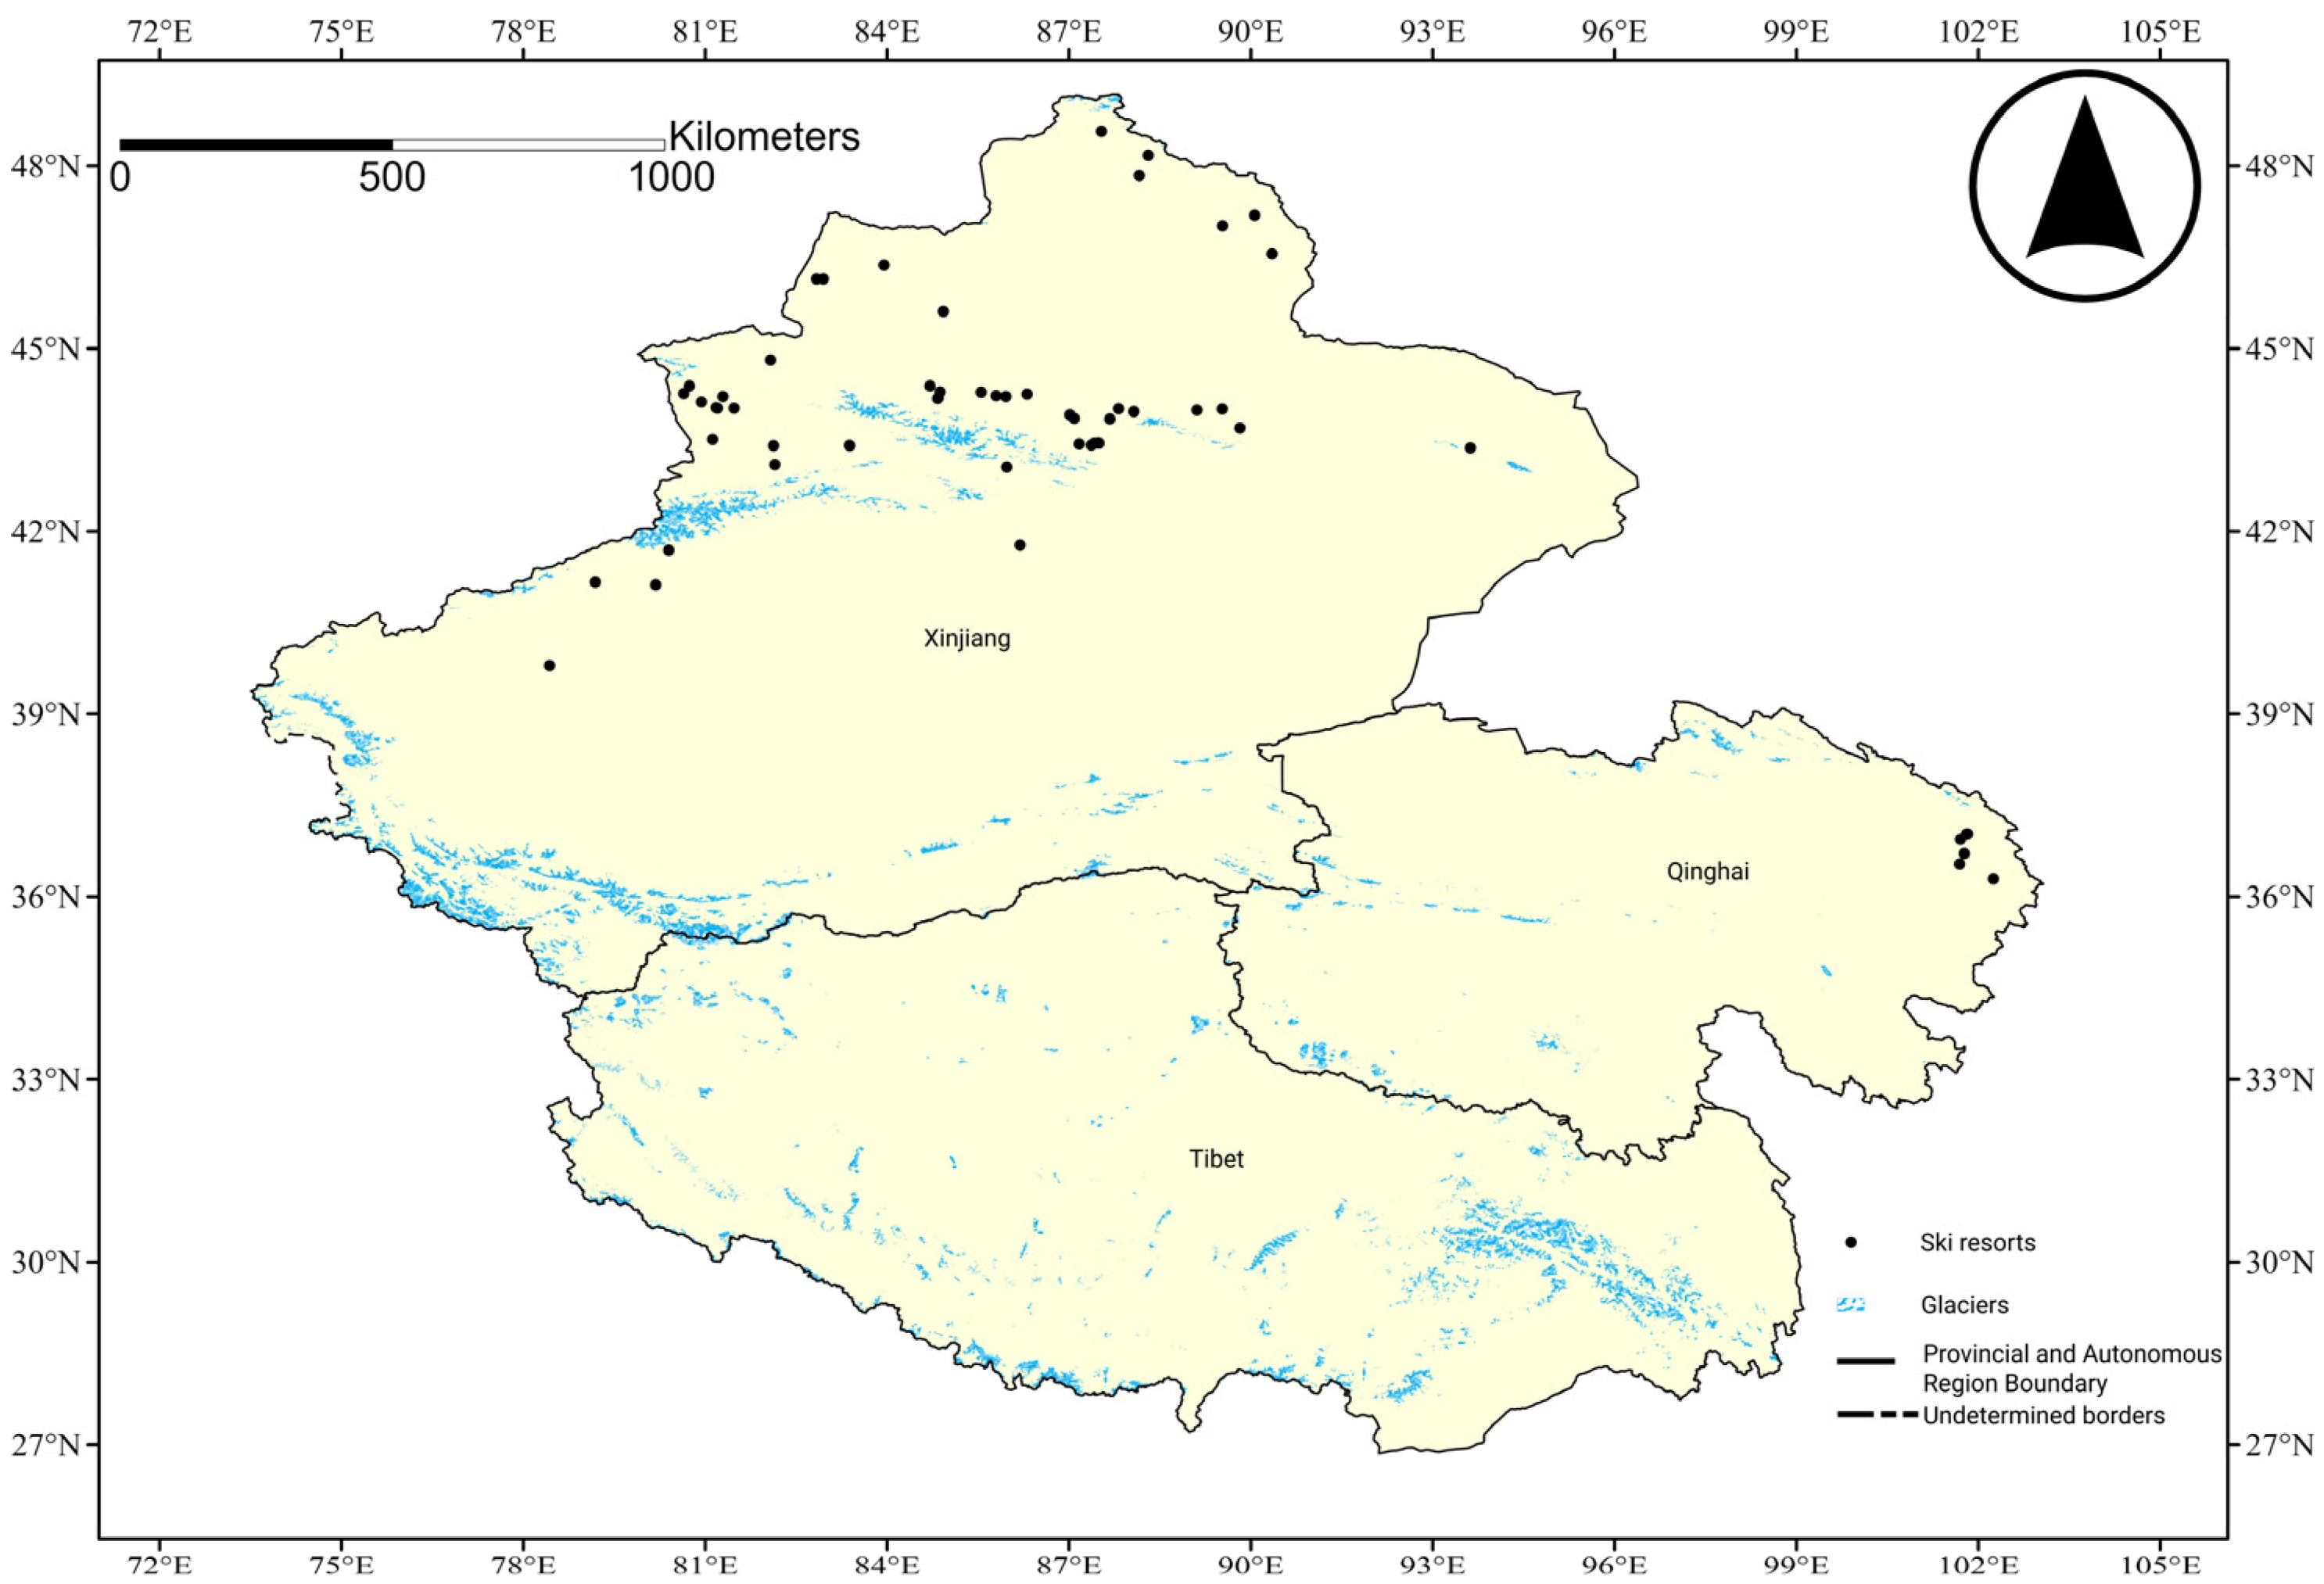
2.1. Research Area Overview
2.2. Evaluation Indicator System
2.3. Measurement Method
2.3.1. Super-Efficiency Slack-Based Measure Model
2.3.2. Malmquist–Luenberger Index
2.4. Data Sources
3. Analysis of the Results
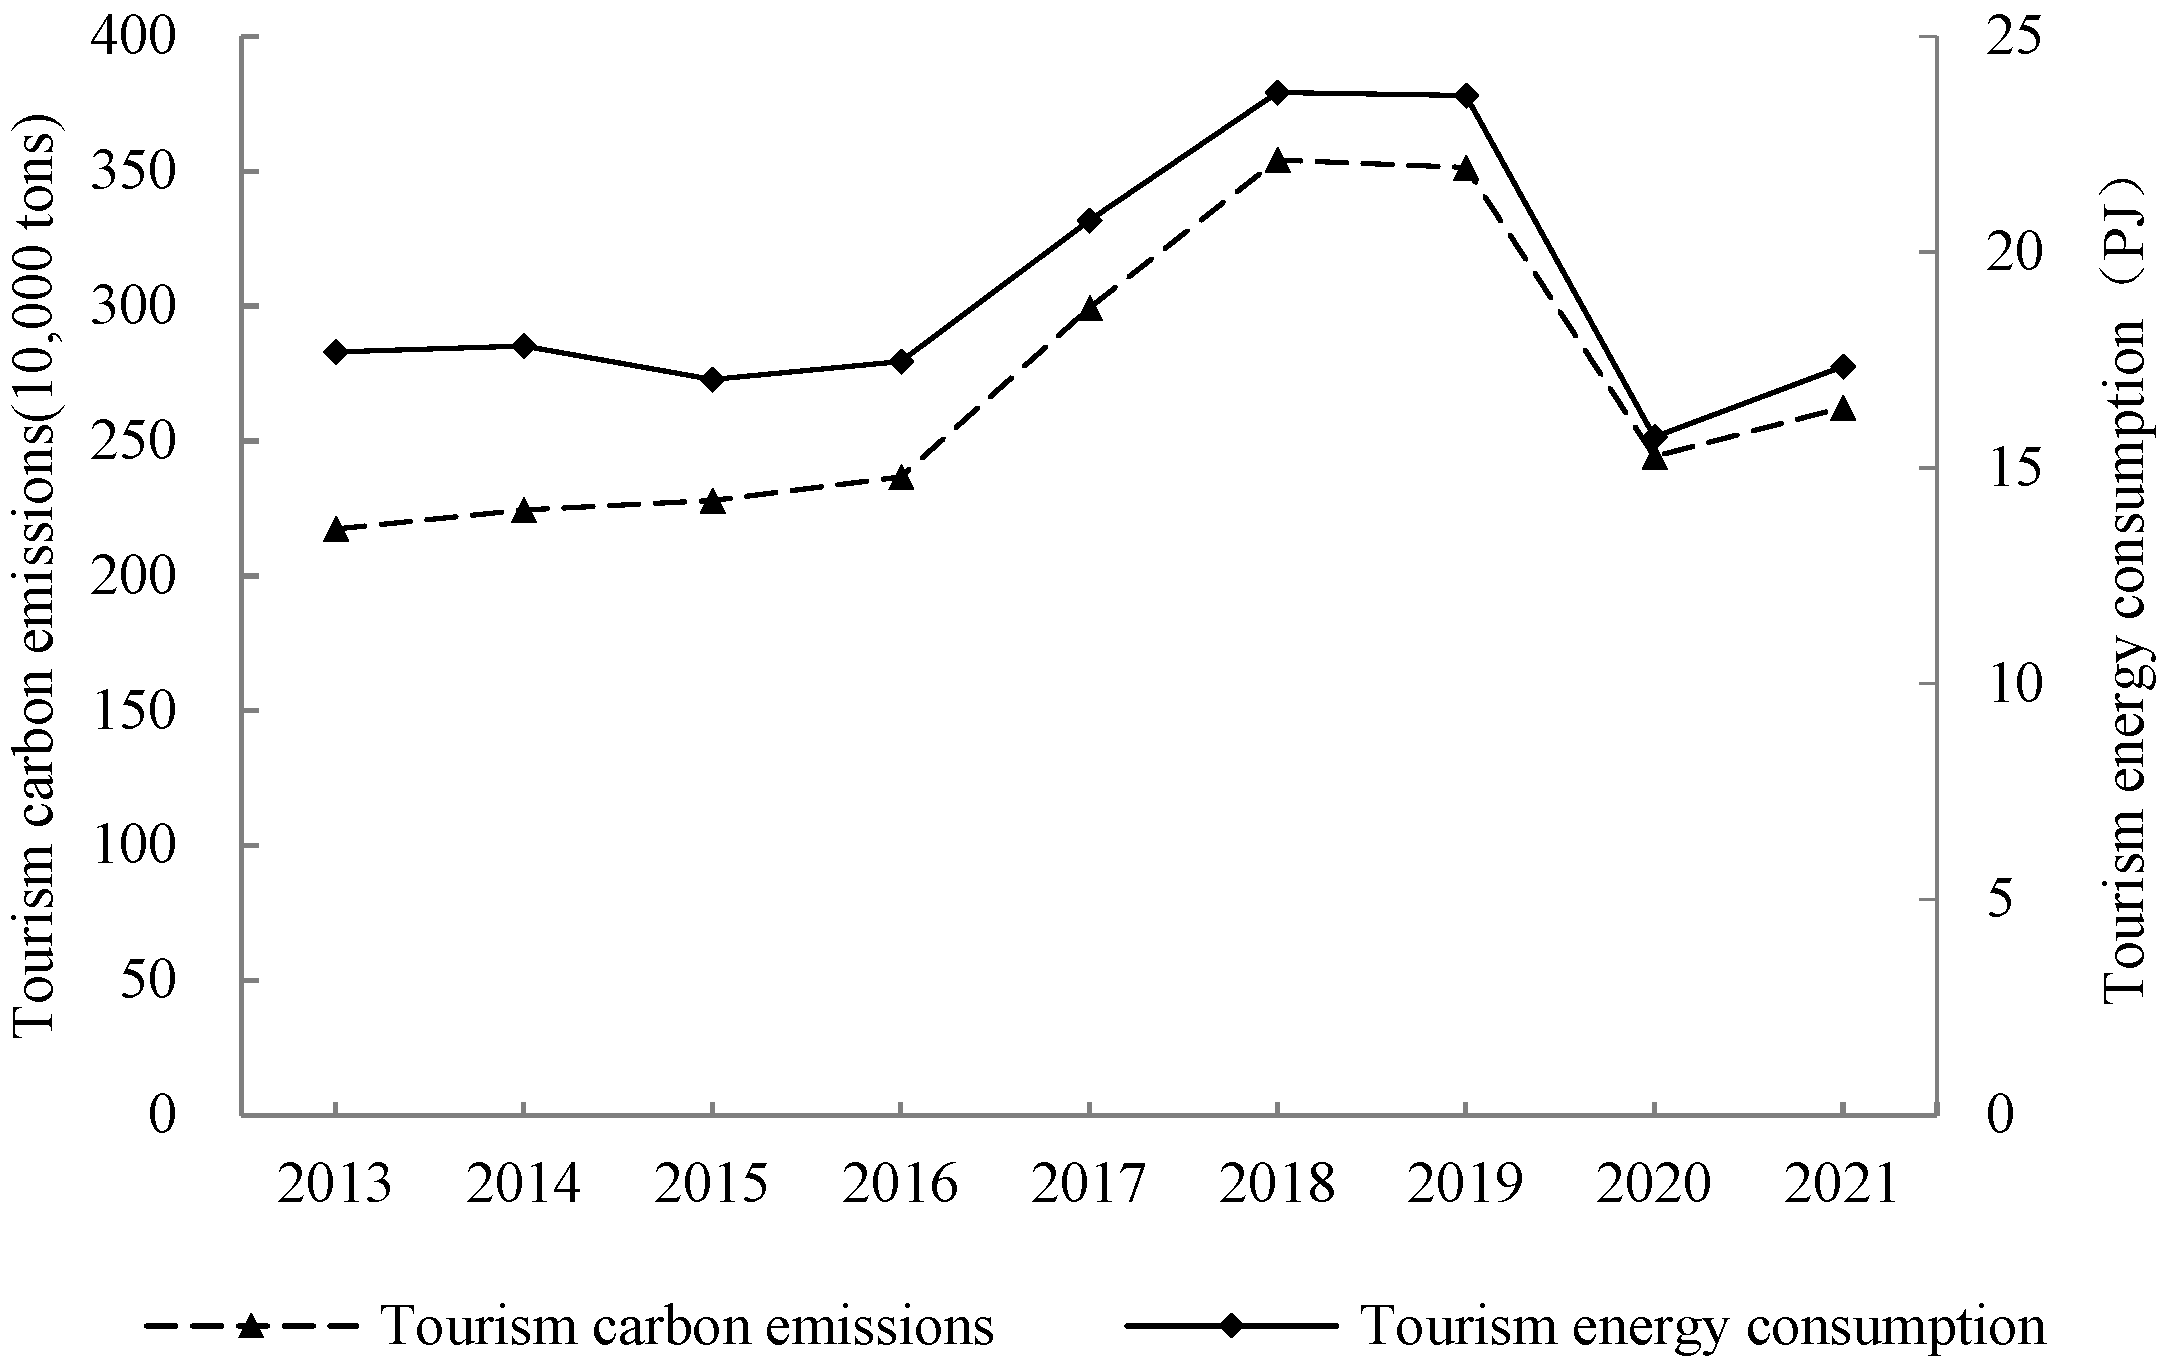
3.1. Estimation Results of Tourism Carbon Emissions and Energy Consumption
3.2. Analysis of Measurement Results
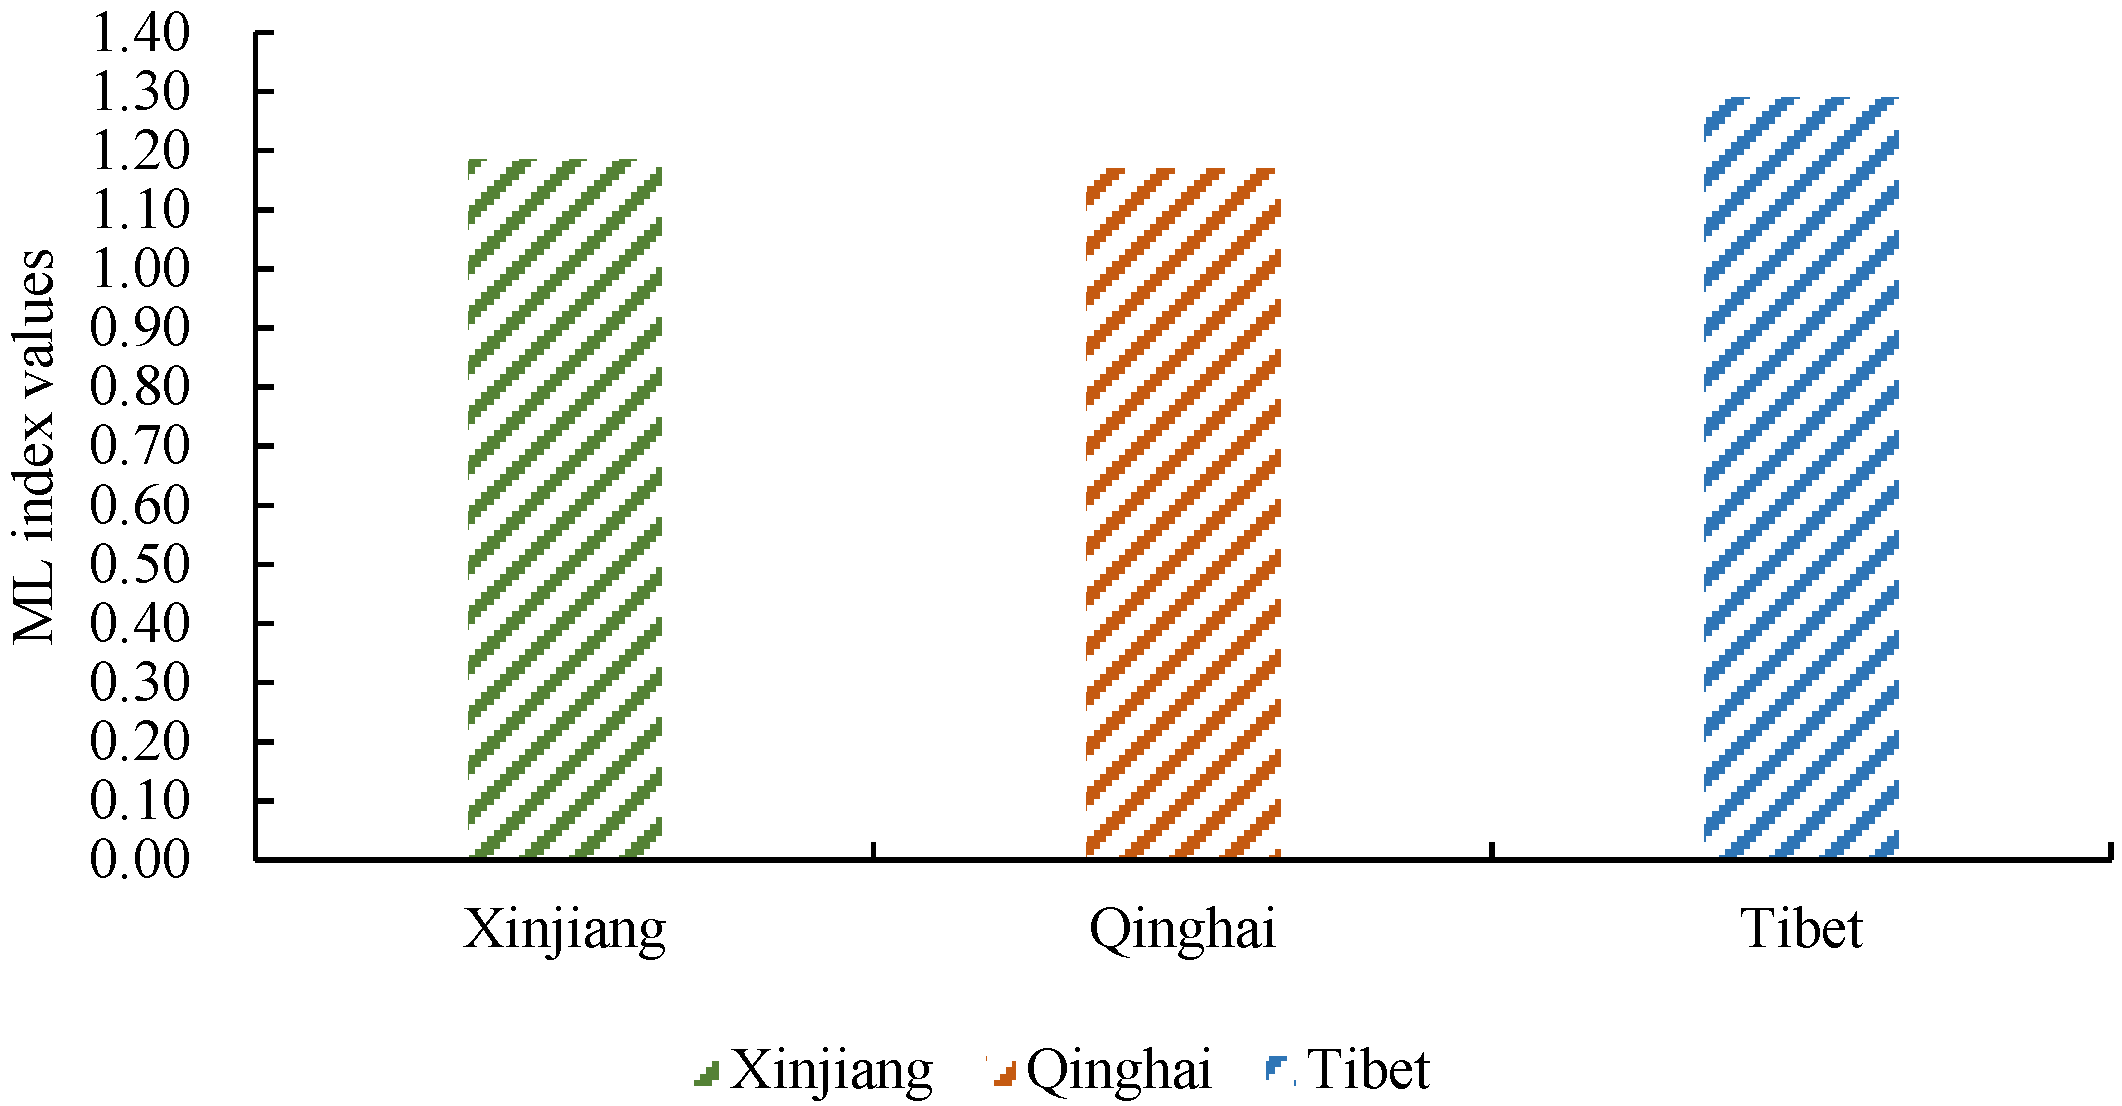
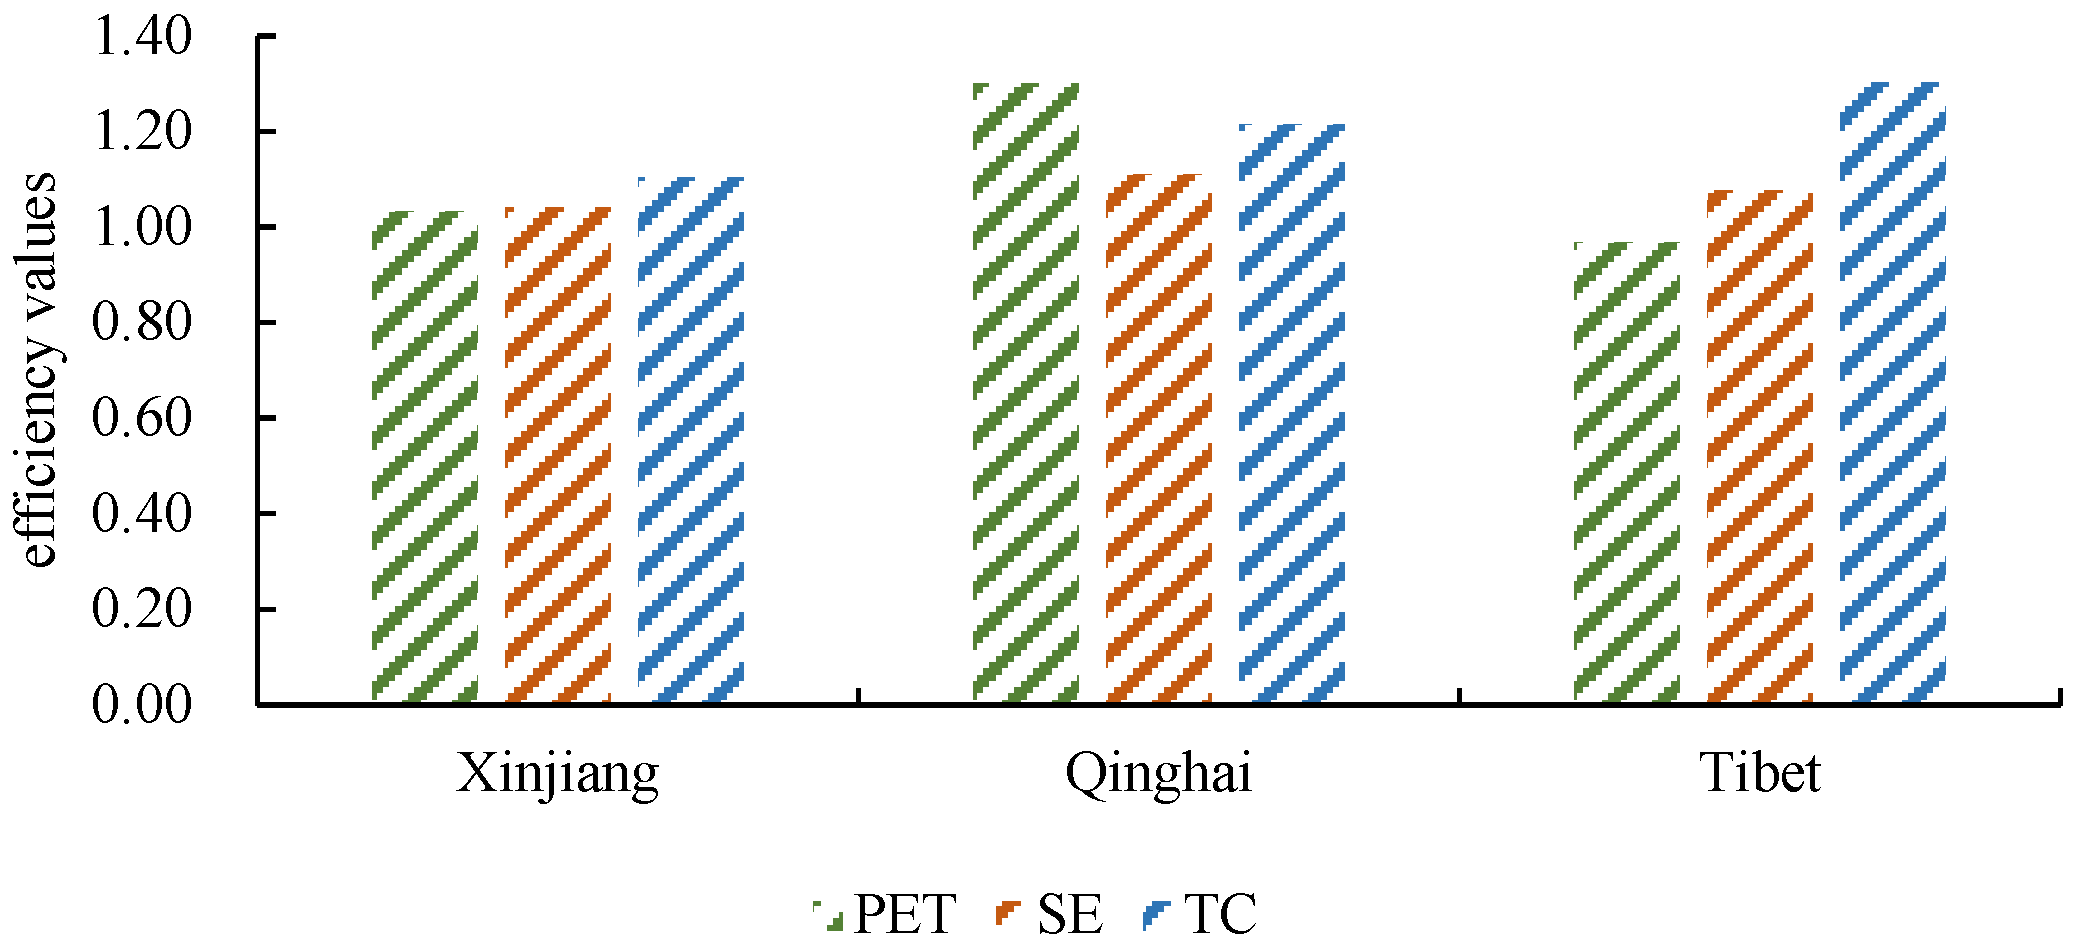
3.3. Tourism Ecological Efficiency Dynamic Change and Efficiency Decomposition
3.3.1. Dynamic Change Analysis
3.3.2. Efficiency Decomposition Analysis
3.4. Impact Factor Analysis
3.4.1. Gray Relational Model
3.4.2. Variable Selection and Data Description
- (1)
- Resource Endowment: Tourism in the cryosphere is based on scarce resources such as glaciers, permafrost, and snow, which influence surface albedo and consequently affect cryospheric temperatures. Climate warming leads to thickening of the polar atmosphere, northward extension of pressure ridges, increased north–south amplitude of air currents, and consequently a rise in the frequency of extreme events. Alongside warming, the moisture content and humidity of the atmospheric boundary layer increase, while rainfall transports heat to the underlying surface of the cryosphere, altering the physical properties of snow, affecting snow and ice melt, and thereby impacting the cryospheric tourism industry [3,60]. Drawing from the research of Cai Ziyi et al. [60], this study employs the entropy weighting method to assign weights to mean temperature, precipitation, snow depth, thunderstorm days, and hailstorm days to determine weights and calculate the resource endowment.
- (2)
- Carbon emission structure: The carbon emission efficiency of the tourism industry considers the development efficiency of the tourism industry under the constraint of carbon emissions. The carbon emission structure is an important factor affecting the carbon emission efficiency of the tourism industry [26], with carbon emissions from tourism transportation accounting for a significant proportion of overall ecotourism carbon emissions. Drawing from the research of Cheng Jiesheng et al. [61], this study adopts the proportion of ecotourism transportation carbon emissions to total tourism industry carbon emissions as a representation of the carbon emission structure of ecotourism.
- (3)
- Economic development level: The economic foundation of the cryosphere region is weak, and with climate warming, glaciers are experiencing significant shrinkage, constraining the improvement of the region’s development level [3]. The macroeconomic development level of the region is closely related to the regional tourism economy; a higher macroeconomic development level indicates relatively superior consumer demand and infrastructure, which positively influences the development of the tourism industry. Therefore, this study adopts regional per capita GDP as a measure of regional economic level indicators.
- (4)
- Infrastructure: Infrastructure constitutes the objective conditions necessary for the smooth operation of tourism activities in the cryosphere region. Transportation, as the most important category of tourism infrastructure, plays a crucial role in the development of regional tourism industry [23]. Drawing from the research of Cai Bingbing et al. [57] and Li Zhilong et al. [23], this study utilizes road network density as a representation of infrastructure.
- (5)
- Environmental regulation: At the current stage in China, environmental regulations are capable of effectively curbing carbon emissions [62], thereby incentivizing tourism enterprises to innovate technologies and management methods, enabling the tourism industry to achieve economic benefits while reducing environmental pollution from tourism [63]. Drawing from the research of Liu Rongzeng et al. [64], this study employs the ratio of investment in industrial pollution control (in ten thousand RMB) to the added value of the secondary industry (in hundred million RMB) as a measure of the intensity of environmental regulation.
- (6)
- Technological investment intensity: The intensity of technological investment reflects the degree of emphasis a region places on technology. The application of regional technological innovation and progress in the tourism industry not only enhances the efficiency of tourism energy resource utilization but also strengthens the energy-saving and emission reduction capabilities of tourism enterprises [57,58]. Drawing from the research of Cai Bingbing et al. [57], this study utilizes the proportion of technology expenditure to total fiscal expenditure as a measure of technological investment intensity.
- (7)
- Industrial structure: The tourism industry is the core component of tourism economic development and serves as the fundamental driver for regional tourism economic growth, driving tourism economic development by increasing regional tourism revenue. The growth effect of tourism is closely related to the level of tourism economic development [65]. An increase in the proportion of the tourism industry contributes to the reduction of energy consumption and carbon emission pollution, thereby affecting the efficiency of the tourism industry under carbon emission constraints [66]. Therefore, drawing from the research of Tian Hong et al. [59], this study utilizes the proportion of tourism revenue to GDP as a representation of the industrial structure.
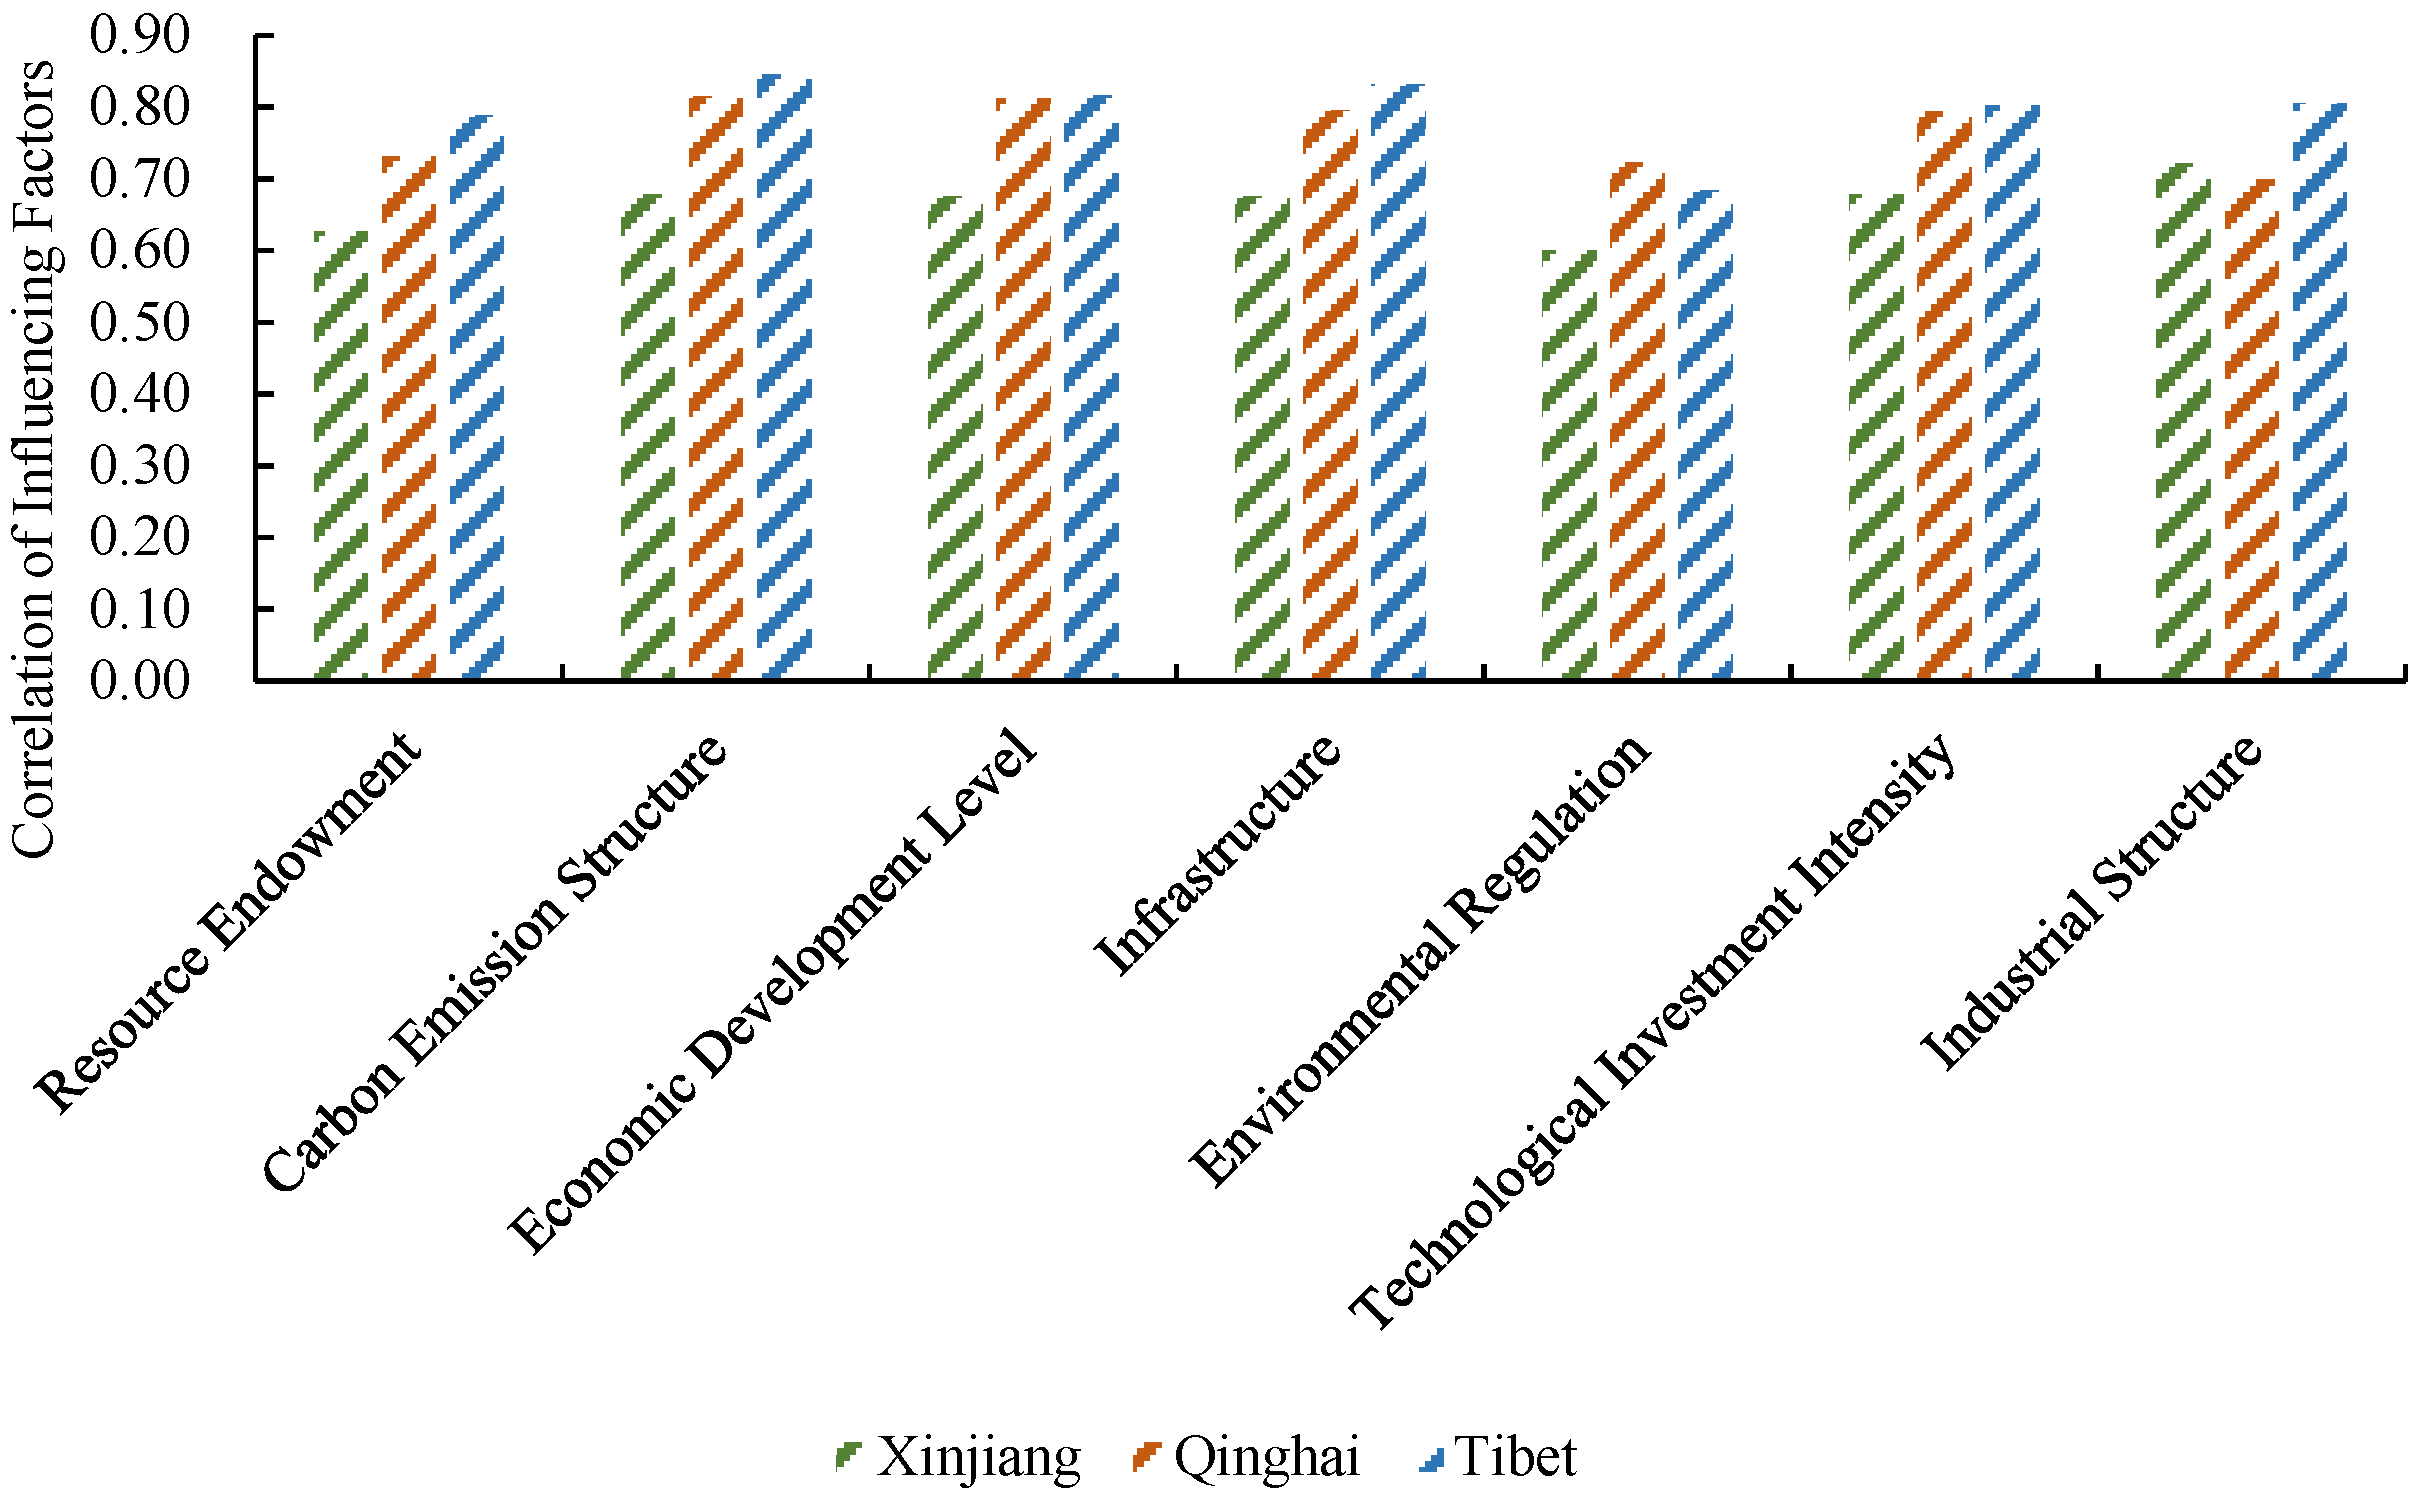
3.4.3. Results Analysis of Gray Relational
4. Discussion and Conclusions
4.1. Discussion
4.2. Conclusions
- (1)
- The overall mean of TEE in the cryosphere is between 0.2428 and 1.2142. Over the study period, the average annual growth rate and corresponding confidence interval were 14.74%, (−8.61%, 64.23%). Over the study period, there was an average annual growth rate of 14.74%, exhibiting a significant fluctuating growth trend. Throughout the study period, the mean scores in Xinjiang ranged from 0.2418 to 1.6229, surpassing the overall mean of the cryosphere and the mean scores of other provinces. In contrast, Qinghai and Tibet had mean scores below the cryosphere average in most years, with Tibet consistently lagging behind other provinces and the overall mean, indicating significant regional disparities in the ecological efficiency of cryosphere tourism.
- (2)
- The dynamic efficiency of ecological tourism in the cryosphere generally shows an increasing trend, driven by the synergistic effects of TC, PET, and SE, TC is the main source of growth in TEE. While all provinces witness improvements in dynamic ecological tourism efficiency, the degree of improvement varies, with Tibet showing the most significant progress. Qinghai and Xinjiang have relatively high levels of tourism intensification and are striving to transition from extensive to intensive or sustainable tourism development models. However, Tibet still needs to improve its tourism environmental governance, energy conservation, emission reduction technologies, management practices, and workforce quality.
- (3)
- Regarding the driving factors of ecological efficiency in cryosphere tourism, each factor is closely related to ecological tourism efficiency, with varying degrees of influence. The driving factors in descending order of their impact on ecological tourism efficiency are carbon emission structure, economic development level, infrastructure, technological input intensity, industrial structure, resource endowment, and environmental regulation. This indicates that the carbon emission structure has the strongest driving effect on ecological tourism efficiency, while economic development level serves as the fundamental driving force. However, the degree of environmental regulation in the cryosphere is not high, leading to environmental regulations having less significant driving effects on ecological tourism efficiency compared to the other six factors.
Author Contributions
Funding
Institutional Review Board Statement
Informed Consent Statement
Data Availability Statement
Conflicts of Interest
Appendix A

| Time | Province | Star-Rated Hotels | Travel Agencies | Glacier Area | Glacier Area Coverage Rate |
|---|---|---|---|---|---|
| 2013 | Qinghai | 125 | 217 | 4387.03 | 0.607369 |
| 2013 | Xinjiang | 385 | 414 | 24177.15 | 1.452168 |
| 2013 | Xizang | 125 | 102 | 25374.57 | 2.109625 |
| 2014 | Qinghai | 141.1755 | 232.3513 | 24628.09 | 3.409676 |
| 2014 | Xinjiang | 358.8211 | 421.5657 | 24381.81 | 1.464461 |
| 2014 | Xizang | 141.1755 | 99.99931 | 24137.99 | 2.006817 |
| 2015 | Qinghai | 152.7608 | 230.108 | 23566.45 | 3.262696 |
| 2015 | Xinjiang | 345.162 | 428.3102 | 23330.79 | 1.401333 |
| 2015 | Xizang | 152.7608 | 189.5007 | 23097.48 | 1.920309 |
| 2016 | Qinghai | 72.03955 | 218.9623 | 22418.29 | 3.103737 |
| 2016 | Xinjiang | 331.7611 | 393.3739 | 22194.11 | 1.333059 |
| 2016 | Xizang | 72.03955 | 194.3172 | 21972.17 | 1.826751 |
| 2017 | Qinghai | 151.1492 | 264.9775 | 21411.22 | 2.964311 |
| 2017 | Xinjiang | 300.4323 | 309.7625 | 21197.1 | 1.273176 |
| 2017 | Xizang | 151.1492 | 234.1879 | 20985.13 | 1.74469 |
| 2018 | Qinghai | 148.0375 | 448.6817 | 20347.6 | 2.817056 |
| 2018 | Xinjiang | 274.1436 | 524.5281 | 20144.12 | 1.20993 |
| 2018 | Xizang | 148.0375 | 283.2817 | 19942.68 | 1.658021 |
| 2019 | Qinghai | 183.8214 | 457.3335 | 19186.14 | 2.656256 |
| 2019 | Xinjiang | 263.7438 | 479.5341 | 18994.28 | 1.140866 |
| 2019 | Xizang | 183.8214 | 275.2881 | 18804.33 | 1.56338 |
| 2020 | Qinghai | 154.2235 | 456.6056 | 18163.44 | 2.514666 |
| 2020 | Xinjiang | 299.7828 | 569.2407 | 17981.8 | 1.080053 |
| 2020 | Xizang | 154.2235 | 268.5915 | 17801.98 | 1.480045 |
| 2021 | Qinghai | 162.2885 | 322.8596 | 17466.22 | 2.418139 |
| 2021 | Xinjiang | 312.5555 | 562.4282 | 17291.55 | 1.038594 |
| 2021 | Xizang | 162.2885 | 202.6459 | 17118.64 | 1.423232 |
| Time | Province | Snow Depth | Maximum Snow Days | Tourism Practitioners | Fixed Asset Investment in the Tertiary Industry |
| 2013 | Qinghai | 24.51 | 45.1 | 28.71043 | 1131.54 |
| 2013 | Xinjiang | 58.47 | 52 | 89.93874 | 3387.72 |
| 2013 | Xizang | 477.21 | 62.5 | 32.34661 | 583.57 |
| 2014 | Qinghai | 21.63711 | 40.2 | 29.83901 | 1456.549 |
| 2014 | Xinjiang | 73.27401 | 51.4 | 73.6268 | 4498.087 |
| 2014 | Xizang | 954.9542 | 65.1 | 36.09089 | 692.4462 |
| 2015 | Qinghai | 21.05778 | 31.7 | 31.72214 | 1586.846 |
| 2015 | Xinjiang | 96.74204 | 47.5 | 114.5824 | 5011.926 |
| 2015 | Xizang | 930.6418 | 36.8 | 52.65123 | 962.3155 |
| 2016 | Qinghai | 21.17584 | 5.9 | 36.04916 | 1963.04 |
| 2016 | Xinjiang | 46.48447 | 26.6 | 161.3634 | 5314.036 |
| 2016 | Xizang | 899.101 | 45.4 | 59.43912 | 1197.582 |
| 2017 | Qinghai | 21.32882 | 8.2 | 40.39584 | 2286.7 |
| 2017 | Xinjiang | 68.11042 | 13.1 | 201.2574 | 7469.353 |
| 2017 | Xizang | 864.8531 | 33.4 | 62.65209 | 1454.932 |
| 2018 | Qinghai | 20.36887 | 36.3 | 47.28004 | 2335.929 |
| 2018 | Xinjiang | 36.2692 | 46.1 | 252.4538 | 4930.705 |
| 2018 | Xizang | 779.7009 | 64.6 | 50.99961 | 1503.354 |
| 2019 | Qinghai | 19.82962 | 51.2 | 52.19034 | 2226.884 |
| 2019 | Xinjiang | 66.60196 | 48.4 | 302.5644 | 4791.571 |
| 2019 | Xizang | 449.359 | 71 | 43.51599 | 1482.847 |
| 2020 | Qinghai | 21.83389 | 20.4 | 24.00039 | 1925.024 |
| 2020 | Xinjiang | 69.78181 | 35.8 | 85.69409 | 5539.889 |
| 2020 | Xizang | 60.13851 | 40.3 | 31.28687 | 1443.882 |
| 2021 | Qinghai | 19.54331 | 1.1 | 26.58403 | 1924.964 |
| 2021 | Xinjiang | 49.53662 | 2.6 | 112.6706 | 6313.849 |
| 2021 | Xizang | 31.29849 | 40.5 | 31.10829 | 1243.502 |
| Time | Province | Tourism Energy Consumption | Total Tourism Revenue | Total Tourist Arrivals | Tourism Carbon Emissions |
| 2013 | Qinghai | 6.706347 | 158.54 | 1780.43 | 83.15366064 |
| 2013 | Xinjiang | 42.36993 | 673.24 | 5205.73 | 518.9936032 |
| 2013 | Xizang | 3.98358 | 165.18 | 1291.06 | 50.31251704 |
| 2014 | Qinghai | 7.568912 | 197.9398 | 1966.241 | 96.20705619 |
| 2014 | Xinjiang | 40.20763 | 637.3192 | 4855.545 | 502.2106225 |
| 2014 | Xizang | 4.642199 | 199.9986 | 1522.676 | 61.59597731 |
| 2015 | Qinghai | 8.275388 | 239.8054 | 2238.622 | 103.1481578 |
| 2015 | Xinjiang | 35.86189 | 988.1108 | 5895.173 | 475.6933364 |
| 2015 | Xizang | 5.33258 | 272.5716 | 1950.629 | 82.03659188 |
| 2016 | Qinghai | 8.52991 | 294.1299 | 2727 | 111.0212546 |
| 2016 | Xinjiang | 34.31893 | 1327.992 | 7679.322 | 452.5366618 |
| 2016 | Xizang | 6.836879 | 313.5142 | 2195.254 | 109.6151518 |
| 2017 | Qinghai | 9.863441 | 355.9749 | 3250.733 | 128.8450451 |
| 2017 | Xinjiang | 38.9554 | 1699.933 | 10007.4 | 552.9835999 |
| 2017 | Xizang | 9.226823 | 353.9596 | 2389.864 | 156.1685743 |
| 2018 | Qinghai | 10.95374 | 426.1105 | 3842.013 | 146.9986691 |
| 2018 | Xinjiang | 42.66478 | 2357.37 | 13729.92 | 630.2645063 |
| 2018 | Xizang | 11.36157 | 447.8958 | 3078.386 | 193.974802 |
| 2019 | Qinghai | 11.12974 | 498.4757 | 4511.324 | 157.5508053 |
| 2019 | Xinjiang | 40.14508 | 3225.844 | 18941.41 | 574.1691752 |
| 2019 | Xizang | 11.67454 | 496.6552 | 3562.894 | 204.6514083 |
| 2020 | Qinghai | 8.170427 | 251.1937 | 2869.424 | 121.0257347 |
| 2020 | Xinjiang | 24.95944 | 859.5968 | 13699.43 | 377.5939488 |
| 2020 | Xizang | 7.734991 | 317.4752 | 3036.826 | 136.2035988 |
| 2021 | Qinghai | 8.182404 | 300.4483 | 3411.853 | 122.9194625 |
| 2021 | Xinjiang | 27.95653 | 1215.609 | 16363.4 | 401.9828309 |
| 2021 | Xizang | 8.552501 | 379.4459 | 3566.431 | 151.0152524 |
References
- Liang, Q.; Wei, M.; Liang, S.; Xiao, C.; Zhang, W.; Wang, X. Analysis of economic and social effects of ski industry in Xinjiang. J. Glaciol. Geocryol. 2023, 45, 1401–1412. [Google Scholar]
- Qin, D.; Yao, T.; Ding, Y.; Ren, J. Dictionary of Cryospheric Science; China Meteorological Press: Beijing, China, 2016; Volume 12, p. 26. [Google Scholar]
- Kang, Y.; Yang, J.; Ha, L.; Xiao, J. Analysis on the development level and influencing factors of the cryosphere tourism economic zone: Taking the Greater Shangri-La Region as an example. World Reg. Stud. 2022, 31, 1083–1095. [Google Scholar]
- National Development and Reform Commission. “Ice and Snow Sports Development Planning (2016–2025)” Style Scripture No. 645. Website of National Development and Reform Commission. 25 November 2016. Available online: https://www.gov.cn/xinwen/2016-11/25/content_5137611.htm (accessed on 29 December 2023).
- Ministry of Culture and Tourism, National Development and Reform Commission and General Administration of Sport. “Notice of the Action Plan for the Development of Ice and Snow Tourism (2021–2023)” Cultural Tourism Resources No. 12. Website of the Ministry of Culture and Tourism. 8 February 2021. Available online: https://www.gov.cn/zhengce/zhengceku/2021-02/11/content_5586807.htm (accessed on 29 December 2023).
- Stocker, T.F.; Qin, D.; Plattner, G.K.; Tignor, M.M.M.B.; Allen, S.K.; Boschung, J.; Nauels, A.; Xia, Y.; Bex, V.; Midgley, P.M. Contribution of working group I to the fifth assessment report of the intergovernmental panel on climate change. Clim. Change 2013, 5, 1–1552. [Google Scholar]
- Cook, B.I.; Ault, T.R.; Smerdon, J.E. Unprecedented 21st century drought risk in the American Southwest and Central Plains. Sci. Adv. 2015, 1, e1400082. [Google Scholar] [CrossRef] [PubMed]
- Wang, J.; Lu, G.; Zhang, L.; Cao, S.; Lei, T.; Sun, J. Effects of climate change perception on urban residents’ environmentally responsible behavior in ice and snow tourism: A case study of Beijing. Geogr. Res. 2023, 42, 440–457. [Google Scholar]
- Mark, B.G.; Bury, J.; McKenzie, J.M.; French, A.; Baraer, M. Climate change and tropical Andean glacier recession: Evaluating hydrologic changes and livelihood vulnerability in the Cordillera Blanca, Peru. Ann. Assoc. Am. Geogr. 2010, 100, 794–805. [Google Scholar] [CrossRef]
- Wu, G.; Shen, Y. Glaciers tourism resources in China and their development. J. Glaciol. Geocryol. 2007, 29, 664–667. [Google Scholar]
- Demiroglu, O.C.; Dannevig, H.; Aall, C. Climate change acknowledgement and responses of summer (glacier) ski visitors in Norway. Scand. J. Hosp. Tour. 2018, 18, 419–438. [Google Scholar] [CrossRef]
- Zhou, L.; Wang, S.; Sun, Z. World’s glacier tourism: Development history and research progress. J. Glaciol. Geocryol. 2020, 42, 243–253. [Google Scholar]
- Gössling, S.; Higham, J. The low-carbon imperative: Destination management under urgent climate change. J. Travel Res. 2021, 60, 1167–1179. [Google Scholar] [CrossRef]
- Peng, H.; Zhang, J.; Lu, L.; Tang, G.; Yan, B.; Xiao, X.; Han, Y. Eco-efficiency and its determinants at a tourism destination: A case study of Huangshan National Park, China. Tour. Manag. 2017, 60, 201–211. [Google Scholar] [CrossRef]
- Reilly, J.; Williams, P.; Haider, W. Moving towards more eco-efficient tourist transportation to a resort destination: The case of Whistler, British Columbia. Res. Transp. Econ. 2010, 26, 66–73. [Google Scholar] [CrossRef]
- Gössling, S.; Peeters, P.; Ceron, J.-P.; Dubois, G.; Patterson, T.; Richardson, R.B. The eco-efficiency of tourism. Ecol. Econ. 2005, 54, 417–434. [Google Scholar] [CrossRef]
- Yang, G.; Li, P.; Zheng, B.; Zhang, Y. GHG emission-based eco-efficiency study on tourism itinerary products in Shangri-La, Yunnan Province, China. Curr. Issues Tour. 2008, 28, 2207–2219. [Google Scholar] [CrossRef]
- Xiao, J.H.; Yu, A.F.; Wang, M. Carbon footprint evaluation in tours: A case study of Zhoushan lslands. Tour. Sci. 2011, 25, 58–66. [Google Scholar]
- Yao, Z.G.; Chen, T. Tourism eco-efficiency model and an empirical research. Bull. Chin. Acad. Sci. 2015, 25, 113–120. [Google Scholar]
- Liu, J.; Wen, D.; Tong, Y.; Ma, Y. Measuring of tourism eco-efficiency and its comparative research based on carbon emissions. Acta Ecol. Sin. 2019, 39, 1979–1992. [Google Scholar]
- Yao, Z.; Chen, T. A literature review of tourism eco-Efficiency. Tour. Sci. 2016, 30, 74–91. [Google Scholar]
- Lin, W.; Lin, B. Ecological efficiency evaluation and its spatial differences of regional tourism industry: A case of Jiangxi. East China Econ. Manag. 2018, 32, 19–25. [Google Scholar]
- Li, Z.; Wang, D. Temporal and spatial differentiation of tourism economy: Ecological efficiency and its influencing factors in Wuling mountain area. Econ. Geogr. 2020, 40, 233–240. [Google Scholar]
- Guo, L.J.; Li, C.; Peng, H.S.; Zhong, S.E.; Zhang, J.H.; Yu, H. Tourism eco-efficiency at the provincial level in China in the context of energy conservation and emission reduction. Prog. Geogr. 2021, 40, 1284–1297. [Google Scholar] [CrossRef]
- Wang, K.; Shao, H.; Zhou, T.; Liu, H. A study on carbon emissions efficiency of tourism and its spatial correlation characteristics in China. Resour. Environ. Yangtze Basin 2018, 27, 473–482. [Google Scholar]
- Wang, K.; Huang, Z.; Cao, F. Spatial pattern and influencing factors of carbon dioxide emissions efficiency of tourism in China. Acta Ecol. Sin. 2015, 35, 7150–7160. [Google Scholar]
- Kytzia, S.; Walz, A.; Wegmann, M. How can tourism use land more efficiently? A model-based approach to land-use efficiency for tourist destinations. Tour. Manag. 2011, 32, 629–640. [Google Scholar] [CrossRef]
- Wang, Z.; Liu, Q. Spatio-temporal evolution and influencing factors of tourism eco-efficiency in the Yangtze River economic belt. Resour. Environ. Yangtze Basin 2019, 28, 2289–2298. [Google Scholar]
- Neto, J.Q.F.; Walther, G.; Bloemhof, J.; Van Nunen, J.A.E.E.; Spengler, T. A methodology for assessing eco-efficiency in logistics networks. Eur. J. Oper. Res. 2009, 193, 670–682. [Google Scholar] [CrossRef]
- Zha, J.; Yuan, W.; Dai, J.; Tan, T.; He, L. Eco-efficiency, eco-productivity and tourism growth in China: A non-convex met frontier DEA-based decomposition model. J. Sustain. Tour. 2020, 28, 663–685. [Google Scholar] [CrossRef]
- Liu, J.; Ma, Y. The perspective of tourism sustainable development: A review of eco-efficiency of tourism. Tour. Trib. 2017, 32, 47–56. [Google Scholar]
- Wang, S.; Qiao, H.; Feng, J.; Xie, S. The spatio-temporal evolution of tourism eco-efficiency in the Yellow River basin and its interactive response with tourism economy development level. Econ. Geogr. 2020, 40, 81–89. [Google Scholar]
- Wang, L.; Liu, H.; Yong, B.; Song, L.; Li, X. Hydrological processes in land cryosphere: Current status and some perspectives. J. Beijing Norm. Univ. Nat. Sci. 2023, 59, 489–496. [Google Scholar]
- Xiao, C.D.; Wang, S.J.; Qin, D.H. A preliminary study of cryosphere service function and value evaluation. Adv. Clim. Change Res. 2015, 6, 181–187. [Google Scholar] [CrossRef]
- Qin, D.; Ding, Y.; Xiao, C.; Kang, S.; Ren, J.; Yang, J.; Zhang, S. Cryospheric science: Research framework and disciplinary system. Natl. Sci. Rev. 2018, 5, 255–268. [Google Scholar] [CrossRef]
- Xie, P.; Han, C.; Ouyang, Z.; Wang, X. Optimization of snow area discrimination algorithm under different land cover types in Qinghai-Tibet Plateau. J. Glaciol. Geocryol. 2023, 45, 1168–1179. [Google Scholar]
- Ma, J.; Li, R.; Liu, H.; Wu, T.; Xiao, Y.; Du, Y.; Yang, S.; Shi, J.; Qiao, Y. A review on the development of study on hydrothermal characteristics of active layer in permafrost areas in Qinghai-Tibet Plateau. J. Glaciol. Geocryol. 2020, 42, 195–204. [Google Scholar]
- Yang, C.; Zhao, B. An efficiency evaluation on Chinese ice-snow tourism industry based on data envelopment analysis. J. Arid. Land Resour. Environ. 2014, 28, 169–174. [Google Scholar]
- Yang, L.; Cao, K. Spatiotemporal pattern and driving mechanism of tourism ecological security in 85 counties and cities of Xinjiang. Acta Ecol. Sin. 2021, 41, 9239–9252. [Google Scholar]
- Xie, J.; Wang, Z. Threshold effect and its spatial difference of environmental regulation on tourism eco-efficiency in the Yangtze River economic belt. Geogr. Geo-Inf. Sci. 2023, 39, 117–125. [Google Scholar]
- Fang, Y.; Scott, D.; Steiger, R. The impact of climate change on ski resorts in China. Int. J. Biometeorol. 2021, 65, 677–689. [Google Scholar] [CrossRef]
- Moreno-Gené, J.; Sánchez-Pulido, L.; Cristobal-Fransi, E.; Daries, N. The economic sustainability of snow tourism: The case of ski resorts in Austria, France, and Italy. Sustainability 2018, 10, 3012. [Google Scholar] [CrossRef]
- Yang, X.; Qin, D.; Qin, X. Progress in the study of interaction between ice/snow and atmosphere. J. Glaciol. Geocryol. 2012, 34, 392–402. [Google Scholar]
- Deng, G. The exploration of Tibetan traditional culture and tourism development in Tibet: A case study of Nagqu Region. J. Southwest Minzu Univ. Humanit. Soc. Sci. Ed. 2013, 34, 144–147. [Google Scholar]
- Zhang, L. A comparative study of tourism development in multi-ethnic regions: A case study of Xinjiang, Yunnan and Guangxi. Soc. Sci. Xinjiang 2012, 48–52. [Google Scholar]
- Becken, S.; Simmons, D.G.; Frampton, C. Energy use associated with different travel choices. Tour. Manag. 2003, 24, 267–277. [Google Scholar] [CrossRef]
- Perch-Nielsen, S.; Sesartic, A.; Stucki, M. The greenhouse gas intensity of the tourism sector: The case of Switzerland. Environ. Sci. Policy 2010, 13, 131–140. [Google Scholar] [CrossRef]
- Wu, P.; Shi, P. An estimation of energy consumption and CO2 emissions in tourism sector of China. J. Geogr. Sci. 2011, 21, 733–745. [Google Scholar] [CrossRef]
- Wei, Y.; Sun, G.; Ma, L. Estimating the carbon emissions and regional differences of tourism transport in China. J. Shaanxi Norm. Univ. Nat. Sci. Ed. 2012, 40, 76–84. [Google Scholar]
- Tone, K. A slacks-based measure of efficiency in data envelopment analysis. Eur. J. Oper. Res. 2001, 130, 498–509. [Google Scholar] [CrossRef]
- Ministry of Culture and Tourism of the People’s Republic of China. Tourism Sample Survey Data; Tourism Press: China, Switzerland, 2022; pp. 238–266.
- Liu, S.Y.; Yao, X.J.; Guo, W.Q.; Xu, J.; Shangguan, D.; Wei, J.; Bao, W.; Wu, L. The contemporary glaciers in China based on the second Chinese glacier inventory. Acta Geogr. Sin. 2015, 70, 3–16. [Google Scholar]
- Zhao, D.; Zhang, Z.; Zhang, Q. Remote sensing monitoring of Hailuogou Glacier change from 1974 to 2020. J. Glaciol. Geocryol. 2023, 45, 1276–1287. [Google Scholar]
- He, Z.; He, Y.; Yan, Y. Spatial and temporal differences and convergence of efficiency in the eastern coastal urban concentrated areas of China. World Reg. Stud. 2017, 26, 72–83. [Google Scholar]
- Wu, Y.; Shi, F. Research on measurement, spatiotemporal pattern and driving factors of dual circulation development level. Stat. Decis. 2023, 39, 89–94. [Google Scholar]
- Cui, H.; Wang, W.; Yang, X. Sensitivity analysis of the influencing factors on strength of silty clay in seasonally frozen regions. J. Glaciol. Geocryol. 2020, 42, 899–908. [Google Scholar]
- Cai, B.; Zhao, W.; Yang, H. Spatial-temporal pattern and its influencing factors of export-oriented economic development in central China. Resour. Environ. Yangtze Basin 2019, 28, 293–305. [Google Scholar]
- Sheng, Y.X.; Hussain, J. The implication of technological innovation and tourism development on FDI-growth-environment nexus in Association of Southeast Asian countries: A simultaneity modeling analysis. Energy Sources Part B Econ. Plan. Policy 2021, 16, 878–902. [Google Scholar] [CrossRef]
- Tian, H.; Zhao, Q. Evaluation on regional tourism ecological efficiency under high quality development: A case of Shandong province. J. Arid. Land Resour. Environ. 2022, 36, 201–208. [Google Scholar]
- Cai, Z.; You, Q.; Chen, D.; Zhang, R.; Chen, J. Review of changes and impacts of the cryosphere under the background of rapid Arctic warming. J. Glaciol. Geocryol. 2021, 43, 902–916. [Google Scholar]
- Cheng, J.; Lei, J. Spatial-temporal dynamic impact of environmental regulation on the carbon emission efficiency of ecotourism industry in national urban agglomeration. J. Cent. South Univ. For. Technol. 2023, 43, 175–186. [Google Scholar]
- Xu, Y.; Yang, Y.; Guo, J. The paths and effects of environmental regulation on China’s carbon emissions: An empirical study based on Chinese provincial data. Sci. Sci. Manag. S T 2015, 36, 135–146. [Google Scholar]
- Wang, Z.; Wang, Z. A study on spatial-temporal heterogeneity of environmental regulation on tourism eco-efficiency: Taking Yangtze River delta urban agglomeration as an example. Resour. Environ. Yangtze Basin 2022, 31, 750–758. [Google Scholar]
- Liu, R.; He, C. Study on the threshold effect of environmental regulation on income inequality of urban residents. China Soft Sci. 2021, 8, 41–52. [Google Scholar]
- Ma, H.; Lun, Y.; Xi, J. Spatial pattern of China’s tourism economic system mismatch degree and its formation mechanism. Sci. Geogr. Sin. 2018, 38, 1328–1336. [Google Scholar]
- Wang, Z.; Wang, Z. Spatial-temporal evolution and Influencing factors of tourism industry efficiency under the constraints of carbon emission in the Yangtze River economic zone. Resour. Environ. Yangtze Basin 2021, 30, 280–289. [Google Scholar]
- Song, X.; Mi, W.; Li, L. Coupling coordinated process and pattern of tourism economy and ecological environment in desert tourism dominant provinces: A case study of Ningxia, China. J. Desert Res. 2021, 41, 1–10. [Google Scholar]
- Deng, J.; Che, T. Advances in snow simulation for ski resorts. J. Glaciol. Geocryol. 2021, 43, 381–389. [Google Scholar]
- Dawson, J.; Scott, D. Managing for climate change in the alpine ski sector. Tour. Manag. 2013, 35, 244–254. [Google Scholar] [CrossRef]
- Polderman, A.; Haller, A.; Viesi, D.; Tabin, X.; Sala, S.; Giorgi, A.; Darmayan, L.; Rager, J.; Vidovič, J.; Daragon, Q.; et al. How can ski resorts get smart? Transdisciplinary approaches to sustainable winter tourism in the European Alps. Sustainability 2020, 12, 5593. [Google Scholar] [CrossRef]

| Province | Key Development Cities/Districts | Primary Ice and Snow Tourism Resources | Representative Scenic Areas/Activities |
|---|---|---|---|
| Xinjiang | Urumqi, Altay (Keketuohai) | Ski resorts, ice and snow landscape resources, ice and snow festivals, skiing culture exhibitions, etc. | Jiangjun Mountain Ski Resort, Keketuohai Scenic Area, Xinjiang Ice and Snow Tourism Festival, Mapibis Snowboard-Making Skills Exhibition, “Winter Splendor”-themed tourism activities, etc. |
| Qinghai | Haixi Mongolian-Tibetan Autonomous Prefecture, Yushu Tibetan Autonomous Prefecture | Ski resorts, ice and snow landscape resources, ice and snow tourism activities, winter cultural tourism, etc. | Kangle Mountain Resort, Kekexili, Gangshika Snow Mountain, Hexi Ancient Road Ice and Snow, Ice and Snow Light Show, “Winter Tour of Xining” Ice and Snow Fun Tour, Ice and Snow Fireworks Winter Yak Butter Tea, “Forge ahead on a new journey and make contributions in the new era”, and other winter cultural tourism activities. |
| Tibet | Lhasa, Nyingchi | Ice and snow landscape resources, tourist resorts, “Winter Tour of Tibet” product exhibitions and tourism activities, etc. | Nyenchen Tanglha Mountains, Yangbajing “Blue Heaven” and Xiangxiong Meiduo Tourist Resort, Midui Glacier Tourist Area, “Winter Tour of Tibet, Sharing the Third Season of the Earth” activity, “Ice and Snow Wonderland, Warm Winter Health” 2021, “Winter Tour of Tibet” product exhibition, etc. |
| Category | Indicator | Indicator Representation |
|---|---|---|
| Input | Tourism resource input | Number of star-rated hotels |
| Number of travel agencies Glacier area (km2) Glacier area coverage rate (%) Snow depth (cm) Maximum snow days (days) | ||
| Tourism labor input | Number of tourism practitioners (10,000 persons) | |
| Tourism capital input | Fixed asset investment in the tertiary industry (RMB 100 million) | |
| Tourism energy consumption | Tourism energy consumption (PJ) | |
| Expected output | Tourism Income Total tourist arrivals | Total tourism revenue 1 (RMB 100 million) Total tourist arrivals 2 (people) |
| Non-expected output | Tourism carbon emissions | Tourism carbon emissions (10,000 tons) |
| Category | Mode/Activity | Carbon Emission (Unit) | Energy Consumption (Unit) |
|---|---|---|---|
| Transportation | Highway | 132 g/person·km | 1.8 MJ/person·km |
| Railway | 65 g/person·km | 1 MJ/person·km | |
| Civil Aviation | 396 g/person·km | 2 MJ/person·km | |
| Other | 66 g/person·km | 0.9 MJ/person·km | |
| Accommodation | General | 2.458 g/person·day | 155 MJ/person·day |
| Activities | Sightseeing | 417 g/person | 8.5 MJ/person |
| Leisure Vacation | 1670 g/person | 26.5 MJ/person | |
| Business Trip | 786 g/person | 16.0 MJ/person | |
| Visiting Friends/Family | 591 g/person | 12.0 MJ/person | |
| Other | 172 g/person | 3.5 MJ/person |
| Year | Xinjiang | Qinghai | Tibet | Average |
|---|---|---|---|---|
| 2013 | 0.2559 | 0.2578 | 0.2344 | 0.2494 |
| 2014 | 0.2418 | 0.2389 | 0.2477 | 0.2428 |
| 2015 | 0.2831 | 0.2714 | 0.2484 | 0.2676 |
| 2016 | 0.4291 | 0.3907 | 0.2556 | 0.3585 |
| 2017 | 1.0848 | 0.3798 | 0.2208 | 0.5618 |
| 2018 | 1.0380 | 0.3787 | 0.2732 | 0.5633 |
| 2019 | 1.2793 | 0.4335 | 0.5726 | 0.7618 |
| 2020 | 1.0112 | 0.3339 | 0.3538 | 0.5663 |
| 2021 | 1.6229 | 1.0051 | 1.0148 | 1.2142 |
| Average | 0.8051 | 0.4100 | 0.3801 | 0.5317 |
| Growth Rate (%) | 0.1854 | 0.1148 | 0.1671 | 0.1474 |
| 95% confidence interval | (−12.11, 80.72) | (−30.12, 90.03) | (−28.20, 97.50) | (−8.61, 64.23) |
| Year | ML | PET | SE | TC | Average |
|---|---|---|---|---|---|
| 2013–2014 | 1.0130 | 1.1776 | 1.0047 | 0.8915 | 1.0217 |
| 2014–2015 | 1.0820 | 0.9538 | 1.0015 | 1.1517 | 1.0472 |
| 2015–2016 | 1.1168 | 1.0208 | 0.9305 | 1.1831 | 1.0628 |
| 2016–2017 | 0.9958 | 0.9905 | 1.0046 | 0.9963 | 0.9968 |
| 2017–2018 | 1.1230 | 1.0028 | 0.8440 | 1.5490 | 1.1297 |
| 2018–2019 | 1.6378 | 0.9064 | 1.4820 | 1.1721 | 1.2996 |
| 2019–2020 | 0.8973 | 0.7304 | 1.5809 | 0.9546 | 1.0408 |
| 2020–2021 | 1.8578 | 2.0222 | 0.7560 | 1.7599 | 1.5990 |
| Average | 1.2154 | 1.1006 | 1.0755 | 1.2073 | 1.1497 |
| Province | Resource Endowment | Carbon Emission Structure | Economic Development Level | Infrastructure | Environmental Regulation | Technological Investment Intensity | Industrial Structure |
|---|---|---|---|---|---|---|---|
| Xinjiang | 0.6271 | 0.6789 | 0.6751 | 0.6751 | 0.5997 | 0.6782 | 0.7210 |
| Qinghai | 0.7308 | 0.8152 | 0.8123 | 0.7953 | 0.7226 | 0.7944 | 0.6996 |
| Tibet | 0.7890 | 0.8454 | 0.8165 | 0.8315 | 0.6840 | 0.8027 | 0.8050 |
| Average | 0.7156 | 0.7798 | 0.7680 | 0.7673 | 0.6688 | 0.7584 | 0.7419 |
Disclaimer/Publisher’s Note: The statements, opinions and data contained in all publications are solely those of the individual author(s) and contributor(s) and not of MDPI and/or the editor(s). MDPI and/or the editor(s) disclaim responsibility for any injury to people or property resulting from any ideas, methods, instructions or products referred to in the content. |
© 2024 by the authors. Licensee MDPI, Basel, Switzerland. This article is an open access article distributed under the terms and conditions of the Creative Commons Attribution (CC BY) license (https://creativecommons.org/licenses/by/4.0/).
Share and Cite
Wu, Y.; He, F.; Sun, Z.; Wang, Y. Measurement of Tourism Ecological Efficiency and Analysis of Influencing Factors under the Background of Climate Change: A Case Study of Three Provinces in China’s Cryosphere. Sustainability 2024, 16, 6085. https://doi.org/10.3390/su16146085
Wu Y, He F, Sun Z, Wang Y. Measurement of Tourism Ecological Efficiency and Analysis of Influencing Factors under the Background of Climate Change: A Case Study of Three Provinces in China’s Cryosphere. Sustainability. 2024; 16(14):6085. https://doi.org/10.3390/su16146085
Chicago/Turabian StyleWu, Yubin, Feiyang He, Zhujun Sun, and Yongyu Wang. 2024. "Measurement of Tourism Ecological Efficiency and Analysis of Influencing Factors under the Background of Climate Change: A Case Study of Three Provinces in China’s Cryosphere" Sustainability 16, no. 14: 6085. https://doi.org/10.3390/su16146085
APA StyleWu, Y., He, F., Sun, Z., & Wang, Y. (2024). Measurement of Tourism Ecological Efficiency and Analysis of Influencing Factors under the Background of Climate Change: A Case Study of Three Provinces in China’s Cryosphere. Sustainability, 16(14), 6085. https://doi.org/10.3390/su16146085