Article

Prediction of the Potentially Suitable Areas of Actinidia latifolia in China Based on Climate Change Using the Optimized MaxEnt Model

1
Hubei Key Laboratory of Germplasm Innovation and Utilization of Fruit Trees, Institute of Fruit and Tea, Hubei Academy of Agricultural Sciences, Wuhan 430064, China
2
College of Horticulture and Gardening, Yangtze University, Jingzhou 434023, China
*
Authors to whom correspondence should be addressed.
Sustainability 2024, 16(14), 5975; https://doi.org/10.3390/su16145975
Submission received: 28 May 2024 / Revised: 22 June 2024 / Accepted: 10 July 2024 / Published: 12 July 2024

Abstract

:
Actinidia latifolia, with the highest vitamin C content in its genus, is a unique wild relative of kiwifruit that could be important for genetic breeding research. Climate change significantly influences the distribution range of wild plants. Accurately assessing the potential distribution of wild kiwifruit and its response to climate change is crucial for the effective protection and sustainable utilization of its germplasm resources. In this study, we utilized the optimized MaxEnt model to predict the potential habitats of A. latifolia in China, employing the jackknife test to assess the importance of environmental variables in our modeling process. The results showed that annual precipitation (Bio12) and temperature annual range (Bio7) emerged as the most influential environmental variables affecting the distribution of this kiwifruit wild relative. As radiative forcing and time increase, the potential habitats of A. latifolia in China are projected to shrink southward, thereby exacerbating habitat fragmentation. This research offers significant scientific references for the investigation, protection, cultivation, and application of wild relatives of the kiwifruit.

1. Introduction

Climate change is widely acknowledged as one of the greatest threats to global biodiversity in the 21st century [1]. The Intergovernmental Panel on Climate Change’s (IPCC) Sixth Assessment Report reveals that since the 1970s, global average surface temperatures have risen at an unprecedented rate [2]. In this context, studies have shown that the rate of warming in China has marginally exceeded the global average over the past century. This phenomenon has led to modifications in the suitable distribution range of certain species, resulting in habitat fragmentation and a subsequent rapid decline in biodiversity [3,4]. Furthermore, there is a close relationship between agricultural productivity and ecological and climatic factors. The appropriateness of current agricultural locations may vary due to climate change, potentially affecting crop growth, development, and yield [5,6]. Therefore, projections of crop distribution [7,8,9] and the distribution of wild crop relatives [10,11], in conjunction with their anticipated migration patterns due to climate change, can provide scientific support for strategic planning related to crop introduction, domestication, enhancement, conservation, and utilization in future agricultural production.
The MaxEnt model has emerged as the most widely used model for analyzing species distribution patterns [12,13]. This species distribution model employs an effective algorithm to predict possible patterns of species distribution and their responses to climate change by leveraging environmental parameters and previously collected distribution data [14]. This modeling approach boasts rapid computational speed, adaptability, and intuitive visualization of prediction outcomes. Furthermore, the MaxEnt model offers a significant advantage in maintaining high accuracy and stability in simulation results, even when data on partial species are limited or the sample size is small [14]. Consequently, the MaxEnt model has found extensive application across various disciplines, including biogeography, ecology, evolution, and species conservation [15,16]. It is also commonly used to predict the potential geographical distribution of economic crops and their wild relatives [12,13].
Actinidia Lindl., commonly known as kiwifruit, is a perennial deciduous fruit crop that is extensively found in East Asia [17]. This diverse genus comprises approximately 54 species [18], exhibiting a wide range of genetic and morphological variations. Their fruits are highly esteemed by consumers due to their high vitamin C content and balanced nutrition that includes dietary fiber, various minerals, and other metabolites [19,20]. Despite being among the most successfully cultivated wild fruit crops of the last century, its brief history of domestication has led to a primary focus on Actinidia chinensis, Actinidia eriantha, and Actinidia arguta in breeding [21,22]. Many wild relatives of this genus have not been explored for domestication yet, such as Actinidia latifolia (A. latifolia).
A. latifolia, a species with a broad distribution ranging from southern China to Sumatra and Borneo, is recognized as one of the most distinctive within the Actinidia genus [23]. This species typically has the greatest number of fruiting infructescences (up to thirty) and the highest fruit vitamin C content among the 54 species of the same genus [22,24]. This vitamin C content was found to be ten times higher than the varieties currently commercially cultivated (e.g., Actinidia chinensis and Actinidia deliciosa) [25,26]. As a wild relative with significant breeding value for kiwifruit, A. latifolia has garnered increasing attention. Therefore, recent research in the genomics [23,27,28] and molecular biology [24,29,30] of A. latifolia has achieved a series of breakthroughs and progress. As a wild relative of kiwifruit, A. latifolia will provide more opportunities for germplasm innovation in kiwifruit breeding, including improving nutrition, increasing yield, and expanding suitable planting areas [23]. The genus Actinidia has been the subject of extensive research for predicting suitable distribution areas, intending to guide the development and utilization of germplasm resources [31,32,33]. However, these studies have not encompassed A. latifolia. Therefore, it is crucial to understand the habitat range of A. latifolia and its adaptive responses to climate change to ensure the conservation and sustainable use of its wild resources. This study employed the optimized MaxEnt model to achieve three research objectives. Firstly, it sought to predict the potential habitat distribution range for A. latifolia under current climate scenarios and subsequently classify it into four suitability grades. Secondly, this study investigated the correlation between the predicted potential habitat of A. latifolia and key environmental factors. Finally, it projected and compared the potential distribution range and change trends of A. latifolia under varying climate scenarios for the 2050s and 2090s. This study will provide a theoretical basis for the introduction, cultivation, conservation, and rational use of this wild relative of kiwifruit.

2. Materials and Methods

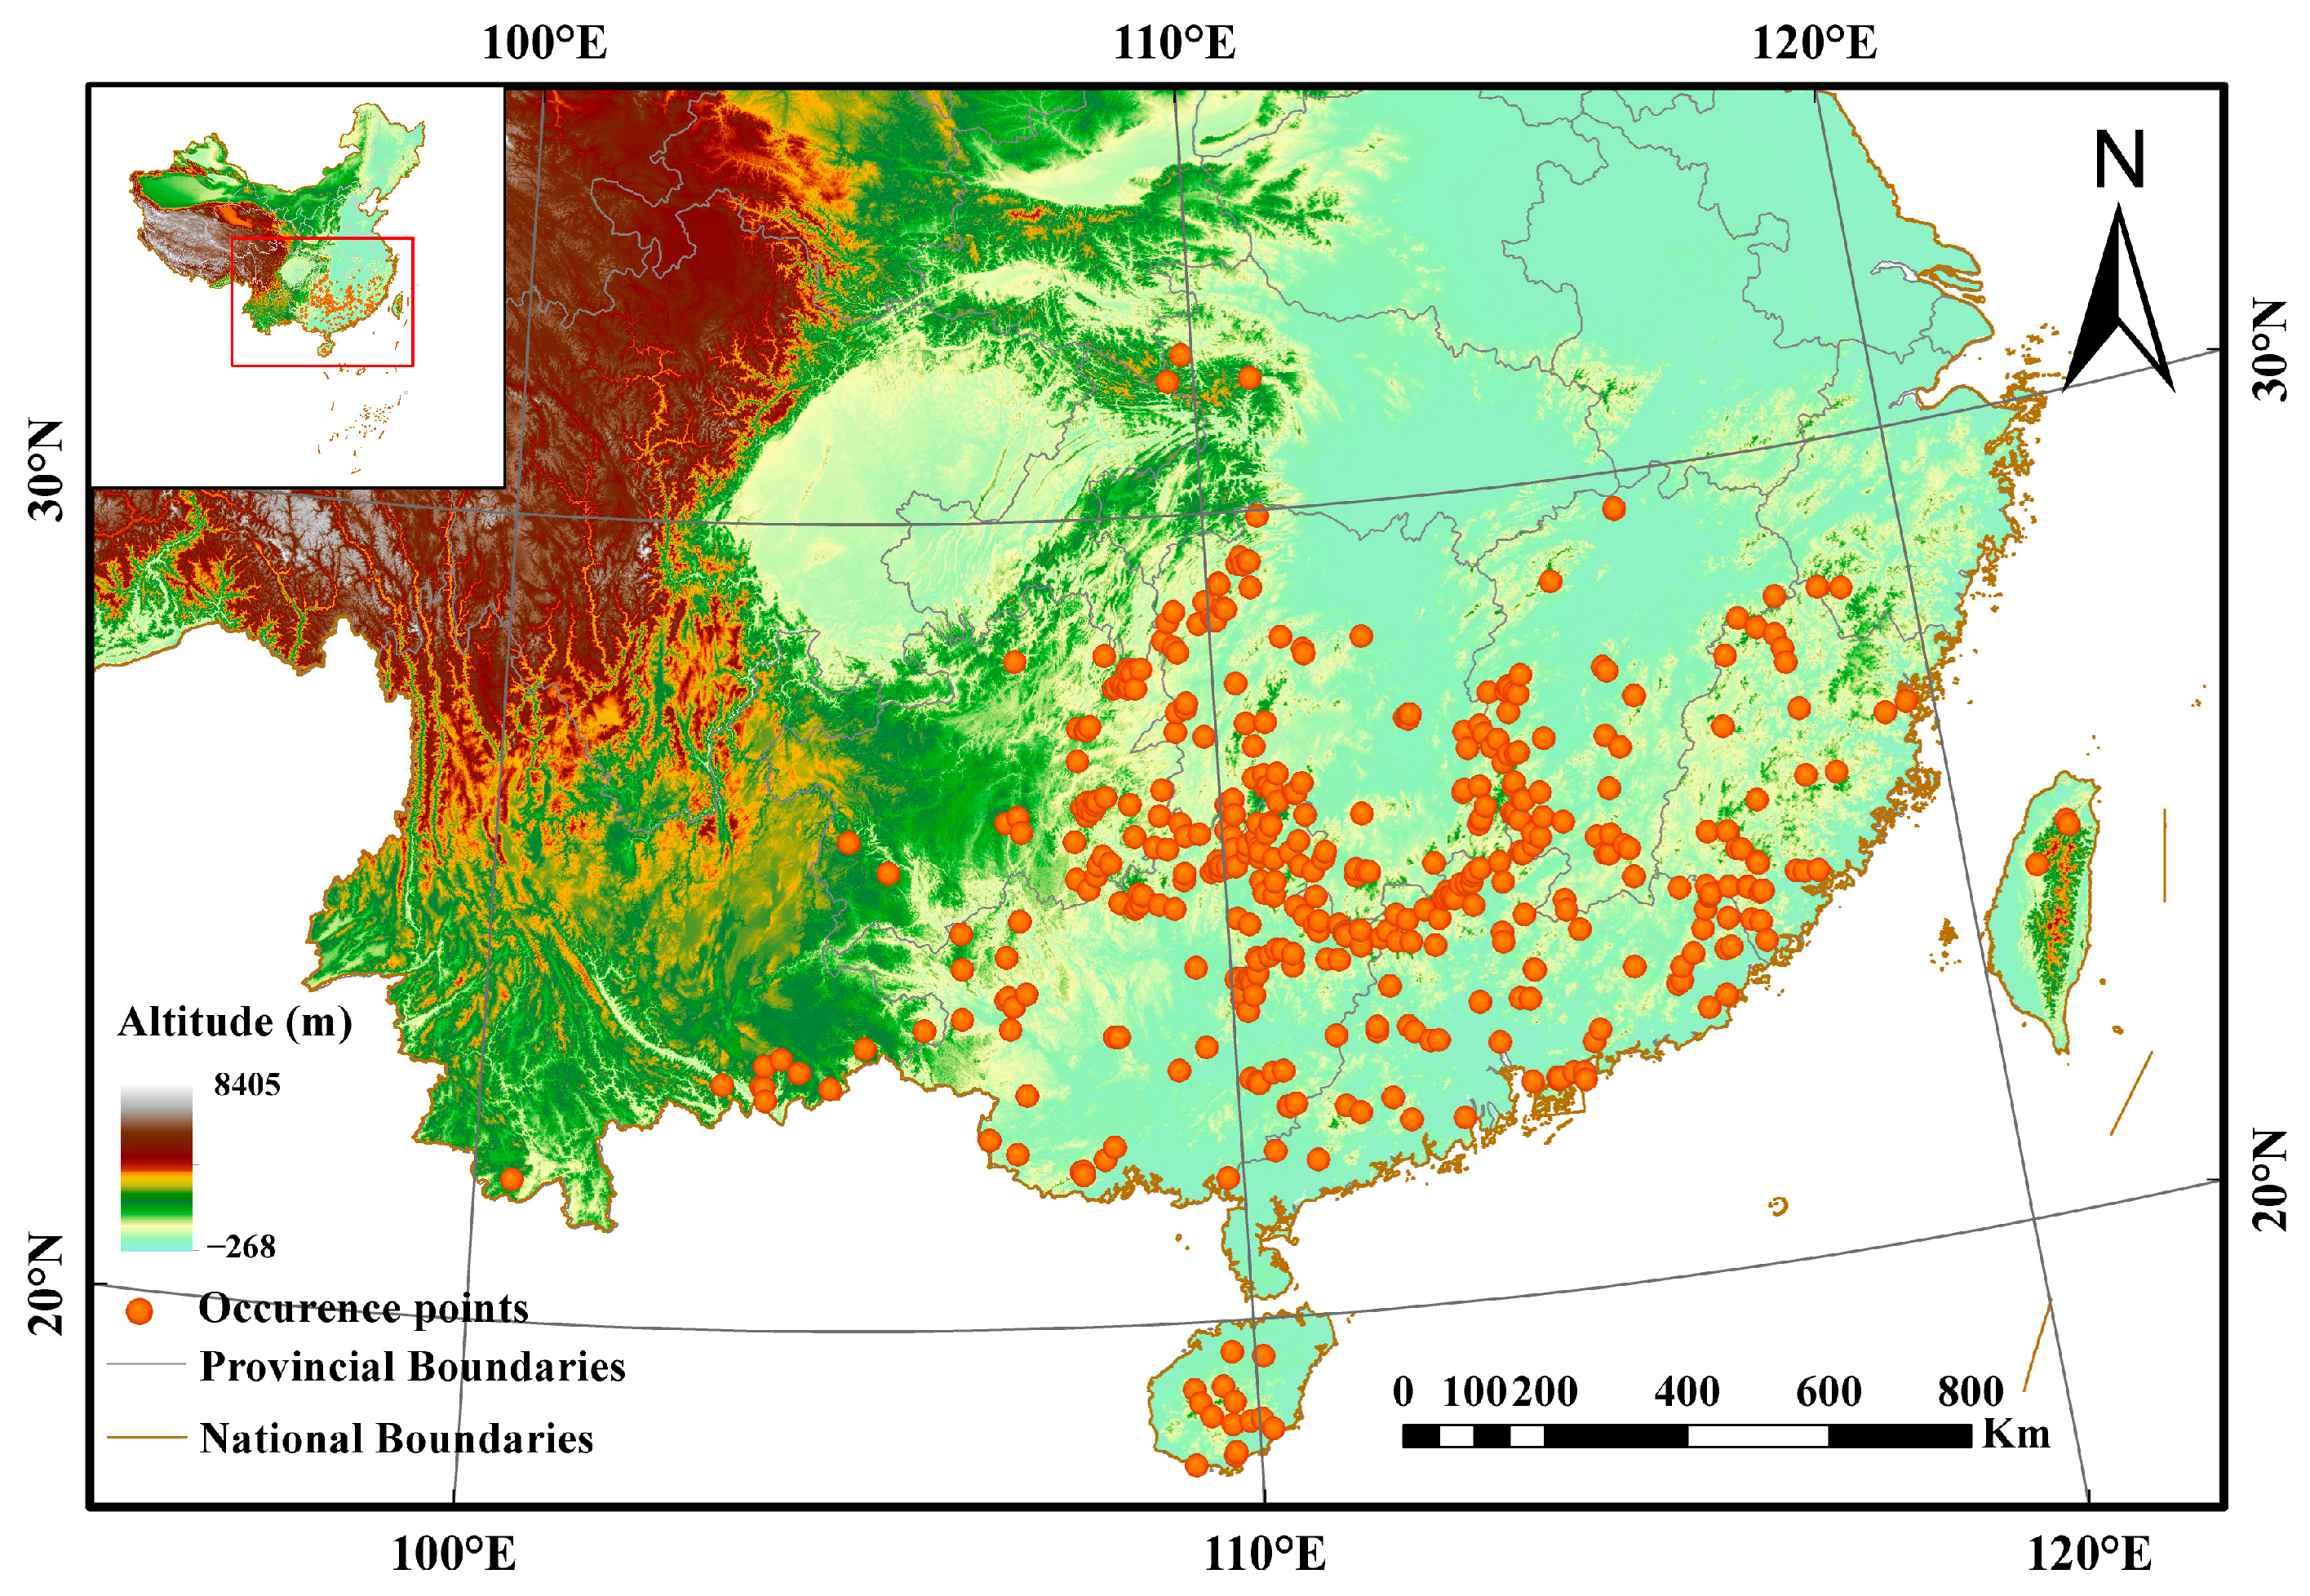
2.1. Occurrence Data

We obtained 1613 distribution records of A. latifolia in China by searching the Chinese Virtual Herbarium (https://www.cvh.org.cn, accessed on 19 August 2023) and Global Biodiversity Information Facility (GBIF, http://www.gbif.org, accessed on 19 August 2023). Then, we checked whether the coordinate information was consistent with the distribution information to eliminate redundant and uncertain data. To mitigate the risk of overfitting caused by closely situated distribution points and enhance prediction accuracy, we eliminated spatial autocorrelation points utilizing ArcGIS SDMtoolbox v2.6 [34,35] to prevent bias. Finally, we obtained 433 valid latitude and longitude coordinates for A. latifolia that were correctly converted into decimal numbers for inclusion in the dataset (Figure 1), which were then stored in a CSV file for model execution.

2.2. Environment Variables

In this study, we utilized 19 bioclimatic variables and elevation variables at a resolution of 2.5′ (5 km × 5 km), sourced from the World Climate Database (https://www.worldclim.org, accessed on 19 August 2023). These variables encompassed the current period (1970–2000) as well as two future timeframes: the 2050s and the 2090s. The bioclimatic factors for the forthcoming period encompass four distinct climate change scenarios, namely SSP1-2.6, SSP2-4.5, SSP3-7.0, and SSP5-8.5. These scenarios symbolize sustainable development, moderate development, local development, and normal development conditions, respectively [36]. The General Circulation Model (GCM) developed by the Beijing Climate Center Climate System Model 2 Medium Resolution (BCC-CSM2-MR) of China has been recognized as suitable for assessing climate change in China [37,38]. Consequently, it has been employed to generate bioclimatic data pertinent to future periods [39]. CMIP6 comprehensively addresses the limitations of CMIP5 by considering both shared socioeconomic scenarios and land use. It does so by providing a more scientifically accurate and comprehensive depiction of potential future climate changes, as opposed to CMIP5’s sole focus on radiative forcing targets and carbon dioxide concentrations [40,41].
In addition, we downloaded nine soil variables from the Soil Subcenter, National Earth System Science Data Center, National Science and Technology Infrastructure of China (http://soil.geodata.cn, accessed on 19 August 2021), with a resolution of 2.5′ [42]. We procured the 1:400,000 scale map of China from the National Basic Geographic Information System (https://nfgis.nsdi.gov.cn, accessed on 19 August 2021) and utilized it as the foundational cartographic datum.
We utilized ArcGIS v.10.7 (ESRI, Redlands, CA, USA, www.esri.com, accessed on 19 August 2021) to gather distribution point information across all 29 environmental layers (Table S1). To mitigate the effects of collinearity, Pearson’s correlation analysis was conducted on the environmental variables. Environmental variables with the lowest correlation coefficients (below 0.75) and significant ecological or physiological effects were selected. The jackknife method was employed to evaluate the environmental factor significance, eliminating factors with insignificant contributions (less than 1%) [43]. Ultimately, 14 major environmental factors (Table 1) were chosen for the subsequent analysis of simulations.

2.3. Optimization and Evaluation of Model

The regularization multiplier (RM) and feature combination (FC) of the MaxEent model were optimized using the ENMeval package [44] in R v4.1.3 (R Core Team. 2022.). The MaxEnt model currently exhibits five distinct characteristics: the linear feature (L), quadratic feature (Q), the hinge feature (H), the product feature (P), and the threshold feature (T). The RM was systematically set to a range of 0.5–6, with each value incremented by 0.5. The six feature combinations L, H, LQ, LQH, LQHP, and LQHPT were used in this procedure.
To evaluate the model performance, 75% of the occurrence data of A. latifolia was used for training and the remaining 25% for testing [45]. To improve the predictive ability of the model, a maximum number of background points was set to 1000, while other parameters were set to default values. The four parameters AUC.diff, OR10, delta, AICc, and AUC were mainly used in this study to evaluate the selected analytical models. AUC.diff is the difference between the test set and training set AUC values at an omission rate of 10% (OR10). The fit of the model to species distribution points was evaluated using this rate. The combination of parameter values equal to 0 was found to be best when evaluating model complexity using the Akaike Information Criterion (delta. AICc) [44,46]. The receiver operating characteristic curve (ROC) shows that omission error and sensitivity are complementary. An independent threshold-free indicator, the area under the receiver operating characteristic curve (AUC), ranges from 0 to 1. Failure (0.5–0.6), poor (0.6–0.7), fair (0.7–0.8), good (0.8–0.9), and excellent (0.9–1.0) are different categories for AUC criteria [47].

2.4. Potential Distribution Ranges and Centroid Shifts for A. latifolia

The MaxEnt-generated ASC files were imported into ArcGIS 10.7 (ESRI, Redlands, CA, USA, www.esri.com, accessed on 19 August 2021) for visualization and analysis. The data were converted to gridded format and overlaid onto a detailed administrative zoning map of China for further analysis. To achieve a more optimal visualization analysis, binary presence/absence maps were created from the continuous predictions made by MaxEnt using the Maximum Training Sensitivity Plus Specificity Logistic Threshold (MTSS) method, which is thought to be the best course of action when there are only presence records with sparse data [48,49]. The habitat classified as A. latifolia was divided into four categories based on these values: low suitable habitat (MTSS–0.45), moderately suitable habitat (0.45–0.65), highly suitable habitat (0.65–1.0), and unsuitable habitat (0–MTSS).
SDMtoolbox v2.6 was utilized to assess the impact of environmental change on the potential distribution range of A. latifolia [34,35]. This program condenses the suitable habitat of A. latifolia into a singular focal point, generating a vector file displaying directional and magnitude shifts over time [35,50]. Ultimately, we analyzed the changes in distribution by following the evolution of the centroid through time under diverse climate scenarios.

3. Results

3.1. Model Optimization and Environmental Variables

A total of 433 records of occurrence locations and 14 environmental factors were utilized in the prediction of A. latifolia potential distribution in China using MaxEnt. The optimal combination of characteristics (the parameter RM was 1.5, FC was LQHPT) was selected based on the minimum AICc value (Figure S2). The model performed better than the default settings when the model’s parameters were adjusted (Table 2). As shown in Figure 2, the improved MaxEnt’s mean AUC value was 0.951 ± 0.008. It was determined that the prediction’s accuracy for the present and future periods was “excellent.”.
Among the 14 environmental variables (Table 1), mean diurnal range (Bio2), temperature annual range (Bio7), annual precipitation (Bio12), and precipitation of the driest quarter (Bio17) had greater impacts on potential areas that would be suitable for A. latifolia. The cumulative permutation importance and cumulative percentage contribution of these four environmental factors under investigation were found to be 67.97% and 93.81%, respectively. According to the jackknife test (Figure S3), among all single environmental variables, Bio12, Bio17, precipitation of driest month (Bio14), Bio2, topsoil pH (pH), and Bio7 had the highest regularized training gain. The findings indicated that these environmental variables offered a more precise depiction of A. latifolia distribution than other environmental factors and exerted a more significant influence on its distribution (Figure S3). The comprehensive results from the aforementioned analysis indicate that under current climatic conditions, Bio2, Bio7, Bio12, and Bio17 were the most significant climate variables affecting the suitable habitat range of A. latifolia. The factors with the greatest influence were temperature and precipitation. On the other hand, the distribution of A. latifolia in China was largely unaffected by topography and soil.
In order to elucidate the climatic attributes of A. latifolia, we forecasted a potentially suitable region based on prevailing climate conditions. We also conducted an in-depth analysis of response curves for four environmental factors that significantly influenced the geographical distribution of A. latifolia. The response curve showed how the predicted probability of occurrence changed as each environmental variable was changed (Figure 3). A probability value greater than or equal to the MTSS indicated that the environment was suitable for the growth of A. latifolia. Thus, the appropriate range for temperature annual range (Bio7) was less than 31.02 °C, the appropriate range for mean diurnal range (Bio2) was less than 13.94 °C, the appropriate range for annual precipitation (Bio12) was 35.35–3777.45 mm, and the appropriate range for precipitation of the driest quarter (Bio17) was greater than 37.67 mm.

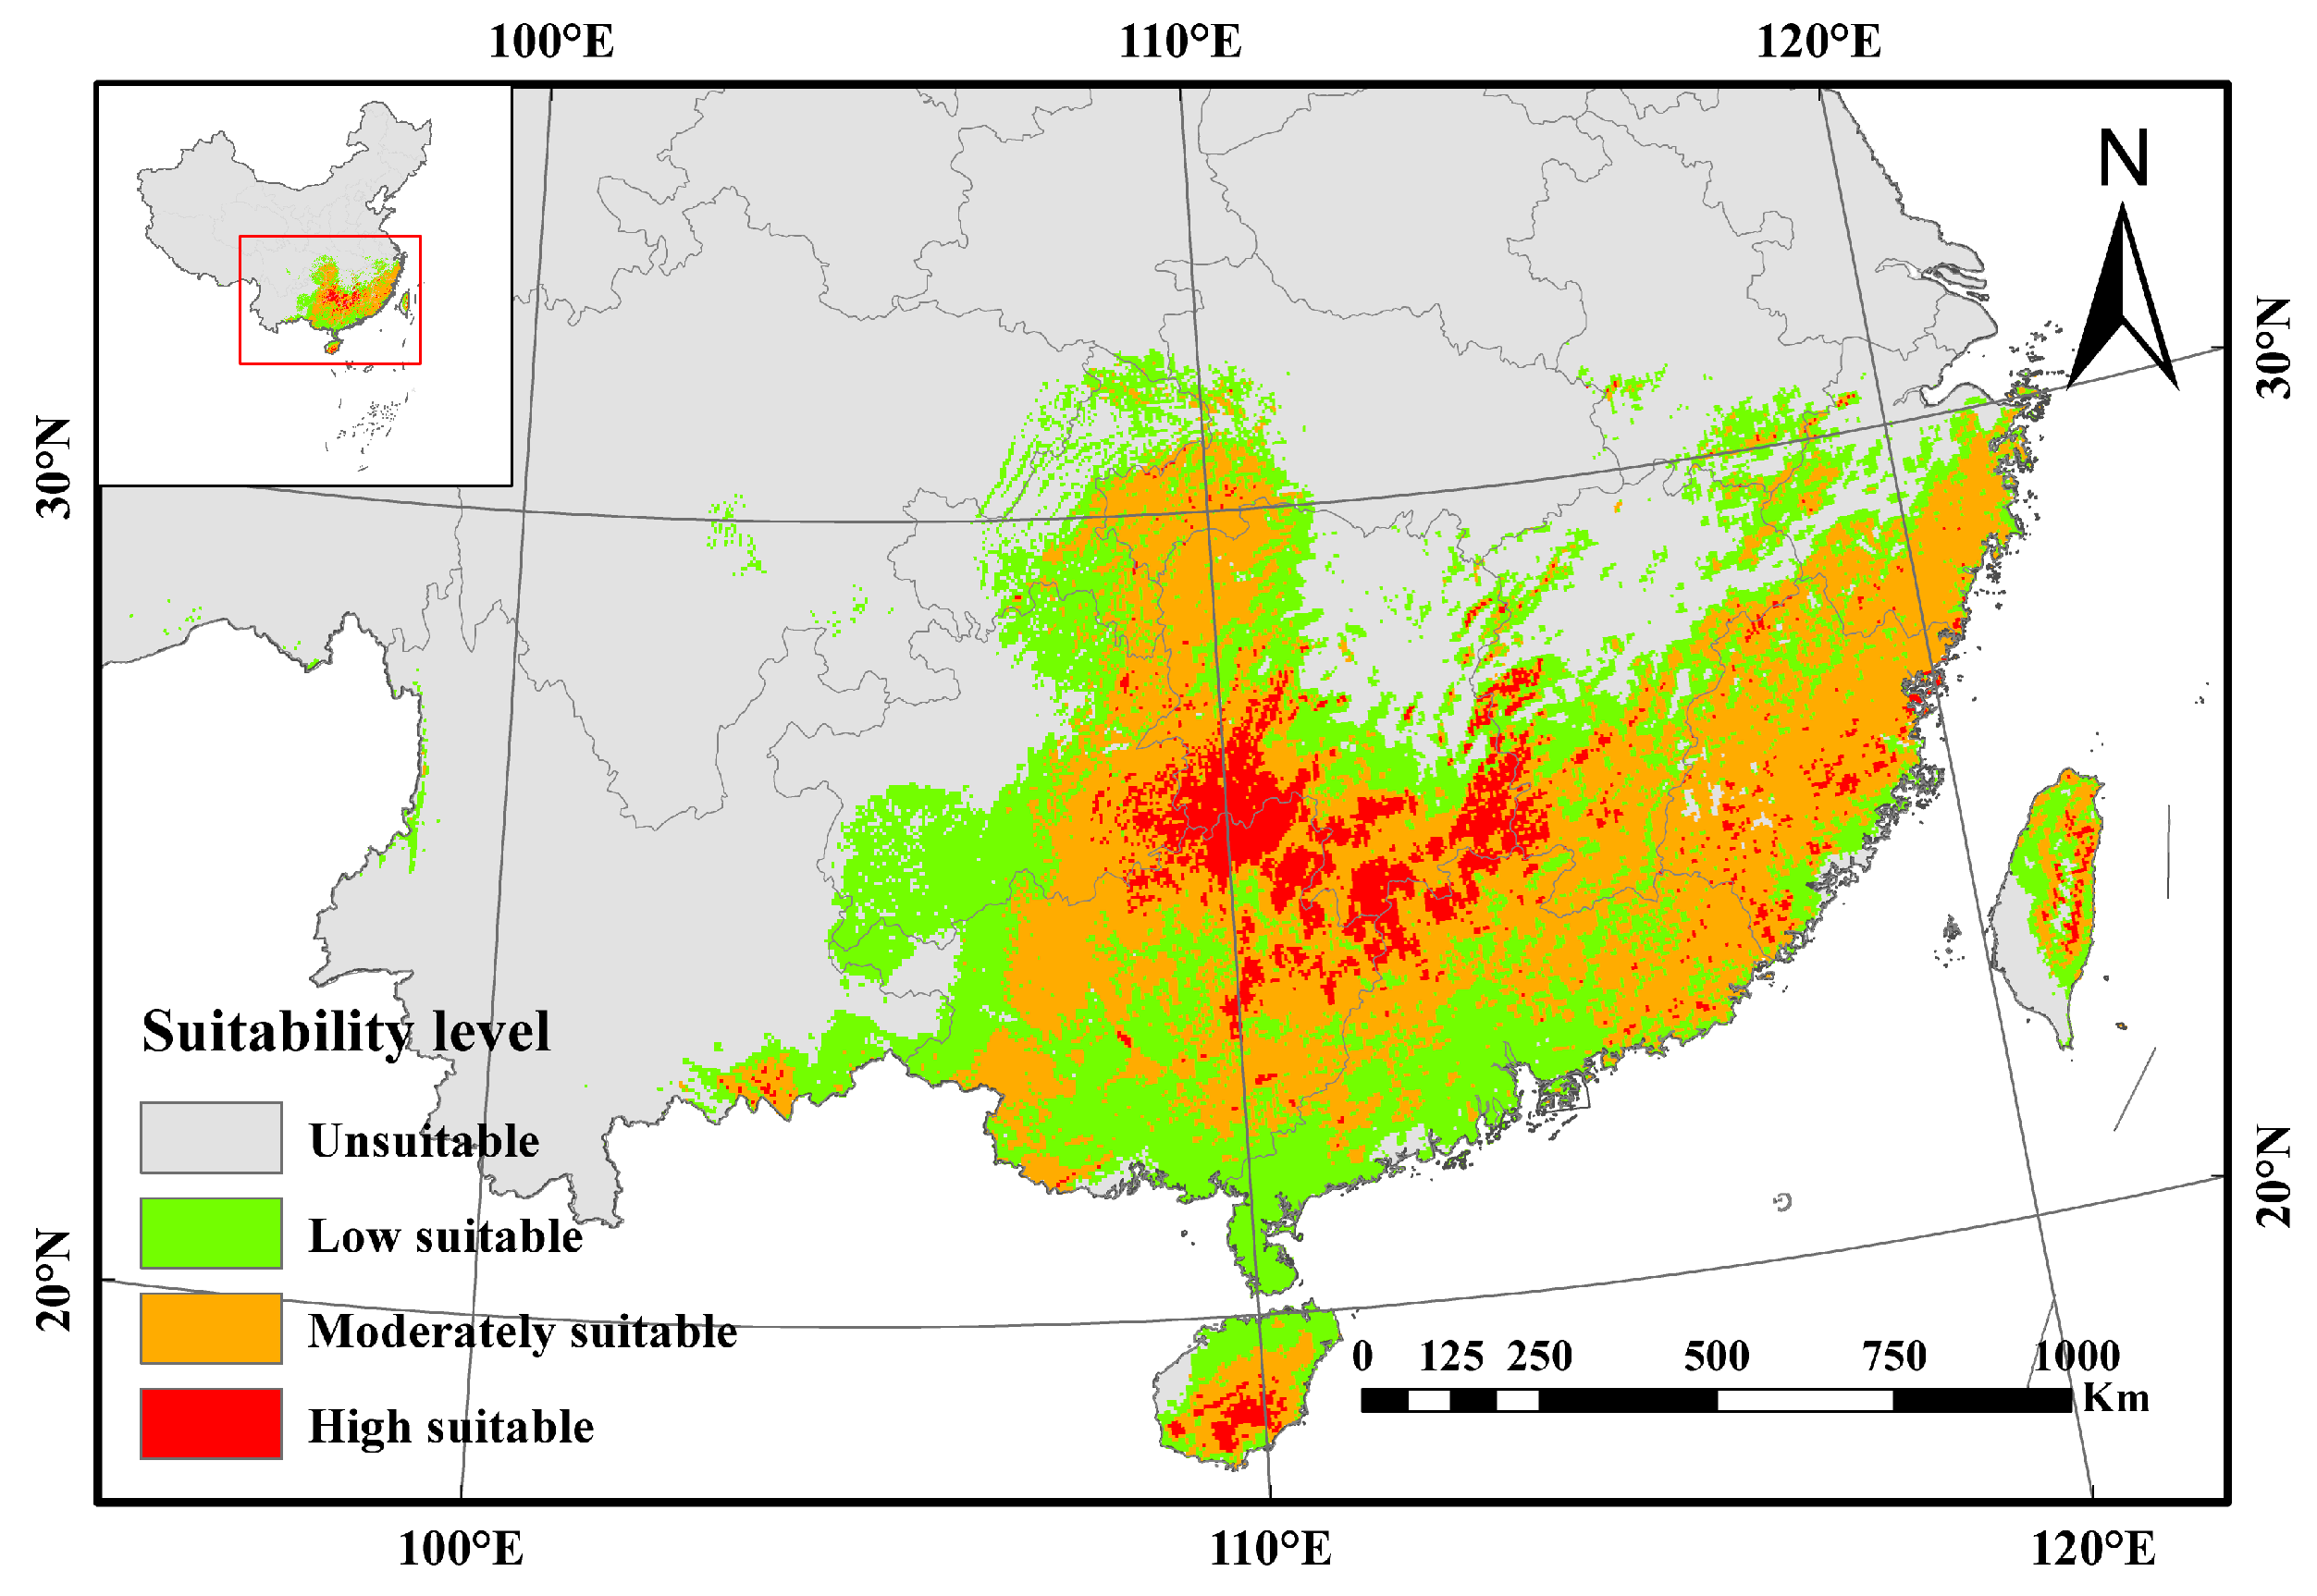
3.2. Current Potentially Suitable Areas of A. latifolia in China

Under the current climatic scenarios, the potentially suitable habitat for A. latifolia was predominantly located in southern China. The aggregate suitable area for A. latifolia measures 116.57 × 10⁴ km2, representing approximately 12.66% of China’s total land area. The results showed that the highly suitable, moderately suitable, and barely suitable areas were 9.69 × 10⁴ km2, 55.42 × 10⁴ km2, and 51.46 × 10⁴ km2, accounting for 8.32%, 47.54%, and 44.14% of the total suitable area, respectively (Figure 4). The optimal habitats for A. latifolia are primarily located in the Xuefeng Mountains, Luoxiao Mountains, Nanling Mountains, and the elevated mountainous regions of Hainan and Taiwan. In addition, the hilly regions of Zhejiang and Fujian in the southeast also have sporadic distribution of highly suitable areas simultaneously. Areas of moderate suitability for A. latifolia were predominantly located in close proximity to areas of high suitability, constituting 6.02% of the total land area in China. The low suitability areas of A. latifolia were mostly located at the edge of high or moderate suitability areas. These included southern Anhui, central Zhejiang, central Jiangxi, southwestern Hunan, northeastern Chongqing, southern Guangxi, southern Guangdong, northern Hainan, north-central Taiwan, and the eastern Yunnan-Guizhou plateau. Collectively, these areas make up 5.59% of the total land area of China.

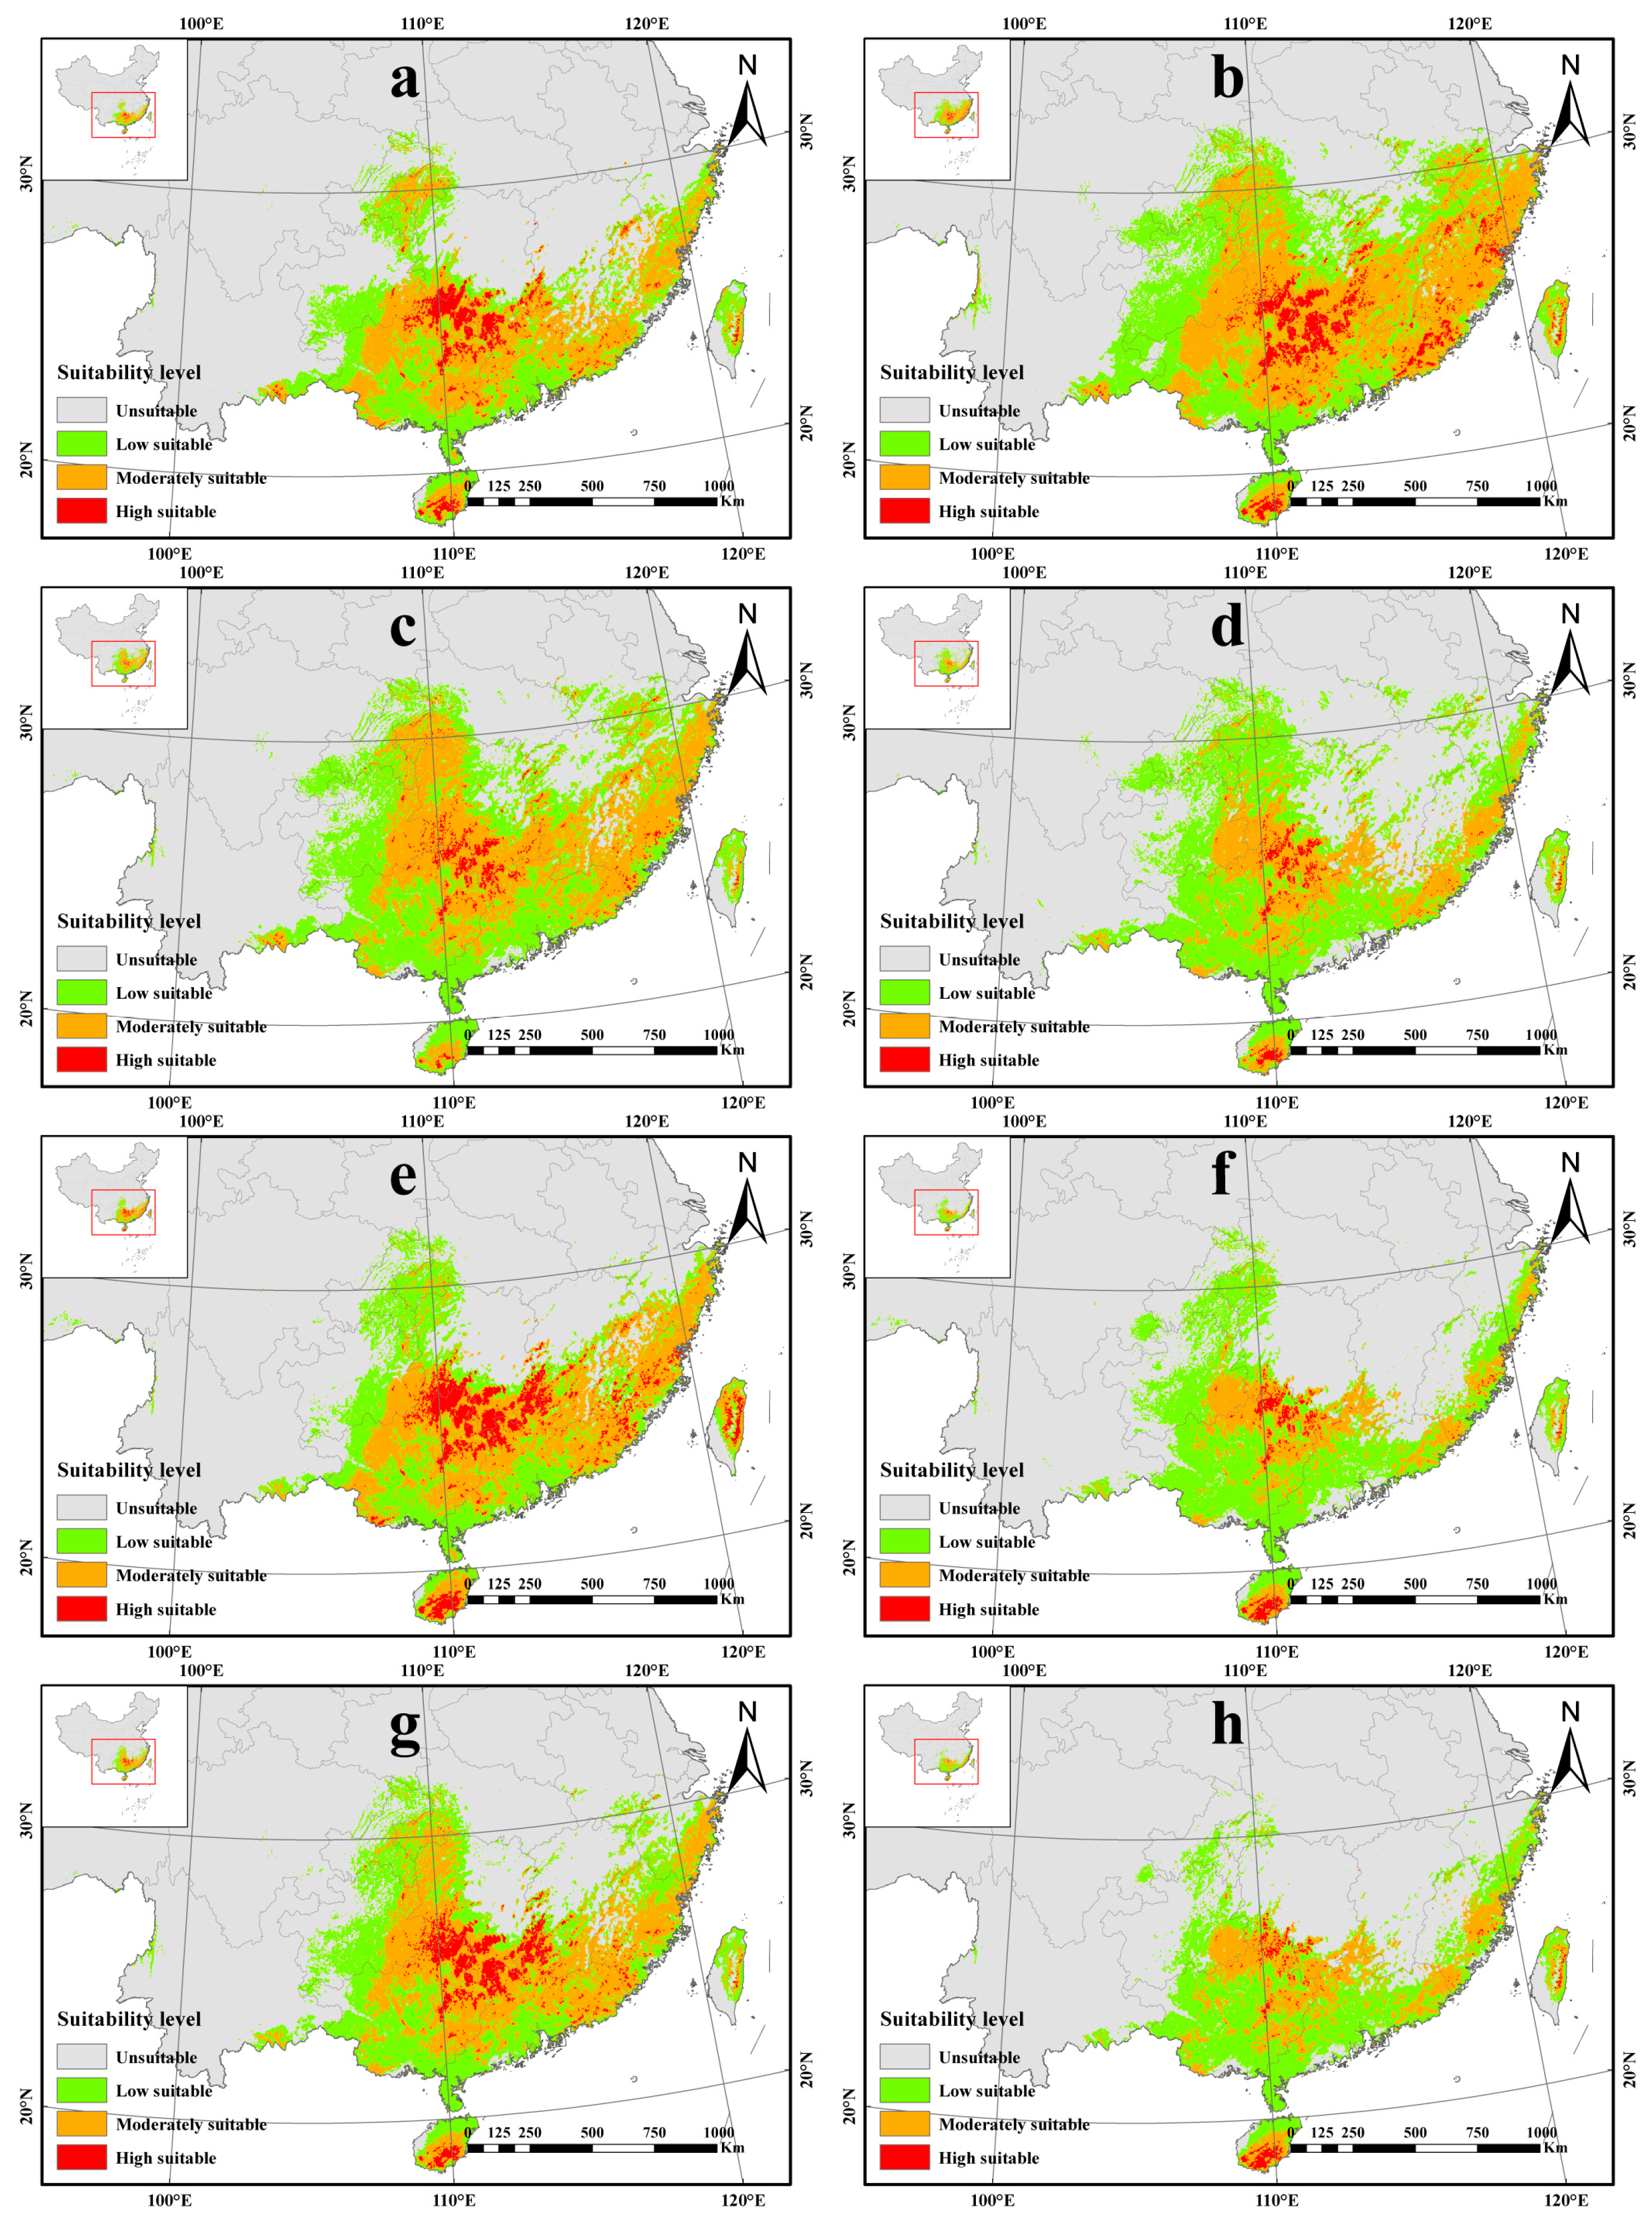
3.3. Future Potentially Suitable Areas of A. latifolia in China

With the aforementioned criteria, the optimized MaxEnt model also predicted A. latifolia distributions in the 2050s and 2090s for scenarios SSP1-2.6, SSP2-4.5, SSP3-7.0, and SSP5-8.0. The findings presented herein were derived from the following: the proportion of each suitable habitat (Table 3), the fluctuation in the area of suitability (Table S2), the geographical distribution map of prospective potential suitable regions for A. latifolia (Figure 5), and the dynamic map illustrating changes in habitat suitability (Figure 6).
In the context of the four climatic scenarios projected for the 2050s and 2090s, the location and extent of suitable regions for each A. latifolia class exhibited varying degrees of variability (Table 3). Depending on the climate scenario, the area of suitable habitats showed three trends over time: decreasing and then increasing, increasing and then decreasing, and decreasing all the time, respectively. For the same period, the areas of potentially suitable areas showed two trends with increasing radiation forcing: decreasing then increasing then decreasing and increasing then decreasing, respectively. In general, the suitable habitat for A. latifolia is expected to progressively diminish and become fragmented as time and radiation forcing increase. It is worth noting that although the extent of highly and moderately suitable habitats tends to decrease more frequently, the total extent of low suitable habitats tends to increase during the same period, although some of the original low suitable areas will be lost (Figure 5).
Geographically, the potentially suitable area of A. latifolia will gradually shrink towards the south of China with the increase in time and radiation force, but high mountainous areas such as Xuefeng Mountain and Nanling Mountain are still highly suitable areas for A. latifolia in China (Figure 6). Under the SSP1-2.6 scenario in the 2090s (Figure 6b) and the SSP2-7.0 scenario in the 2050s (Figure 6c), the range of suitable areas will be expanded northward, and the new habitat will mainly occur in northern Guizhou, northeastern Hunan, northern Jiangxi, southern Anhui, and other regions, with an increase of 18.75 × 10⁴ km2 and 11.52 × 10⁴ km2, respectively (Table S2). The rest of the climate scenarios at each period will all show a trend of shrinking southward for the potentially suitable area of A. latifolia. In the 2090s period, under the SSP5-8.5 climate scenario (Figure 6h), its suitable area will undergo the greatest range contraction, with an area reduction of up to 46.82 × 10⁴ km2 (Table S2).

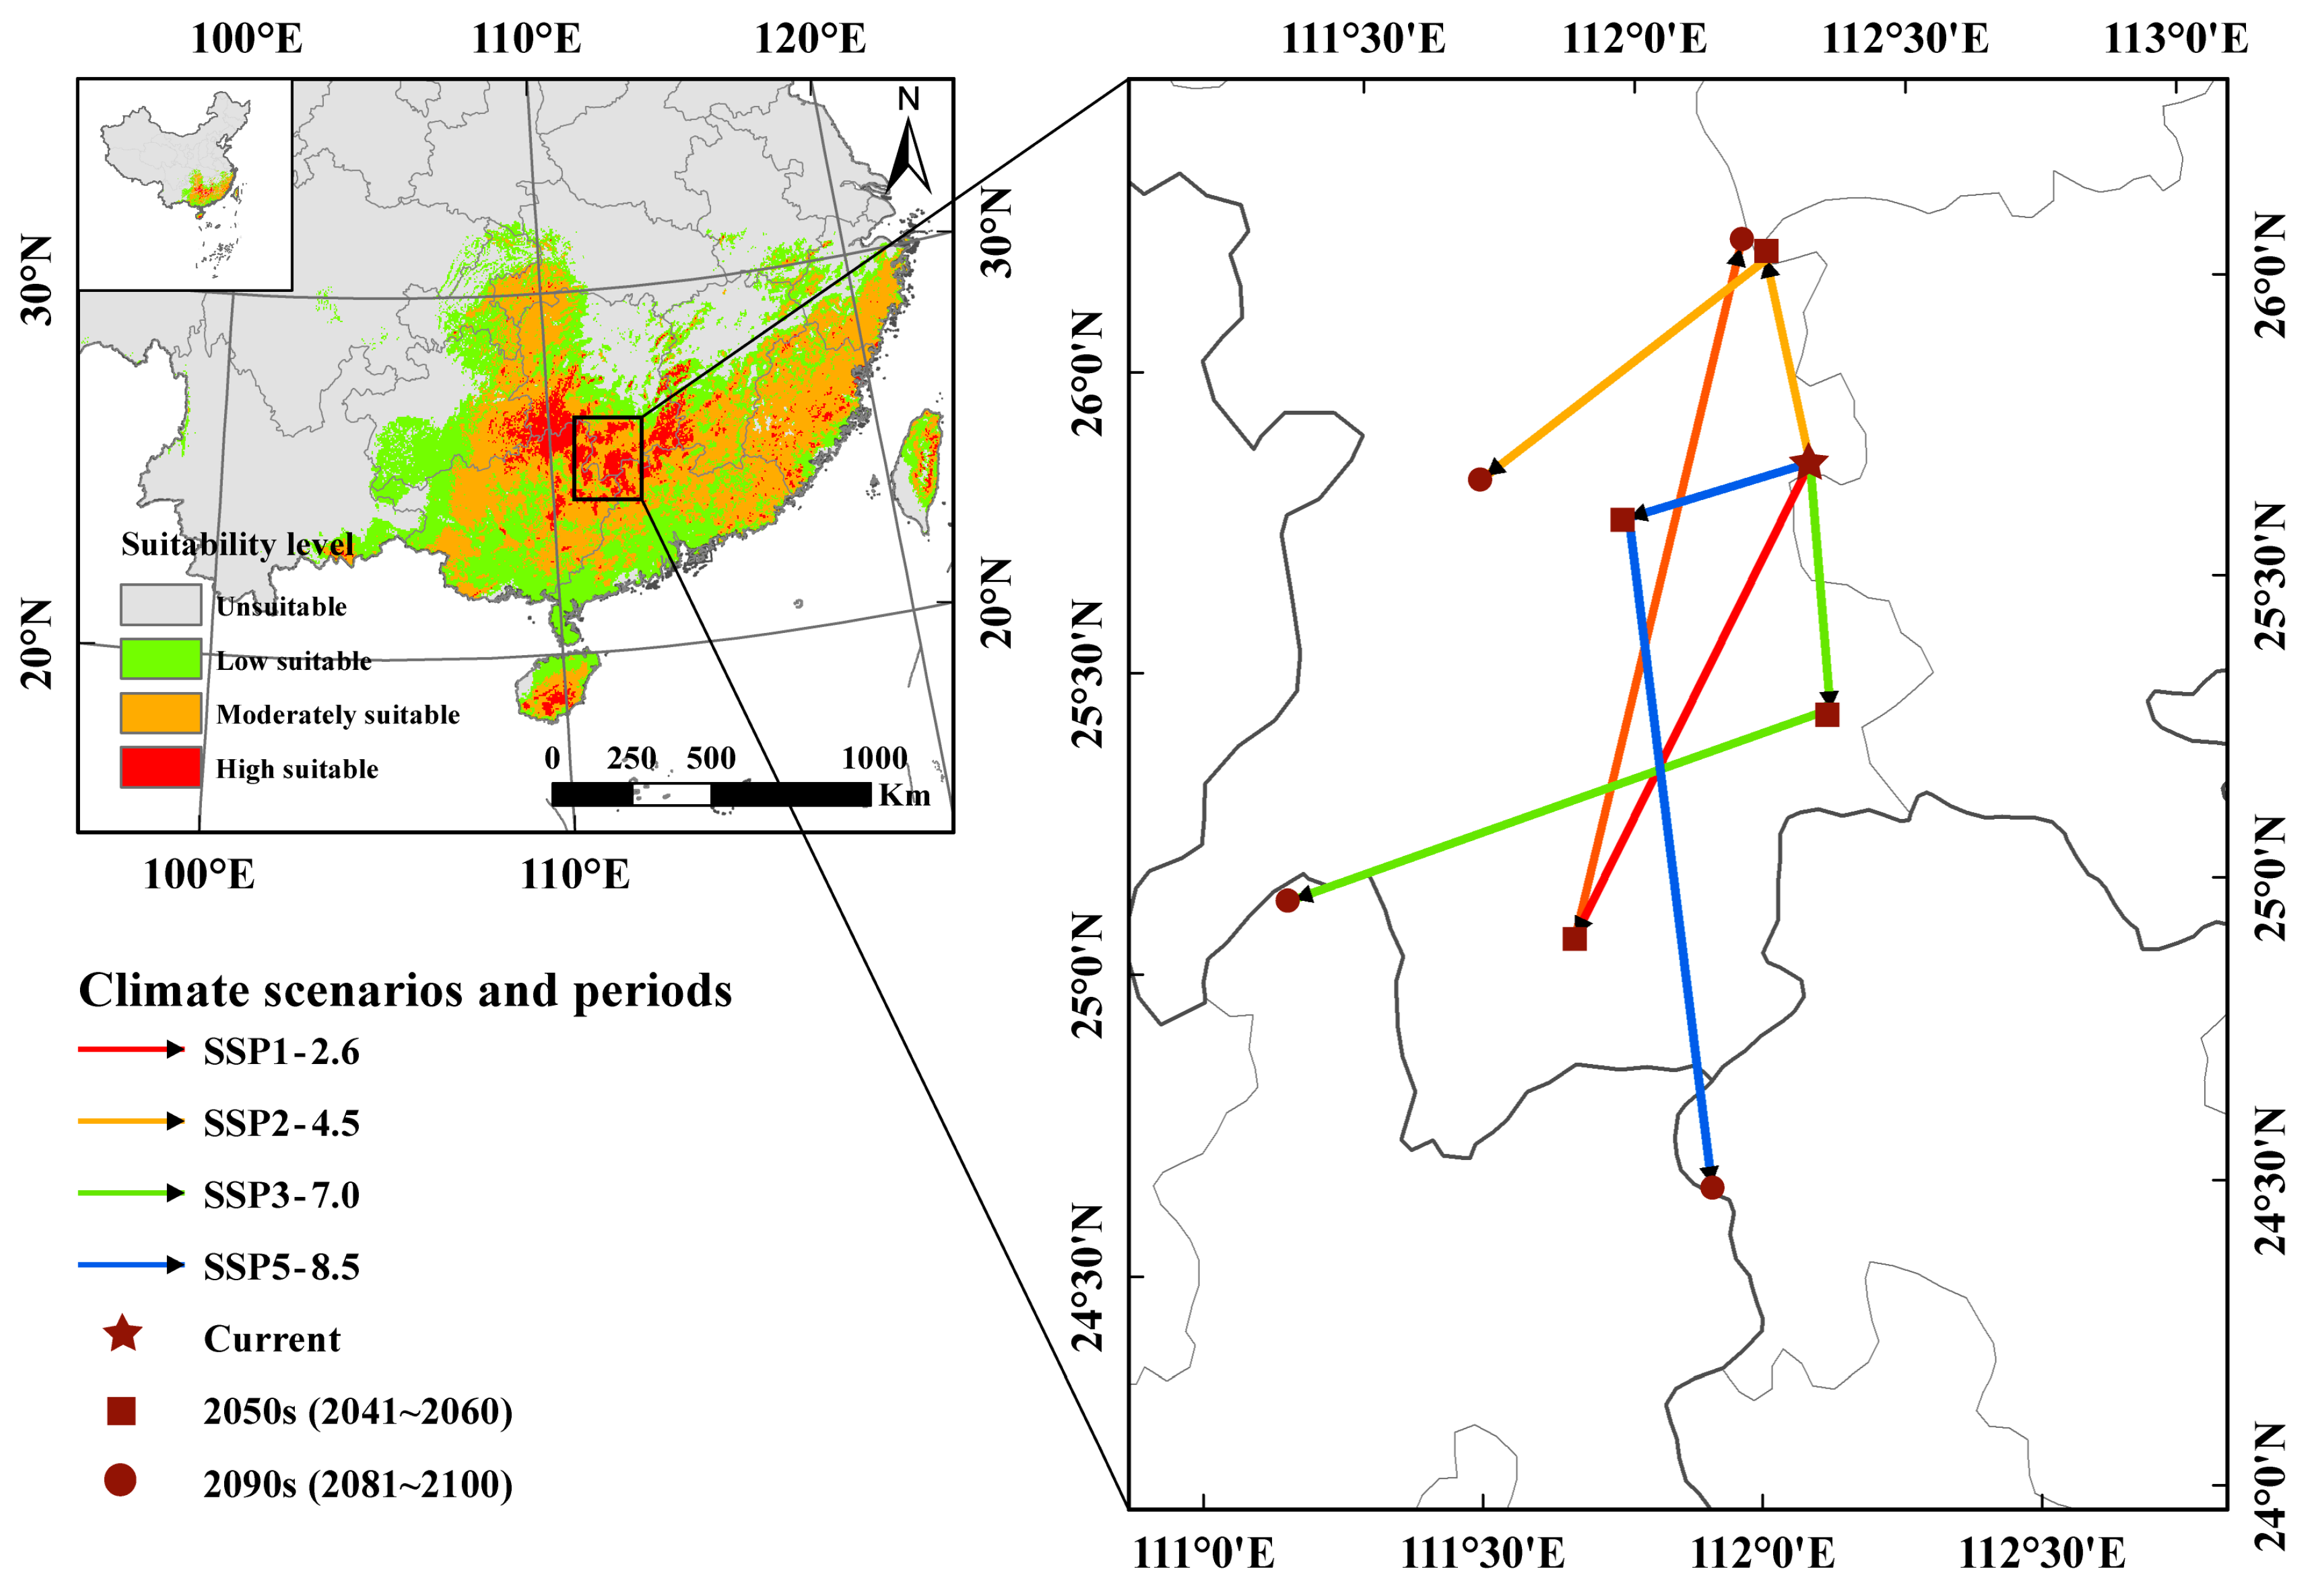
3.4. The Core Distribution Shifts

As depicted in Figure 7, the centroid of A. latifolia’s suitable habitat, along with the direction and distance of the centroid’s movement (Table S3), were determined using ArcGIS. The current core distribution shift of A. latifolia is located in Yongzhou City, Hunan Province (25.7557° N, 112.2577° E). In all four climate scenarios projected for the 2050s, the optimal habitat centers will consistently be situated in Yongzhou City. Under the SSP1-2.6 and SSP2-4.5 scenarios in the 2090s, the centroid of A. latifolia’s suitable habitat will be located to the north (26.1242° N, 112.1657° E) and west (25.7829° N, 111.6636° E) of Yongzhou City, respectively. In the context of the SSP3-7.0 scenario, projected for the 2090s, the centroid will move southwest to Hezhou City, Guangxi Province (25.1049° N, 111.2497° E). In the context of the SSP5-8.5 scenario for the 2090s, the center of A. latifolia will move south to Qingyuan City, Guangdong Province (24.5799° N, 111.9599° E).

4. Discussion

4.1. Model Prediction Accuracy

In this study, 433 occurrence data records and 14 environmental factors were employed to forecast the potential distribution of A. latifolia in China using the optimized MaxEnt model. Prior to this, SDMtoolbox v2.6 software was employed to clean and retain effective distribution data that aligned with the environmental factor resolution. The ENMeval package was selected to optimize the MaxEnt model parameters, which could reduce the overfitting tendency of the model [51,52]. Previous studies have indicated that the use of unoptimized MaxEnt models with default parameters can result in overfitting and sampling bias, which may compromise the transferability of species prediction [53,54]. After adjusting the RM from 1 to 1.5 and modifying the FC from LQHP to LQHPT, there was a notable reduction in the AICc from 87.661 to 0, suggesting a decrease in overfitting following optimization. The optimized AUC value achieved a high accuracy of 0.951, indicating the precision of the result. The current potential distribution regions of A. latifolia identified in this study are largely consistent with previous field surveys conducted in China [55]. It is important to note that the specific model parameters optimized based on the ENMeval package are often determined according to the research object and its data structure, and the optimal parameters for different species and different research backgrounds are not the same [12,56,57]. The MaxEnt model, when optimized with parameters, effectively reduces the complexity of the system while enhancing the concordance between predicted and actual outcomes [12].

4.2. Effects of the Main Environmental Factors on the Distribution of A. latifolia

A. latifolia, a relative of the thermophilic kiwifruit, is extensively found in the mountainous regions of tropical and subtropical China, at altitudes ranging from 400 to 1700 m [55]. Previous research has demonstrated that both temperature and precipitation significantly influence the distribution of evergreen broad-leaved vegetation in this region, with precipitation exerting a more substantial impact than temperature [58]. In this study, we analyzed the contribution percentages, permutation importance, and jackknife tests of the MaxEnt model, and it was determined that annual precipitation, temperature annual range, mean diurnal range, and precipitation of the driest quarter were the primary determinants influencing the distribution of A. latifolia. For instance, the annual precipitation response range for suitable areas of A. latifolia was determined to be between 35.35 mm and 3777.45 mm, while the temperature annual range was observed to be less than or equal to 31.02 °C. In conclusion, all four environmental factors exhibit a strong correlation with either precipitation or temperature. Notably, the contribution rate of environmental factors associated with precipitation is more significant, collectively exceeding 60%. Hydrothermal conditions significantly influence the geographical distribution of plants, particularly terrestrial species [59]. These plants exhibit heightened sensitivity to temperature and precipitation due to their direct impact on a range of physiological processes, including seed germination, photosynthesis, and transpiration [60]. Furthermore, environmental factors such as elevation, soil pH, and total phosphorus (TP) also influenced the geographical distribution range of A. latifolia. In this study, only bioclimatic, soil, and topographic environmental factors were utilized to simulate the potential distribution area. This approach may result in a slight deviation in the predicted potential distribution range in certain areas [61]. Consequently, future research should incorporate additional biological or abiotic variables such as human activities, species interactions, wind speed, and light exposure into the analysis.

4.3. Effects of Climate Change on the Distribution of A. latifolia

The suitable areas of A. latifolia will fluctuate over time and in response to varying climatic conditions under future climate change scenarios, but they generally remain consistent. As global warming intensifies, its suitable range will contract to lower latitudes, while habitat fragmentation will significantly worsen. In this process, the suitable habitat ranges for three distinct levels tend to shrink, becoming more pronounced as radiation forcing increases. The suitable area for A. latifolia initially expands, and then contracts under SSP2-4.5; however, it consistently diminishes under SSP3-7.0 and SSP5-8.5. The most significant decline in suitable areas occurred during the 2090s under SSP5-8.5. In contrast to the preceding three climate scenarios, the suitable habitat for this scenario will initially decrease before increasing under the SSP1-2.6 situation. This finding highlights the crucial role of sustainable development in promoting biological growth, reproduction, and the ecological environment [43]. Moreover, although the suitable area of A. latifolia did not shift to higher latitudes under climate warming conditions in this study, its changes (either expansion or contraction) in different climatic situations will occur mainly at the northern boundary [12,62,63]. Previous studies have shown that shifts in geographic distribution are more extreme at the edges of suitable habitats, where species are more sensitive to climate change [64,65]. However, the distribution area of A. latifolia is predicted to contract and become increasingly fragmented in southern China, a trend that is consistent with the research findings for other species within the kiwifruit genus [66,67].

4.4. Conservation and Utilization of Wild Kiwifruit Relatives

A. latifolia, a wild relative of the kiwifruit, is characterized by its high vitamin C content and the largest inflorescence within the genus [23]. Recent advancements in genomics and molecular biology of A. latifolia underscore the importance of preserving and sustainably utilizing its wild germplasm resources. The primary threat to the diversity of crop wild relatives is habitat loss, which remains the key solution for preserving this diversity [68]. In this study, we employed an enhanced MaxEnt model to investigate the potential habitat of A. latifolia and its response to climate change. Our results indicate that the potential habitat range of A. latifolia will be dynamically altered and may decrease significantly due to global warming. Consequently, we propose several strategies for prioritizing the conservation of kiwifruit wild relatives. Firstly, there is a need to intensify the exploration and collection of wild germplasm in high-latitude regions that are susceptible to habitat loss due to climate change. Concurrently, efforts should be made to actively pursue the ex situ conservation of its genetic resources through relocation. Secondly, for areas with stable habitats such as the Xuefeng and Nanling mountainous regions, we recommend the establishment of nature reserves to minimize human interference and improve in situ conservation. Lastly, we should take advantage of the National Actinidia Germplasm Repository (NAGR) of China and similar professional organizations to accurately identify A. latifolia wild resources and construct a core germplasm bank. This will establish a foundation for preserving, promoting, and sustainably using kiwifruit wild relatives. Furthermore, the inherent breeding potential of kiwifruit wild relatives must be fully exploited. This requires active engagement in domestication cultivation and hybrid breeding efforts for A. latifolia, thereby stimulating innovation and sustainable development within the kiwifruit industry.

5. Conclusions

In this study, we employed the MaxEnt model with optimized parameters used for the first time to predict the distribution of potential habitats for A. latifolia, taking into account current climatic conditions and anticipated climate change. Our results suggest that future climate change will significantly diminish the high-suitability habitat area of A. latifolia. The most influential environmental factors affecting the habitat of this wild kiwifruit relative germplasm were identified as annual precipitation (Bio12) and temperature annual range (Bio7). Global warming could potentially lead to further contraction and a southward shift of A. latifolia’s potential habitat in China. Based on these findings, it is recommended to strengthen the collection and preservation of wild germplasm resources of A. latifolia in habitats that are at risk of disappearing. This study also provides a reference for the collection, preservation, and cultivation of an ultra-high vitamin C germplasm in wild kiwifruit relatives.

Supplementary Materials

The following supporting information can be downloaded at https://www.mdpi.com/article/10.3390/su16145975/s1, Table S1. The 29 environmental variables selected for the study. Table S2. The gain and loss proportion of A. latifolia potential distribution based on different climate conditions in the future. Table S3. Moving distance and direction of centroids of the predicted potentially suitable area of A. latifolia based on different climate scenarios in the future. Figure S1. Correlation matrix between environmental variables used in this study. Figure S2. Performance of niche model of A. latifolia under different settings. Figure S3. The jackknife test result of environmental factor variables for A. latifolia.

Author Contributions

Conceptualization, Q.C. and L.Z.; data curation, M.L., L.Y. and J.P.; funding acquisition, Z.W. and L.Z.; methodology, Z.W.; software, Z.W. and M.L.; validation, X.L. and L.G.; writing—original draft, Z.W.; writing—review and editing, Z.W., L.Y., X.L., L.G., Q.H., Q.C. and L.Z. All authors have read and agreed to the published version of the manuscript.

Funding

This work was supported by the National Natural Science Foundation of China (Grant No. 32302499), the Youth Foundation of the Hubei Academy of Agricultural Sciences (Grant No. 2024NKYJJ23), the earmarked fund for CARS (Grant No. CARS-026-62), the Hubei Berry Trees Resource Center (Grant No. 2022DFE003), and the Wuhan Science and Technology Projects (2023110201030669). The funders had no role in study design, data collection and analysis, decision to publish, or preparation of the manuscript.

Institutional Review Board Statement

Not applicable.

Informed Consent Statement

Not applicable.

Data Availability Statement

Data are contained within the article.

Acknowledgments

The authors would like to thank the reviewers for their comments on this manuscript. The authors are grateful to the Chinese Virtual Herbarium (CVH, https://www.cvh.ac.cn, accessed on 19 August 2023), the Global Biodiversity Information Facility (GBIF, https://www.gbif.org, accessed on 19 August 2023), the Soil SubCenter, the National Earth System Science Data Center, the National Science and Technology Infrastructure of China (http://soil.geodata.cn, accessed on 19 August 2021), the WorldClim dataset (https://www.worldclim.org, accessed on 19 August 2023), and the sixth international Coupled Model Intercomparison Project for providing the geographical distribution and environmental data.

Conflicts of Interest

The authors declare no conflict of interest.

References

  1. Dawson, T.P.; Jackson, S.T.; House, J.I.; Prentice, I.C.; Mace, G.M. Beyond Predictions: Biodiversity Conservation in a Changing Climate. Science 2011, 332, 53–58. [Google Scholar] [CrossRef]
  2. Zhou, T. New Physical Science behind Climate Change: What Does IPCC AR6 Tell Us? Innovation 2021, 2, 100173. [Google Scholar] [CrossRef]
  3. Wu, Y.-M.; Shen, X.-L.; Tong, L.; Lei, F.-W.; Mu, X.-Y.; Zhang, Z.-X. Impact of Past and Future Climate Change on the Potential Distribution of an Endangered Montane Shrub Lonicera oblata and Its Conservation Implications. Forests 2021, 12, 125. [Google Scholar] [CrossRef]
  4. Ostad-Ali-Askar, K.; Su, R.; Liu, L. Water Resources and Climate Change. J. Water Clim. Change 2018, 9, 239. [Google Scholar] [CrossRef]
  5. Jing-Song, S.; Guang-Sheng, Z.; Xing-Hua, S. Climatic Suitability of the Distribution of the Winter Wheat Cultivation Zone in China. Eur. J. Agron. 2012, 43, 77–86. [Google Scholar] [CrossRef]
  6. Ma, Y.; Lu, X.; Li, K.; Wang, C.; Guna, A.; Zhang, J. Prediction of Potential Geographical Distribution Patterns of Actinidia Arguta under Different Climate Scenarios. Sustainability 2021, 13, 3526. [Google Scholar] [CrossRef]
  7. Yue, Y.; Zhang, P.; Shang, Y. The Potential Global Distribution and Dynamics of Wheat under Multiple Climate Change Scenarios. Sci. Total Environ. 2019, 688, 1308–1318. [Google Scholar] [CrossRef]
  8. Su, P.; Zhang, A.; Wang, R.; Wang, J.; Gao, Y.; Liu, F. Prediction of Future Natural Suitable Areas for Rice under Representative Concentration Pathways (RCPs). Sustainability 2021, 13, 1580. [Google Scholar] [CrossRef]
  9. Zhao, J.; Wang, C.; Shi, X.; Bo, X.; Li, S.; Shang, M.; Chen, F.; Chu, Q. Modeling Climatically Suitable Areas for Soybean and Their Shifts across China. Agric. Syst. 2021, 192, 103205. [Google Scholar] [CrossRef]
  10. Ureta, C.; Martínez-Meyer, E.; Perales, H.R.; Álvarez-Buylla, E.R. Projecting the Effects of Climate Change on the Distribution of Maize Races and Their Wild Relatives in Mexico. Glob. Chang. Biol. 2012, 18, 1073–1082. [Google Scholar] [CrossRef]
  11. Suwardi, A.B.; Mukhtar, E. Potential Geographic Distribution of Durio Oxleyanus (Malvaceae): A Threatened Wild Fruit Plant Species in Sumatra, Indonesia. Pol. J. Environ. Stud. 2023, 32, 2845. [Google Scholar] [CrossRef]
  12. Shi, X.; Wang, J.; Zhang, L.; Chen, S.; Zhao, A.; Ning, X.; Fan, G.; Wu, N.; Zhang, L.; Wang, Z. Prediction of the Potentially Suitable Areas of Litsea cubeba in China Based on Future Climate Change Using the Optimized MaxEnt Model. Ecol. Indic. 2023, 148, 110093. [Google Scholar] [CrossRef]
  13. He, Y.; Ma, J.; Chen, G. Potential Geographical Distribution and Its Multi-Factor Analysis of Pinus Massoniana in China Based on the Maxent Model. Ecol. Indic. 2023, 154, 110790. [Google Scholar] [CrossRef]
  14. Phillips, S.J.; Anderson, R.P.; Schapire, R.E. Maximum Entropy Modeling of Species Geographic Distributions. Ecol. Model. 2006, 190, 231–259. [Google Scholar] [CrossRef]
  15. Gong, Z.N.; Su, S.; Du, B.; Guan, H.; Zhang, Q. Habitat Selection and Dispersal of Red-Crowned Cranes during Breeding Period in Zhalong Wetland National Nature Reserve. J. Nat. Resour. 2021, 36, 1964–1975. [Google Scholar] [CrossRef]
  16. Soilhi, Z.; Sayari, N.; Benalouache, N.; Mekki, M. Predicting Current and Future Distributions of Mentha Pulegium L. in Tunisia under Climate Change Conditions, Using the MaxEnt Model. Ecol. Inform. 2022, 68, 101533. [Google Scholar] [CrossRef]
  17. Huang, H. The Genus Actinidia, a World Monograph; Science Press: Beijing, China, 2014. [Google Scholar]
  18. Li, X.W.; Li, X.; Li, J.Q.; Soejarto, D.D. Progress in the Phylogeny and Taxonomy of Actinidia during the Past Decade. In Proceedings of the VII International Symposium on Kiwifruit 913, Faenza, Italy, 12–17 September 2010; pp. 71–76. [Google Scholar]
  19. Drummond, L. The Composition and Nutritional Value of Kiwifruit. Adv. Food Nutr. Res. 2013, 68, 33–57. [Google Scholar] [PubMed]
  20. Liang, D.; Deng, H.; Deng, Q.; Lin, L.; Lv, X.; Wang, J.; Wang, Z.; Xiong, B.; Zhao, X.; Xia, H. Dynamic Changes of Phenolic Compounds and Their Associated Gene Expression Profiles Occurring during Fruit Development and Ripening of the Donghong Kiwifruit. J. Agric. Food Chem. 2020, 68, 11421–11433. [Google Scholar] [CrossRef]
  21. Wu, H.; Ma, T.; Kang, M.; Ai, F.; Zhang, J.; Dong, G.; Liu, J. A High-Quality Actinidia chinensis (Kiwifruit) Genome. Hortic. Res. 2019, 6, 117. [Google Scholar] [CrossRef]
  22. Jian-Qiang, L.; Huang, H.; Sheng-Mei, W.; Zi-Can, H.; Zhong-Hui, Z.; Jun-Jie, G. Genetic Diversity in the Genus Actinidia. Biodivers. Sci. 2000, 8, 1–12. [Google Scholar] [CrossRef]
  23. Han, X.; Zhang, Y.; Zhang, Q.; Ma, N.; Liu, X.; Tao, W.; Lou, Z.; Zhong, C.; Deng, X.W.; Li, D. Two Haplotype-Resolved, Gap-Free Genome Assemblies for Actinidia Latifolia and Actinidia chinensis Shed Light on the Regulatory Mechanisms of Vitamin C and Sucrose Metabolism in Kiwifruit. Mol. Plant 2023, 16, 452–470. [Google Scholar] [CrossRef] [PubMed]
  24. Deng, H.; Xia, H.; Guo, Y.; Liu, X.; Lin, L.; Wang, J.; Xu, K.; Lv, X.; Hu, R.; Liang, D. Dynamic Changes in Ascorbic Acid Content during Fruit Development and Ripening of Actinidia latifolia (an Ascorbate-Rich Fruit Crop) and the Associated Molecular Mechanisms. Int. J. Mol. Sci. 2022, 23, 5808. [Google Scholar] [CrossRef] [PubMed]
  25. Liu, X.; Xie, X.; Zhong, C.; Li, D. Comparative Transcriptome Analysis Revealed the Key Genes Regulating Ascorbic Acid Synthesis in Actinidia. Int. J. Mol. Sci. 2021, 22, 12894. [Google Scholar] [CrossRef] [PubMed]
  26. Du, G.; Li, M.; Ma, F.; Liang, D. Antioxidant capacity and the relationship with polyphenol and vitamin C in Actinidia fruits. Food Chem. 2009, 113, 557–562. [Google Scholar] [CrossRef]
  27. Qi, X.; Xie, X.; Zhong, C.; Li, D. The Complete Chloroplast Genome of Actinidia latifolia, a Species with High Vitamin C Content in Fruit. Mitochondrial DNA Part B 2020, 5, 3425–3426. [Google Scholar] [CrossRef]
  28. Ren, W.; Wang, L.; Feng, G.; Tao, C.; Liu, Y.; Yang, J. High-Quality Assembly and Comparative Analysis of Actinidia latifolia and A. valvata Mitogenomes. Genes 2023, 14, 863. [Google Scholar] [CrossRef] [PubMed]
  29. Miao, T.; Bao, H.; Ling, H.; Li, P.; Zhang, Y.; He, Y.; Hu, X.; Ling, C.; Liu, Y.; Tang, W. Comparative Transcriptomic Analysis Revealed the Suppression and Alternative Splicing of Kiwifruit (Actinidia latifolia) NAP1 Gene Mediating Trichome Development. Int. J. Mol. Sci. 2023, 24, 4481. [Google Scholar] [CrossRef]
  30. Liu, X.; Wu, R.; Bulley, S.M.; Zhong, C.; Li, D. Kiwifruit MYBS1-like and GBF3 Transcription Factors Influence L-ascorbic Acid Biosynthesis by Activating Transcription of GDP-L-galactose Phosphorylase 3. N. Phytol. 2022, 234, 1782–1800. [Google Scholar] [CrossRef]
  31. Wang, R.L.; Jiang, C.; Huang, T.; Zhang, Z.; Wang, M.; Shen, Z.; Wang, Y.; Li, Q. A simulation study of the geographical distribution of Actinidia arguta in China. Pol. J. Environ. Stud. 2020, 29, 1889. [Google Scholar] [CrossRef]
  32. Gao, B.; Yuan, S.; Guo, Y.; Zhao, Z. Potential geographical distribution of Actinidia spp. and its predominant indices under climate change. Ecol. Inform. 2022, 72, 101865. [Google Scholar] [CrossRef]
  33. Ma, Y.; Guga, S.; Xu, J.; Zhang, J.; Tong, Z.; Liu, X. Comprehensive risk assessment of high temperature disaster to kiwifruit in Shaanxi province, China. Int. J. Environ. Res. Public Health 2021, 18, 10437. [Google Scholar] [CrossRef] [PubMed]
  34. Brown, J.L. SDM Toolbox: A Python-based GIS Toolkit for Landscape Genetic, Biogeographic and Species Distribution Model Analyses. Methods Ecol. Evol. 2014, 5, 694–700. [Google Scholar] [CrossRef]
  35. Brown, J.L.; Bennett, J.R.; French, C.M. SDMtoolbox 2.0: The Next Generation Python-Based GIS Toolkit for Landscape Genetic, Biogeographic and Species Distribution Model Analyses. PeerJ 2017, 5, e4095. [Google Scholar] [CrossRef] [PubMed]
  36. Riahi, K.; Van Vuuren, D.P.; Kriegler, E.; Edmonds, J.; O’Neill, B.C.; Fujimori, S.; Bauer, N.; Calvin, K.; Dellink, R.; Fricko, O. The Shared Socioeconomic Pathways and Their Energy, Land Use, and Greenhouse Gas Emissions Implications: An Overview. Glob. Environ. Chang. 2017, 42, 153–168. [Google Scholar] [CrossRef]
  37. Yang, H.; Jiang, Z.; Li, L. Biases and Improvements in Three Dynamical Downscaling Climate Simulations over China. Clim. Dyn. 2016, 47, 3235–3251. [Google Scholar] [CrossRef]
  38. Shi, X.; Chen, X.; Dai, Y.; Hu, G. Climate Sensitivity and Feedback of BCC-CSM to Idealized CO2 Forcing from CMIP5 to CMIP6. J. Meteorol. Res. 2020, 34, 865–878. [Google Scholar] [CrossRef]
  39. O’Neill, B.C.; Kriegler, E.; Ebi, K.L.; Kemp-Benedict, E.; Riahi, K.; Rothman, D.S.; Van Ruijven, B.J.; Van Vuuren, D.P.; Birkmann, J.; Kok, K. The Roads Ahead: Narratives for Shared Socioeconomic Pathways Describing World Futures in the 21st Century. Glob. Environ. Chang. 2017, 42, 169–180. [Google Scholar] [CrossRef]
  40. Zhang, L.-X.; Xiao-Long, C.; Xiao-Ge, X.I.N. Short Commentary on CMIP6 Scenario Model Intercomparison Project (ScenarioMIP). Adv. Clim. Chang. Res. 2019, 15, 519. [Google Scholar]
  41. Ostad-Ali-Askari, K.; Ghorbanizadeh Kharazi, H.; Shayannejad, M.; Zareian, M.J. Effect of Climate Change on Precipitation Patterns in an Arid Region Using GCM Models: Case Study of Isfahan-Borkhar Plain. Nat. Hazards Rev. 2020, 21, 04020006. [Google Scholar] [CrossRef]
  42. Liu, F.; Wu, H.; Zhao, Y.; Li, D.; Yang, J.-L.; Song, X.; Shi, Z.; Zhu, A.-X.; Zhang, G.-L. Mapping High-Resolution National Soil Information Grids of China. Sci. Bull. 2022, 67, 328–340. [Google Scholar] [CrossRef]
  43. Yin, Y.; He, Q.; Pan, X.; Liu, Q.; Wu, Y.; Li, X. Predicting Current Potential Distribution and the Range Dynamics of Pomacea Canaliculata in China under Global Climate Change. Biology 2022, 11, 110. [Google Scholar] [CrossRef] [PubMed]
  44. Muscarella, R.; Galante, P.J.; Soley-Guardia, M.; Boria, R.A.; Kass, J.M.; Uriarte, M.; Anderson, R.P. ENM Eval: An R Package for Conducting Spatially Independent Evaluations and Estimating Optimal Model Complexity for MAXENT Ecological Niche Models. Methods Ecol. Evol. 2014, 5, 1198–1205. [Google Scholar] [CrossRef]
  45. Phillips, S.J.; Anderson, R.P.; Dudík, M.; Schapire, R.E.; Blair, M.E. Opening the Black Box: An Open-source Release of Maxent. Ecography 2017, 40, 887–893. [Google Scholar] [CrossRef]
  46. Elith, J.; Phillips, S.J.; Hastie, T.; Dudík, M.; Chee, Y.E.; Yates, C.J. A Statistical Explanation of MaxEnt for Ecologists: Statistical Explanation of MaxEnt. Divers. Distrib. 2011, 17, 43–57. [Google Scholar] [CrossRef]
  47. Swets, J.A. Measuring the Accuracy of Diagnostic Systems. Science 1988, 240, 1285–1293. [Google Scholar] [CrossRef]
  48. Liu, C.; White, M.; Newell, G. Selecting Thresholds for the Prediction of Species Occurrence with Presence-only Data. J. Biogeogr. 2013, 40, 778–789. [Google Scholar] [CrossRef]
  49. Freeman, E.A.; Moisen, G.G. A Comparison of the Performance of Threshold Criteria for Binary Classification in Terms of Predicted Prevalence and Kappa. Ecol. Model. 2008, 217, 48–58. [Google Scholar] [CrossRef]
  50. He, Q.; Zhou, G.; Lü, X.; Zhou, M. Climatic Suitability and Spatial Distribution for Summer Maize Cultivation in China at 1.5 and 2.0 C Global Warming. Sci. Bull. 2019, 64, 690–697. [Google Scholar] [CrossRef]
  51. Warren, D.L.; Glor, R.E.; Turelli, M. ENMTools: A Toolbox for Comparative Studies of Environmental Niche Models. Ecography 2010, 33, 607–611. [Google Scholar] [CrossRef]
  52. Warren, D.L.; Wright, A.N.; Seifert, S.N.; Shaffer, H.B. Incorporating Model Complexity and Spatial Sampling Bias into Ecological Niche Models of Climate Change Risks Faced by 90 C Alifornia Vertebrate Species of Concern. Divers. Distrib. 2014, 20, 334–343. [Google Scholar] [CrossRef]
  53. Jia, X.; Wang, C.; Jin, H.; Zhao, Y.; Liu, L.; Chen, Q.; Li, B.; Xiao, Y.; Yin, H. Assessing the Suitable Distribution Area of Pinus Koraiensis Based on an Optimized MaxEnt Model. Chin. J. Ecol. 2019, 38, 2570. [Google Scholar]
  54. Guo, J.; Liu, X.P.; Zhang, Q.; Zhang, D.F.; Xie, C.X.; Liu, X. Prediction for the Potential Distribution Area of Codonopsis Pilosula at Global Scale Based on Maxent Model. Ying Yong Sheng Tai Xue Bao J. Appl. Ecol. 2017, 28, 992–1000. [Google Scholar]
  55. Huang, H. Kiwifruit: The Genus Actinidia; Academic Press: London, UK, 2016. [Google Scholar]
  56. Khan, A.M.; Li, Q.; Saqib, Z.; Khan, N.; Habib, T.; Khalid, N.; Majeed, M.; Tariq, A. MaxEnt Modelling and Impact of Climate Change on Habitat Suitability Variations of Economically Important Chilgoza Pine (Pinus gerardiana Wall.) in South Asia. Forests 2022, 13, 715. [Google Scholar] [CrossRef]
  57. Kim, C.; Kim, W.; Song, W.; Cho, J.; Choi, J. Prediction of Native Seed Habitat Distribution According to SSP Scenario and Seed Transfer Zones: A Focus on Acer pictum Subsp. Mono and Quercus acuta. Forests 2023, 14, 87. [Google Scholar] [CrossRef]
  58. Huang, Z.; Xie, L.; Wang, H.; Zhong, J.; Li, Y.; Liu, J.; Ou, Z.; Liang, X.; Li, Y.; Huang, H.; et al. Geographic distribution and impacts of climate change on the suitable habitats of Zingiber species in China. Ind. Crops Prod. 2019, 138, 111429. [Google Scholar] [CrossRef]
  59. Bradie, J.; Leung, B. A Quantitative Synthesis of the Importance of Variables Used in MaxEnt Species Distribution Models. J. Biogeogr. 2017, 44, 1344–1361. [Google Scholar] [CrossRef]
  60. Punyasena, S.W.; Eshel, G.; McElwain, J.C. The influence of climate on the spatial patterning of Neotropical plant families. J. Biogeogr. 2008, 35, 117–130. [Google Scholar] [CrossRef]
  61. Gengping, Z.; Guoqing, L.; Wenjun, B.; Yubao, G. Ecological Niche Modeling and Its Applications in Biodiversity Conservation: Ecological Niche Modeling and Its Applications in Biodiversity Conservation. Biodivers. Sci. 2013, 21, 90–98. [Google Scholar] [CrossRef]
  62. Ye, X.; Zhao, G.; Zhang, M.; Cui, X.; Fan, H.; Liu, B. Distribution Pattern of Endangered Plant Semiliquidambar cathayensis (Hamamelidaceae) in Response to Climate Change after the Last Interglacial Period. Forests 2020, 11, 434. [Google Scholar] [CrossRef]
  63. Wang, Y.; Xie, L.; Zhou, X.; Chen, R.; Zhao, G.; Zhang, F. Prediction of the Potentially Suitable Areas of Leonurus japonicus in China Based on Future Climate Change Using the Optimized MaxEnt Model. Ecol. Evol. 2023, 13, e10597. [Google Scholar] [CrossRef]
  64. Thuiller, W.; Lavorel, S.; Araújo, M.B. Niche Properties and Geographical Extent as Predictors of Species Sensitivity to Climate Change. Glob. Ecol. Biogeogr. 2005, 14, 347–357. [Google Scholar] [CrossRef]
  65. Diamond, S.E.; Frame, A.M.; Martin, R.A.; Buckley, L.B. Species’ Traits Predict Phenological Responses to Climate Change in Butterflies. Ecology 2011, 92, 1005–1012. [Google Scholar] [CrossRef] [PubMed]
  66. Guo, R.; Zhang, Y.-H.; Zhang, H.-J.; Landis, J.B.; Zhang, X.; Wang, H.-C.; Yao, X.-H. Molecular Phylogeography and Species Distribution Modelling Evidence of ‘Oceanic’ Adaptation for Actinidia eriantha with a Refugium along the Oceanic–Continental Gradient in a Biodiversity Hotspot. BMC Plant Biol. 2022, 22, 89. [Google Scholar] [CrossRef] [PubMed]
  67. Wang, Z.; Hu, G.; Li, Z.; Zhong, C.; Yao, X. Characterizing Tetraploid Populations of Actinidia chinensis for Kiwifruit Genetic Improvement. Plants 2022, 11, 1154. [Google Scholar] [CrossRef]
  68. Pardini, R.; Nichols, E.; Püttker, T. Biodiversity Response to Habitat Loss and Fragmentation. Encycl. Anthr. 2017, 3, 229–239. [Google Scholar]
Figure 1. Distributions of occurrence points of A. latifolia in China.
Sustainability 16 05975 g001
Figure 2. The optimized model’s receiver operating characteristic (ROC) curve for A. latifolia. Red indicates the results over ten replicate runs, and blue margins display the standard deviation (SD) of ± for the same number of replicates.
Sustainability 16 05975 g002
Figure 3. The response curve of the main environmental factors.
Sustainability 16 05975 g003
Figure 4. Predictions of the potentially suitable area of A. latifolia under current climate conditions based on the MaxEnt model.
Sustainability 16 05975 g004
Figure 5. Potential distribution of A. latifolia based on different future climate scenarios: (a). 2050s—SSP1-2.6; (b). 2090s—SSP1-2.6; (c). 2050s—SSP2-4.5; (d). 2090s—SSP2-4.5; (e). 2050s—SSP3-7.0; (f). 2090s—SSP3-7.0; (g). 2050s—SSP5-8.5; (h). 2090s—SSP5-8.5.
Sustainability 16 05975 g005
Figure 6. Change in suitable habitat under different climate scenarios for A. latifolia: (a). 2050s—SSP1-2.6; (b). 2090s—SSP1-2.6; (c). 2050s—SSP2-4.5; (d). 2090s—SSP2-4.5; (e). 2050s—SSP3-7.0; (f). 2090s—SSP3-7.0; (g). 2050s—SSP5-8.5; (h). 2090s—SSP5-8.5.
Sustainability 16 05975 g006
Figure 7. Centroids of A. latifolia’s suitable habitat according to various future climatic scenarios.
Sustainability 16 05975 g007
Table 1. Percent contribution and permutation importance of the environmental variables in the MaxEnt model.
CodeDescriptionPercent ContributionPermutation Importance
Bio12Annual precipitation55.719.98
Bio7Temperature annual range (bio5-bio6)20.7335.70
Bio2Mean diurnal range (mean of monthly (max.temp.-min.temp.)10.078.10
Bio17Precipitation of the driest quarter7.3014.19
pHTopsoil pH (H2O)2.076.46
Bio14Precipitation of the driest month0.845.11
TNTotal nitrogen0.834.84
ElevElevations0.762.08
TKTotal potassium0.654.92
Bio18Precipitation of the warmest quarter0.325.57
Bio3Isothermality (bio2/bio7) (×100)0.281.52
TPTotal phosphorus0.200.26
CFCoarse fragment content0.160.36
Bio5Max temperature of the warmest month0.090.90
Table 2. Evaluation metrics of the MaxEnt model generated by ENMeval.
TypeRMFCDelta.AICcAUCMean.diff.AUCMean.OR10
default1LQHP87.6610.9610.0320.129
optimized1.5LQHPT0.0000.9510.0310.146
Table 3. Proportion of suitable habitats for A. latifolia under current and future climatic conditions in China.
ScenarioCurrentSSP1-2.6SSP2-4.5SSP3-7.0SSP5-8.5
Period2050s2090s2050s2090s2050s2090s2050s2090s
Unsuitable habitats87.3490.6185.3586.7189.4989.4491.7188.5392.51
Low suitable habitats5.594.596.547.127.004.645.835.744.86
Moderately suitable habitats6.024.197.185.823.284.822.214.912.44
Highly suitable habitats1.050.600.930.340.221.100.250.820.19
Disclaimer/Publisher’s Note: The statements, opinions and data contained in all publications are solely those of the individual author(s) and contributor(s) and not of MDPI and/or the editor(s). MDPI and/or the editor(s) disclaim responsibility for any injury to people or property resulting from any ideas, methods, instructions or products referred to in the content.

