Article

Spatial and Temporal Characteristics of Carbon Emissions from Construction Industry in China from 2010 to 2019

by
Mengru Song
1,
Yanjun Wang
1,2,*,
Cheng Wang
3,
Walter Musakwa
4 and
Yiye Ji
1
1
School of Earth Sciences and Spatial Information Engineering, Hunan University of Science and Technology, Xiangtan 411201, China
2
State Key Laboratory of Public Big Data, Guizhou University, Guiyang 550025, China
3
Institute of Aerospace Information Innovation, Chinese Academy of Sciences, Beijing 100864, China
4
Faculty of Science, University of Johannesburg, Johannesburg 2006, South Africa
*
Author to whom correspondence should be addressed.
Sustainability 2024, 16(14), 5927; https://doi.org/10.3390/su16145927
Submission received: 15 June 2024 / Revised: 8 July 2024 / Accepted: 8 July 2024 / Published: 11 July 2024

Abstract

The construction industry has become one of the industries that accounts for a relatively large share of China’s total carbon emissions. Aiming at the problems of monitoring difficulties, diversity of segmentation types, and uncertainty of carbon emission factors, this study calculates the carbon emissions and intensity of the construction industry in each province of China from 2010 to 2019, analyzes its spatial and temporal variability using the Moran index and the slope index, analyzes the driving factors by combining the Kaya equation and the LMDI method, and verifies the zero-error characteristics by using the IPAT model. The results show that from 2010 to 2019, carbon emissions from the construction industry in China’s provincial areas increased in general, with a distribution of “high in the east and low in the west”, and the carbon emission intensity declined in general, but some provinces in the north and the center are still higher. Economic development and the increase in housing construction area are the main reasons for the growth of carbon emissions, while the optimization of energy structure and the adjustment of population density reduce carbon emissions. Moreover, the IPAT model verifies the credibility of the results of the LMDI model. This study provides a reference for monitoring and assessing carbon emissions in China’s construction industry from the perspective of spatio-temporal characterization, helps regional energy conservation and emission reduction and dual-carbon strategy, and it analyzes the provincial carbon emission intensity to reveal the low-carbon development issues.

1. Introduction

Greenhouse gas (GHG) emissions, especially CO2 emissions, have been proven to be one of the main causes of global warming [1], and China is the world’s largest CO2 emitter, to which the construction industry is a major contributor [2]. In recent years, with the rapid development of urban construction in China, the operation of large-scale new buildings and existing buildings has generated a large amount of carbon emissions. According to China’s National Development and Reform Commission (NDRC), energy consumption in the construction sector accounted for about 30% of the country’s total energy consumption and about 40% of CO2 emissions in 2018 [3]. This proportion has continued to grow in recent years, mainly due to factors such as the expansion of the construction industry, high levels of energy consumption, and land use changes triggered by construction activities [4].
The construction industry is an energy-intensive industry, which accounts for a high proportion of energy consumption and CO2 emissions [5]. The Chinese government is increasing policy support for energy saving and emission reduction in the construction industry, promoting the development of green buildings and reducing negative impacts on the environment [6]. According to the International Energy Agency (IEA), the global construction industry accounts for about 30 percent of greenhouse gas emissions, with two-thirds coming from the use phase of buildings and one-third from the manufacturing and construction phases [7]. China’s construction industry accounts for about 20% of the country’s total carbon emissions [8].
The share of carbon emissions from the construction industry in different countries and regions varies depending on factors such as the size of the construction industry, energy structure, building standards, and policies and regulations. In China, the rapid development of the construction industry has resulted in a consistently high share of carbon emissions [9]. In response to climate change and environmental protection, the Chinese government and the construction industry are actively taking measures to promote a low-carbon transition and drive down carbon emissions [10]. Accurate accounting of carbon emissions from the construction sector is the basis for achieving the carbon-neutral goal of carbon peaking. According to the Global State of Building and Construction Report 2022, carbon dioxide emissions from building operations reached an all-time high of about 10 billion tons in 2021, an increase of about 5 percent from 2020. Many governments are acting to address climate change and building sustainability. The European Union is promoting building energy efficiency through energy efficiency retrofits and renewable energy use, and the U.S [11] Inflation Reduction Act supports building energy efficiency improvements and renewable energy use. Increased policy commitment and investment will be critical to lowering emissions trajectories in the coming years.
In measuring carbon emissions from the construction industry, due to the large differences in the scale and productivity of the construction industry in each province, regional heterogeneity may be ignored when predicting the carbon emissions from the construction industry (CECI) at the national level, leading to aggregation bias [12]. Provinces are the unit for the breakdown of China’s national carbon emissions targets, but provincial statistical systems differ, as do the sources of carbon emissions data and calculation processes [13]. In order to predict the peak of provincial CECI in China, a number of methods have been proposed by looking at specific (both direct and indirect) [14] or operational perspective to simulate CECI [15,16]. System dynamics can model system evolution by constructing causal loops of system factors, filling this gap and providing a more accurate basis for interprovincial CECI predictions [17]. The implicit energy of buildings cannot be ignored. Operational energy consumption can be curbed through technical and policy efforts, such as improving heating, ventilation, and air-conditioning (HVAC) performance, utilizing new and renewable sources of energy, adopting zero-energy building design, and green building certification policies. The focus has now shifted to incorporating hidden energy into building materials [18,19,20]. Implied carbon emissions relate to the whole life cycle of production, transportation, construction, use, and dismantling of building materials, while operational carbon emissions relate to energy consumption during the use phase of a building. Implied carbon emissions are mainly affected by the selection of building materials, production process, transportation distance and construction process, while operational carbon emissions are affected by the energy efficiency level of the building, energy sources, and equipment usage. This study mainly measured operational carbon emissions, but the content is not comprehensive enough, and subsequent studies should include the measurement of implied carbon emissions.
Luo et al. observed that there was a strong decoupling between carbon emissions and agricultural output in the eastern region from 1997 to 2014, and the decoupling status of transportation carbon emissions and economic growth showed cyclical characteristics [21]. However, a few studies have analyzed the decoupling of carbon emissions from economic development in the construction sector from a national perspective, and even fewer have explored trends in the dynamic evolution of this decoupling relationship [22,23]. Provinces are the implementation regions of carbon emission reduction in China and the main body of emission reduction quota allocation, with close inter-provincial ties. Therefore, it is necessary to fully understand regional differences and consider spatial dependence when formulating policies [24,25]. Various decomposition models of carbon emission influencing factors in the construction industry have been used, such as the IPAT series of models [26], despite the fact that numerous studies have been conducted to better improve the low-carbon construction industry. Regarding the Logarithmic Mean Dichotomous Index (LMDI) technique, the Index Decomposition Analysis (IDA) [27], and the Structural Decomposition Analysis (SDA) [28], the LMDI model is the most utilized among them, but few studies have quantitatively analyzed the zero error properties of LMDI decomposition models. Factors affecting building carbon emissions are multidimensional and diverse, and research can be conducted from both micro and macro perspectives. Existing studies have mostly focused on carbon emissions from new buildings, but lacked analysis of regional macro carbon emissions from buildings [29].
Nowadays, low-carbon environmental protection has become the focus of social attention, and the transition to a low-carbon economy and green development have been the trend of economic development. As a key area, the construction industry is studying its carbon emission problems and development patterns to provide an effective strategy for carbon emission reduction [30]. Therefore, this study first suggests methods for both direct and indirect calculations of the industry’s carbon emissions for 30 provinces in China between 2010 and 2019 (excluding data from Taiwan, Hong Kong, Macao, and Tibet); it then combines these data with the industry’s gross product to determine the industry’s carbon emission intensity and examines the industry’s carbon emission distribution both spatially and temporally. Finally, we fully account for the causes of carbon emissions in the construction industry and statistically analyze the influencing drivers and their uncertainties based on the LMDI decomposition approach and the IPAT model. The results of this study will reveal the spatial and temporal characteristics of carbon emissions from China’s construction industry and its influencing factors, as a means of exploring the realization of a dual-carbon strategy and the optimization of the path to the sustainable development goals suitable for China’s regions. The contributions of this study can be divided into the following aspects: (1) There is an aggregation bias in the measurement of carbon emissions from the construction industry at the national level that ignores regional heterogeneity, so this study calculates the coefficients of variation and standard deviations of the indicators related to carbon emissions from the construction industry in the six administrative regions, on the basis of which it analyzes their spatio-temporal distribution characteristics as well as spatial variability. (2) There is a lack of research on the zero error analysis of the LMDI model decomposition model. Therefore, this study verifies the reliability of the LMDI model using the IPAT model based on the LMDI model decomposition of the influencing factors.

2. Literature Review

On the measurement of carbon emissions from the construction industry, a number of research teams have analyzed the carbon emissions of the construction industry in the context of global and regional climate change through different methods and models. These studies have provided valuable references and lessons for China in the methodology of carbon emission measurement in the construction industry. For example, You et al. developed an integrated model, the LCCE model, to analyze the carbon emissions of the urban building system over its life cycle [31].This provides a reference value for China’s research on carbon emission measurement methods in the construction industry. Su et al. used three steel-framed houses in China as the object of their study, and established a model of energy consumption and carbon emissions embedded in the houses, including the material production, transportation, construction, recycling, and dismantling phases, as well as the upstream energy consumption and carbon emissions [32]. Huang et al. explored and compared global levels of carbon dioxide (CO2) emissions from construction activities using the 2009 World Environmental Input-Output Tables (WEOTs), which analyzed CO2 emissions from the construction sector in 40 countries, taking into account 26 types of energy use and non-energy use [2]. Wu et al. used the logarithmic mean divisor index to assess the carbon emissions of the construction industry from a full life cycle perspective, including extraction, manufacturing, construction and construction-related transportation, and building operations [8]. Li et al. developed a direct CECI, indirect CECI, and operational CECI model based on system dynamics in order to accurately predict the peak of provincial CECI (carbon emissions from the construction industry) [33]. As Europe plans to be “climate neutral” by 2050, emissions from all sectors of the economy must be reduced to the lowest possible level. Maximilian Weigert has proposed a methodology for calculating carbon emissions from construction sites by defining all fuel consumption processes and relying on established European standards to develop a system of boundaries to differentiate between emissions from the construction industry sector [34]. Wang et al. determined the background region based on the ODIAC dataset and potential temperature data, extracted the average value of XCO₂ in the background region as the background value, obtained the XCO₂ anomalies by using the regional comparison method and analyzed their spatial and temporal variation characteristics and trends, and calculated the correlation between the number of residential subdivisions and fossil fuel emissions [35]. The above studies provide a reference for this research to determine the measurement methods of direct and indirect carbon emissions from the construction industry in China.
In terms of the analysis of the influencing factors of carbon emissions in the construction industry, various studies have analyzed the influencing factors of carbon emissions in the construction industry through a variety of methods, including the decomposition of direct and indirect carbon emissions, spatial evolution, the impact of e-commerce, and the control of carbon intensity in the construction of urbanization. For example, using data from the World Input-Output Database, Shi et al. used structural decomposition analysis to study the drivers of carbon emission changes in China’s construction industry [36]. Du et al. classified carbon emissions into direct and indirect categories, analyzed the characteristics of carbon emissions from the coal industry in 30 provinces, autonomous regions and municipalities in China, and used the logarithmic mean index of disaggregation (LMDI) model to decompose the main influencing factors, including the direct energy share, energy consumption per unit of value, the value creation effect, the indirect carbon intensity, and the output scale effect [37]. They also examined the decoupling of carbon emissions from economic growth in the construction sector and used the standard deviation ellipse method to explore the spatial evolution of carbon emissions and economic effects [38]. Han et al. modified the Kaya model and established a multivariate linear correlation test model under the consideration of energy consumption growth and carbon emission intensity control in new urbanization construction. The empirical equilibrium equations and error correction equations were determined by a stability test, a lag order test, and a cointegration test [39]. Jiang et al. used input–output analysis, the energy consumption method, and structural decomposition modeling to study carbon emissions and emission reduction in China’s construction industry from 2007 to 2017 [40]. Zhu et al., based on the population, affluence, and technology stochastic impact regression model, comprehensively considered the characteristics of the construction industry, determined the influencing factors of construction e-commerce from both the demand and supply aspects, and constructed three extended analytical models using six indicators to explore the direct and indirect e-commerce in the construction sector [29]. Sun et al. described the spatio-temporal evolution of China’s 30 provinces and regions based on their panel data from 2005–2019 using Theil’s index, GIS techniques, and Moran’s I index, and then analyzed the influencing factors through the spatial Durbin model (SDM) [41]. The above studies analyzed the influencing factors of carbon emissions in the construction industry through different methods and models, providing multi-dimensional insights and policy implications for this study.
Previous studies have comprehensively analyzed global and regional carbon emissions from the construction industry through various methods, such as the LCCE model, LMDI model, and structural decomposition analysis, revealing multidimensional influencing factors and providing an important reference for carbon emission measurement in China. However, there are still limitations in dealing with regional heterogeneity, so this study combines multiple spatial analysis methods to better deal with regional heterogeneity and ensure the accuracy and reliability of the results of the construction industry carbon emissions study.

3. Materials and Methods
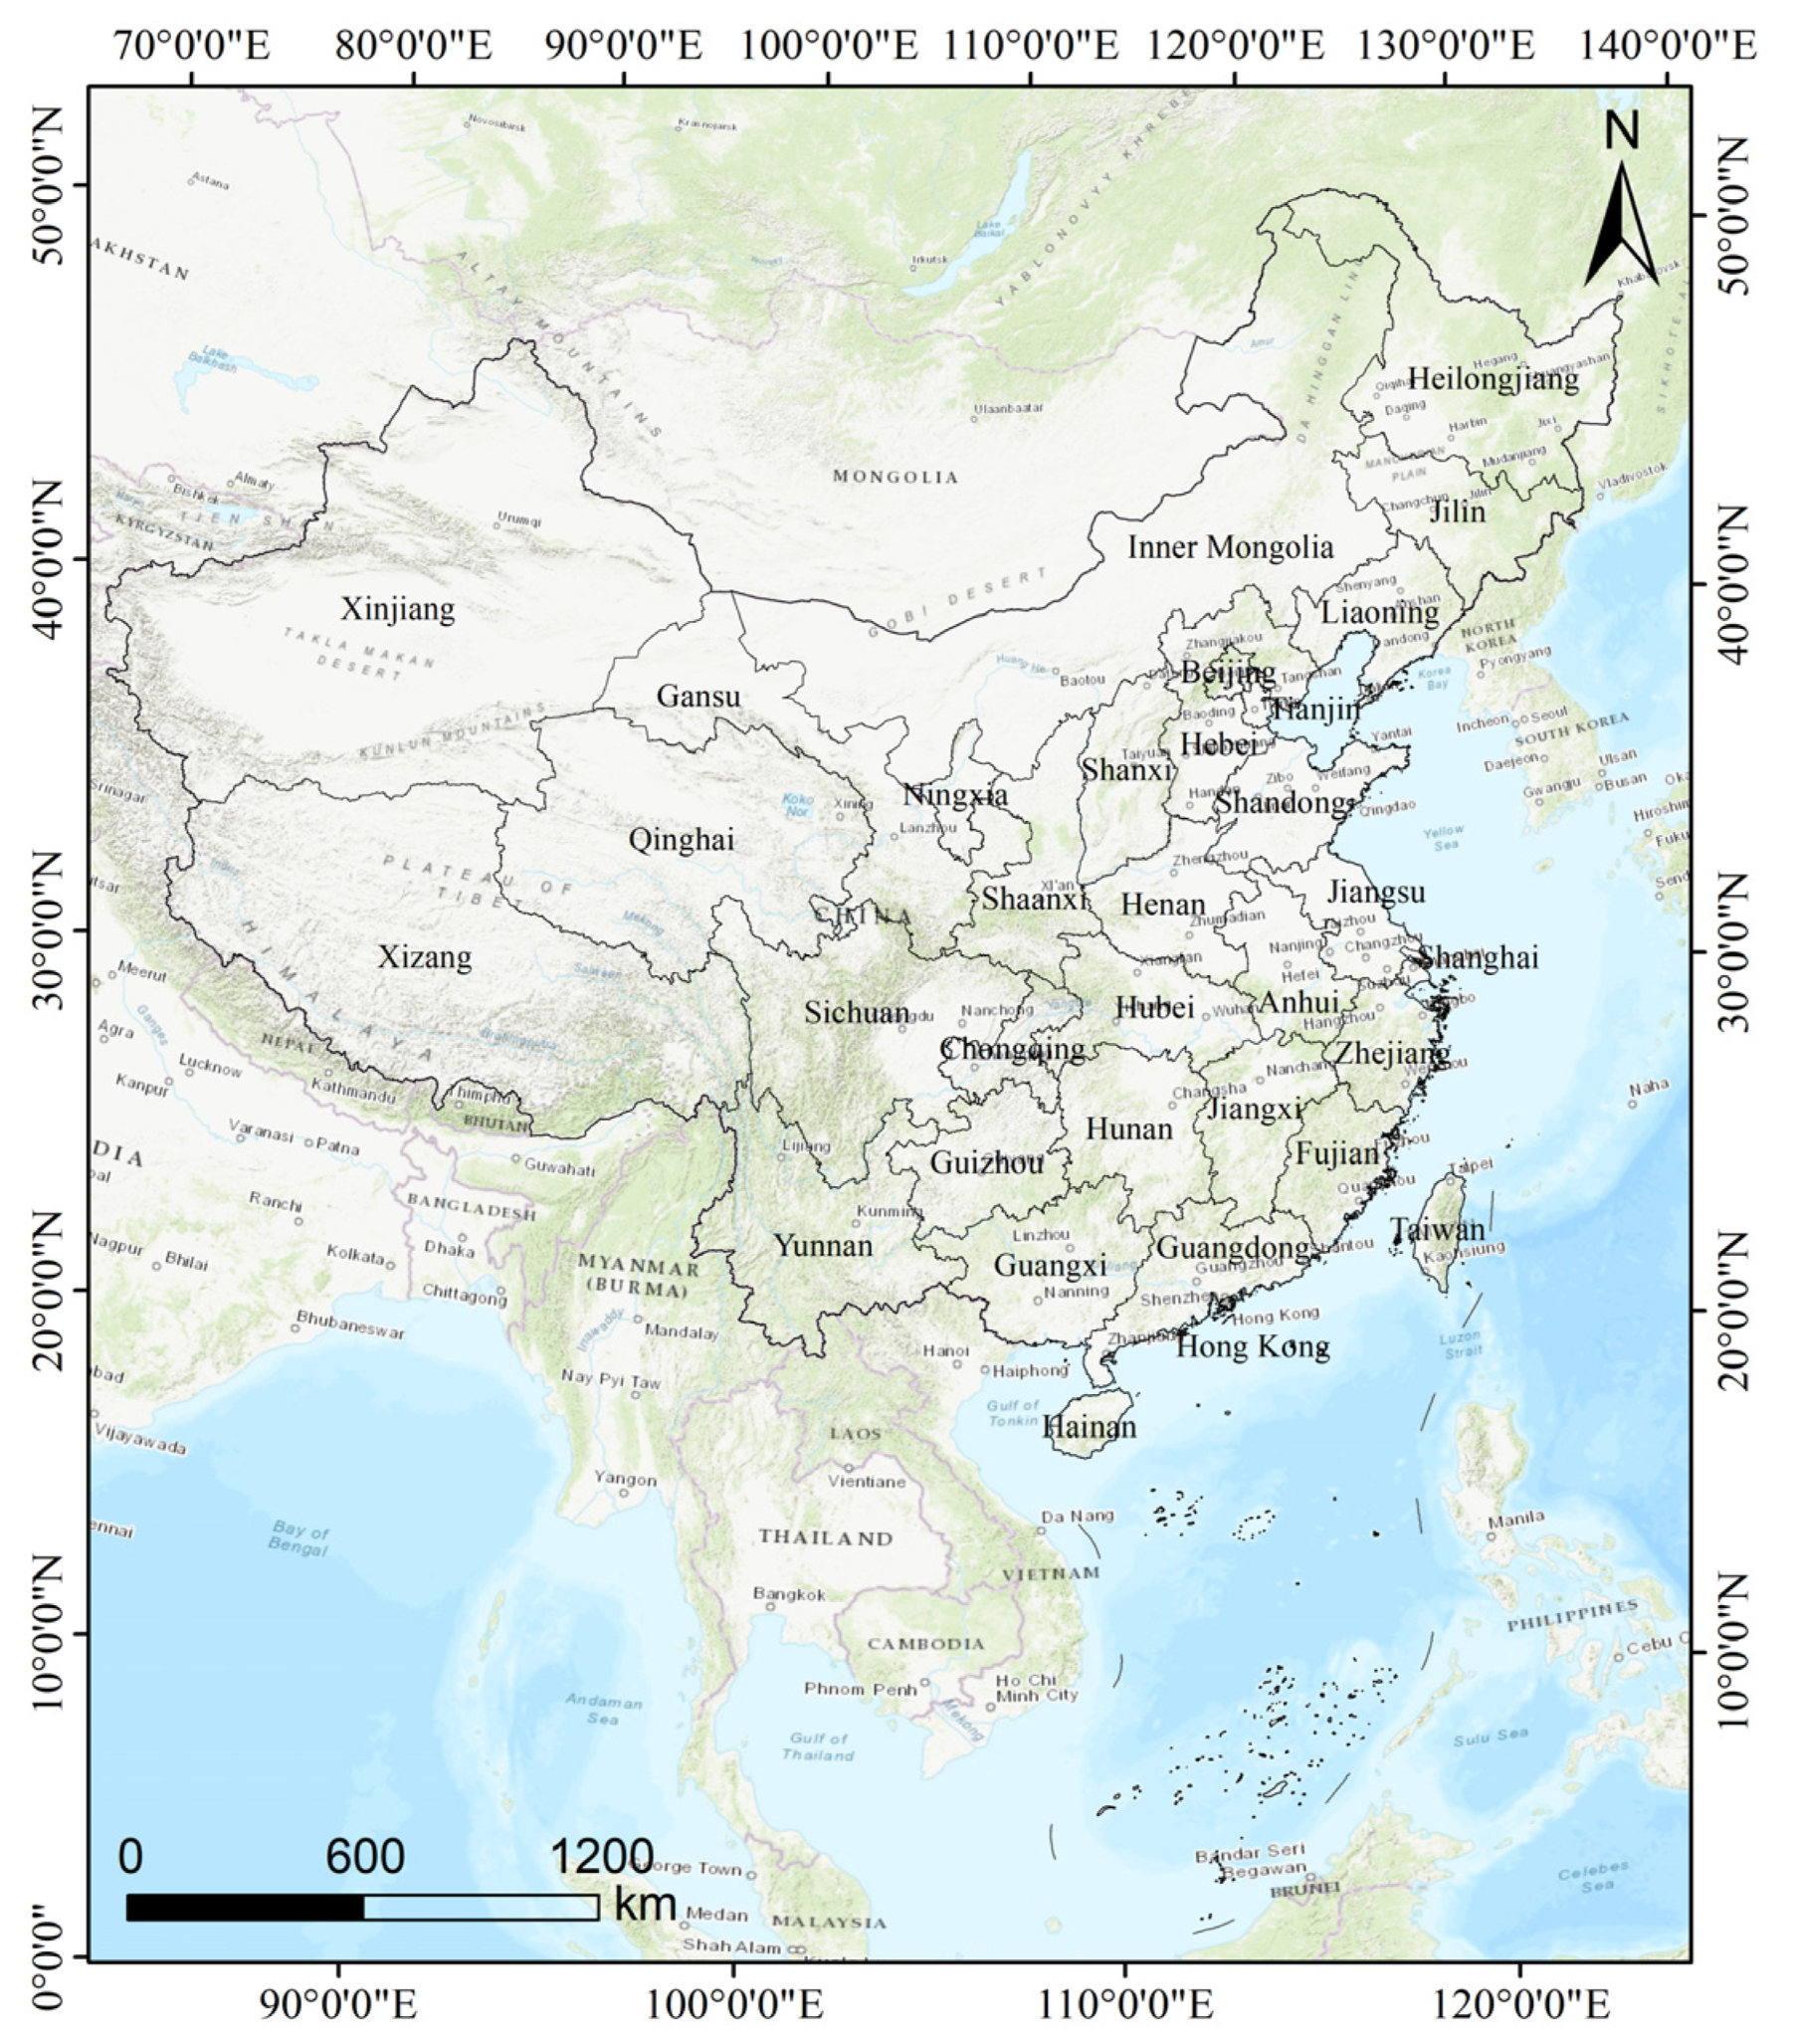
3.1. Study Area

This study examines the spatial and temporal evolution of carbon emissions from the construction industry in China’s provinces and regions between 2010 and 2019 (Figure 1). Thirty provinces and regions are used as the research units, and Hong Kong, Taiwan, Macao, and Tibet are excluded from the calculations and analysis because there are insufficient data on energy consumption for these regions. Thirty provinces and regions are chosen as experimental regions. Furthermore, the standard deviation and coefficient of variation in carbon emissions from China’s construction industry between 2010 and 2019 are computed in this study based on the six administrative regions of the nation: north, northeast, northwest, east, central south, and southwest China, which are divided into the following regions: east China comprises Shandong, Anhui, Jiangsu, Jiangxi, Zhejiang, Shanghai, Fujian, and Taiwan; central and south China comprises Henan, Hubei, Hunan, Guangdong, Guangxi, Hainan, Hong Kong, and Macao; and southwest China comprises Sichuan, Chongqing, Yunnan, Guizhou, and Xizang.

3.2. Data Sources

The construction industry data from 2010–2019 were selected for analysis in this study based on several key considerations. Firstly, the data from this period are more reliable in terms of completeness and quality, providing a continuous time series that facilitates trend and change analysis. Secondly, numerous significant policies and measures were implemented globally and in China during this time to address climate change, promote a low-carbon economy, and foster the sustainable development of the construction industry. Analyzing data from this period allows for an assessment of the effects and impacts of these policies. This is because this period is a critical stage in the intensive introduction and implementation of climate policies. The data provide a continuous time series, which helps to quantify the effects of policies, reveal trends and regional differences in carbon emissions, study the impact of low-carbon policies on the economy, and assess the effects of technological innovations, providing a scientific basis for future policy formulation. Additionally, the years 2010–2019 represent a crucial period of technological progress and industry transformation in the construction sector, including advancements in green building technology, new energy utilization, and construction material innovation. Analyzing data from this time frame captures the impact of these changes on carbon emissions [42]. This is because green building technologies, new energy utilization, and innovations in building materials have been widely applied during this period, significantly reducing the energy consumption and carbon emissions of buildings, and the policy-driven transition has facilitated stricter energy-efficiency standards and higher environmental protection requirements, thus promoting the development of the construction industry in a low-carbon and sustainable direction. Finally, selecting data from this period ensures the timeliness and relevance of the findings, as data from 2019 onwards have not yet been fully publicized or collated, making them difficult to use for the current study [43,44]. The following are the statistical and vector data used in this study and their respective sources:
(1) Statistical data
This study’s energy consumption data for the construction industry comes from CEADs (China Carbon Accounting Database) and previous years’ China Energy Statistical Yearbook. The data from the provincial carbon emission inventory of CEADs (China Carbon Accounting Database) are used to calculate the energy consumption of raw coal, coke, crude oil, gasoline, kerosene, diesel fuel, fuel oil, liquefied petroleum gas (LPG), natural gas, and electric power in the construction industry. The standard coal conversion factor is derived from GB/T2589-2008, while the carbon emission factor is derived from the 2006 IPCC Guidelines for National Greenhouse Gas Inventories. Regarding consumption of construction materials and building material carbon emission factor, the China Construction Industry Statistical Yearbook is the source for both the recycling factor and the home construction area. The gross construction product (CGDP) and the population of the country from 2010 to 2019 were two of the variables used to calculate the impact factors, and they were taken from the China Statistical Yearbook of previous years. Additionally, the GDP of the construction industry is all calculated using the year 2000 as the constant price in order to ensure the accuracy of the GDP-related indexes in each year and to avoid the influence of price factors on the analysis of the results. This paper adopts the GDP deflator calculation method.
(2) Vector data
The National Geomatics Center of China (NGCC) 1:1 million data (https://www.webmap.cn (accessed on 2 June 2022)) provided the national province administrative division maps used in this investigation. The online map is derived from the ArcGIS geographic information platform (https://map.geoq.cn/ArcGIS/services (accessed on 7 March 2024)).

3.3. Methodology

3.3.1. Carbon Emission-Related Indicators

(1) Carbon emissions from the construction sector measured
Total carbon emissions from the construction industry include direct carbon emissions and indirect carbon emissions. Direct carbon emissions refer to the carbon emissions generated by the direct consumption of energy in the construction process, including raw coal, coke, crude oil, gasoline, kerosene, diesel, fuel oil, liquefied petroleum gas (LPG), natural gas and electricity, and 10 types of energy [45]; indirect carbon emissions refer to the carbon emissions generated by the consumption of construction raw materials, including cement, steel, glass, and aluminum, during the construction process [32,37]. The cumulative emissions were calculated to account for more than 90 percent of the emissions related to construction materials. Therefore, based on the available data, this paper selects the building materials and energy consumed by the building materials industry, which is highly relevant to the construction industry, to calculate the carbon emissions from the construction industry, which are measured as shown in Equation (1):
C E = C E d i r + C E i n d i r = 44 12 i = 1 10 E i × φ i × K i + j = 1 4 F j × W j × ( 1 θ j )
where CE is the total carbon emission from the construction industry (10,000 tons); C E d i r is the direct carbon emission from the construction industry, and C E i n d i r is the carbon emission from the construction industry; i is the type of energy, including raw coal, coke, crude oil, gasoline, kerosene, diesel fuel, fuel oil, liquefied petroleum gas (LPG), natural gas, and electric power; E i is the consumption of i type of energy (10,000 tons); φ i is the conversion factor for i type of energy (10,000 tons of coal/tons of fuel); K i is the carbon emission factor for i type of energy (10,000 tons of carbon emission/tons of fuel); 44/12 is the coefficient of carbon to CO2 coefficient (10,000 tons of standard coal/10,000 tons of fuel); j is the type of building raw materials; F j is the consumption of the jth type of building materials; W j is the carbon emission factor of the jth type of building materials; θ j is the recovery factor of the jth type of building materials. The recycling factor of construction materials refers to the proportion of construction materials discarded through recycling in the construction or renovation process. It reflects the degree of effective use of resources in a construction project and is one of the most important indicators of building sustainability and environmental protection. A high recycling coefficient means that waste materials are effectively utilized in construction projects, reducing the consumption of natural resources and environmental pollution. Therefore, considering the recycling factor of building materials during the design and construction stages is one of the most important measures for the construction industry to promote sustainable development. The carbon emission factor for electric power refers to the baseline emission factor of the China regional power grid for the 2019 emission reduction project, and the relevant coefficients of carbon emission accounting for energy consumption are shown in Table 1, while the carbon emission factor and recycling factor of building materials are shown in Table 2.
(2) Determination of the construction sector’s carbon emission intensity
The growth of carbon emissions per unit of gross construction industry product is known as the “carbon intensity of the construction industry”, and it is primarily used to measure the correlation between carbon emissions and the economic development of the construction sector [46,47]. The construction industry has achieved a low-carbon development mode if carbon dioxide emissions per unit of gross construction industry product are falling while the sector is expanding economically. Equation (2) represents the formula.
C I = C E Y
where Y is the construction industry’s gross product (billions of dollars), CE is the industry’s total carbon emissions (tons), and CI is the construction industry’s carbon intensity (tons· b i l l i o n s 1 ).

3.3.2. Autocorrelation Analysis of Carbon Emissions in the Construction Industry

In order to discover and quantitatively assess the spatial heterogeneity of carbon emissions from the construction industry, this study calculated the global spatial autocorrelation coefficient (Moran’s I) [48,49], which is a commonly used global spatial autocorrelation statistic with the following formula:
I = n S 0 i = 1 n j = 1 n W i , j Z i Z j i = 1 n Z i 2
S 0 = i = 1 n j = 1 n W i , j
Z i (or Z j ) is the deviation of the value of feature i (or j) from the mean of all features; W i , j is the spatial weight matrix between features i and j; n is equal to the total number of features. The Moran’s I index value ranges from −1 to 1. If I < 0, it implies a negative correlation; if I = 0, it indicates that there is no correlation; and if I > 0, it shows a positive correlation.
In order to further identify trends in the spatial distribution pattern of carbon emissions from the construction industry, this study also computed the Local Spatial Autocorrelation Indicator (LISA) of the localized Moran’s I statistic, which is used to detect patterns of clustering and differentiation of geographic features over spatial locations, and in doing so, it was designed to reflect spatial correlations in the slopes of a given area with its neighboring areas.
I i = x i X ¯ S i 2 j = 1 , j i n W i , j ( x j X ¯ )
S i 2 = j = 1 , j i n ( x j X ¯ ) 2 n 1
where x i is the slope value of province i, X ¯ is the mean value of the corresponding province, W i , j is the spatial weight matrix between provinces i and j, and n is the total number of provinces. The value of local Moran’s I ranges from −1 to 1: if I i > 0, it indicates a positive correlation of high slopes surrounded by high slopes (High-High) or low slopes surrounded by low slopes (Low-Low); if I i < 0, it indicates that the high slopes and low slopes surround each other (High-Low, Low-High).

3.3.3. Trends in Carbon Emissions in the Construction Sector Analysis

This study computes the slope value of carbon emissions from the construction industry at the provincial level in China based on the accounting of carbon emissions from the construction industry in each province [50,51]. This allows for a more thorough analysis of the temporal development trend of carbon emissions from the construction industry in each province of China. Equation (7) provides its calculation formula:
S l o p e i = n × t = 1 10 x t E t ,   i t = 1 10 x t t = 1 10 E t ,   i n × t = 1 10 x t 2 ( t = 1 10 x t ) 2
where n denotes the number of years (2010–2019) for which carbon emissions are calculated in this paper; x t indicates the first year (2010 is year 1). E t , i denotes the carbon emissions from the construction industry in region i in year t (tons). The slope value reflects the rate or tendency of the increase or decrease in carbon emissions from the construction industry in the region. On the one hand, if Slope > 0, it indicates that the carbon emissions from the construction industry in the region increase over time; if Slope < 0, it indicates that the carbon emissions show a decreasing trend over time. Using the standard deviation division method, the growth type of carbon emissions from the construction industry in each province and region is divided into four categories for the purposes of this study’s specific division of the growth type of carbon emissions. Table 3 displays the division criteria.

3.3.4. Differential Analysis of Carbon Emissions in the Construction Industry

(1) Standard deviation calculation
In this study, the absolute spatial difference between carbon emissions and carbon intensity in the construction industry is described using the standard deviation method. The exact formula can be found in Equation (8).
S i = i ( C i   C ¯ ) 2 N
In the formula, S i denotes the standard deviation corresponding to the ith province, and   C i   denotes the indicator value of the total carbon emissions or carbon emissions intensity of the construction industry measured in the ith province. C ¯   is the mean value of the corresponding measured indicator. N is the number of provinces (in this case, N = 30).
(2) Coefficient of variation computation
The degree of dispersion of carbon emissions data is measured by the coefficient of variation in carbon emissions, which is the ratio of the standard deviation of carbon emissions to the mean [52,53]. This indicator aids in determining whether there are notable swings in the carbon emission status for any industry or location. On the other hand, if the coefficient of variation is minimal, it suggests that the fluctuation of carbon emissions is small and generally steady. A big coefficient of variation suggests that there may be a large degree of uncertainty associated with the carbon emissions. Equation (9) displays the particular formula:
C V = 1 N i ( C i C ¯ ) 2 C
where CV stands for the coefficient of variation in the relevant province’s index connected to carbon emissions.

3.3.5. Examining the Variables Influencing Carbon Emissions in the Construction Sector

The factors influencing carbon emissions in the construction industry were broken down using the LMDI decomposition model in this study. According to the Kaya equation, population, energy intensity, economic output, and carbon emission intensity all had some bearing on the overall amount of carbon emissions [54,55,56]. In order to further break down the overall carbon emissions from the construction industry, Kaya’s constant equation is further extended in this study with reference to earlier research. This allows for the analysis of the effects of population density, housing construction area, economic development, energy structure intensity, and energy consumption intensity. Equation (10) displays the particular formula:
C E = C E E × E C G D P × C G D P P O P × P O P S × S
where CE is the total carbon emissions from the construction sector, E is the total energy consumption, and CGDP denotes the gross construction product. C E E , E C G D P , C G D P P O P , P O P S , and S denote the energy structure intensity effect, energy consumption intensity effect, economic development effect, population density effect, and housing construction area, respectively.
Simplify Equation (10) further as follows:
C E = a × b × c × d × f
where a, b, c, d, and f denote, respectively, C E E , E C G D P , C G D P P O P , P O P S , and S.
Using 2010 as the base period, the total carbon emissions from the construction sector in the base period are set to be C E 0 , T is a particular year of the study, and the total carbon emissions in period T are C E T , ∆CE is the total effect value of the influencing factors of carbon emissions in the construction industry, then according to the LMDI decomposition method, the expression of the effect value of each influencing factor is as follows:
Δ C E n = i ω i l n n T n 0
where n is the five influences in the text, i.e., a, b, c, d, f; w i is the weighting factor. Its expression is w i = C E i T C E i 0 l n C E i T l n C E i 0 ; C E a , C E b , C E c , C E d , and C E f   denote the energy structure intensity effect, energy consumption intensity effect, economic development effect, population density effect, and housing construction area effect, respectively. Since the carbon emission coefficient in this study is a fixed value, C E a is 0. The values of the various effects are summed up to the total effect value, which is shown in Equations (13) and (14):
C E = C E T C E 0
C E = C E a + C E b + C E c + C E d + C E f

3.3.6. Zero Error Analysis of the LMDI Decomposition Model Based on the IPAT Model

Population size, per capita productivity, and resource intensity are the three factors that can be used to break down the environmental impact of the IPAT model, which is a model that combines economic growth and environmental impact [57,58]. The particular breakdown formula is displayed in (15):
I = P × A × T
where P stands for population number, A for level of affluence, T for technological level, and I for environmental impact.
The environmental impact equation is converted into the IPAT equation for carbon emissions from the construction sector in this study, where the environmental impact is stated in terms of the overall carbon emissions from the industry. Using the LMDI decomposition Equation (10) mentioned above, C E = C E E × E C G D P × C G D P P O P × P O P S × S for the IPAT model of carbon emissions from the construction sector. In Equation (10), the energy structure intensity, or CE/E, is primarily associated with the structure of energy use; the energy consumption intensity, or E/CGDP, is associated with the technological level; POP/S denotes population density, which is tied to population size; S (the area of housing building) is related to land-use planning; and CGDP/POP symbolizes economic development, which is related to wealth level.
The variables are typically logarithmized in accordance with earlier research, and the outcomes are displayed in Equation (16):
l n C E = l n C E E + l n E C G D P + l n C G D P P O P + l n P O P S + l n S
Equation (16) is then transformed according to the knowledge of calculus:
d ( l n C E ) = d ( l n C E E ) + d ( l n E C G D P ) + d ( l n C G D P P O P ) + d ( l n P O P S ) + d ( l n S )
The average yearly rate of change in carbon emissions from the construction sector, the average yearly rate of change in the intensity of the energy mix, the average yearly rate of change in the intensity of energy consumption, the average yearly rate of change in the economy, the average yearly rate of change in the population density, and the average yearly rate of change in the area of housing construction are all indicated in this study by Equation (17) of the d(lnCE), d(ln CE/E), d(ln E/CGDP), d(ln CGDP/POP), and d(lnS).

4. Results

4.1. Analysis of the Spatial Evolution of Carbon Emissions in the Construction Industry

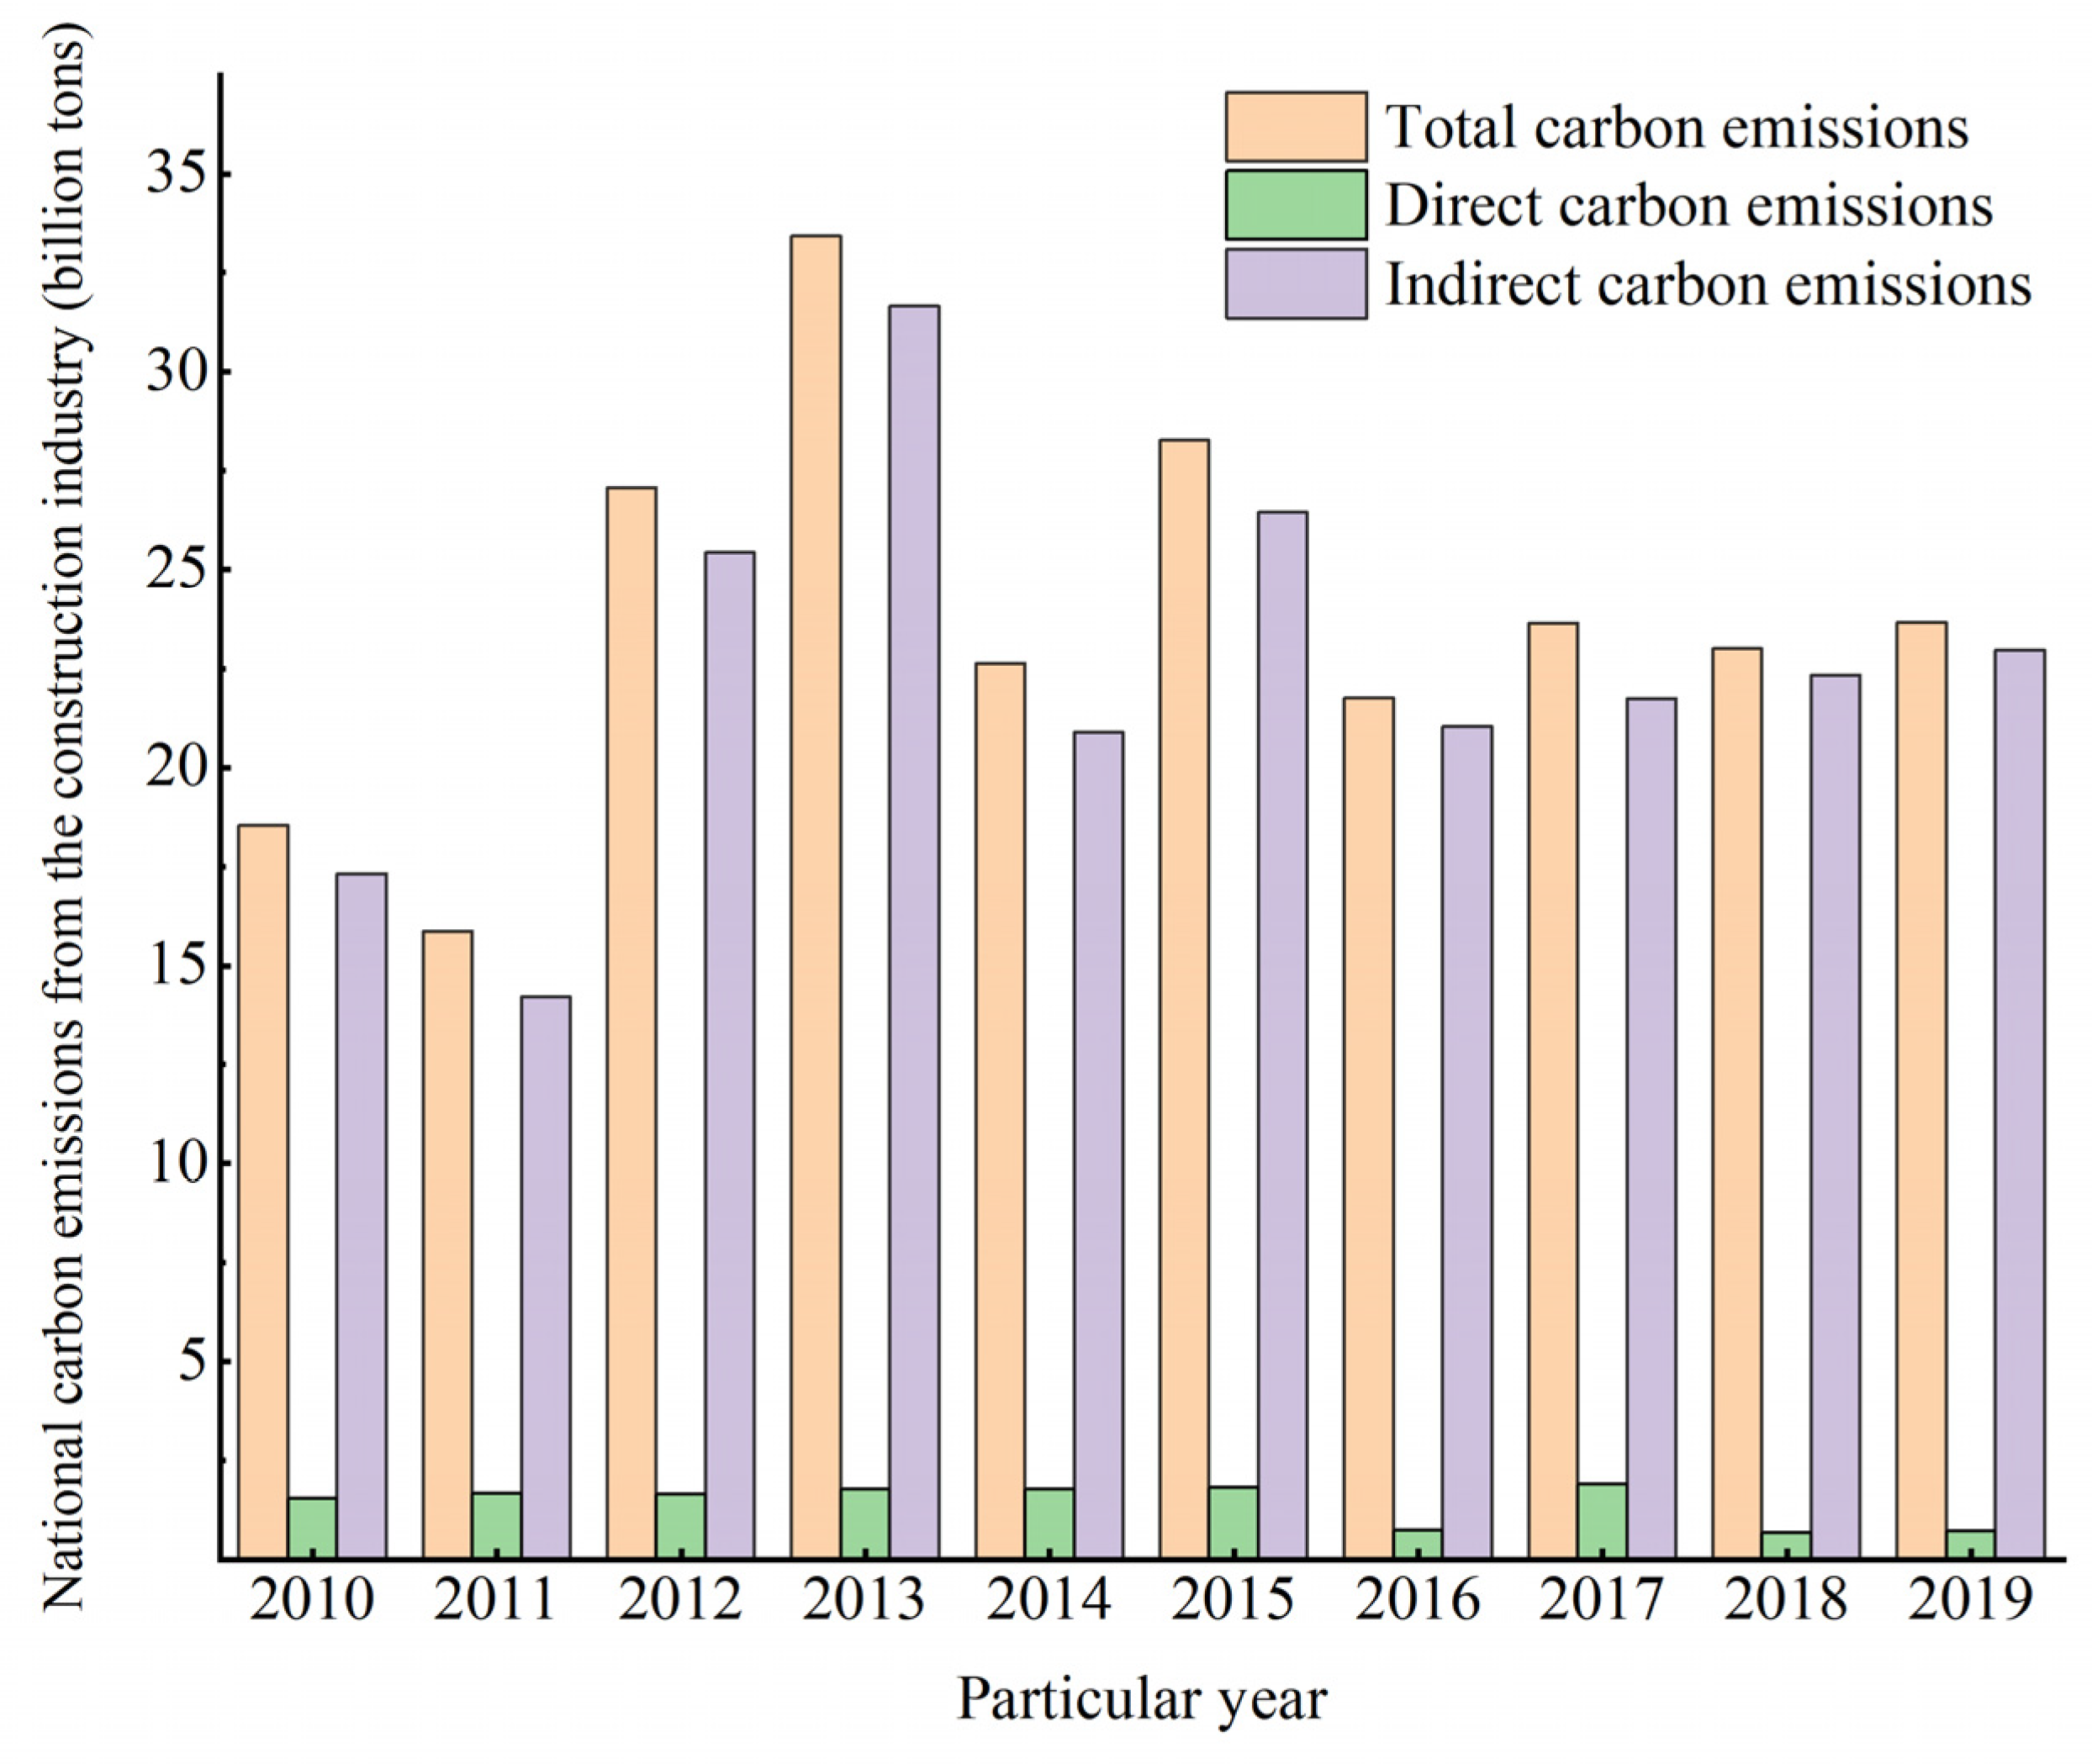
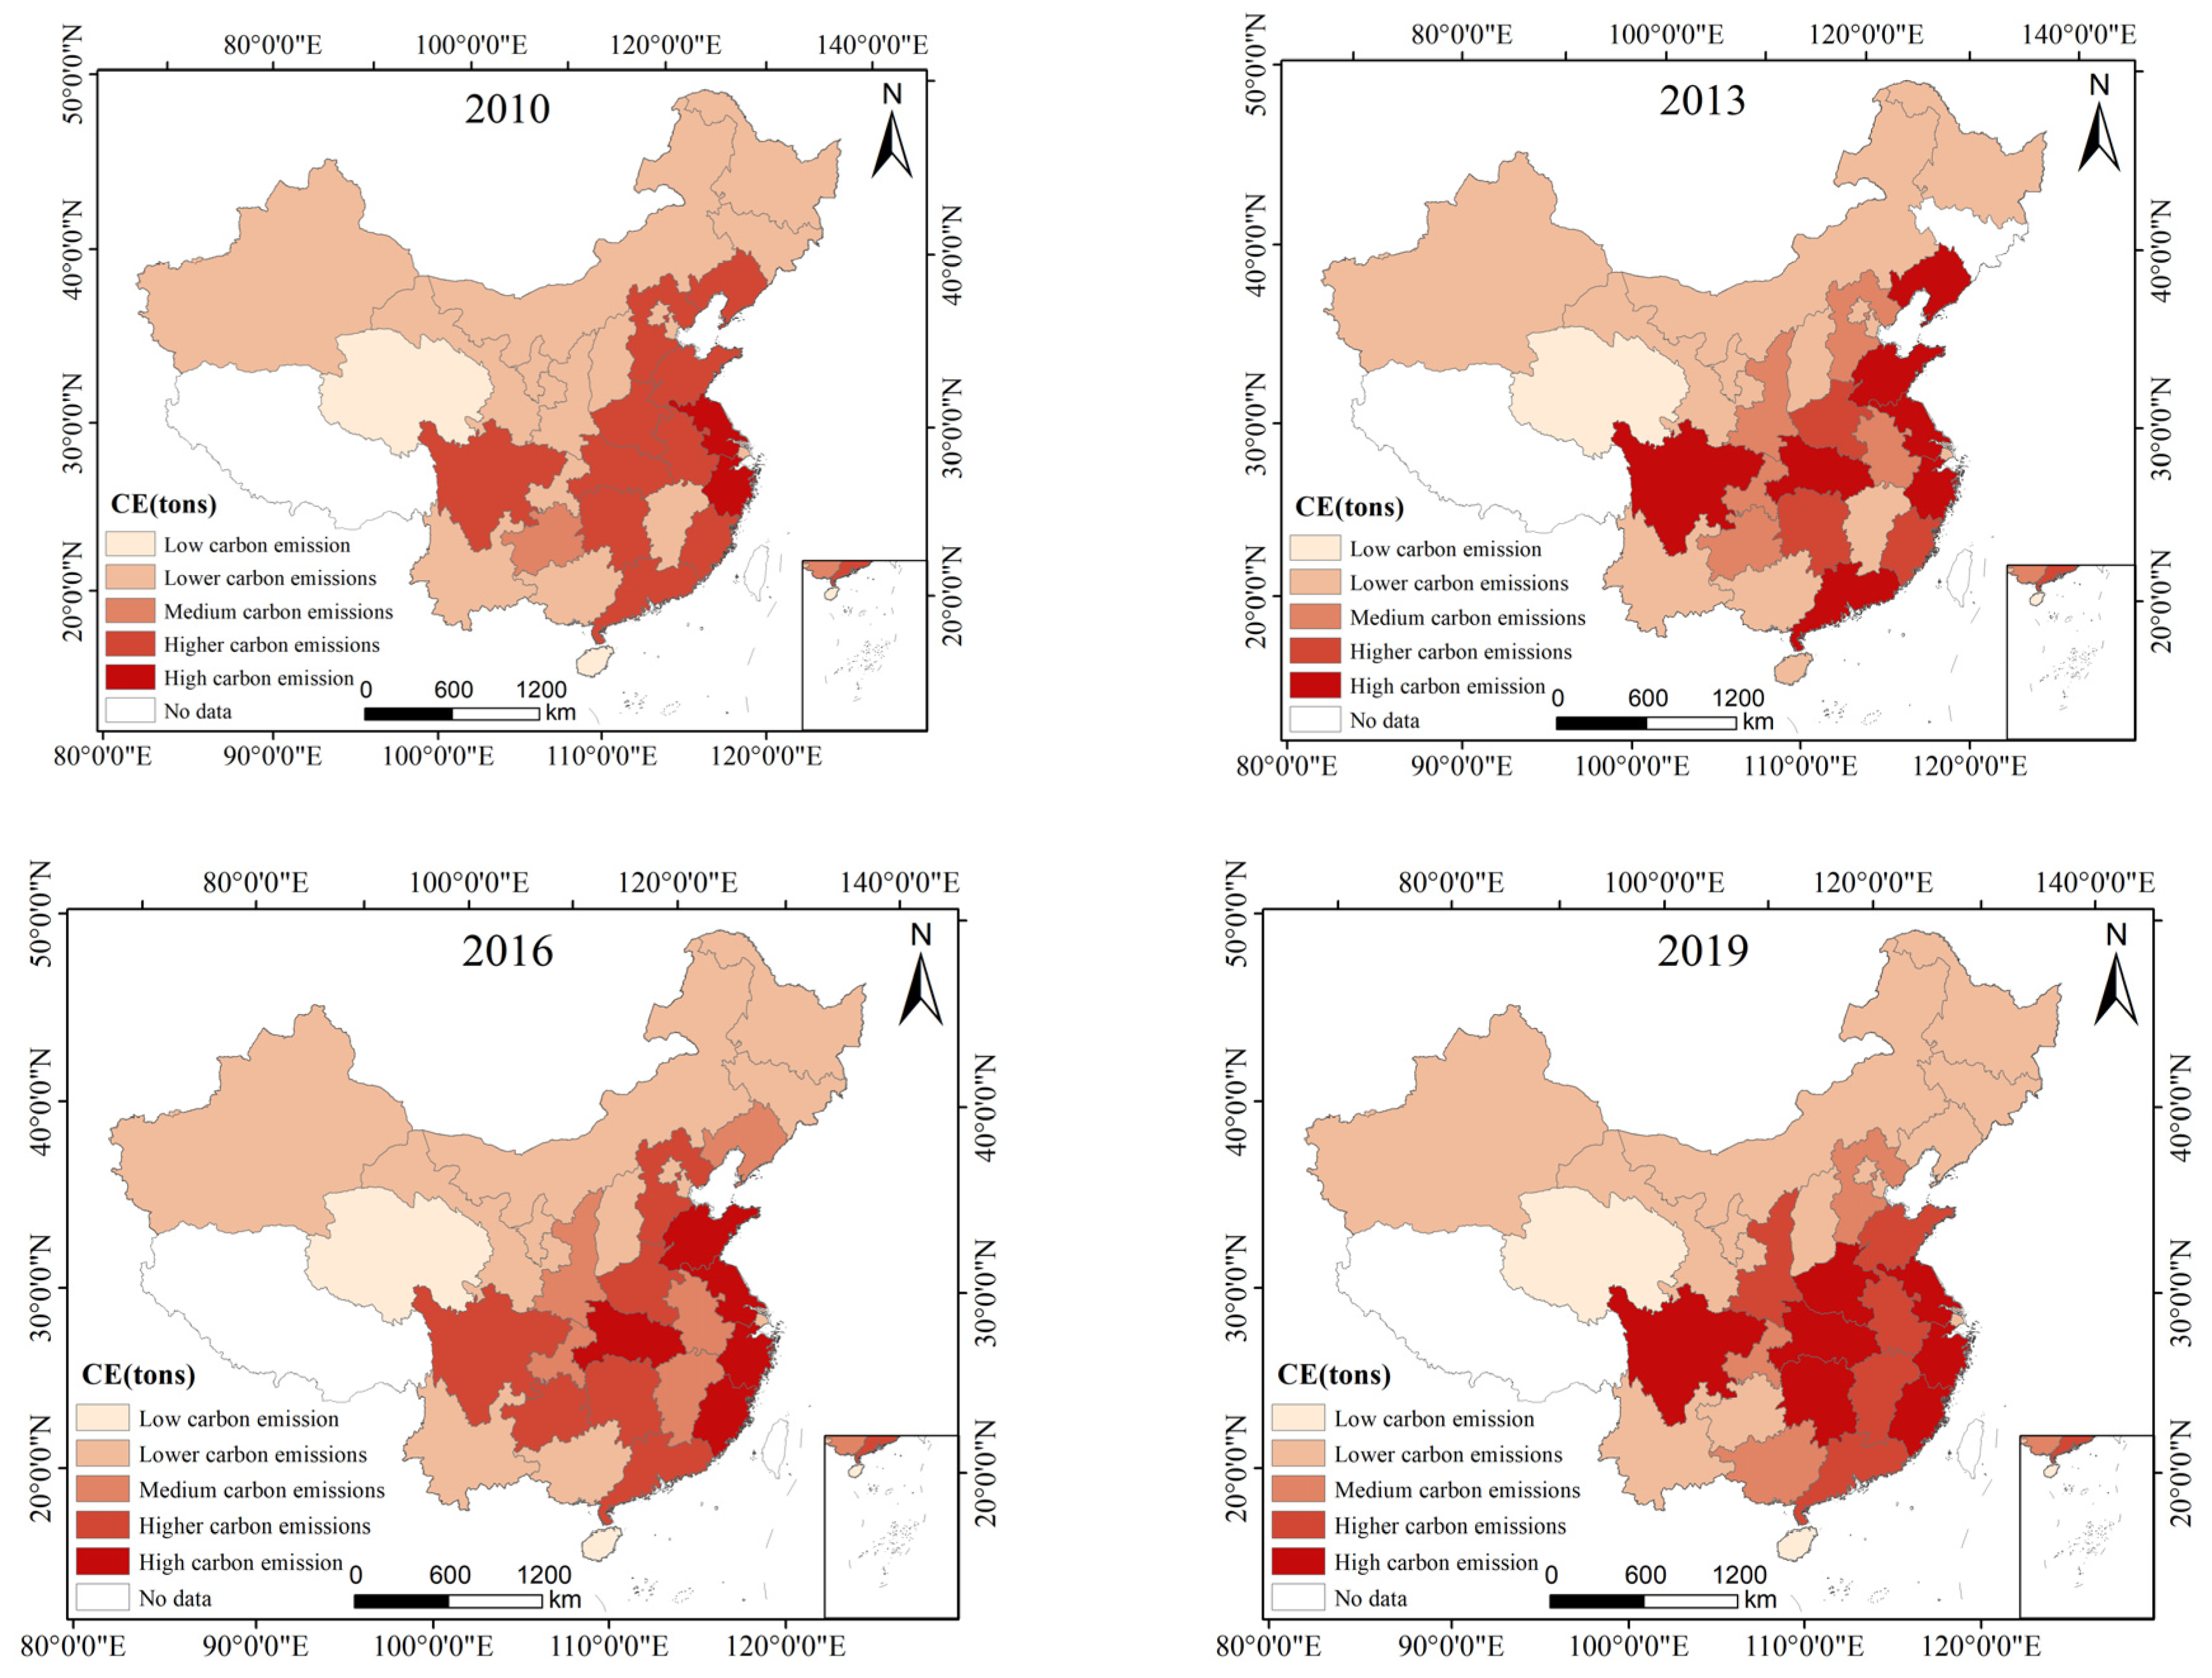
4.1.1. Examining How Carbon Emissions in the Construction Sector Have Changed over Time and Space

As shown in Figure 2, total carbon emissions peaked in 2013, then fluctuated, but the overall trend was down. Total carbon emissions increased year by year between 2010 and 2013, then decreased significantly in 2014, increased again in 2015, and remained relatively stable after 2016; direct carbon emissions were relatively low and stable throughout the study period, with little change. This indicates that the contribution of direct carbon emissions to the total carbon emissions of the construction industry is relatively small, and the control is more effective; indirect carbon emissions reached their highest value in 2013, and have since decreased and remained at a relatively stable level. The trend of indirect carbon emissions is similar to that of total carbon emissions, indicating that indirect carbon emissions are the main driving factor for changes in total carbon emissions.
Total and indirect carbon emissions peaked in 2013 and then gradually declined, suggesting that the policies and measures adopted during this period may have had a positive effect on carbon emission control. However, direct carbon emissions have remained relatively stable, and it is recommended that control measures on direct carbon emissions be further strengthened. The analysis shows that indirect carbon emissions are the main factor affecting total carbon emissions, so further energy-saving and emission reduction measures need to be taken in the production, transportation, and construction of building materials, to improve the efficiency of energy use and to promote green building technologies to reduce carbon emissions.
In order to further analyze the spatial pattern of carbon emissions from the construction industry at the provincial level, this study adopts the ArcGIS natural discontinuity grading method to classify the carbon emissions of the 30 provinces in the country into low carbon emission (5 million tons to 40 million tons), medium carbon emissions (40 million tons to 65 million tons), higher carbon emissions (65 million tons to 12 million tons), and high carbon emissions (>37 million tons). As shown in Figure 3, the findings demonstrate how the construction industry’s energy consumption and carbon emissions during a four-year period changed, with “high in the east and low in the west” being the predominant characteristics.
Of them, there was a notable increase in the carbon emission of energy consumption in the construction industry between 2010 and 2013. Approximately 47% of the area is in the lower carbon emission area, and there is less distribution in the medium and above the carbon emission area. The higher carbon emission area and the high carbon emission area are located in the central and eastern regions, forming the high carbon emission core that is represented by the “Jiangsu-Shanghai-Zhejiang”: a core that is high in carbon emissions. The majority of regions saw a slow decline in carbon emissions from energy consumption in the construction industry between 2013 and 2016, particularly Liaoning, Sichuan, Guangdong, and other provinces that actively implement policies aimed at reducing energy consumption and emissions, deeply optimize building designs, and promptly promote the use of low-carbon building materials. However, between 2016 and 2019, a small number of regions saw an increase in carbon emissions from the construction industry, with Sichuan, Henan, and Hunan changing from higher to higher carbon emission areas.
Overall, the trend of carbon emissions from the construction industry in the country’s northern and southern regions is fairly stable, with the majority of these regions falling within the lower carbon emission zone. In contrast, the central and eastern regions of the nation exhibit uneven fluctuations in carbon emissions from the construction industry, with relatively high levels of emissions in these regions.

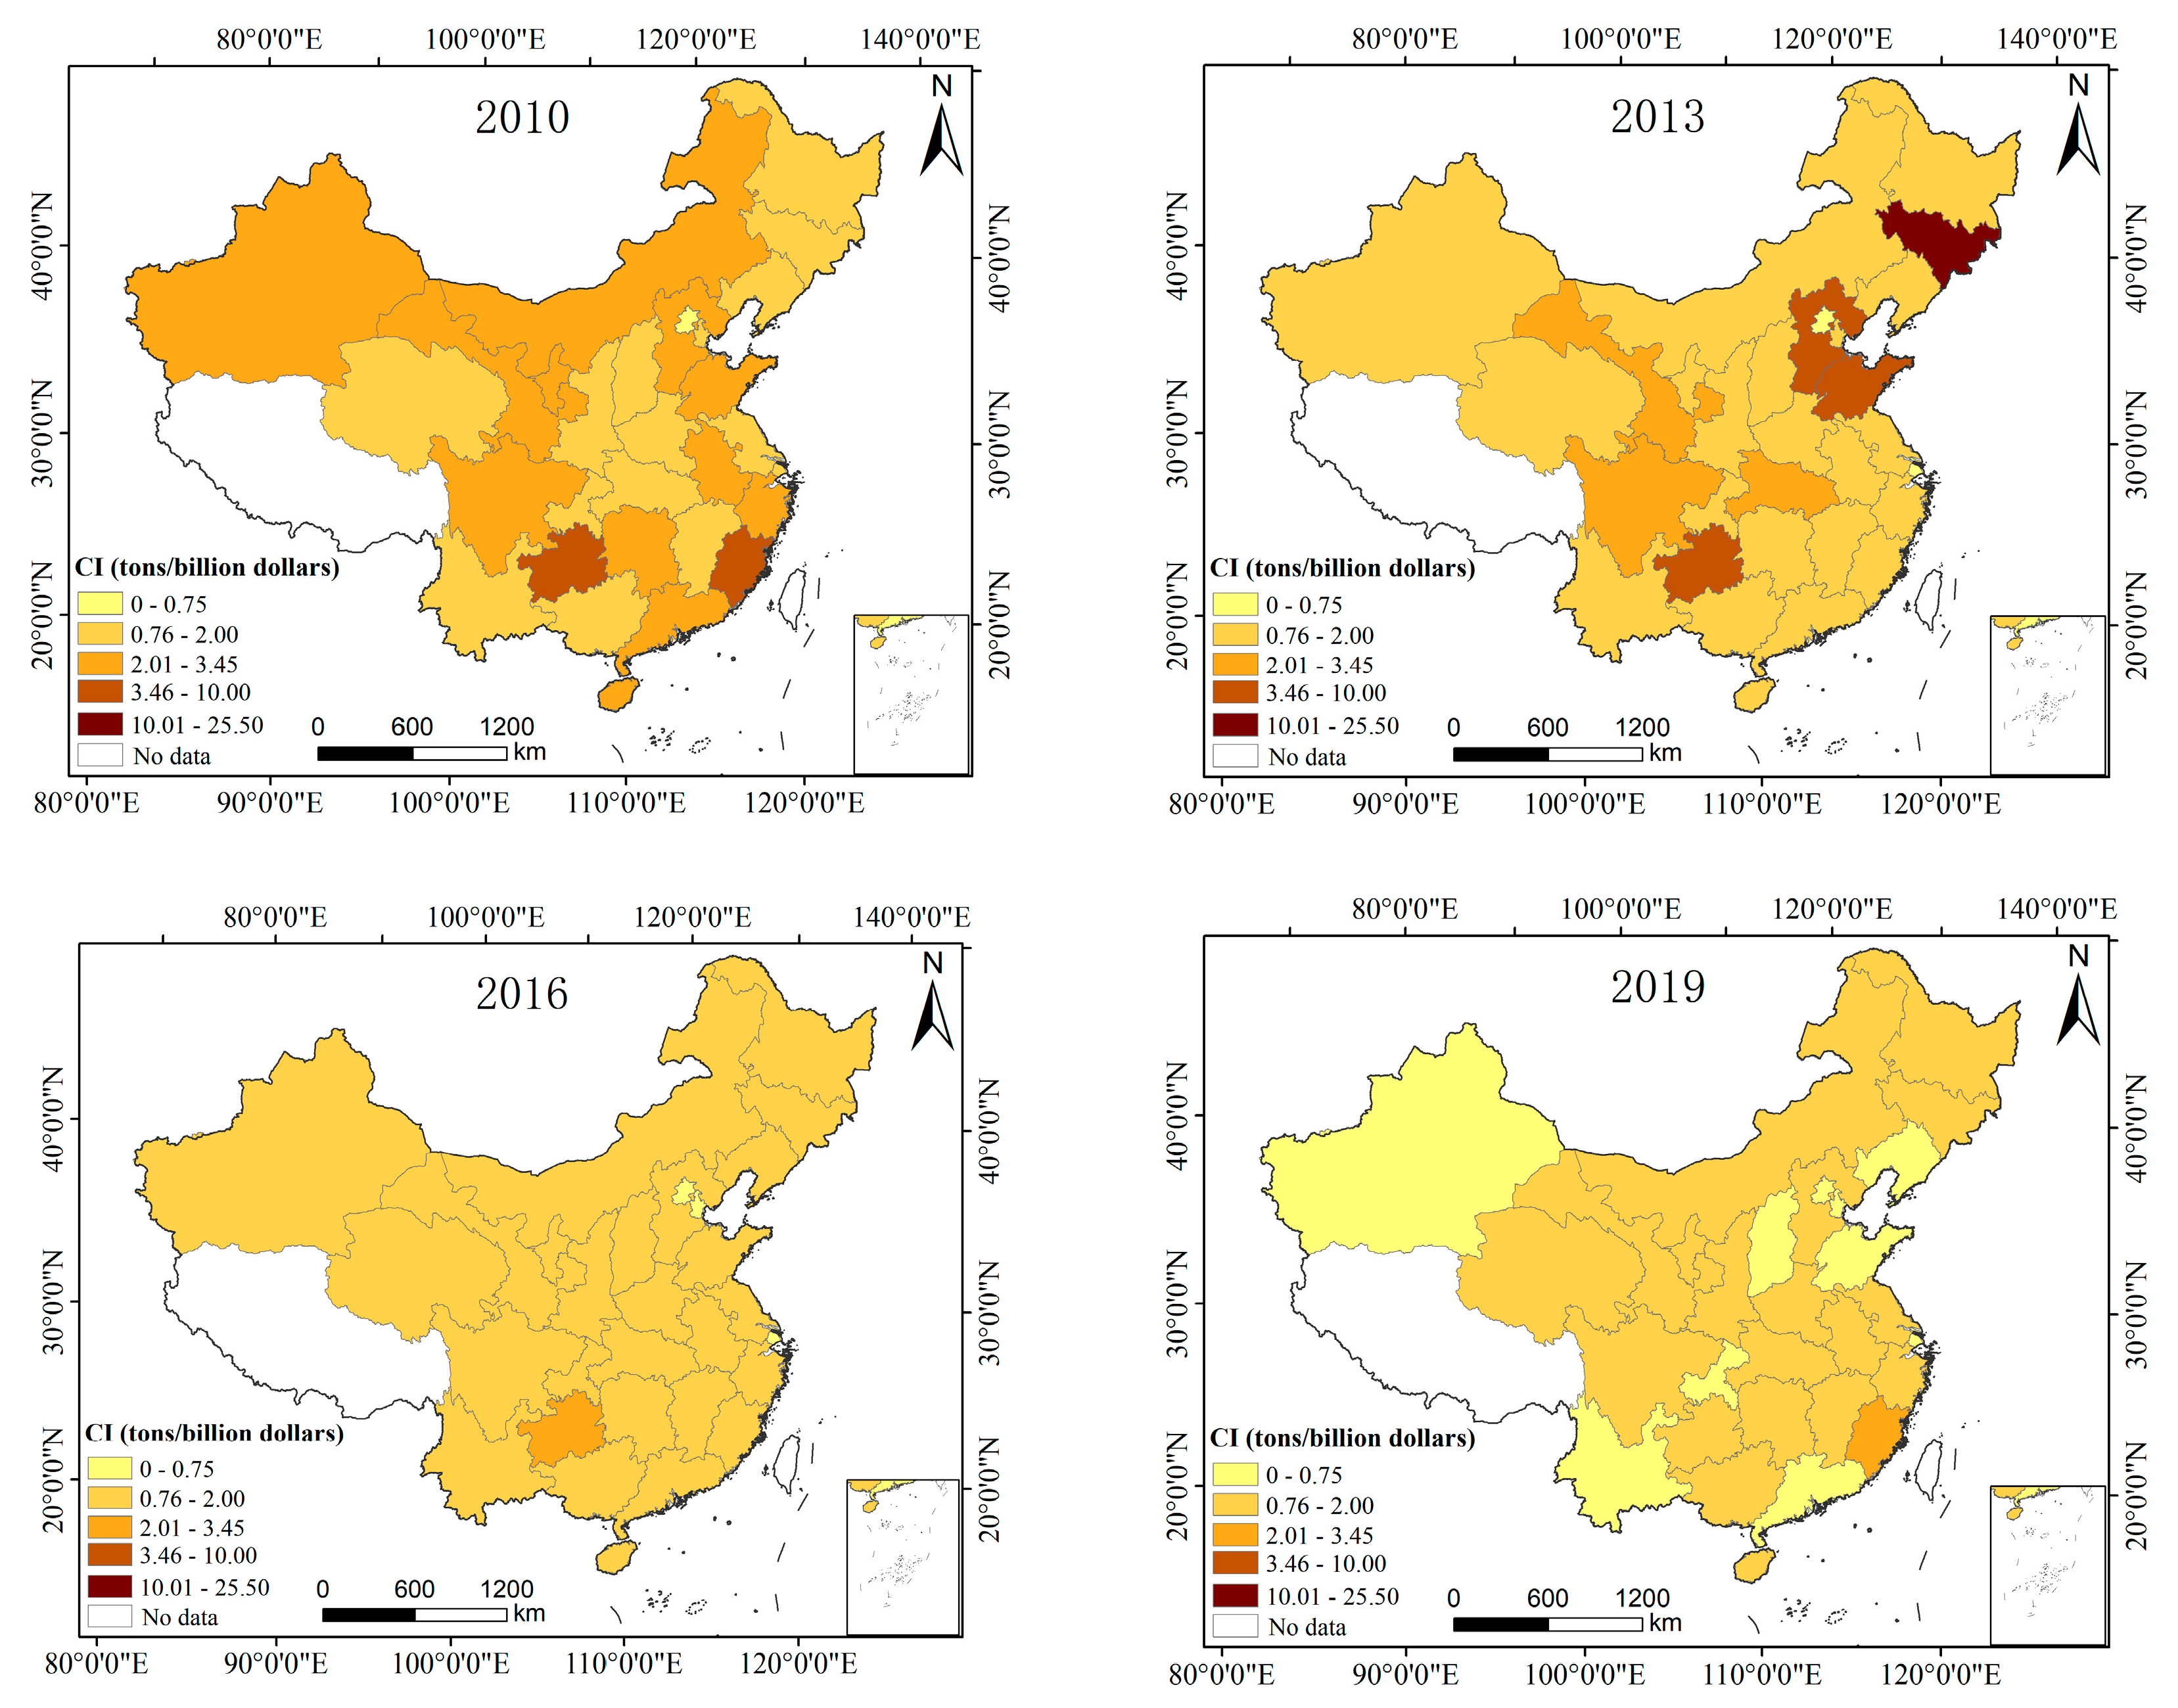
4.1.2. Examining How Carbon Emission Intensity Has Changed over Time and Space in the Construction Sector

Figure 4 depicts the spatio-temporal evolution of China’s construction industry’s carbon emission intensity from 2010 to 2019. The findings indicate that, overall, between 2010 and 2019, China’s construction industry’s carbon emission intensity decreased. This is because, as China’s socioeconomic development accelerated, the country’s construction industry’s production scale continued to grow, its energy structure and regional layout were optimized, and its energy efficiency was effectively increased. All of these factors have positively impacted the low-carbon construction industry’s steady development. There are still a few provinces where the construction industry’s carbon emission intensity is growing significantly, like Jilin, Beijing, and Hebei. From 2013 to 2019, the national construction industry’s carbon emission intensity is roughly following a gradual downward trend. From 2010 to 2013, parts of the northwest and southeast regions showed a slow decline in the industry’s carbon emission intensity.
However, some provinces in the country’s north and center have a relatively high share of carbon emissions intensity from the construction industry during the 2010–2019 period, and this share does not clearly trend downward, suggesting that carbon emissions from the construction industry have not been effectively curbed in these regions. The primary energy source in the north is coal, which is also a major contributor to the region’s high carbon emissions. Coal is a crucial raw material used in the manufacture of building materials, and during combustion it releases a significant amount of carbon dioxide and other greenhouse gases. China should support green construction technologies in order to lower carbon emissions and increase energy consumption efficiency.

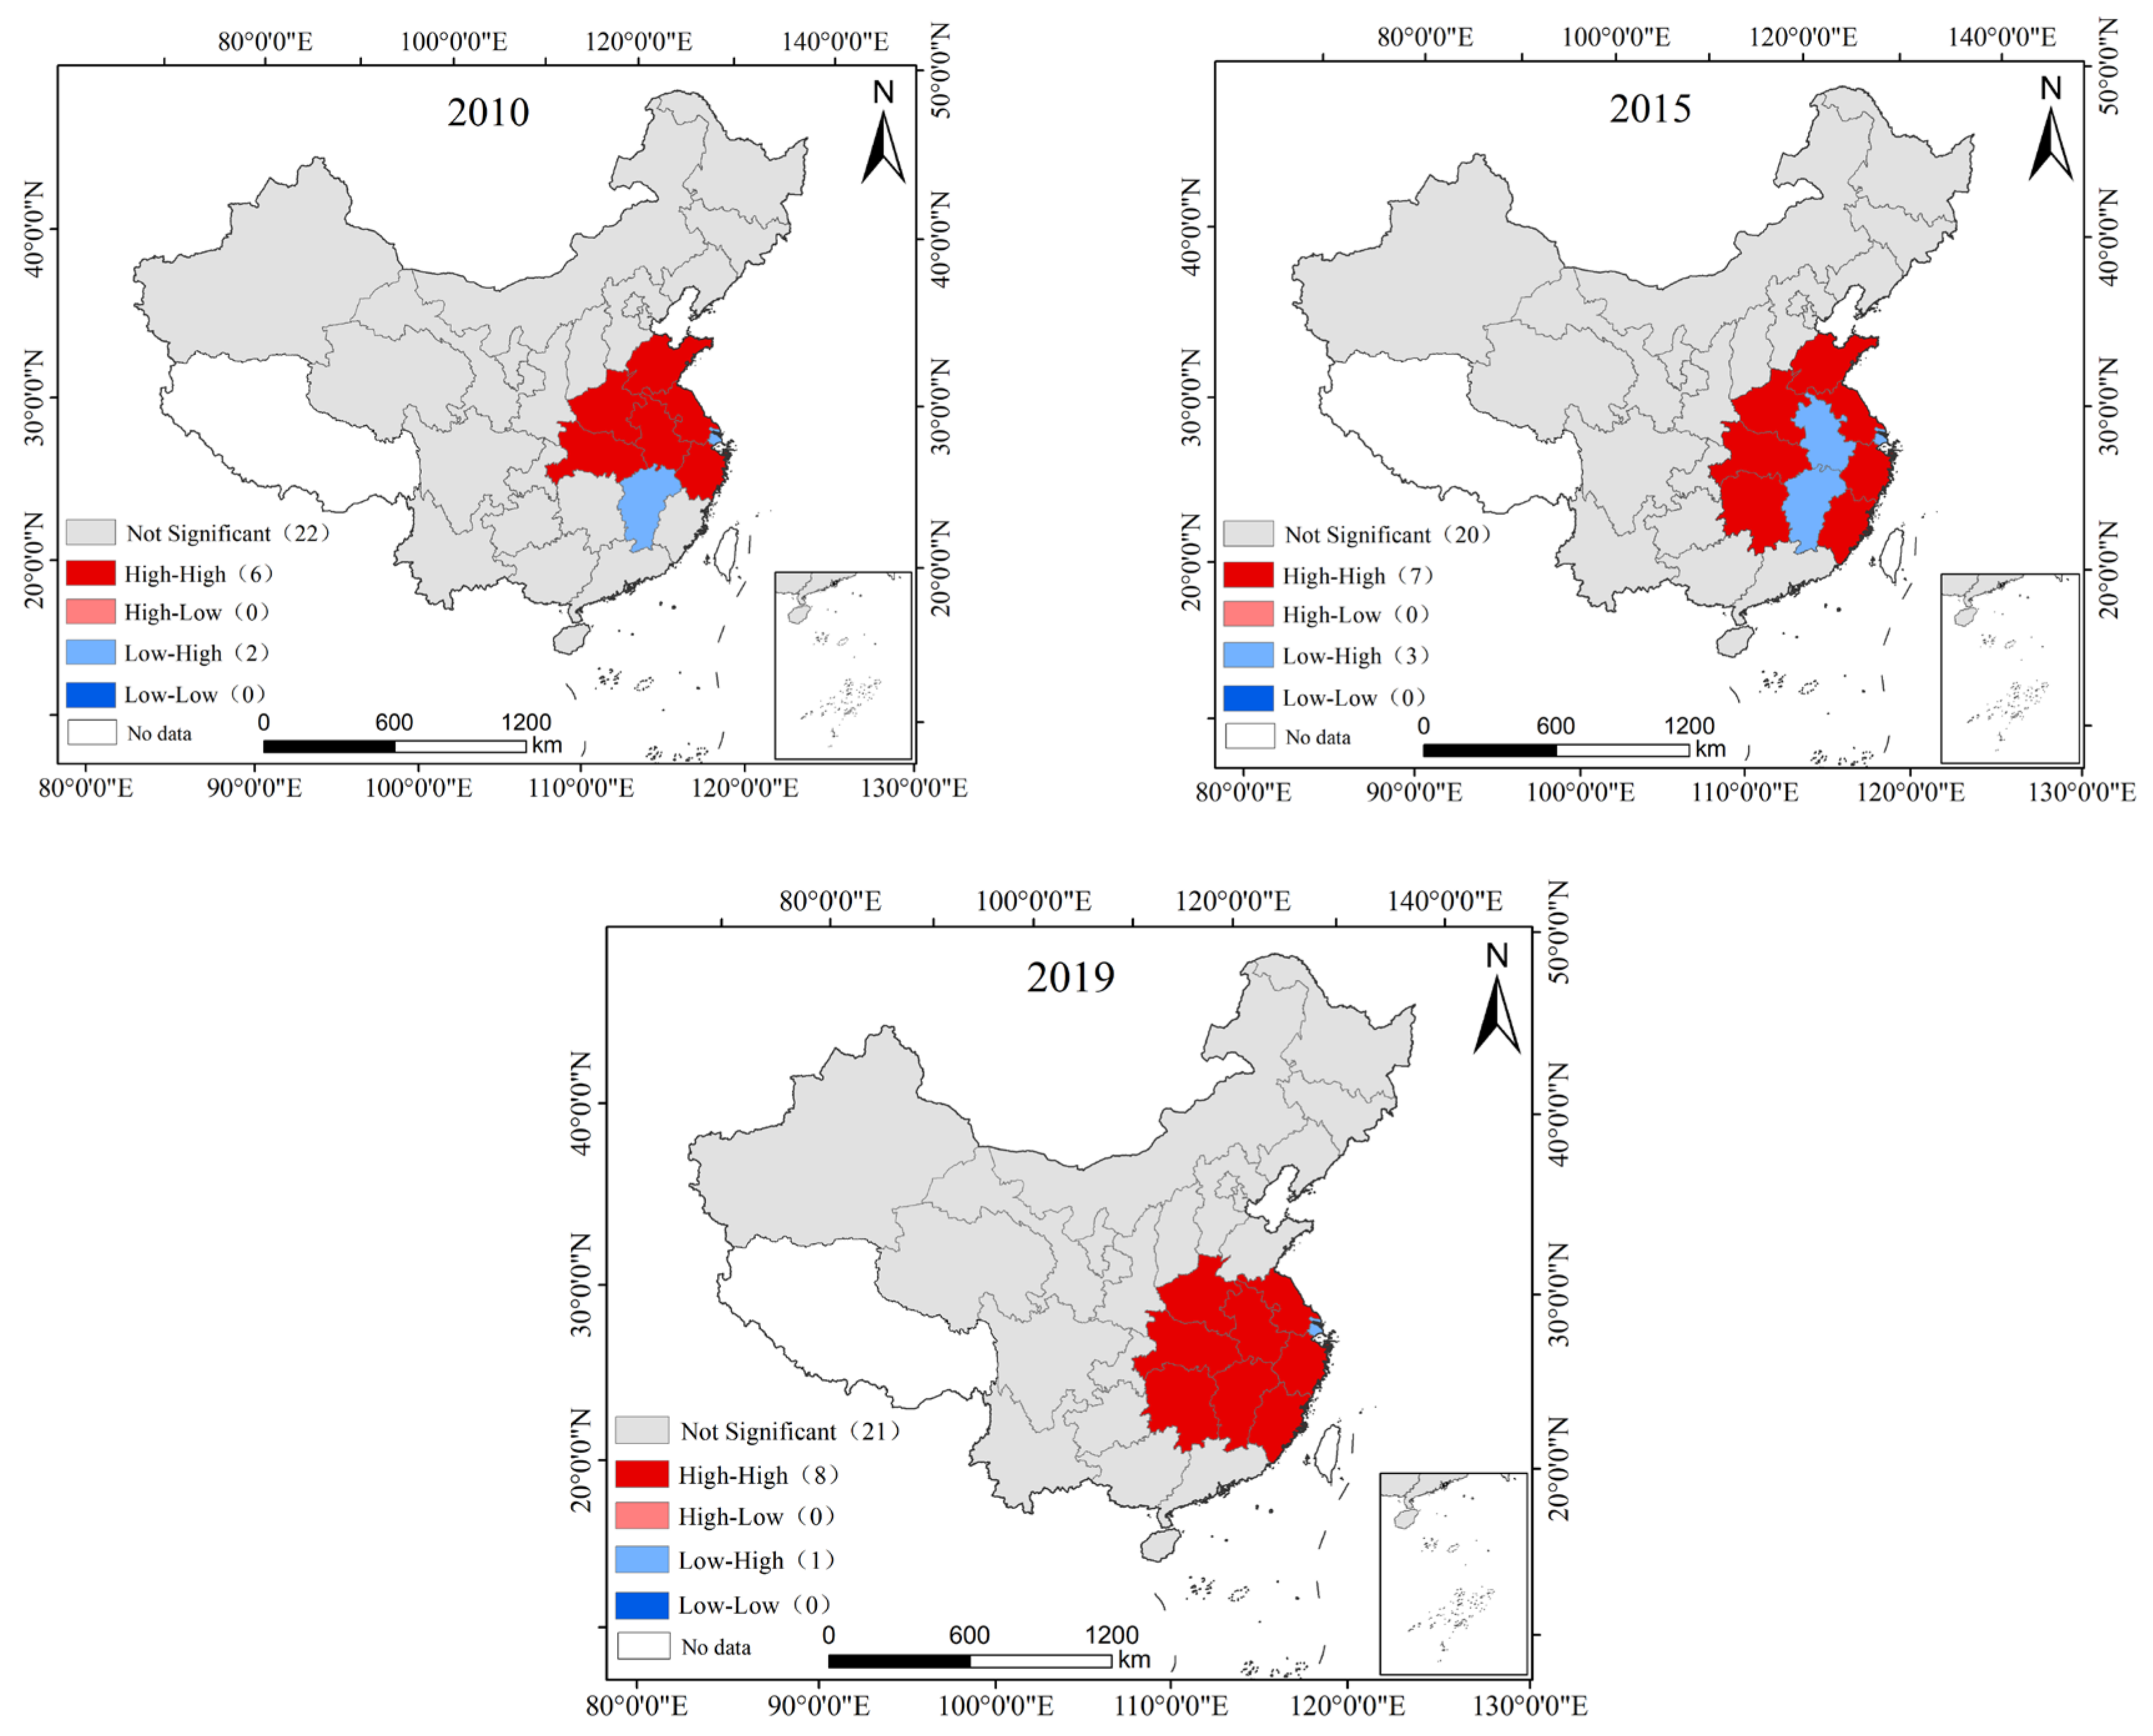
4.1.3. Spatial Autocorrelation Analysis of Carbon Emissions from the Construction Industry

Table 4 shows the results of the global Moran’s Index (MI) for the period 2010–2019 and includes the Z-scores and p-values for each year. The results show that the Moran’s Index and Z-scores fluctuated considerably from 2010–2015, indicating that the spatial autocorrelation was unstable during this period, and the p-values approached or exceeded 0.05 on several occasions, showing that the spatial autocorrelation was not significant in some years. The Moran’s Index and Z-scores were significantly higher and the p-values were lower than 0.05 for the period of 2016–2019, especially for the years of 2018 and 2019, which show stronger and significant spatial autocorrelation in these years. Overall, Table 4 shows that spatial autocorrelation is significantly stronger in the country after 2016, especially in 2018 and 2019, with the highest Moran’s index and Z-scores and the lowest p-values, indicating that spatial autocorrelation is most significant in these two years.
This study conducted a localized autocorrelation analysis of carbon emissions from China’s provincial-level construction industry from 2010 to 2019 to derive the spatial distribution of the types of provincial-level construction industry carbon emissions clusters. As shown in Figure 5, the results indicate that the distribution of localized agglomeration is similar in the three study years. From 2010 to 2019, the “high-high” agglomeration areas gradually expanded, especially in the central and eastern provinces, indicating that the spatial agglomeration effect of carbon emissions from the construction industry in these regions increased. The year 2015 saw more “low-high” agglomeration areas, mainly in the coastal areas, but by 2019, more “low-high” agglomeration areas appeared, mainly in the coastal areas, and by 2019, more “low-high” agglomeration areas appeared. In 2015, more “low-high” agglomerations appeared, mainly in coastal areas, but decreased by 2019, indicating a change in the correlation between the level of low-carbon emissions and high-carbon emission areas in these regions. “High-low” agglomerations and “low-low” agglomerations are almost absent, indicating that the spatial correlation between high-carbon-emitting regions and low-carbon-emitting regions, and between low-carbon-emitting regions and low-carbon-emitting regions has weakened. Although there are fluctuations in the non-significant regions, most of the provinces have been in a non-significant state, indicating that there is no significant spatial clustering effect of carbon emissions in these regions. In 2010, 2015, and 2019, China’s provincial-level carbon emissions from the construction industry showed a significant spatial clustering effect, especially in the central and eastern provinces. Over time, the spatial correlation of high-carbon-emitting regions gradually increased, while the correlation of low-carbon-emitting regions fluctuated. Understanding these changes is important for formulating regional carbon emission reduction policies.

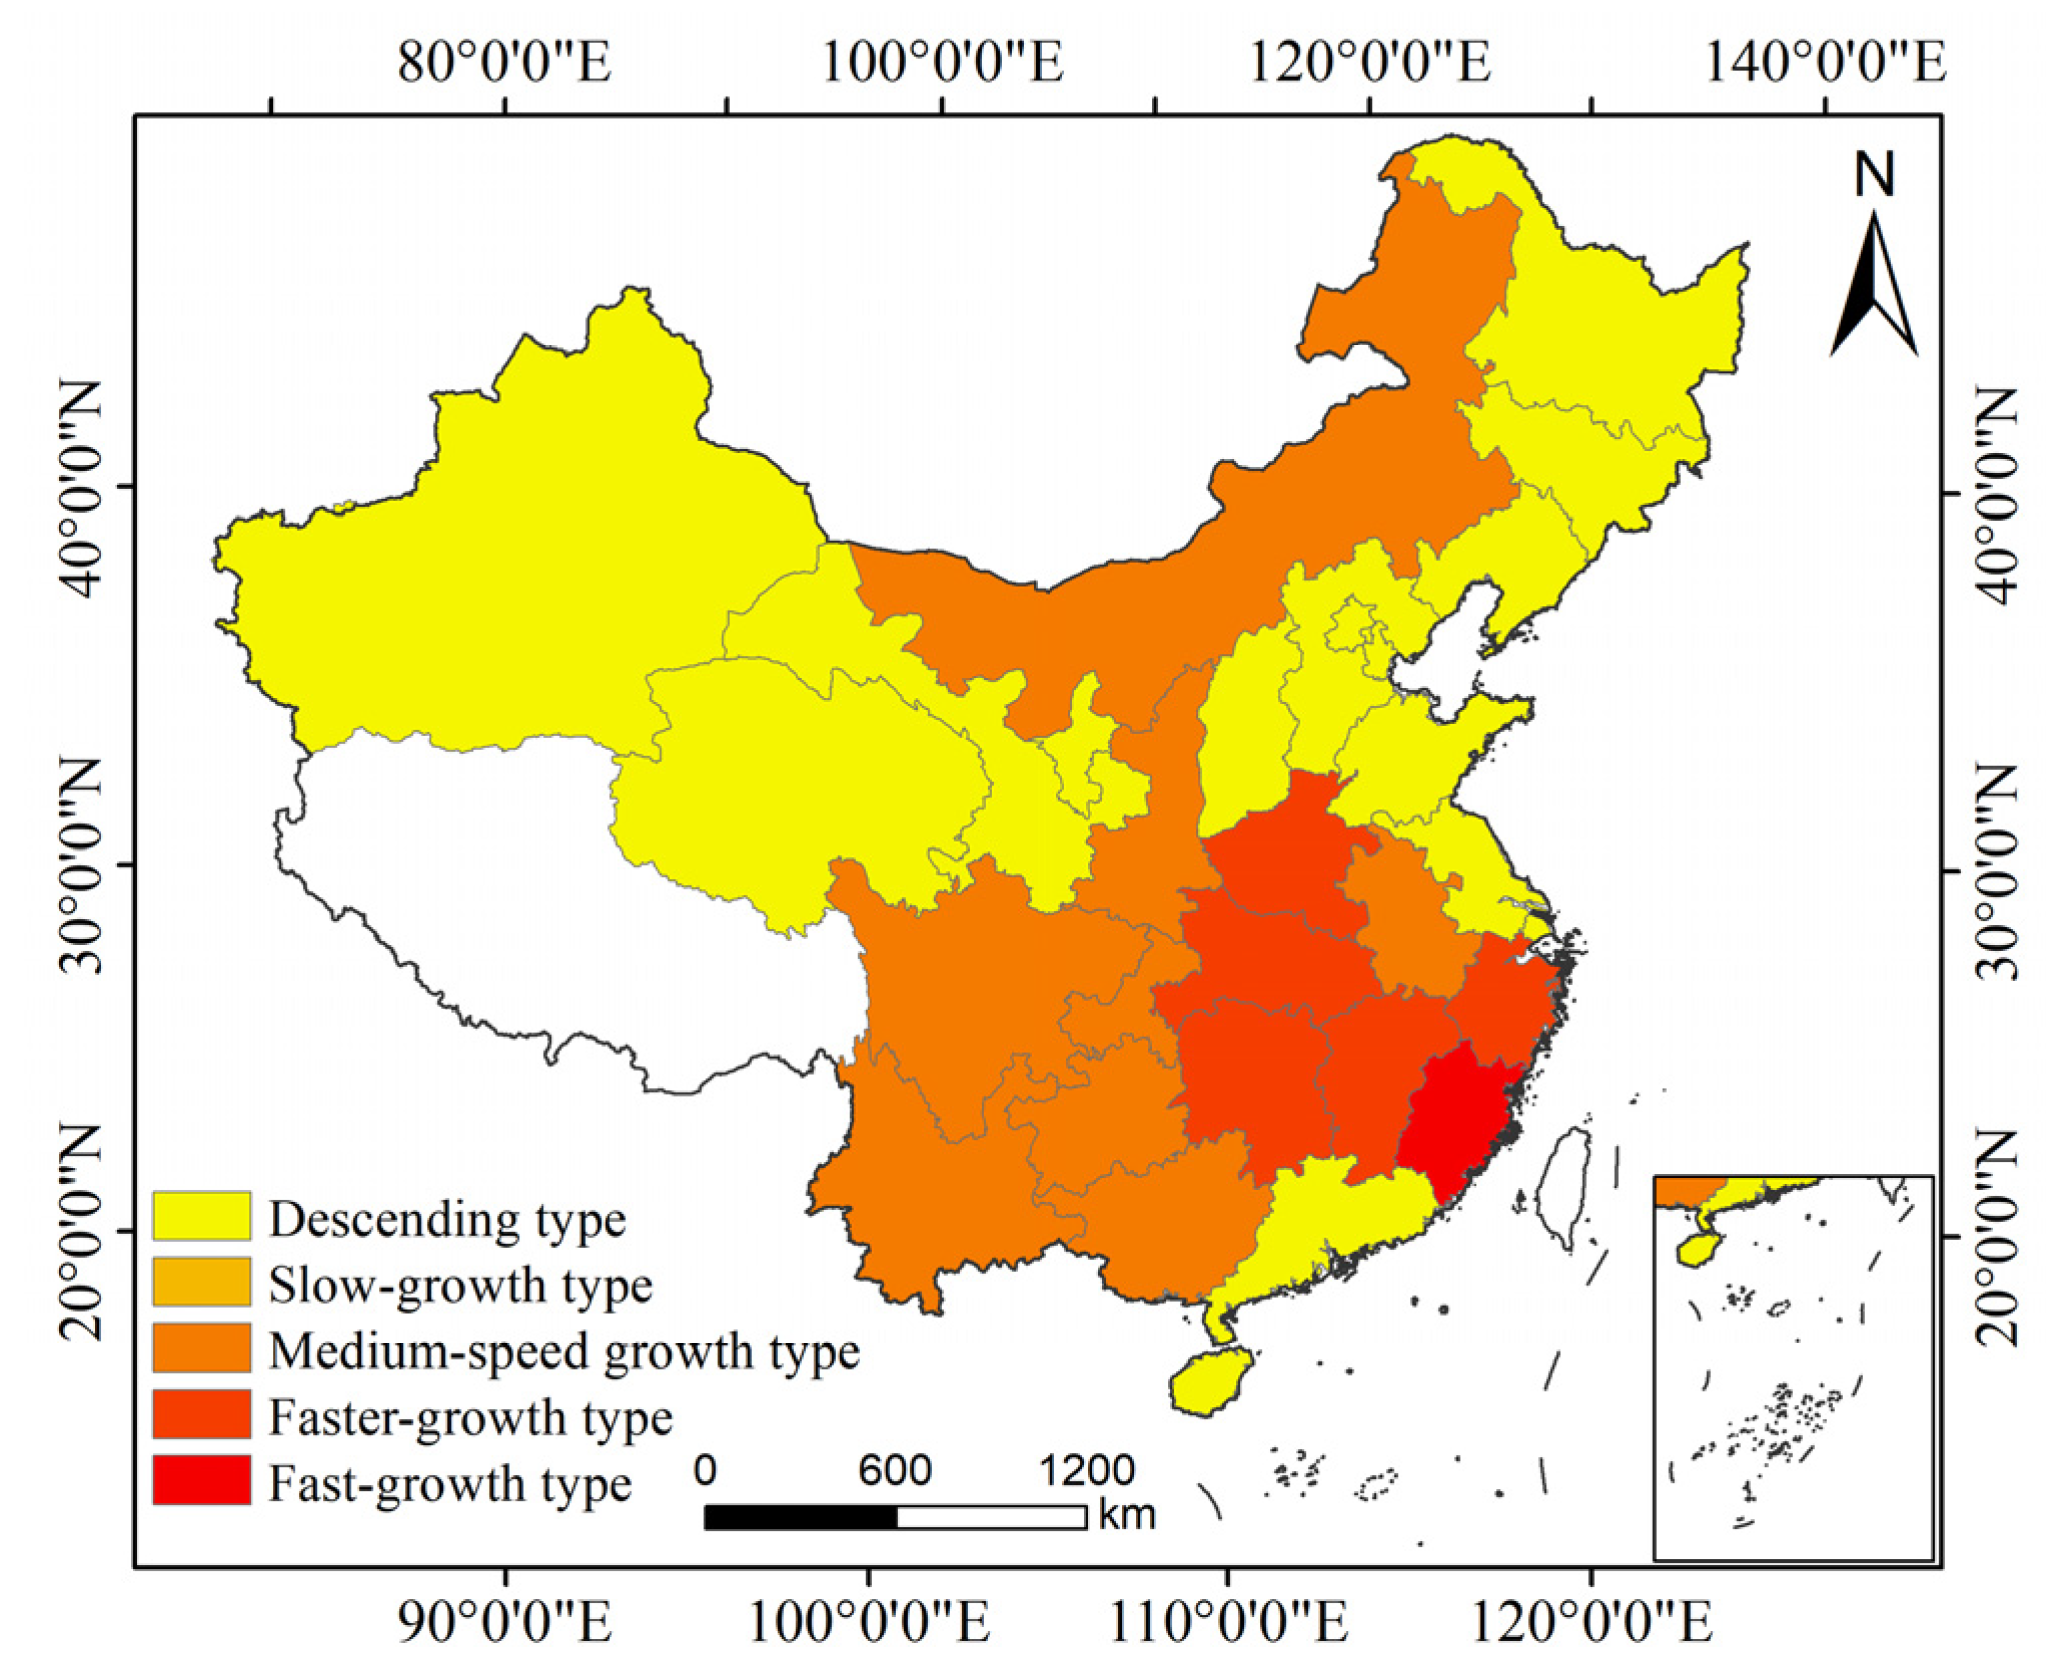
4.2. Examining the Historical Development of Carbon Emissions in the Construction Sector

The amount of change in China’s provincial-level carbon emissions from the construction industry between 2010 and 2019 is classified into five types using the ArcGIS natural discontinuity grading method: declining, slow-growing, medium-growing, faster-growing, and rapid-growing. This classification is based on the calculation of the slope value of China’s provincial-level carbon emissions from the construction industry. Figure 6 illustrates that, between 2010 and 2019, the construction industry in China accounted for almost 53% of provincial carbon emissions, with the majority of these emissions occurring in the country’s northern and western areas and a little amount in its coastal regions. The construction industry’s carbon emissions are on the rise in about 47% of the provinces, with more medium-speed growth occurring primarily in the north and south-central regions of the nation; fewer fast-growing provinces, such as Henan, Hubei, Hunan, Jiangxi, and Zhejiang, are found in the eastern part of the nation; Fujian Province is the only province experiencing rapid growth in carbon emissions from the construction industry.

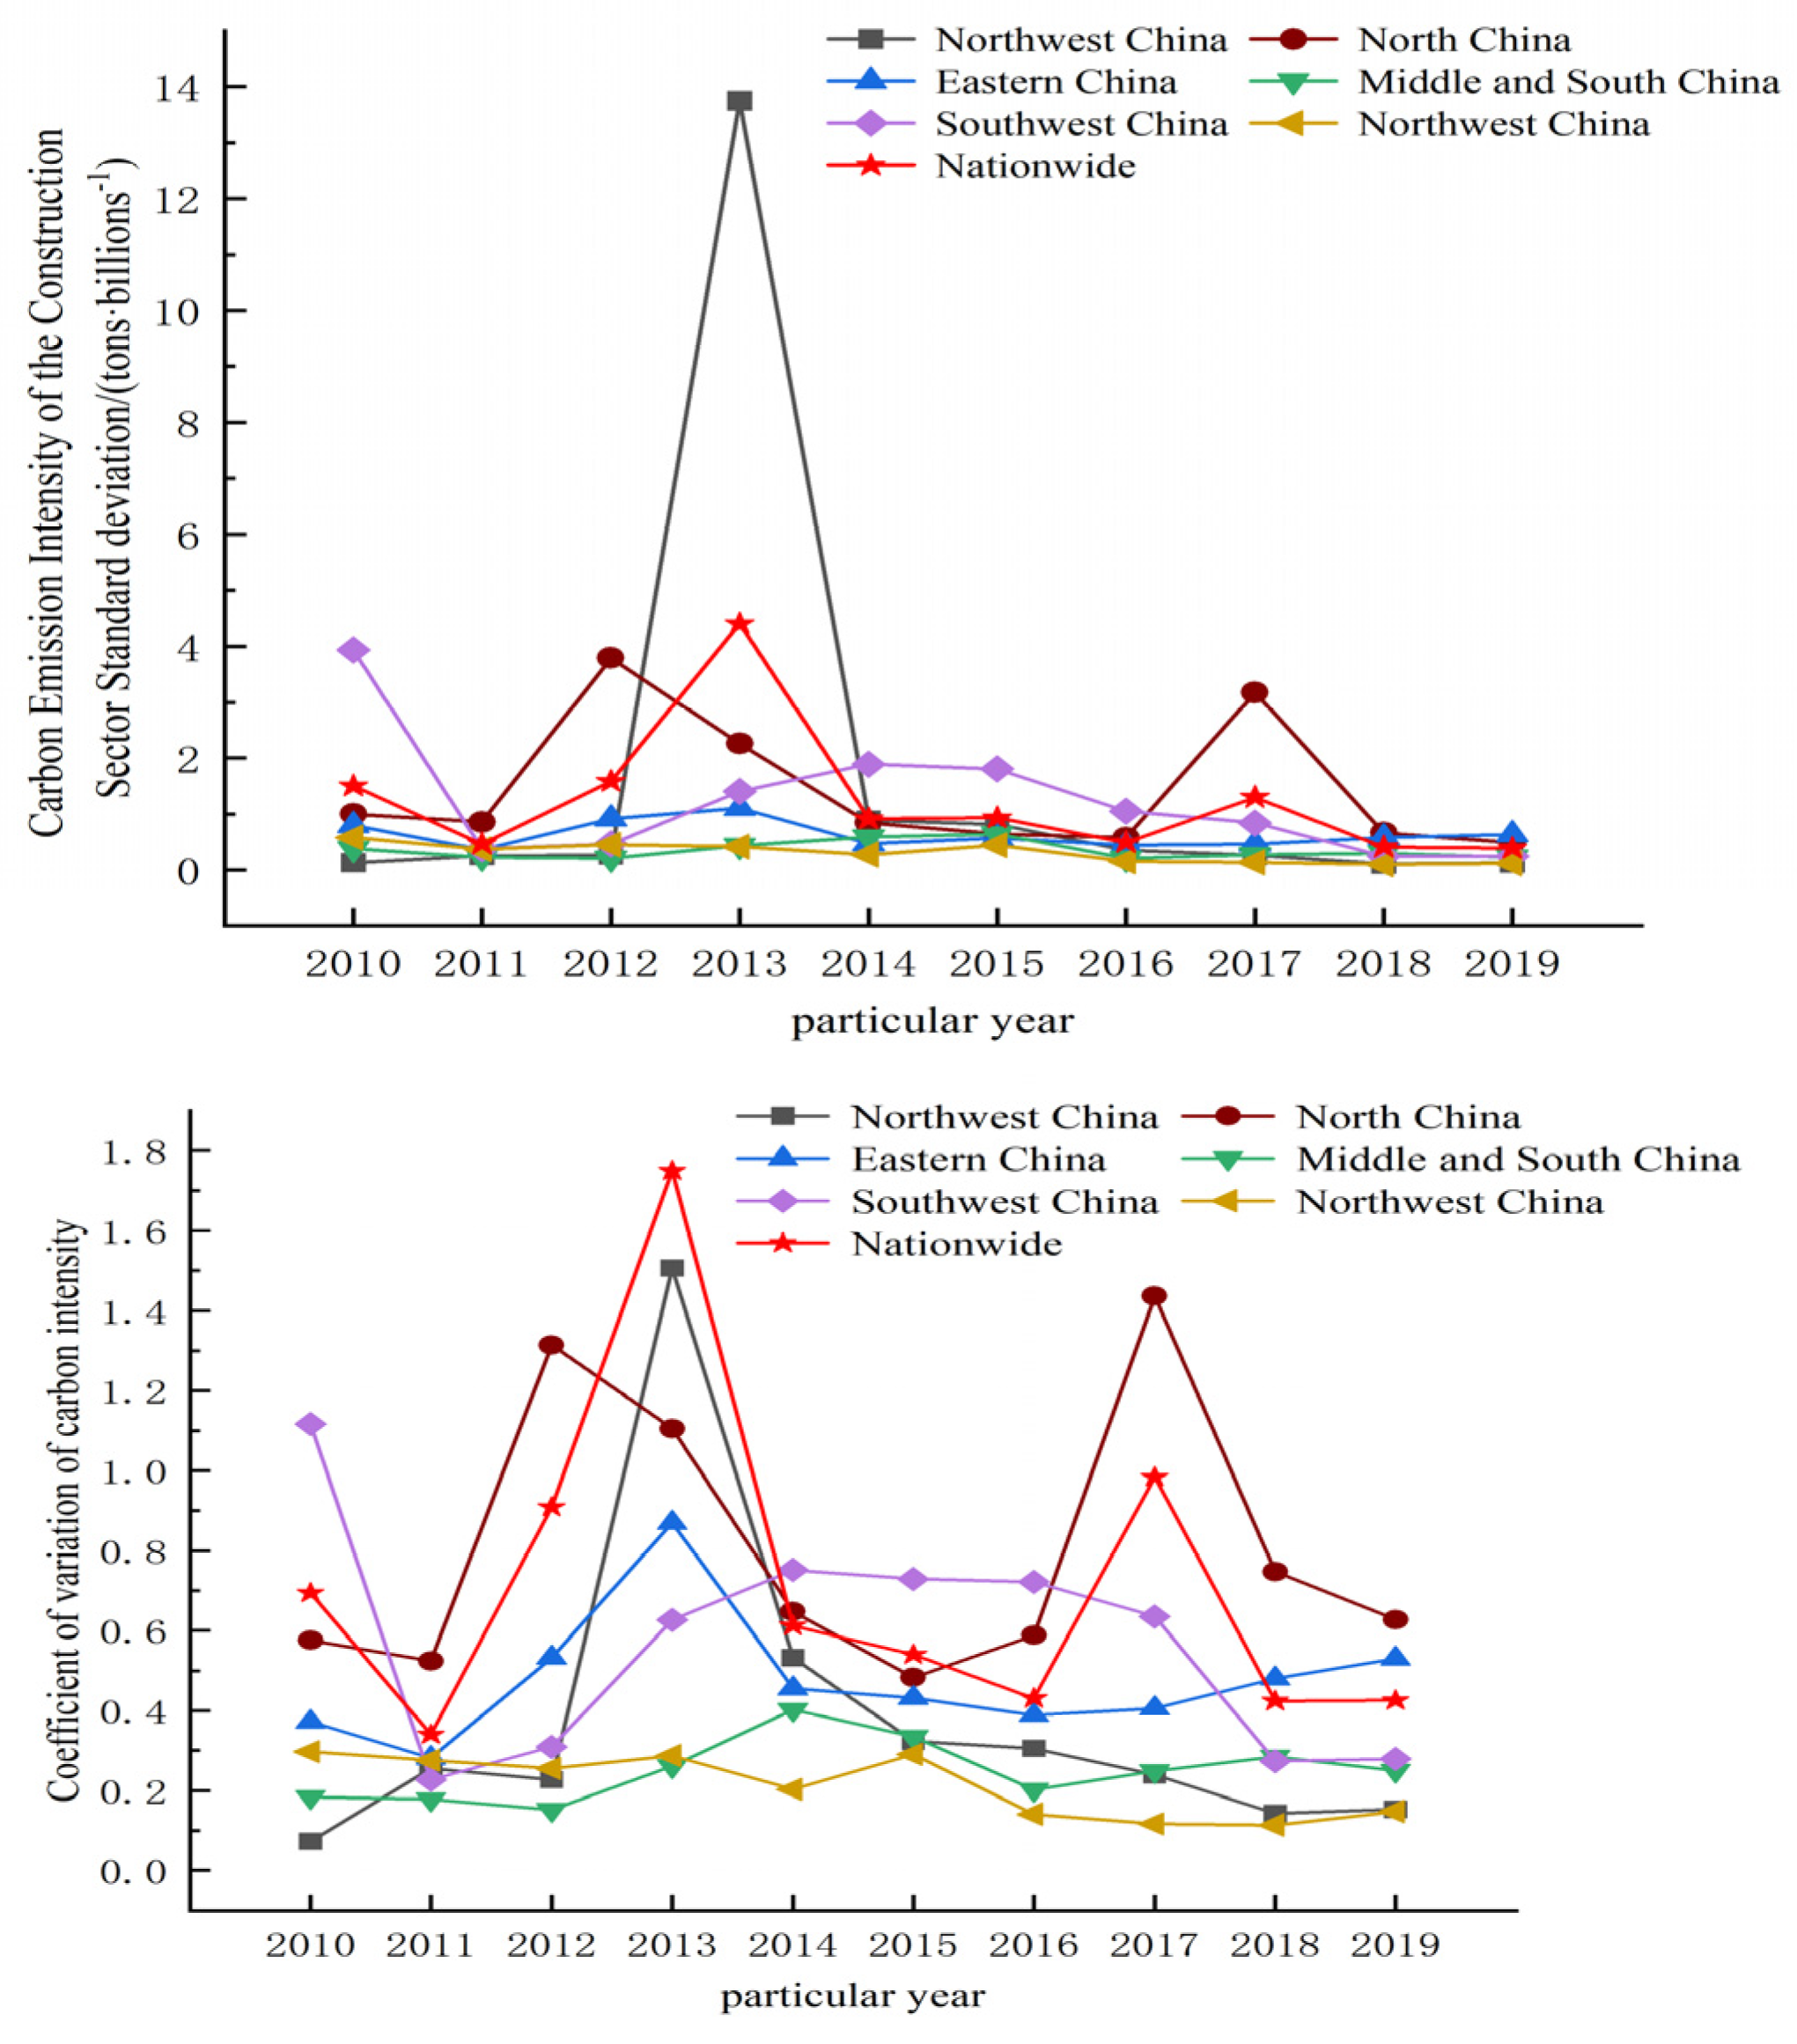
4.3. Differential Examination of Carbon Emissions in the Construction Sector

To provide additional insight into the spatial variability of China’s construction industry’s carbon emission intensity and evaluate the stability of that intensity, this study computes the industry’s standard deviation and coefficient of variation. Based on these values, line graphs of the two types of data are plotted independently, and Figure 7 illustrates the specific trend of the change.
At the national level, the standard deviation and coefficient of variation in carbon emission intensity in the construction industry showed fluctuation during 2010–2019. The standard deviation declined and then increased during 2010–2013, with the fastest growth rate in 2012–2013, reaching a maximum value of 4.399; a rapid decline occurred in 2013–2014, and the change was stable in 2015–2019. The coefficient of variation grew rapidly in 2011–2013 and 2016–2017, reaching a maximum of 1.75, indicating that there are large differences in carbon emission intensity between enterprises or projects.
At the regional level, the standard deviation in east China, central and south China, and northwest China varied more steadily, mainly between 0.1 and 0.6; northeast China fluctuated significantly from 2012 to 2014, with the highest value of 13.747, which was mainly affected by factors such as the diversity of building projects and energy-saving measures. To reduce the standard deviation, low-carbon buildings and sustainable development strategies need to be implemented. The standard deviation in north China and southwest China is microscopic, and the coefficient of variation in north China fluctuates greatly, increasing and then decreasing in 2011–2014 and 2015–2019, and the coefficient of variation is higher than that in other regions in most time periods, which shows that the intensity of carbon emissions is fluctuating greatly and there is instability and risk.

4.4. Examining the Variables Influencing Carbon Emissions in the Construction Sector

Equations (10)–(14) in this study’s LMDI decomposition model are used to break down the influencing elements of carbon emissions from energy consumption in the country’s construction industry. The results are displayed in Table 5. In general, the national construction industry’s carbon emissions are more positively impacted by economic development and the area where housing is being built than they are negatively impacted by energy structure, energy intensity, and population density. Of them, the negative effect value shows that there is a negative correlation between an influencing factor and carbon emission, and the positive effect value shows that there is a positive correlation between an influencing factor and carbon emission. The larger the positive effect value, the more carbon emission is caused.
(1) Energy structure typically has a beneficial influence on carbon emissions from the construction sector when considering the impact of energy structure intensity on carbon emissions from the industry. Four factors primarily indicate how energy structure affects carbon emissions in the construction industry: energy type, energy efficiency, energy price, and technical advancement. Different energy sources have varying carbon emission intensities; for instance, coal has substantially higher carbon emissions than renewable energy sources like solar and wind power. If the energy structure of the building industry contains too little coal, then carbon emissions will also be reduced; the energy efficiency of various energy sources varies. The construction industry’s carbon emissions may decrease if it uses more electricity in its energy structure, as electricity has a higher energy efficiency than coal. The construction industry’s energy choices are also influenced by energy prices. In general, energy is expensive and has a high carbon intensity. As a result, the construction sector may switch to using less expensive and less carbon-intensive energy, which reduces carbon emissions. Technological advancements will also have an impact on the energy structure of the construction sector. The cost of renewable energy is steadily coming down as technology progresses, which enables the construction sector to use more renewable energy and thereby cut carbon emissions.
(2) When considering how energy consumption intensity affects carbon emissions in the construction sector, it is important to note that the three main factors that contribute to this impact are energy consumption, energy efficiency, and technological advancement. The quantity of energy consumed per unit of output value is referred to as energy consumption intensity. Energy efficiency can also be reflected in energy intensity. If the energy intensity remains constant, then even if the output value is decreased, energy consumption will be decreased, resulting in a decrease in carbon emissions. Technological advancement can increase energy efficiency and decrease energy intensity. Industries with high energy efficiency can produce higher output value per unit of energy consumption; therefore, if energy intensity is lowered, energy efficiency will increase, and carbon emissions will be reduced. Energy intensity and thus carbon emissions can be decreased, for instance, by implementing energy-saving technology and equipment or by streamlining production procedures and management techniques.
(3) When considering the relationship between economic development and carbon emissions from the construction sector, it is evident that both the former and the latter have a major positive impact on carbon emissions from the sector. Additionally, economic output directly influences carbon emissions from the construction sector. In general, when economic development expands, the construction sector’s carbon emissions will rise as well. However, this link is not straightforward; rather, it is the outcome of multiple forces working together to influence various aspects of the business. The extent of construction development usually grows to incorporate infrastructure, commercial, and residential development as economic production rises. Increased energy use, the use of raw materials, and transportation associated with building activity all result in higher carbon emissions.
(4) With regard to the influence of population density on carbon emissions originating from the construction sector, there has been a gradual decline in population density in recent times, primarily due to the subsequent reasons: First, less development and use of land resources is necessary in areas with lower population densities since fewer buildings are needed to meet resident needs. As a result, the construction industry uses less energy and building materials, which lowers carbon emissions. Second, less energy is needed in places with lower population density. Building heating, cooling, and lighting energy usage will decrease in proportion to the decreased population. As a result, low-density areas typically have lower energy usage and lower carbon emissions. Third, a more dispersed and low-rise distribution of buildings is the outcome of improved planning and land resource usage in places with lower population densities. Lower building heights and dispersed layouts can cut down on building energy use, including air conditioning and elevators, and consequently lower carbon emissions when compared to high-density development zones. Carbon emissions will directly rise if these building practices and lifestyles do not embrace the ideas of energy conservation and environmental preservation. There is no one element that causes the population density to decrease; land policies, urban planning, and other factors all play a role.
(5) When considering the effect of the housing construction area on the industry’s carbon emissions, it can be observed that the building area has a discernible effect on the industry’s carbon emissions. This effect is primarily evident in the following aspects: First, a lot of energy is needed throughout the building process to construct dwellings, including fuel and electricity. Larger construction sites typically take longer to complete and require more equipment, which can result in higher energy usage. Carbon emissions will rise, for instance, if fuel is consumed or construction equipment or machinery is used to generate energy. Second, improper disposal of garbage produced during the building of homes is necessary to prevent adverse environmental effects. Greater trash generation is a result of a larger building site, and treating and disposing of this garbage calls for additional energy and resources, which could lead to an increase in carbon emissions.
Energy structure, energy consumption intensity, economic development, population density, and housing construction area all significantly affect carbon emissions from the construction industry. Reducing the proportion of high-carbon energy sources such as coal and technological advances to improve the use of renewable energy can reduce carbon emissions. The intensity of energy consumption reflects energy efficiency, and technological improvements can increase efficiency and reduce emissions. Economic development expands the scale of the construction industry, increasing energy consumption and emissions. Areas with low population densities reduce emissions due to low demand for buildings and low energy consumption. Increased housing construction leads to more carbon emissions from energy consumption and waste disposal.

4.5. Zero Error Analysis of the LMDI Decomposition Model Based on the IPAT Model

Equation (17)—where the average annual growth rate = (ln(end value/initial value))/(end time − initial time)—is used in this study to verify changes in carbon emissions from energy consumption in China’s construction industry between 2010 and 2019 with reference to earlier studies. The logarithm of the natural logarithmic base is denoted by ln, and the end value and initial value represent the parameter’s values at the end time and the initial time, respectively, and the number of years between the two time points is indicated by the end time and the initial time. Using the formula for the average annual growth rate, the average annual rate of change in each parameter on the right-hand side of Equation (17) is computed. The results are displayed below:
d ( l n C E E ) = 2.3626 % ,   d ( l n E C G D P ) = 5.6683 % ,   d ( l n C G D P P O P )   =   10.0820 %
d ( l n P O P S ) = 9.4727 % ,   d ( l n S )   =   9.9523 %
Therefore,   d ( l n C E )   = 2.3626% 5.6683% + 10.0820% 9.4727% + 9.9523% = 2.5307%.
The total carbon emissions from the construction industry have an average annual growth rate of 2.5207%, which is consistent with the above results. This shows that the zero error analysis of the LMDI decomposition model using the IPAT model can verify the reliability and accuracy of the LMDI decomposition model [59], and there is no residual interference in the decomposition using Kaya’s constant equation, i.e., the two sides of the equation are balanced, which can adequately explain the changes in the relevant indicators. Calculations are made using actual statistics.

5. Discussion

The construction sector is a significant contributor to worldwide greenhouse gas emissions, and the international community has given its carbon emissions a great deal of attention. The quality of the data and the uniformity of measurement techniques remain two major obstacles to the present research on carbon emissions from the construction sector. To encourage the construction sector to move toward low-carbon development, it will be important to carry out in-depth research on carbon emissions in the sector going forward and to implement practical carbon reduction strategies. In order to address these concerns, this study characterizes the carbon emissions from China’s construction industry both spatially and temporally between 2010 and 2019.

5.1. Trends in Carbon Emissions in the Construction Sector Analysis

The size and growth rate of the construction industry can have a direct impact on carbon emissions with respect to the temporal trend of those emissions. The construction industry’s carbon emissions may rise in tandem with its scale expansion or quick growth. About 53% of China’s provinces and regions have a declining trend in carbon emissions from the construction sector. This study employed the slope index to examine the type of change in carbon emissions from the industry at the provincial level. This study found that there are significant differences in the trend of carbon emissions in different regions, and the carbon emissions from the construction industry in some provinces show a decreasing trend, especially in the north-central and south-central regions with a medium rate of growth type, which is in line with the results of Shi and Liu’s studies [36,60]. In addition, Wang et al. analyzed the productivity and carbon emissions of China’s construction industry and found that some coastal provinces, such as Fujian Province, have faster growth rates in carbon emissions, a finding that also confirms the results of this study [61]. Therefore, it is anticipated that the temporal development pattern of carbon emissions from the construction industry would evolve in the direction of decreasing carbon emissions, improving energy efficiency, and encouraging sustainable development in light of the growing global concern about climate change. The government, business community, and other societal segments will need to work together on this.

5.2. LMDI Modeling Analysis of Construction Industry Carbon Emissions

Researchers have created a number of models and tools to help them study carbon emissions and the factors that influence them in the construction industry. For instance, The SDA model is appropriate for a multi-industry and multi-region study, and its primary use is to examine the effects of changes in economic structure on carbon emissions. Using the SDA model, Adam Rose et al. determine that two significant factors influencing carbon emissions in the construction industry are economic growth and energy structure change [62]. Lu breaks out variations in energy consumption and carbon emissions using the IDA model. The findings indicate that technical advancements and increased energy efficiency are key factors in the reduction in carbon emissions [63]. The findings highlight the detrimental effects of increased economic activity while also demonstrating the significant role that technology effect and energy efficiency improvements have in lowering carbon emissions. Population expansion, economic development, energy intensity, and technological advancement are significant factors influencing carbon emissions in the construction industry, according to the RA analytical model [64]. Using the SFA model, Liang determines that there is a substantial variation in the construction industry’s carbon emission efficiency and that management optimization and technical advancements can greatly increase carbon emission efficiency. The conclusions presented above are both compatible with and slightly distinct from the findings of this investigation; these discrepancies may be the consequence of the various study areas, study scales, and time frames used. The LMDI model has significant advantages in dealing with zero and negative values, no residual problem, and ease of interpretation, making it an effective tool for analyzing the factors influencing carbon emissions in the construction industry, even though models like SDA, IDA, RA, and SFA have their own advantages in analyzing the factors influencing carbon emissions [65].
But the LMDI model requires a lot of data—continuous time series data, in particular, are necessary for decomposition analysis. The accuracy of the decomposition results could be impacted by missing or incomplete data; this is because the LMDI model relies on the computation of exponential and logarithmic functions, which calls for a number of mathematical operations. This could make it more challenging for certain analysts who are not specialists to employ; the simplistic structure of the LMDI model means that there may be several interpretations of the factor decomposition results. The LMDI model breaks down changes into the contributions of individual components, but it is unable to explicitly consider the interaction effects between factors. To prevent inaccurate and misleading conclusions, this must be comprehended and interpreted in light of the specific circumstances and subject knowledge.
All things considered, the LMDI model is a popular decomposition technique that has the benefits of excellent interpretability and versatility. However, when utilizing the LMDI model, care must be taken to ensure that the data quality is appropriate and the interpretation results are plausible. A thorough analysis and judgment must also be made while taking the scenario into consideration.

5.3. Examining the Constraints of the Research

The following are this study’s current limitations: (1) This study’s measurement of carbon emissions from the construction industry only uses statistical data for computation; it does not use remote sensing data to establish an estimation model of carbon emissions. As a result, this study has some repetitive material, but future research could use remote sensing data to establish an estimation model of carbon emissions, adding to its richness. (2) This study only takes into account the provincial level when analyzing the spatial and temporal evolution of carbon emissions in the construction industry; in the next study, in order to explore the spatial analysis of carbon emissions at different scales, which is of some practical significance for the coordinated development of the region, and to make the research content more hierarchical, the scale can be refined and considered at multiple scales, such as the municipal and county scales. (3) When analyzing the factors that influence carbon emissions in the construction industry, it is important to consider the interaction between climate change and carbon emissions in the industry. Specifically, this means evaluating how climate change affects building use and energy consumption. Relevant research indicates that the use of buildings will be more impacted by climate change, particularly in terms of energy management and building design. Future research that considers the effects of climate change on carbon emissions in the construction sector will be able to implement strategies that effectively reduce carbon emissions and support the industry’s transition to low-carbon development.

6. Conclusions

In this study, carbon emissions from the construction industry in 30 provinces of China from 2010 to 2019 were calculated using the IPCC accounting method, and the carbon emission intensity was calculated based on the gross output value of the construction industry. The spatial variability of carbon emissions is analyzed by calculating the standard deviation and coefficient of variation in carbon emissions in the six administrative regions, and the spatial and temporal evolution of carbon emissions is investigated by combining the Moran and slope indices. Finally, the LMDI model was used to analyze the carbon emission influencing factors, and the IPAT model was used to verify its reliability. From a realistic perspective, the primary results are as follows: (1) Spatial distribution and overall trend: From 2010 to 2019, carbon emissions from China’s construction industry showed an overall growth trend, increasing from 1,853,589,200 tons in 2010 to 2,368,303,900 tons in 2019, presenting a non-equilibrium change characteristic of “high in the east and low in the west”. At the same time, the carbon emission intensity of the construction industry showed an overall downward trend, from 64.927 to 27.455. (2) Temporal and spatial development trend: about 53% of the provinces and regions in the country have a decreasing trend in carbon emissions from the construction industry, with more provinces and regions of the “medium growth” type, mainly in the northern and south-central regions; fewer provinces and regions of the “fast growth” type, mainly in the eastern region, and only Fujian Province belongs to the fast growth type. (3) Analysis of influencing factors: According to the results of the LMDI decomposition model, population density, energy structure intensity effect, and housing floor area have more negative than positive impacts on carbon emissions from the national construction industry; on the contrary, the positive impacts of economic development and housing floor area are greater. The results of the LMDI model have been verified by the IPAT model, which proves its reliability.
This study uses various methods to analyze the spatial and temporal evolution of carbon emissions from the construction industry, and quantitatively analyzes the zero-error characteristics of the LMDI decomposition model based on the IPAT modeling method, which provides practical methods and ideas for the study of carbon emissions, and scientific reference for the optimization of energy conservation and emission reduction paths in the Chinese region and the realization of the dual-carbon strategy.

Author Contributions

Conceptualization, M.S. and Y.W.; methodology, M.S.; software, M.S.; validation, M.S., Y.W. and C.W.; formal analysis, W.M.; investigation, Y.J.; resources, Y.W.; data curation, M.S.; writing—original draft preparation, M.S.; writing—review and editing, Y.W.; visualization, Y.J.; supervision, Y.W.; project administration, C.W.; funding acquisition, Y.W. All authors have read and agreed to the published version of the manuscript.

Funding

This research was funded by the National Natural Science Foundation of China (No. 41971423) and the Foundation of State Key Laboratory of Public Big Data, Guizhou University (No. PBD2022-02).

Institutional Review Board Statement

Not applicable.

Informed Consent Statement

Not applicable.

Data Availability Statement

No new data were created or analyzed in this study. Data sharing is not applicable to this article.

Conflicts of Interest

The authors declare no conflicts of interest.

References

  1. Soytas, U.; Sari, R.; Ewing, B.T. Energy consumption, income, and carbon emissions in the United States. Ecol. Econ. 2007, 62, 482–489. [Google Scholar] [CrossRef]
  2. Huang, L.; Krigsvoll, G.; Johansen, F.; Liu, Y.; Zhang, X. Carbon emission of global construction sector. Renew. Sustain. Energy Rev. 2018, 81, 1906–1916. [Google Scholar] [CrossRef]
  3. Zeng, X.; Duan, M.; Yu, Z.; Li, W.; Li, M.; Liang, X. Data-related challenges and solutions in building China’s national carbon emissions trading scheme. Clim. Policy 2018, 18 (Suppl. S1), 90–105. [Google Scholar] [CrossRef]
  4. Zhao, R.; Huang, X.; Liu, Y.; Zhong, T.; Ding, M.; Chuai, X. Carbon emission of regional land use and its decomposition analysis: Case study of Nanjing City, China. Chin. Geogr. Sci. 2015, 25, 198–212. [Google Scholar] [CrossRef]
  5. Chen, L.; Zhao, Y.; Xie, R.; Su, B.; Liu, Y.; Xv, R. Embodied energy intensity of global high energy consumption industries: A case study of the construction industry. Energy 2023, 277, 127628. [Google Scholar] [CrossRef]
  6. Chang, R.; Soebarto, V.; Zhao, Z.; Zillante, G. Facilitating the transition to sustainable construction: China’s policies. J. Clean. Prod. 2016, 131, 534–544. [Google Scholar] [CrossRef]
  7. Kim, T.-H.; Jeong, Y.-S. Analysis of Energy-Related Greenhouse Gas Emission in the Korea’s Building Sector: Use National Energy Statistics. Energies 2018, 11, 855. [Google Scholar] [CrossRef]
  8. Wu, P.; Song, Y.; Zhu, J.; Chang, R. Analyzing the influence factors of the carbon emissions from China’s building and construction industry from 2000 to 2015. J. Clean. Prod. 2019, 221, 552–566. [Google Scholar] [CrossRef]
  9. Tsang, S.; Kolk, A. The evolution of Chinese policies and governance structures on environment, energy and climate. Environ. Policy Gov. 2010, 20, 180–196. [Google Scholar] [CrossRef]
  10. Yao, H.; Xu, P.; Wang, Y.; Chen, R. Exploring the low-carbon transition pathway of China’s construction industry under carbon-neutral target: A socio-technical system transition theory perspective. J. Environ. Manag. 2023, 327, 116879. [Google Scholar] [CrossRef] [PubMed]
  11. Mata, É.; Kalagasidis, A.S.; Johnsson, F. Contributions of building retrofitting in five member states to EU targets for energy savings. Renew. Sustain. Energy Rev. 2018, 93, 759–774. [Google Scholar] [CrossRef]
  12. Fang, K.; Tang, Y.; Zhang, Q.; Song, J.; Wen, Q.; Sun, H.; Ji, C.; Xu, A. Will China peak its energy-related carbon emissions by 2030? Lessons from 30 Chinese provinces. Appl. Energy 2019, 255, 113852. [Google Scholar] [CrossRef]
  13. Li, L.; Yang, J. A new method of energy-related carbon dioxide emissions estimation at the provincial-level: A case study of Shandong Province, China. Sci. Total Environ. 2020, 700, 134384. [Google Scholar] [CrossRef] [PubMed]
  14. Du, Q.; Shao, L.; Zhou, J.; Huang, N.; Bao, T.; Hao, C. Dynamics and scenarios of carbon emissions in China’s construction industry. Sustain. Cities Soc. 2019, 48, 101556. [Google Scholar] [CrossRef]
  15. Duan, H.; Zhang, S.; Duan, S.; Zhang, W.; Duan, Z.; Wang, S.; Song, J.; Wang, X. Carbon Emissions Peak Prediction and the Reduction Pathway in Buildings during Operation in Jilin Province Based on LEAP. Sustainability 2019, 11, 4540. [Google Scholar] [CrossRef]
  16. Liu, L.-Y.; Zheng, B.-H.; Bedra, K.B. Quantitative analysis of carbon emissions for new town planning based on the system dynamics approach. Sustain. Cities Soc. 2018, 42, 538–546. [Google Scholar] [CrossRef]
  17. Liu, J.; Zhang, X.; Song, X. Regional carbon emission evolution mechanism and its prediction approach driven by carbon trading—A case study of Beijing. J. Clean. Prod. 2018, 172, 2793–2810. [Google Scholar] [CrossRef]
  18. Han, M.Y.; Chen, G.Q.; Shao, L.; Li, J.S.; Alsaedi, A.; Ahmad, B.; Guo, S.; Jiang, M.M.; Ji, X. Embodied energy consumption of building construction engineering: Case study in E-town, Beijing. Energy Build. 2013, 64, 62–72. [Google Scholar] [CrossRef]
  19. Han, M.Y.; Shao, L.; Li, J.S.; Guo, S.; Meng, J.; Ahmad, B.; Hayat, T.; Alsaadi, F.; Ji, X.; Alsaedi, A.; et al. Emergy-based hybrid evaluation for commercial construction engineering: A case study in BDA. Ecol. Indic. 2014, 47, 179–188. [Google Scholar] [CrossRef]
  20. Luo, Z.; Yang, L.; Liu, J. Embodied carbon emissions of office building: A case study of China’s 78 office buildings. Build. Environ. 2016, 95, 365–371. [Google Scholar] [CrossRef]
  21. Luo, Y.; Long, X.; Wu, C.; Zhang, J. Decoupling CO2 emissions from economic growth in agricultural sector across 30 Chinese provinces from 1997 to 2014. J. Clean. Prod. 2017, 159, 220–228. [Google Scholar] [CrossRef]
  22. Li, R.; Jiang, R. Moving Low-Carbon Construction Industry in Jiangsu Province: Evidence from Decomposition and Decoupling Models. Sustainability 2017, 9, 1013. [Google Scholar] [CrossRef]
  23. Wang, Y.; Xie, T.; Yang, S. Carbon emission and its decoupling research of transportation in Jiangsu Province. J. Clean. Prod. 2017, 142, 907–914. [Google Scholar] [CrossRef]
  24. Xu, B.; Lin, B. Does the high–tech industry consistently reduce CO2 emissions? Results from nonparametric additive regression model. Environ. Impact Assess. Rev. 2017, 63, 44–58. [Google Scholar] [CrossRef]
  25. Yan, J.; Zhao, T.; Lin, T.; Li, Y. Investigating multi-regional cross-industrial linkage based on sustainability assessment and sensitivity analysis: A case of construction industry in China. J. Clean. Prod. 2017, 142, 2911–2924. [Google Scholar] [CrossRef]
  26. Zheng, S.; He, X.; Liang, X.; Yu, L. Research on the Decoupling Relationship and Driving Factors of Carbon Emissions in the Construction Industry of the East China Core Economic Zone. Buildings 2024, 14, 1476. [Google Scholar] [CrossRef]
  27. Ang, B.W.; Wang, H. Index decomposition analysis with multidimensional and multilevel energy data. Energy Econ. 2015, 51, 67–76. [Google Scholar] [CrossRef]
  28. Su, B.; Ang, B.W. Structural decomposition analysis applied to energy and emissions: Some methodological developments. Energy Econ. 2012, 34, 177–188. [Google Scholar] [CrossRef]
  29. Zhu, C.; Chang, Y.; Li, X.; Shan, M. Factors influencing embodied carbon emissions of China’s building sector: An analysis based on extended STIRPAT modeling. Energy Build. 2022, 255, 111607. [Google Scholar] [CrossRef]
  30. Harvey, L.D.D. Tackling Urban CO2 Emissions in Toronto. Environ. Sci. Policy Sustain. Dev. 1993, 35, 16–44. [Google Scholar] [CrossRef]
  31. You, F.; Hu, D.; Zhang, H.; Guo, Z.; Zhao, Y.; Wang, B.; Yuan, Y. Carbon emissions in the life cycle of urban building system in China—A case study of residential buildings. Ecol. Complex. 2011, 8, 201–212. [Google Scholar] [CrossRef]
  32. Su, X.; Zhang, X. A detailed analysis of the embodied energy and carbon emissions of steel-construction residential buildings in China. Energy Build. 2016, 119, 323–330. [Google Scholar] [CrossRef]
  33. Li, D.; Huang, G.; Zhu, S.; Chen, L.; Wang, J. How to peak carbon emissions of provincial construction industry? Scenario analysis of Jiangsu Province. Renew. Sustain. Energy Rev. 2021, 144, 110953. [Google Scholar] [CrossRef]
  34. Weigert, M.; Melnyk, O.; Winkler, L.; Raab, J. Carbon Emissions of Construction Processes on Urban Construction Sites. Sustainability 2022, 14, 12947. [Google Scholar] [CrossRef]
  35. Wang, Y.; Wang, M.; Teng, F.; Ji, Y. Remote Sensing Monitoring and Analysis of Spatiotemporal Changes in China’s Anthropogenic Carbon Emissions Based on XCO2 Data. Remote Sens. 2023, 15, 3207. [Google Scholar] [CrossRef]
  36. Shi, Q.; Chen, J.; Shen, L. Driving factors of the changes in the carbon emissions in the Chinese construction industry. J. Clean. Prod. 2017, 166, 615–627. [Google Scholar] [CrossRef]
  37. Du, Q.; Lu, X.; Li, Y.; Wu, M.; Bai, L.; Yu, M. Carbon Emissions in China’s Construction Industry: Calculations, Factors and Regions. Int. J. Environ. Res. Public Health 2018, 15, 1220. [Google Scholar] [CrossRef] [PubMed]
  38. Du, Q.; Zhou, J.; Pan, T.; Sun, Q.; Wu, M. Relationship of carbon emissions and economic growth in China’s construction industry. J. Clean. Prod. 2019, 220, 99–109. [Google Scholar] [CrossRef]
  39. Han, X.; Cao, T.; Sun, T. Analysis on the variation rule and influencing factors of energy consumption carbon emission intensity in China’s urbanization construction. J. Clean. Prod. 2019, 238, 117958. [Google Scholar] [CrossRef]
  40. Jiang, T.; Li, S.; Yu, Y.; Peng, Y. Energy-related carbon emissions and structural emissions reduction of China’s construction industry: The perspective of input–output analysis. Environ. Sci. Pollut. Res. 2022, 29, 39515–39527. [Google Scholar] [CrossRef] [PubMed]
  41. Sun, Y.; Hao, S.; Long, X. A study on the measurement and influencing factors of carbon emissions in China’s construction sector. Build. Environ. 2023, 229, 109912. [Google Scholar] [CrossRef]
  42. Zhang, P.; Hu, J.; Zhao, K.; Chen, H.; Zhao, S.; Li, W. Dynamics and Decoupling Analysis of Carbon Emissions from Construction Industry in China. Buildings 2022, 12, 257. [Google Scholar] [CrossRef]
  43. Downie, C. Strategies for Survival: The International Energy Agency’s response to a new world. Energy Policy 2020, 141, 111452. [Google Scholar] [CrossRef]
  44. Greene, L.A. EHPnet: United Nations Framework Convention on Climate Change. Environ. Health Perspect. 2000, 108, A353. [Google Scholar] [CrossRef]
  45. Wang, M.; Wang, Y.; Teng, F.; Ji, Y. The spatiotemporal evolution and impact mechanism of energy consumption carbon emissions in China from 2010 to 2020 by integrating multisource remote sensing data. J. Environ. Manag. 2023, 346, 119054. [Google Scholar] [CrossRef] [PubMed]
  46. Cheng, Z.; Li, L.; Liu, J. Industrial structure, technical progress and carbon intensity in China’s provinces. Renew. Sustain. Energy Rev. 2018, 81, 2935–2946. [Google Scholar] [CrossRef]
  47. Canadell, J.G.; Le Quéré, C.; Raupach, M.R.; Field, C.B.; Buitenhuis, E.T.; Ciais, P.; Conway, T.J.; Gillett, N.P.; Houghton, R.A.; Marland, G. Contributions to accelerating atmospheric CO 2 growth from economic activity, carbon intensity, and efficiency of natural sinks. Proc. Natl. Acad. Sci. USA 2007, 104, 18866–18870. [Google Scholar] [CrossRef] [PubMed]
  48. Jiang, F.; Chen, B.; Li, P.; Jiang, J.; Zhang, Q.; Wang, J.; Deng, J. Spatio-temporal evolution and influencing factors of synergizing the reduction of pollution and carbon emissions—Utilizing multi-source remote sensing data and GTWR model. Environ. Res. 2023, 229, 115775. [Google Scholar] [CrossRef] [PubMed]
  49. Zhu, E.; Yao, J.; Zhang, X.; Chen, L. Explore the spatial pattern of carbon emissions in urban functional zones: A case study of Pudong, Shanghai, China. Environ. Sci. Pollut. Res. 2023, 31, 2117–2128. [Google Scholar] [CrossRef] [PubMed]
  50. Joo, J.; Lee, J.; Park, M. Evaluation of Carbon Emissions According to the Steep Slope Maintenance Project. J. Korean Soc. Hazard Mitig. 2023, 23, 37–42. [Google Scholar] [CrossRef]
  51. Musah, M.; Kong, Y.; Mensah, I.A.; Antwi, S.K.; Osei, A.A.; Donkor, M. Modelling the connection between energy consumption and carbon emissions in North Africa: Evidence from panel models robust to cross-sectional dependence and slope heterogeneity. Environ. Dev. Sustain. 2021, 23, 15225–15239. [Google Scholar] [CrossRef]
  52. Jorgenson, A.K.; Clark, B. The Relationship between National-Level Carbon Dioxide Emissions and Population Size: An Assessment of Regional and Temporal Variation, 1960–2005. PLoS ONE 2013, 8, e57107. [Google Scholar] [CrossRef] [PubMed]
  53. Wang, G.; Liao, M.; Jiang, J. Research on Agricultural Carbon Emissions and Regional Carbon Emissions Reduction Strategies in China. Sustainability 2020, 12, 2627. [Google Scholar] [CrossRef]
  54. Liu, M.; Zhang, X.; Zhang, M.; Feng, Y.; Liu, Y.; Wen, J.; Liu, L. Influencing factors of carbon emissions in transportation industry based on CD function and LMDI decomposition model: China as an example. Environ. Impact Assess. Rev. 2021, 90, 106623. [Google Scholar] [CrossRef]
  55. Quan, C.; Cheng, X.; Yu, S.; Ye, X. Analysis on the influencing factors of carbon emission in China’s logistics industry based on LMDI method. Sci. Total Environ. 2020, 734, 138473. [Google Scholar] [CrossRef] [PubMed]
  56. Xu, S.-C.; He, Z.-X.; Long, R.-Y. Factors that influence carbon emissions due to energy consumption in China: Decomposition analysis using LMDI. Appl. Energy 2014, 127, 182–193. [Google Scholar] [CrossRef]
  57. Kim, J.; Lim, H.; Jo, H.-H. Do Aging and Low Fertility Reduce Carbon Emissions in Korea? Evidence from IPAT Augmented EKC Analysis. Int. J. Environ. Res. Public Health 2020, 17, 2972. [Google Scholar] [CrossRef] [PubMed]
  58. Wang, C.; Wang, F.; Zhang, X.; Yang, Y.; Su, Y.; Ye, Y.; Zhang, H. Examining the driving factors of energy related carbon emissions using the extended STIRPAT model based on IPAT identity in Xinjiang. Renew. Sustain. Energy Rev. 2017, 67, 51–61. [Google Scholar] [CrossRef]
  59. Yang, P.; Liang, X.; Drohan, P.J. Using Kaya and LMDI models to analyze carbon emissions from the energy consumption in China. Environ. Sci. Pollut. Res. 2020, 27, 26495–26501. [Google Scholar] [CrossRef] [PubMed]
  60. Liu, Y.; Zhao, G.; Zhao, Y. An analysis of Chinese provincial carbon dioxide emission efficiencies based on energy consumption structure. Energy Policy 2016, 96, 524–533. [Google Scholar] [CrossRef]
  61. Wang, Z.; Feng, C. Sources of production inefficiency and productivity growth in China: A global data envelopment analysis. Energy Econ. 2015, 49, 380–389. [Google Scholar] [CrossRef]
  62. Rose, A.; Casler, S. Input–Output Structural Decomposition Analysis: A Critical Appraisal. Econ. Syst. Res. 1996, 8, 33–62. [Google Scholar] [CrossRef]
  63. Lu, N.; Feng, S.; Liu, Z.; Wang, W.; Lu, H.; Wang, M. The Determinants of Carbon Emissions in the Chinese Construction Industry: A Spatial Analysis. Sustainability 2020, 12, 1428. [Google Scholar] [CrossRef]
  64. Fang, Y.; Lu, X.; Li, H. A random forest-based model for the prediction of construction-stage carbon emissions at the early design stage. J. Clean. Prod. 2021, 328, 129657. [Google Scholar] [CrossRef]
  65. Du, Q.; Wu, J.; Cai, C.; Li, Y.; Zhou, J.; Yan, Y. Carbon mitigation by the construction industry in China: A perspective of efficiency and costs. Environ. Sci. Pollut. Res. 2021, 28, 314–325. [Google Scholar] [CrossRef] [PubMed]
Figure 1. Map of China’s provincial administrative divisions.
Sustainability 16 05927 g001
Figure 2. Histogram of national carbon emissions from the construction industry, 2010–2019.
Sustainability 16 05927 g002
Figure 3. The regional and temporal changes in carbon emissions in the province’s construction sector in the years 2010, 2013, 2016, and 2019.
Sustainability 16 05927 g003
Figure 4. The regional and temporal changes in the carbon emission intensity in the province’s construction sector in the years 2010, 2013, 2016, and 2019.
Sustainability 16 05927 g004
Figure 5. LISA aggregation of carbon emissions from the construction sector at the provincial level in China in 2010, 2015, and 2019.
Sustainability 16 05927 g005
Figure 6. Analysis of the sorts of changes in carbon emissions in China’s province-level construction industry.
Sustainability 16 05927 g006
Figure 7. Standard deviation and coefficient of variation in carbon emissions in the construction industry trend chart.
Sustainability 16 05927 g007
Table 1. Energy consumption correlation coefficient for accounting for carbon emissions.
Fuel TypeConversion Factor for Standard CoalCarbon Emission Factor
Raw coal0.71430.7559
Coke0.97140.855
Crude Oil1.42860.5857
Gasoline1.47140.5538
Kerosene1.47140.5714
Diesel oil1.45710.5921
Fuel Oil1.42860.6185
Liquefied petroleum gas1.71430.5042
Natural gas1.330.4483
Electricity0.11290.68
Note: Kilograms of standard coal per cubic meter is the standard coal conversion factor for natural gas.
Table 2. Building material regression coefficients and carbon emission coefficients.
Building MaterialClinkerSteelGlassAluminum
Carbon emission factor/(t· t 1 )0.8151.7890.9662.60
Recovery factor0.4500.8000.7000.85
Table 3. Categorization standards for the increase in carbon emissions within the construction sector.
Type of GrowthSlow Growth TypeMedium Growth TypeFaster GrowthRapid Growth
Slope value < x ¯ 0.5 s x ¯ 0.5 s ~ x ¯ + 0.5 s x ¯ + 0.5 s ~ x ¯ + 1.5 s > x ¯ + 1.5 s
Notes: The standard deviation of the slope values for each province and domain is denoted by s, while the mean is represented by x.
Table 4. Results of global Moran′s Index.
YearMoran’s IndexZ-Scorep-Value
20100.2662.7870.017
20110.1851.9090.040
20120.0481.4680.060
20130.0541.3190.090
20140.0401.0660.127
20150.0811.6150.069
20160.2812.7530.016
20170.2602.5620.016
20180.3373.1940.007
20190.3383.1390.007
Table 5. The national construction industry’s LMDI decomposition findings from 2010 to 2019 (unit: ten thousand tons).
Particular YearEnergy Structure Intensity EffectEnergy
Consumption
Intensity Effect
Economic
Development
Effect
Population Density EffectHousing
Construction
Area Effect
Total Effect
201141,776.8722,368.3533,492.64−31,192.3932,022.86−29,822.08
201256,835.0355,803.8178,901.98−81,800.0284,014.7282,147.90
201390,298.7273,455.27125,160.74127,746.62131,480.94145,738.52
201418,862.8369,516.75122,153.45131,294.55135,408.4637,887.79
201525,144.9078,159.98141,310.10169,341.57175,115.5294,068.97
201637,774.7275,269.51136,012.07144,931.14151,160.3529,197.04
201730,105.5191,525.90162,014.85154,270.47161,897.1448,010.12
201842,103.99103,230.32178,601.10160,049.29168,362.4841,579.99
201945,055.27108,097.16192,268.03180,648.26189,793.4548,260.79
Disclaimer/Publisher’s Note: The statements, opinions and data contained in all publications are solely those of the individual author(s) and contributor(s) and not of MDPI and/or the editor(s). MDPI and/or the editor(s) disclaim responsibility for any injury to people or property resulting from any ideas, methods, instructions or products referred to in the content.

