1. Introduction
As urbanization and industrialization surge forward at an unprecedented pace, resource constraints and environmental pollution have intensified, posing grave challenges [
1]. The relentless expansion of cities has unleashed a deluge of ecological impacts, emphasizing the urgent need to strike a delicate balance between economic growth and environmental protection. The traditional model of extensive development, once the cornerstone of progress, has proven insufficient to meet the evolving demands of society [
2]. The color “green” has emerged as a vital hue, imperative for safeguarding the environment, conserving scarce resources, and achieving high-quality development [
3,
4].
Green technology innovation, a harmonious blend of innovation-driven and green development principles, stands as a cornerstone of the high-quality development era. It plays a pivotal role in catalyzing the transformation and upgradation of industrial structures, laying the foundation for a green, low-carbon, and circular economic system.
However, green technology innovation is a marathon, not a sprint, with longer gestation periods and higher inherent risks compared with traditional innovation [
5,
6]. Its externalities can inadvertently lead to the expropriation of the fruits of innovation, fostering a “free-rider” syndrome that dampens corporate enthusiasm [
7]. To counter this, the government must continually refine the green tax system, bolstering enterprises’ capabilities for technological innovation [
8]. Meanwhile, enterprises must seize the fiscal and tax policy dividends, intensifying their research and development (R&D) investments and fostering sustainable development through green innovation practices [
9]. Efficient fiscal and tax policies meticulously sculpt the industrial landscape, with preferential tax policies emerging as more potent motivators than fiscal subsidies. In recent years, the reform of decentralization services has gained momentum, with tax authorities stepping up their efforts to intensify their tax reduction and fee reduction measures [
10]. This has translated into tangible benefits for enterprises, enhancing their welfare amidst reductions in tax revenue.
While numerous studies have explored tax incentives, R&D investment, and green technology innovation, offering valuable theoretical insights, there remains ample room for expansion in this domain. Firstly, the current implementation of tax reduction and fee reduction encompasses a broad spectrum of taxes, yet most studies have tended to narrow their focus to specific taxes or preferential measures, such as environmental protection taxes [
11]. Secondly, no consensus exists on the mechanisms through which tax incentives promote R&D investment and green technology innovation. While some scholars have advocated for their significant role in advancing these objectives [
12], others have contended that tax incentives have a marginal effect and may even trigger a crowding-out effect [
13]. Furthermore, many scholars often equate tax incentives with income tax incentives [
14], potentially leading to varied perspectives and biases in evaluations, resulting in disparate research conclusions.
These research gaps presented a unique opportunity for our study. Building upon this foundation, we meticulously collected relevant data and established a robust model to decipher how tax incentives impact enterprises’ green innovation. Our investigation delved into Shanghai’s and Shenzhen’s A-share listed companies, spanning the period from 2017 to 2022, analyzing the intricate interplay among tax incentives, R&D investment, and the performance of green technology innovation.
We considered two vital dimensions of tax incentives: enterprise income tax incentives and value-added tax incentives, both of which are intimately tied to corporate production and operations. The study proposed utilizing income tax preferences and value-added tax preferences as metrics to assess tax preferences, as they are integral to corporate functioning and offer a comparative analytical framework. By doing so, we aimed to avert distortions of resource allocation and establish a virtuous cycle of government–enterprise bidirectional promotion. This research endeavored to enrich the understanding of the mechanisms linking tax incentives to the performance of green technology innovation and provides a theoretical cornerstone for promoting sustainable development.
Furthermore, we integrated R&D investment into our theoretical analytical framework to explore its impact on fostering enterprises’ green innovation technologies. We meticulously examined the mediating role that R&D investment plays in the relationship between tax preferences and green innovation. This will shed light on how tax preferences can positively influence enterprises’ green innovation efforts, contributing to the existing literature on the economic outcomes of preferential tax policies. Additionally, our study delved into how enterprises with diverse business environments, industrial characteristics, and ownership vary in their responses. By analyzing these factors, we aimed to offer theoretical support for refining the current tax incentive policy system and optimizing the green tax incentive framework.
2. Development of Hypotheses
Enterprises across various industries compete to initiate technological innovations in the market. However, green technology innovation involves high risk and long cycles, often leading to technology spillovers and knowledge spillovers. These result in a high cost with inadequate returns, diminishing enterprises’ efforts towards innovation [
15,
16]. Tax incentives, an indirect financial subsidy by the government, can help compensate for the losses incurred during green technology innovation [
17,
18]. It can stimulate the development of green technology, reduce the losses of enterprises, and promote the green transformation and upgrading of enterprises through preferential policies [
19].
Corporate income tax incentives, as one of the most diversified preferential tax policies with the most extensive coverage, reduce the income tax burden of enterprises with tax rate concessions, additional deduction of research and development expenses, accelerated depreciation of fixed assets, and other means of relieving the burden of green innovative enterprises [
20]. VAT preferences, a tax on the value added in the circulation link, provides tax relief and introduces a large-scale VAT rebate policy, indicating the government’s confidence in helping enterprises’ development. This enhances the impetus for enterprises’ innovation and absorbs more social capital to promote the innovation and development of enterprises [
21]. Tax incentives can significantly stimulate enterprises’ innovation, leading to the purchase of equipment for environmental protection and green technology innovation, in line with current environmental tax, tax incentives, and other laws and policies to achieve sustainable green development [
22,
23].
These preferential policies promote enterprises’ innovation activities by improving the turnover efficiency of research and development funds, increasing investment into research and development, and reducing the tax burden [
24,
25]. Therefore, in the context of the concept of green development, the government must strengthen macro-control, deeply integrate effective markets and a proactive government, reduce the risk of green technology innovation, promote the transformation of enterprises from “grey manufacturing” to “green manufacturing”, and create a resource-saving and environment-friendly society [
26,
27]. This will encourage enterprises to innovate in the field of green technology, fostering new driving forces and advantages for green development. Tax incentives can promote the performance of green technology innovation, and this study proposed the following hypothesis:
H1a: Income tax incentives have a promoting effect on the performance of green technology innovation.
H1b: VAT preferences have a promoting effect on the performance of green technology innovation.
Enterprises that wish to engage in green technology innovation require significant research and development funding for support. The after-tax capital formula for R&D investment suggests that higher depreciation and income tax rates lead to higher capital costs for R&D expenditure, making lower financing constraints more favorable for R&D activities [
28,
29]. Currently, most enterprises in China raise funds through debt financing, which involves high-interest costs. This, in turn, reduces the free cash flow of enterprises, thereby dampening their enthusiasm for green innovation and development [
30].
To better serve as a service-oriented government, authorities often utilize preferential tax policies as an effective means of encouraging enterprises to increase R&D investment. The government can provide a series of preferential measures for enterprises’ investments into research and development and transformation of the results by reducing the overall tax burden of R&D links and promoting the expansion of the overall scale of R&D investment along with growth in the net profit [
23,
30]. Enterprises’ VAT concessions are mainly aimed at companies that urgently need green transformation and upgrading, particularly in light of the VAT reform introduced to address the increasing downward pressure on the economy, the complex and expensive financing for enterprises, and the need to change the extensive development model [
21,
31]. By means of immediate collection and refunds, rebates, and other methods, VAT concessions effectively reduce the tax burden of enterprises and help them achieve their goals of green transformation and upgrading. The government’s “real money” approach to alleviating enterprises’ urgent needs is not only to reduce their tax burden but also to encourage them to increase R&D investment to achieve overall innovation and development [
2,
32].
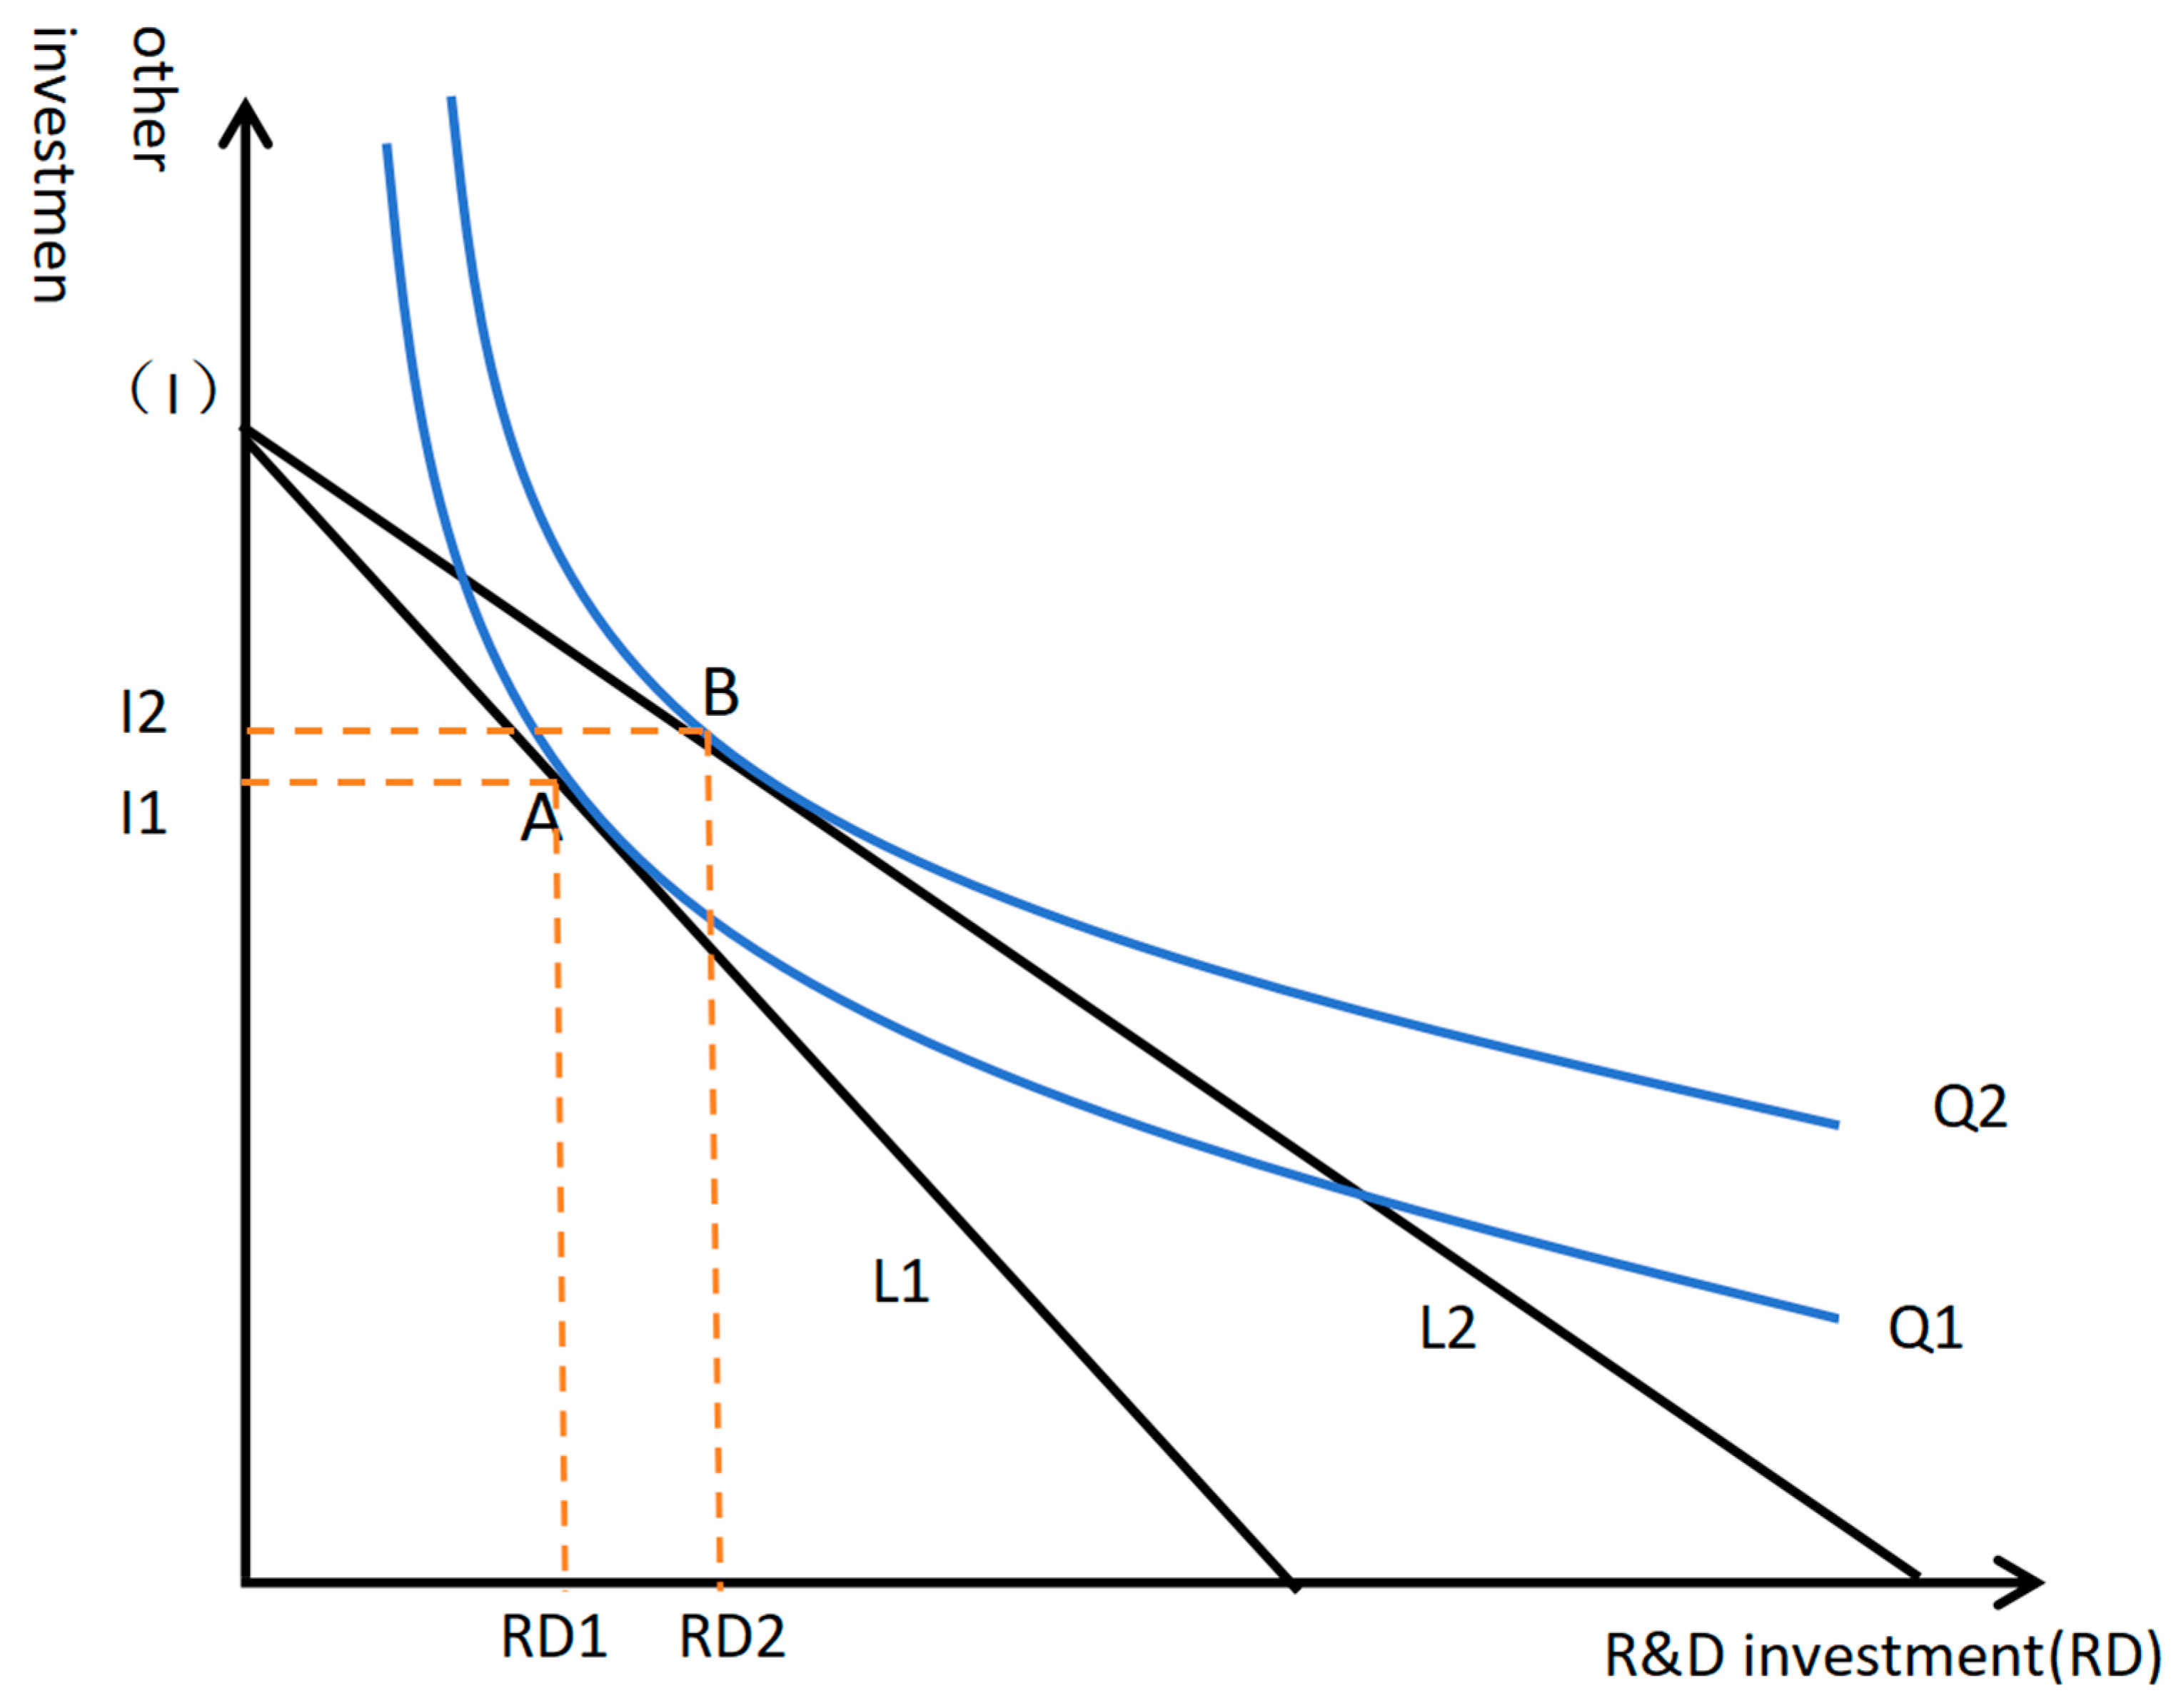
Furthermore, this study divided the direction of capital use into R&D investment (RD) and other investment (I), and illustrated the relationship between tax incentives and R&D investment using
Figure 1. As shown in
Figure 1, L1 represents the capital budget line of an enterprise without tax incentives, while L2 represents the capital budget line of an enterprise with tax incentives. Q1 and Q2 are their corresponding output lines, respectively. When the capital budget line is L1, which denotes a state without tax incentives, the optimal factor allocation for enterprises is Point A, and the optimal R&D investment is RD1. When the capital budget line is L2 and enterprises enjoy tax incentives, the capital cost of R&D investment is reduced. As shown in
Figure 1, enterprises will increase R&D investment (RD2) out of rational economic considerations. According to this analysis, this study proposed the following hypotheses:
H2a: Income tax incentives significantly increase enterprises’ R&D investment.
H2b: VAT preferences significantly improve enterprises’ R&D investment.
Accumulating knowledge capital increases the efficiency of converting R&D investment into the performance of innovation. Enterprises that benefit from the government’s financial incentives are more likely to focus on innovation activities, strengthening tax incentives’ role in promoting R&D investment [
2,
33].
The preferential policies of enterprises’ income tax or value-added tax aim to boost R&D funds by improving income and encouraging enterprises to increase their investment in R&D, thereby spurring innovation [
10,
24]. Taxation is an essential financial tool for the government to stabilize the macro-economic market. Preferential tax policies, such as additional deduction policies, reducing tax rates, and encouraging green technology innovation, help reduce the costs of research and development and the tax burden of enterprises [
9,
31].
R&D investment plays a mediating role between income tax incentives, VAT preferences, and the performance of green technology innovation. Green technology innovation is more uncertain and riskier than traditional innovation. The dividend of preferential tax policies helps enterprises to mitigate risks and compensate for externalities, thus reducing the tax burden and stabilizing the R&D capital chain. This boosts the confidence of enterprises in green innovation and development. In light of this analysis, we proposed the following hypothesis:
H3a: R&D investment plays a mediating role between income tax incentives and the performance of green technology innovation.
H3b: R&D investment plays a mediating role between VAT preferences and the performance of green technology innovation.
3. Methodology
3.1. Data and Method
This study examined the micro-level data of A-share listed companies in Shanghai and Shenzhen from 2017 to 2022. In 2017, the Chinese government officially included “Enhancing the awareness that lucid waters and lush mountains are invaluable assets” in the Amendment to the Constitution of the Communist Party of China. That same year, a number of green manufacturing enterprises were selected as role models for other companies. This made 2017 a crucial moment for improving awareness of green innovation among Chinese enterprises. The research samples were carefully selected and processed by removing ST,ST* (“ST” is the abbreviation for “Special Treatment”. ST stocks generally indicate that the listed company has financial or other abnormal conditions, and the trading of its stocks requires special handling. “ST*” represents a warning of the risk of delisting, meaning that this listed company is facing more serious financial or operational problems and may be terminated from the listing by the exchange.) and listed companies in the financial industry, as well as enterprises with missing data. Ultimately, 1151 sample enterprises with 5755 valid data points were obtained. The study focused on income tax expenses, tax refunds, the enterprises’ age, the enterprises’ size, the asset–liability ratio, and other associated indicators obtained from the CSMAR database. Additionally, a 1% tailing treatment was conducted for all continuous variables [
17,
28].
This study aimed to test the impact of tax incentives on the performance of green technology innovation by constructing the following model to verify Hypotheses H1a and H1b:
In Model (1) and Model (2), i represents the enterprise, t represents the year, serves as the control variable, GTI stands for the performance of green technology innovation, Tax1 represents corporate income tax incentives, Tax2 represents corporate value-added tax incentives, and and represent industry-fixed effects and annual fixed effects, respectively. The inclusion of these variables aimed to remove industrial and annual differences. If the regression coefficients of tax incentives, Tax1() and Tax2(), are significantly positive, this indicates that tax incentives are positively correlated with the performance of green technology innovation. In other words, the greater the tax incentives received by enterprises, the greater the promoting effect on the performance of green technology innovation.
To test the relationship between tax incentives and R&D investment, the study constructed the following model to verify Hypotheses H2a and H2b:
Model (3) and Model (4) were used to test whether tax incentives have a promoting effect on enterprises’ R&D investment. When combined with Model (5) and Model (6), if
,
,
,
,
, and
were significant, this showed that R&D investment plays a partial intermediary role in the process of tax incentives promoting the performance of green technology innovation, that is, tax incentives encourage enterprises to increase R&D investment and then improve the performance of green technology innovation.
3.2. Variables and Measures
3.2.1. Performance of Green Technology Innovation
The variable under consideration was the performance of green technology innovation (GTI), which is crucial for balancing economic growth and environmental protection. However, academics still have no consensus on the impact of green technology innovation. Four mainstream research methods have been identified: green total factor productivity, energy consumption per unit of output of new products, the number of green patent applications by listed companies, and wastewater discharged per CNY10,000 of industrial output value. While the first and fourth methods focus on the macro-perspective, this study used micro-level data from Shanghai’s and Shenzhen’s A-shares. Therefore, this study used the number of green patent applications by publicly traded companies as an indicator to measure the impact of companies’ green technological innovation. This choice was based on the fact that, unlike the commonly used R&D investment data, green patent data directly represent the results of companies’ efforts towards green technological innovation. The spillover effect of patent knowledge demonstrates the spread of knowledge in green technological innovation, and patent data have the advantage of being quantifiable. Utilizing green patent application data not only allows for a timelier assessment of the impact of tax incentives on companies’ efforts towards green technological innovation but also provides a better reflection of the companies’ innovative tendencies compared with data on the acquisition of green patents. To address issues of collinearity and heteroscedasticity, we applied a mathematical transformation by taking the logarithm of the number of green patent applications after adding 1 [
34].
3.2.2. Tax Preferences
The preferential tax policies in China cover various types of taxes, with preferential income tax and preferential value-added tax policies being predominant. In this study, we focused on income and value-added tax incentives to ensure high comparability across different industries and enterprises. Income tax preferences (Tax1) were measured by taking the logarithm of (statutory tax rate − effective tax rate) × total profit, where income tax expenses/EBIT measured the effective tax rate. VAT preferences (Tax2) were measured by the ratio of “tax rebates received/(tax rebates received + taxes paid)” to reflect the preferential value-added tax policy in the form of tax returns [
35].
3.2.3. Investment into Research and Development
Investment into research and development (R&D) was measured as the absolute number and relative number of R&D investments, with the relative number index being more convenient for a comparative analysis among enterprises. Thus, this study measured the intensity of investment into research and development (R&D) by using the ratio of R&D expenditure to operating income. A higher ratio indicated a greater intensity of R&D investment and reflected a higher level of importance attached to R&D into innovation activities by the enterprise [
36,
37,
38].
3.2.4. Other Control Variables
This study also accounted for other significant factors that influence the performance of green technology innovation, using them as control variables. These factors were based on previous studies [
35,
37]. For specific definitions of these variables, please refer to
Table 1.
4. Empirical Results
4.1. Descriptive Statistics
After sorting the data, we obtained 1151 listed companies with a total of 5755 valid sample data values. We calculated the descriptive statistics of the main variables in terms of the mean, standard deviation, minimum, and maximum before the regression analysis. The specific results are shown in
Table 2.
Regarding the performance of green technology innovation, the minimum value was 0, the maximum was 5.717, and the standard deviation was 1.236. This indicated that the green technology innovation of Chinese enterprises started late, and the early development was very slow. The overall level was low, the awareness of green innovation was weak, and there was a big gap between different companies. In terms of tax incentives, the minimum value of income tax incentives (Tax1) was 13.89 and the maximum value was 21.52. The minimum value of value-added tax incentives (Tax2) was 0 and the maximum value was 0.782. This indicated that there were significant differences in the income tax and value-added tax incentives enjoyed by different enterprises. Regarding R&D investment, in the past 5 years, the minimum value of R&D investment (RD) of enterprises was 0.0002, the maximum was 0.248, the average was 0.0498, and the standard deviation was 0.0406. It can be seen that there was a significant gap in the R&D investment of enterprises, indicating that the importance of R&D activities is different among enterprises.
In terms of the main control variables, there was little difference between the age and size of the enterprises in the sample. The average value of the asset–liability ratio (Lev) was 0.454, which was in line with the actual situation. The minimum value was 0.0930, and the maximum value was 0.864. The maximum value varied greatly, indicating that different enterprises had different financial policies, and some enterprises had a higher financial leverage risk. As for the growth of enterprises, the minimum value was −0.481, the maximum value was 3.664, and the average value was 0.300. This indicated that although the revenue of some enterprises had negative growth, the sample as a whole showed positive growth. The minimum value of total turnover of assets (Tat) was 0.114, and the maximum was 2.182. It can be seen that there was a considerable gap between the total turnover of assets by different enterprises. The minimum value of the ratio of top 10 shareholders (TOP10) was 25.1%, the maximum value was 91.2%, and the average value was 57.4%. This indicated that the enterprises in the sample had a high degree of concentration of ownership. The minimum value of the ratio of fixed assets (Fix) was 0.0758, and the maximum was 0.662, with a wide gap. This indicated that the burden of private funds on fixed assets was sufficient, which was conducive to maintaining financial stability.
4.2. Results of Correlation
Pearson’s correlation analysis was conducted on the variables mentioned above using Stata 15.0 to understand the correlations among them. Due to space constraints, the results are presented in
Appendix A (
Table A1). The correlation coefficients of income tax preferences (Tax1) and value-added tax preferences (Tax2) with the performance of green technology innovation (GTI) were 0.306 and 0.049, respectively. Both were positively correlated at a significant level of 1%. The correlation coefficients of R&D investment (RD) with income tax preferences (Tax1) and value-added tax preferences (Tax2) were 0.211 and 0.182, respectively, and both were significantly positively correlated at the 1% level. The relationships among the enterprises’ size (Size), the asset–liability ratio (Lev), the enterprises ‘growth, return on equity (ROE), the ratio of the top 10 shareholders’ shareholding (TOP10), the ratio of fixed assets (Fix), and the performance of green technology innovation (GTI) all passed the significance test. The correlation coefficient between the asset–liability ratio (Lev) and R&D investment (RD) was −0.368, and the correlation was significantly negative at the level of 1%. This indicated that an increase in the asset–liability ratio inhibited the expansion of R&D investment. It is important to note that the correlation analysis did not consider the interaction in the presence of other variables. Therefore, it was necessary to conduct a regression analysis to further explore the relationships among the variables.
4.3. Baseline Results
This study conducted a regression analysis to determine the relationship between tax incentives and the performance of green technology innovation, while controlling for industrial and annual effects. The results of the basic regression analysis are shown in
Table 3. Additionally, this study carried out a chi-square test of the goodness of fit of the model, which resulted in a goodness of fit of 0.209, 0.103, 0.328, and 0.339. The Prob test results significantly rejected the null hypothesis, indicating that the model was valid.
In Column (1) and (2) of
Table 3, when only income tax preferences (Tax1) and value-added tax preferences (Tax2) were added, the regression coefficients on the performance of green technology innovation (GTI) were 0.301 and 0.325, respectively, both significantly positively correlated at a 1% level. In Column (3) and Column (4), other control variables that affect enterprises’ green technology innovation (GTI) were added. At this point, the regression coefficient between tax incentives (Tax1) and the performance of green technology innovation (GTI) was 0.029, which was statistically significant at the 10% level. This indicated that for every one-unit increase in tax incentives (Tax1), enterprises’ green innovation performance (GTI) increased by 0.029 units. The regression coefficient between value-added tax incentives (Tax2) and the performance of green technology innovation (GTI) was 0.428, which was statistically significant at the 1% level, demonstrating that tax incentives can effectively promote the performance of green technology innovation. The regression results in
Table 3 confirmed H1a and H1b.
Moreover, according to the experimental results, it was evident that the significance of the coefficient of Tax1 (10%) was lower than that of Tax2 (1%), and the specific reasons for this might include the following.
Reducing VAT is more effective than income tax incentives for promoting green innovation for several reasons. Firstly, the supporting infrastructure is crucial in facilitating businesses’ adoption of green technologies and practices. Businesses that receive reductions in VAT for their environmentally friendly products or services also benefit from a network of support, including government agencies, industry associations, and research institutions. This support helps with the technical assistance, market information, and resources to develop and commercialize their innovations.
Secondly, reductions in VAT have a direct impact on consumers’ behavior. Consumers are more likely to choose them over conventional alternatives when environmentally friendly products or services become cheaper due to reductions in VAT. This creates a strong market demand for green innovations, encouraging businesses to invest in developing new technologies and solutions that meet these demands.
Thirdly, reductions in VAT incentivize businesses to invest in green innovation. Unlike income tax incentives, which may fluctuate, depending on changes in the government’s policies or economic conditions, reductions in VAT offer a stable and predictable benefit for businesses that produce or use environmentally friendly products or services. This stability encourages long-term planning and businesses’ investment in sustainable technologies.
Fourthly, reductions in VAT often require an environmental impact assessment as part of the application process. This requirement ensures that only genuinely eco-friendly products or services can benefit from the incentive, thus preventing the misuse of the policy while also encouraging companies to prioritize sustainability when developing new offerings.
In conclusion, reductions in VAT have proven more effective than income tax incentives in promoting green innovation among businesses due to the supporting infrastructure, the direct impact on consumers’ behavior, the long-term stability of the benefits provided by the incentive program, and the environmental impact assessments required during the application process.
5. Robustness Test
In this study, there was a relatively long waiting period for companies’ green patent applications to be approved. As a result, the dependent variable was adjusted and moved forward by one period to obtain its antecedent variable, GTI_1. This was then incorporated into the model for further examination, and the results of the regression are displayed in
Table 4. The coefficient of income tax preferences (Tax1) was 0.037, showing a significant positive correlation at the 5% level. The coefficient of value-added tax preferences (Tax2) was 0.381, and it remained significantly correlated at the 1% level. Consequently, the conclusion drawn from this study remains valid.
6. The Moderating Effect of R&D Investment
This research study used the following methods to examine the mediation effect of R&D investment, and the specific outcomes are presented in
Table 5.
Step 1: The first step was to examine the influence of the explanatory variables (Tax1, Tax2) on the explained variable (GTI), that is, the total effect. If the regression coefficient was significant, the next test was carried out; otherwise, there was no intermediary effect.
Step 2: The second step was to examine the influence of the explanatory variables (Tax1, Tax2) on intermediate variables (RD). If the regression coefficient was significant, the next test was carried out. Otherwise, further Sobel tests were performed.
Step 3: The third step was to include the mediating variable (RD) in the model of the explanatory variables (Tax1, Tax2) and the explained variable (GTI). If the coefficient of the mediating variable (RD) on the explained variable (GTI) was significant, and the coefficient of the explaining variables (Tax1, Tax2) on the explained variable (GTI) was not significant or close to 0, then there was a complete mediating effect. Otherwise, there was a partial intermediation effect.
As shown in Columns (1) and (4), the coefficient of income tax incentives (Tax1) and the performance of green technology innovation (GTI) was 0.029, which was significantly positively correlated at the 10% level. The coefficient of value-added tax preferences (Tax2) and the performance of green technology innovation (GTI) was 0.428, and there was a significant positive correlation at the 1% level. Therefore, the first step was successfully verified.
As shown in Columns (2) and (5), the regression coefficient between income tax preferences (Tax1) and R&D investment (RD) was 0.013 and was significantly positive at the 1% level. The regression coefficient of value-added tax preferences (Tax2) and R&D investment (RD) was 0.023 and was significantly positive at the 1% level. Hence, tax incentives can significantly increase enterprises’ R&D investment, and the second step was successful.
As seen in Columns (3) and (6), the coefficient of income tax preferences (Tax1) and the performance of green technology innovation (GTI) was 0.023, and the coefficient of R&D input (RD) and the performance of green technology innovation (GTI) was 3.132, with the latter significantly positively correlated at the 1% level. Similarly, the coefficient of value-added tax preferences (Tax2) and the performance of green technology innovation (GTI) was 0.357, and the coefficient of R&D input (RD) and the performance of green technology innovation (GTI) was 2.964, and both were significantly positively correlated at the 1% level. Therefore, it can be concluded that R&D investment plays a part as an intermediary in the impact of tax incentives on enterprises’ level of green technology innovation. The third step was successfully verified, and H3a and H3b were verified.
6.1. Quantile Regression
This research used the quantile regression method to test the robustness of the empirical model. This method can effectively show the overall picture and changes between variables at different loci. Compared with the least squares method, it is more reliable in dealing with outliers. In this study, regression analysis was conducted on subsamples of 25%, 50%, and 75%. The results are presented in
Table 6,
Table 7,
Table 8 and
Table 9.
Table 6 and
Table 7 reveal that the promoting effect of income tax incentives (Tax1) on the performance of green technology innovation (GTI) was more significant for the 50% and 75% subsamples, but less significant for the 25% subsamples. The intermediary effect was significant at all subsamples. The results in
Table 8 and
Table 9 indicate that the promoting effect of value-added tax preferences (Tax2) on the performance of green technology innovation (GTI) and the mediating effect on R&D investment (RD) were significant for each subsample.
Overall, the results of the quantile regression method showed only slight changes in significance and the size of the coefficients, but the conclusions of the research remain robust. Therefore, the empirical conclusions presented in this study are still valid.
6.2. Propensity Score Matching
The purpose of this research was to examine the possible endogeneity issues using the PSM propensity score matching method. The treatment group was firms that enjoyed preferential tax policies, while the control group was firms that did not enjoy these policies. To match the PSM propensity score, six covariates, including the firm’s size, the firm’s growth, total turnover of assets, returns on equity, ratio of the top 10 shareholders’ share, and the ratio of fixed assets, were selected. The results of matching are presented in
Table 10. It is worth noting that the variables’ standard deviation in the table after matching was less than 10, indicating the effectiveness of the propensity score matching model.
Table 11 displays the results of the PSM analysis based on the nearest neighbor matching method. The table shows that the t-value of ATT was 2.15, which was greater than 1.96. Therefore, there was a significant positive correlation between tax incentives and the green technology innovation of enterprises.
Table 12 shows the results of the PSM-DID test. Columns (1) and (2) display the results before PSM-DID, while Columns (3) and (4) display the results after PSM-DID. According to
Table 12, the regression coefficients of income tax preferences (Tax1) and value-added tax preferences (Tax2) were 0.1153 and 0.4677, respectively. Both coefficients were significantly positively correlated at the 5% level. Thus, the regression test results still supported H1a and H1b, making the conclusion of the research robust.
7. Heterogeneity analysis
7.1. Nature of the Enterprises
In China, state-owned enterprises enjoy a solid economic foundation and a good reputation due to the country’s unique background system. This makes them more influential in the capital market and gives them an advantage in obtaining innovative resources. Consequently, tax incentives have a weaker impact on green innovation by state-owned enterprises. On the other hand, non-state-owned enterprises face asymmetric information and an imperfect financial environment, which limits their natural competitive advantages. According to data from the National Bureau of Statistics, 70% of loan funds go to 40% of state-owned enterprises, while non-state-owned enterprises, which have a more extensive range of market players, receive less than 30% of the loan funds. Therefore, tax incentives have a more significant impact on green technology innovation by non-state-owned enterprises and play a vital role in providing timely support.
The results of the regression in
Table 13 show the impact of tax incentives on the performance of green technology innovation, grouped by ownership. Columns (1) and (2) represent state-owned enterprises (State = 1), while Columns (3) and (4) represent non-state-owned enterprises (State = 0). The SUEST test confirmed the validity and comparability of the grouped samples.
The results in Columns (1) and (3) revealed that income tax incentives do not significantly affect the performance of green technology innovation by state-owned enterprises. In contrast, non-state-owned enterprises showed a significant positive correlation between income tax incentives and the performance of green technology innovation at the 5% level. Moreover, Columns (2) and (4) suggest that VAT preferences have a more significant role in promoting non-state-owned enterprises than state-owned enterprises.
In summary, tax incentives had a more significant impact on the performance of green technology innovation by non-state-owned enterprises. This reflects the role of “providing charcoal in the snow” for supporting non-state-owned enterprises to innovate and grow.
7.2. Business Environment
The business environment has always played a crucial role in optimizing the allocation of market resources, thereby affecting the ability of enterprises to innovate. To boost their confidence in green innovation and development, enterprises can enjoy various preferential tax policies. In this regard, enterprises can enhance their advantages of sustainable development by continually improving and optimizing the business environment.
To explore the differences in the impact of tax incentives on enterprises’ green technology innovation under different business environments, this study referred to the marketization index report of China by province, dynamically updated by Fan Gang and Wang Xiaolu. The report conducted grouping regressions and selected the median of the sample to mark it as either a business environment with a high level (Envir = 1) or a business environment with a low level (Envir = 0).
The inter-group coefficients underwent a SUEST test, which significantly rejected the null hypothesis, indicating that the grouped samples were valid and comparable. In the results of the regression in
Table 14, Columns (1) and (2) represent groups with a high-level business environment, while Columns (3) and (4) represent groups with a low-level business environment.
As seen in Columns (1) and (2), the coefficients for income tax preferences (Tax1) and value-added tax preferences (Tax2) with the performance of green technology innovation (GTI) were 0.133 and 0.485, respectively, and were significantly positive at 5% and 1%, respectively. Columns (3) and (4) show that the relationship between income tax preferences (Tax1) and the performance of green technology innovation (GTI) was not significant. However, the coefficient between value-added tax preferences (Tax2) and the performance of green technology innovation (GTI) was 0.314, which were significantly positively correlated at the level of 5%.
It can be inferred that tax incentives in regions with a business environment at a higher level, i.e., faster marketization processes, tend to have a better promoting effect on the performance of green technology innovation. Therefore, from the viewpoint of external influencing factors, continually improving and optimizing the business environment is an effective countermeasure to stimulate the endogenous power of the green technology innovation of enterprises.
7.3. Characteristics of the Industry
In the current policy environment in China, industries that pollute heavily face stricter environmental and resource restrictions compared with non-heavily polluting industries. These heavily polluting industries typically involve high capital investment, with significant investments into fixed assets and long recovery periods. As a result, these industries have become dependent on high pollution, energy consumption, and emissions over time, making it challenging to transition to cleaner production methods quickly.
For companies in heavily polluting industries, pursuing a green technological transformation involves replacing a large portion of their original machinery and equipment with greener and cleaner alternatives, and actively engaging in green technology research and development. Due to the unique nature of these industries, the cost of transitioning to green technology is often higher than that for companies in non-heavily polluting industries. Consequently, the level of green technological innovation in heavily polluting industries is lower than in non-heavily polluting industries.
Due to significant cost pressures, companies in heavily polluting industries lack the incentive to invest resources into high-quality green technological innovation. Given the current policy background for the development of green innovation, companies in heavily polluting industries may opt for low-quality green technological innovation activities to comply with policy requirements or obtain tax preferences. However, these activities rarely result in high-quality green innovation patents for these companies.
In summary, companies in different industries are motivated differently when it comes to green technological innovation. The higher costs of treating pollution and the greater cost pressures for technological transformation mean that the impact of tax preferences on heavily polluting industries may not be as significant as on non-heavily polluting industries. To further explore the differing impact of tax preferences on heavily polluting and non-heavily polluting industries, the overall sample of enterprises was divided on the basis of the “Industry Classification Management Directory for Environmental Verification of Listed Companies” into heavily polluting industries (high pollution = 1) and non-heavily polluting industries (high pollution = 0), and a subsample regression was conducted. It is important to note that since the subsample regression was based on different industries, this regression relaxed the condition of fixing all industries and only controlled for the two characteristic variables of time and province.
The impact of tax preferences on the amount of outputs of green technological innovation by enterprises in heavily polluting and non-heavily polluting industries is presented in
Table 15. Columns (1) and (2) of
Table 15 display the results of the regression for enterprises in heavily polluting industries, while Columns (3) and (4) represent the results of the regression for enterprises in non-heavily polluting industries.
Table 15 reveals that the coefficient of the incentivizing effect of income tax preferences on the number of green technological innovations of non-heavily polluting industry enterprises was 0.043, which was significant at the 5% level. Similarly, for heavily polluting industry enterprises, the coefficient of the incentivizing effect of income tax preferences on the number of green technological innovations was 0.031, which was significant at the 10% level. The regression coefficient of value-added tax preferences on the number of green technological innovations of non-heavily polluting industry enterprises was 0.534, which was significant at the 1% level. In comparison, the coefficient of the incentivizing effect of value-added tax preferences on the number of outputs of green technological innovations by heavily polluting industry enterprises was 0.394, which was significant at the 10% level.
These results indicated that there was heterogeneity in the impact of tax preferences on the quantity of outputs of green technological innovation by enterprises in heavily polluting and non-heavily polluting industries. Tax preferences were found to stimulate enterprises in non-heavily polluting industries to carry out green technological innovation, while their effect on the green technological innovation behavior of enterprises in heavily polluting industries was relatively limited. This empirical result aligns with the theoretical analysis of the nature of the industry to which the enterprises belong, as discussed in the theoretical analysis above.
8. Conclusions
This study used theories of market failure, technological innovation, and public finance to examine the impact of tax incentives on the performance of green technology innovation by Shanghai’s and Shenzhen’s A-share listed companies from 2017 to 2022. Qualitative and quantitative analysis was used to analyze domestic and foreign literature, and theoretical and empirical methods were combined to present the policy basis of R&D tax incentives and the current state of green technology innovation by Chinese enterprises.
The study found that tax incentives promoted the performance of green technology innovation by guiding companies to increase their R&D investment. Income and value-added tax incentives were the two dimensions considered in this research. According to the empirical findings, the promotional impact of value-added tax preferences on enterprises’ green innovation was consistently more significant than that of income tax preferences. Tax incentives help alleviate the losses caused by externalities in the process of green technology innovation and encourage companies to introduce advanced green technology, which is critical for achieving low-carbon development goals.
The nature of ownership, the characteristics of the industry, and the level of the business environment caused differences in the impact of tax incentives on the performance of green technology innovation. The promoting effect of tax incentives on the performance of green technology innovation can better reflect the role of timely supply in non-state-owned enterprises. The role of tax incentives in promoting the performance of green technology innovation was more significant in areas with a higher level of the business environment. Enterprises in non-heavily polluting industries were more easily incentivized by preferential tax policies to undertake more green innovations.
In conclusion, the study recommends that the government should continually optimize and improve the business environment. This will be an effective countermeasure to promoting the implementation of tax incentives. Tax incentives should be used judiciously to encourage companies to innovate in green technology, balance economic growth and environmental protection, and achieve high-quality development.
There are two main issues in the research that need to be addressed. Firstly, the study sample was limited and needs more relevant data. Currently, most Chinese enterprises have a weak understanding of green development, and the system for applying for and acquiring green patents still needs to be developed. In the early stages, some companies did not publicly disclose data related to green technology innovation. To address this, the study used data from relevant databases over the past 5 years as a sample. However, this sample size may be insufficient and lead to deviations in the process of the empirical research and its conclusions. Future research should consider industry-related dimensions and conduct in-depth analyses, such as green total factor productivity, to avoid data loss.
Secondly, the measurement of the variables was biased. Although enterprises’ income tax and value-added tax account for the central part of research on enterprises’ tax incentives, tax incentives include other taxes throughout production and operation. To address this, future empirical research should measure tax incentives comprehensively and consider the differences in the preferential tax policies of different tax types. Furthermore, different preferential methods, such as tax rate concessions, additional deductions for research and development costs, tax deductions, tax rebates, and accelerated depreciation of fixed assets, could be considered. Different directions of the focus of tax incentive policies can also be considered. For example, this study focused on the performance of green technology innovation, but future research could examine the impact of tax incentives on the performance of strategic and substantive innovation separately. This will enable tax incentive policies to be more systematic and targeted.


