1. Introduction
As cities like Kaohsiung increasingly face urban disasters exacerbated by climate change, integrating disaster prevention with sustainable urban development strategies has become essential. This study assesses how Kaohsiung City’s disaster prevention planning aligns with broader goals of sustainable urban development, aimed at enhancing community resilience and improving the quality of urban life. It emphasizes eco-friendly policies that mitigate environmental impacts and promote urban regeneration, focusing on the interconnected roles of economic, social, and environmental factors.
This research highlights the importance of disaster prevention as a fundamental component of sustainable urbanism, which improves infrastructure resilience, pollution control, and neighborhood cleanliness. Crucially, the study examines how these efforts impact public service satisfaction and its relationship with residents’ material well-being and environmental contentment, exploring the direct effects on residents’ perceptions of urban living quality. The research goals specifically include analyzing the satisfaction with public facility services as a core element of urban sustainability, assessing its influence on residents’ intentions to remain in the city.
The primary research questions guiding this study are: How does satisfaction with urban disaster prevention influence residents’ intentions to remain in the city? What role does satisfaction with urban disaster prevention planning play in mediating the relationship between public service satisfaction and residential intentions?
Contrasting historical top-down governance models that limit community input, this study advocates for a participatory approach, emphasizing community involvement in disaster prevention as crucial for fostering innovation and improving urban livability. Despite extensive studies in urban planning and disaster management, there remains a significant gap in integrating these with residents’ satisfaction and intentions within Kaohsiung’s sustainable development framework. This study aims to bridge this gap by demonstrating how enhanced disaster preparedness correlates with increased residential stability and satisfaction.
Employing a Structural Equation Model, the research analyzes the interdependencies between residents’ satisfaction with public facility services and disaster prevention planning. The findings aim to demonstrate the effectiveness of these measures, providing actionable insights for policy and planning to ensure Kaohsiung continues to thrive amid environmental challenges. This comprehensive approach underscores the dual benefits of integrating disaster preparedness into urban development planning, particularly focusing on public service satisfaction as a key metric of success.
2. Literature Review
2.1. Residency Travel and Relocation
Satisfaction is commonly defined as an emotional or reactive response to an object [
1] or experience. In consumer theory, it is perceived as a feeling that the balance of outcomes to inputs is favorable [
2], which involves comparing expectations before purchase with actual post-purchase experiences. When a product meets or exceeds these expectations, satisfaction occurs; otherwise, dissatisfaction results [
3]. This concept underpins the fundamental principle in business that satisfying consumer needs is crucial for enhancing service quality, gaining competitive advantage, and boosting profitability [
4]. Introduced by Speare [
5], residential satisfaction extends beyond demographic factors like age, income, and duration of residence, which do not solely influence migration decisions. Instead, these decisions are also impacted by various variables contributing to an individual’s satisfaction within their living environment. Canter [
6] describes residential satisfaction as the pleasurable experiences in a spatial environment.
Empirical studies [
7] underscore the significance of enhancing residential satisfaction in influencing migration intentions and behaviors. Higher satisfaction levels are associated with an increased likelihood of prolonged residency, fostering stronger community ties and engagement. Dogge and Smeets [
8] argue that tenant loyalty, driven by satisfaction, should be seen as a strategic asset for sustainable competitive advantage in housing management. Zondag and Pieters [
9] demonstrate that improved accessibility and reduced commute times influence residential location choices, as these factors directly reduce the willingness to relocate. Similarly, Clark et al. [
10] note that the quality of the residence and its neighborhood environment are considered in migration decisions to optimize neighborhood quality.
Research by Kan [
11] and Shu-Mei Chen [
12] points out that perceptions of and satisfaction with the living environment can trigger migration motives, influenced heavily by the bonding effect of social networks. Long-term residency tends to increase migration costs due to solid neighbor relationships, while prolonged residence durations may decrease satisfaction with the living environment, paradoxically increasing the propensity to relocate. Finally, factors such as accessibility to public facilities, socioeconomic status of neighbors, neighborhood safety, air quality, and environmental tranquility are crucial in shaping residential satisfaction [
13,
14]. Chang et al. [
15] contend that, since the seismic events of the 1999 Chi-Chi earthquake and subsequent windstorms in Taiwan, the structural safety of dwellings has emerged as one of the factors influencing residential satisfaction.
The rise of urban populations worldwide, caused by rapid population growth and urbanization processes, makes urban quality of life relevant to more and more people [
16]. With the rapid development of cities worldwide and the high concentration of people, materials, and facilities, densely populated metropolises exhibit high vulnerability to earthquakes, floods, fires, and other prone disasters [
17]. Social sustainability in cities is becoming increasingly relevant due to rapid urbanization, the increasing global population, and multiple societal challenges. At the same time, climate change mitigation and adaptation make considerations of urban social sustainability and social justice even more urgent [
18].
2.2. Kaohsiung City Overview and Sustainable Development
Kaohsiung City, Taiwan’s largest industrial and third-largest city with a population of 2.75 million, plays a key role in the country’s industrial sector and the prominence of Kaohsiung Port. Its urban zone comprises 20.5% residential, 3.7% commercial, and 7.4% industrial areas. The city’s industrial sector, diverse in nature, includes traditional manufacturing, basic metals, chemicals, petroleum, metal products, and electronic components. Since 2010, the number of factories has increased by 26.3%. However, due to industrial activities, Kaohsiung faces challenges such as air pollution and high electricity demand. The city is characterized by numerous underground pipelines for petrochemical products, totaling 71 pipelines stretching 936 km (2021). A significant gas explosion in 2014 in these pipelines caused casualties and infrastructural damage. Air pollution in Kaohsiung is influenced by monsoons, topography, and local emissions, with 24% originating from overseas sources (monsoon-affected), 43% from local topography, and 33% from local emissions. From 2017 to 2021, the city’s overall electricity consumption increased by 7.63%, with the industrial sector experiencing a notable growth of 13.10% [
19].
Moreover, the rapid industrial expansion in Kaohsiung City has led to river pollution and flooding issues. In 2021, 13.9% of river pollution cases were severe, 55.8% moderate, and 30.3% lightly polluted or uncontaminated. Pollution sources vary across the city: northern rivers are predominantly affected by livestock wastewater, central rivers by metal surface treatment and electroplating, urban areas by domestic sewage, and southern rivers by chemical and industrial wastewater. In extreme weather, Kaohsiung City faces flooding, often due to overflowing rivers or high external water levels impacting rainwater discharge. Past events like Typhoon Morakot (2009), Typhoon Fanapi (2010), Typhoon Meranti (2016), and the heavy rainfall of 2018 have caused substantial economic losses. These incidents underscore the importance of the city’s preparation for climate-related disasters [
20].
Recently, the Kaohsiung City government has pursued sustainable urban development. In 2020, it redefined its indicator framework, aligning with the Sustainable Development Goals (SDGs) and Taiwan’s Sustainable Development Goals, establishing 80 key performance indicators (KPIs) for 2020–2024. These focus on objectives like ending poverty, enhancing quality of life, ensuring clean water, industrialization, innovation and infrastructure, sustainable urban and rural development, responsible production and consumption, and climate change mitigation. In 2021, aligning with the SDGs’ principle of “Leaving no one behind”, Kaohsiung published its first Voluntary Local Review (VLR), examining the 17 SDGs. The city aims to become a net-zero emissions sustainable city by 2050, as highlighted in its second VLR published in 2022, which focuses on “Industrial Transformation”, “Job Creation”, “Transportation Infrastructure”, and “Air Pollution Improvement”. This VLR outlines Kaohsiung’s strategies and actions, demonstrating its commitment to urban sustainable development. However, public transportation, including metro, light rail, and buses, accounts for only about 10% of total transport, significantly lower than private vehicle usage [
21].
Disasters are a prevalent worldwide problem, hindering sustainable and healthy global development [
17]. Despite concerted calls over the past 20 years to ensure that urban development is undertaken to reduce disaster risk, urban planning often remains myopically focused on the built environment, seeing building codes and land-use planning as the most effective mechanisms of Disaster Risk Reduction (DRR). Embedding DRR into urban planning means moving beyond disaster risk preparedness, seeking to redress, where possible, the underlying drivers of disaster risk [
22]. As cities grow and become increasingly interconnected, natural and human-caused disasters present a clear threat to the functionality of infrastructure systems that support communities’ physical and economic well-being worldwide. Protecting these systems is vital for ensuring that the populations that depend on them can survive despite significant disruptions [
23]. A disaster prevention project can be considered a part of national policy to protect the lives and property of people by ensuring that a national territory is safe in the event of a disaster [
24]. It was found that if citizens felt safe in a city and were satisfied with the place they lived in, they were also likely to be satisfied with life in the city [
25].
3. Methodology
This study employs a structured questionnaire to assess variables grouped into four main categories: Public Facility Services, Urban Disaster Prevention Planning, Expectations for Future Public Construction, and Residents’ Willingness to Live. Each category is carefully defined to capture specific aspects of urban living that influence residents’ intentions to remain in Kaohsiung City.
Public Facility Services: valuates the accessibility and quality of essential civic amenities, such as transportation, pipeline system, environment, and landscape, which are crucial for everyday convenience and quality of life.
Urban Disaster Prevention Planning: assesses the city’s infrastructure and service effectiveness in mitigating and managing urban disasters. This category gauges residents’ perceptions of safety and preparedness, which are pivotal in shaping their confidence in the city’s management and response strategies.
Expectations for Future Public Construction: involves residents’ perspectives on planned infrastructure projects and urban developments. This dimension reflects their hopes and concerns about the city’s future sustainability and growth, influencing their long-term residential decisions.
Residents’ Willingness to Live: measures the overall inclination of residents to continue living in Kaohsiung, considering economic stability, environmental quality, community dynamics, and the cumulative impact of the factors above.
The questionnaire design ensures precise measurement of each variable, allowing for a comprehensive analysis of how these aspects collectively influence residents’ decisions. By integrating economic dimensions, the study aims to provide insights into the dynamic interactions between urban planning, disaster preparedness, future expectations, and residential intentions, thereby offering a holistic view of what drives residents’ decisions in an urban setting.
3.1. Research Hypothesis
This study posits a series of hypotheses to elucidate the interrelations between urban disaster prevention planning, public service satisfaction, and residents’ intentions to continue residing within an urban setting. These hypotheses are framed to explore the direct and mediating effects within the context of sustainable urban development:
Hypothesis 1 (H1). Satisfaction with public facility services positively influences residents’ intentions to remain in the city. This hypothesis reflects the assumption that higher satisfaction with essential services like transportation, utilities, and safety provisions increases the likelihood of residents choosing to continue living in their current urban environments.
Hypothesis 2 (H2). Satisfaction with urban disaster prevention planning directly enhances residents’ willingness to reside in the city. This hypothesis explores the direct impact of feeling secure in the city’s ability to manage and mitigate urban disasters on the residents’ decision to stay.
Hypothesis 3 (H3). Urban disaster prevention planning satisfaction mediates the relationship between public service satisfaction and residential intentions. This mediation hypothesis suggests that the effect of public service satisfaction on residential intentions is partially transmitted through how residents perceive urban disaster preparedness.
Hypothesis 4 (H4). Expectations for future public infrastructure development positively impact residents’ willingness to live in the city. This hypothesis addresses the forward-looking aspect of urban living, positing that anticipation of improvements and new developments can significantly affect residential stability.
Each hypothesis is crafted to test specific dimensions of urban living and planning, ensuring a structured approach to understanding the dynamics of urban residency decisions. These refined hypotheses will guide the subsequent analysis, providing a clear and structured framework for interpreting the empirical data collected through our study (
Figure 1).
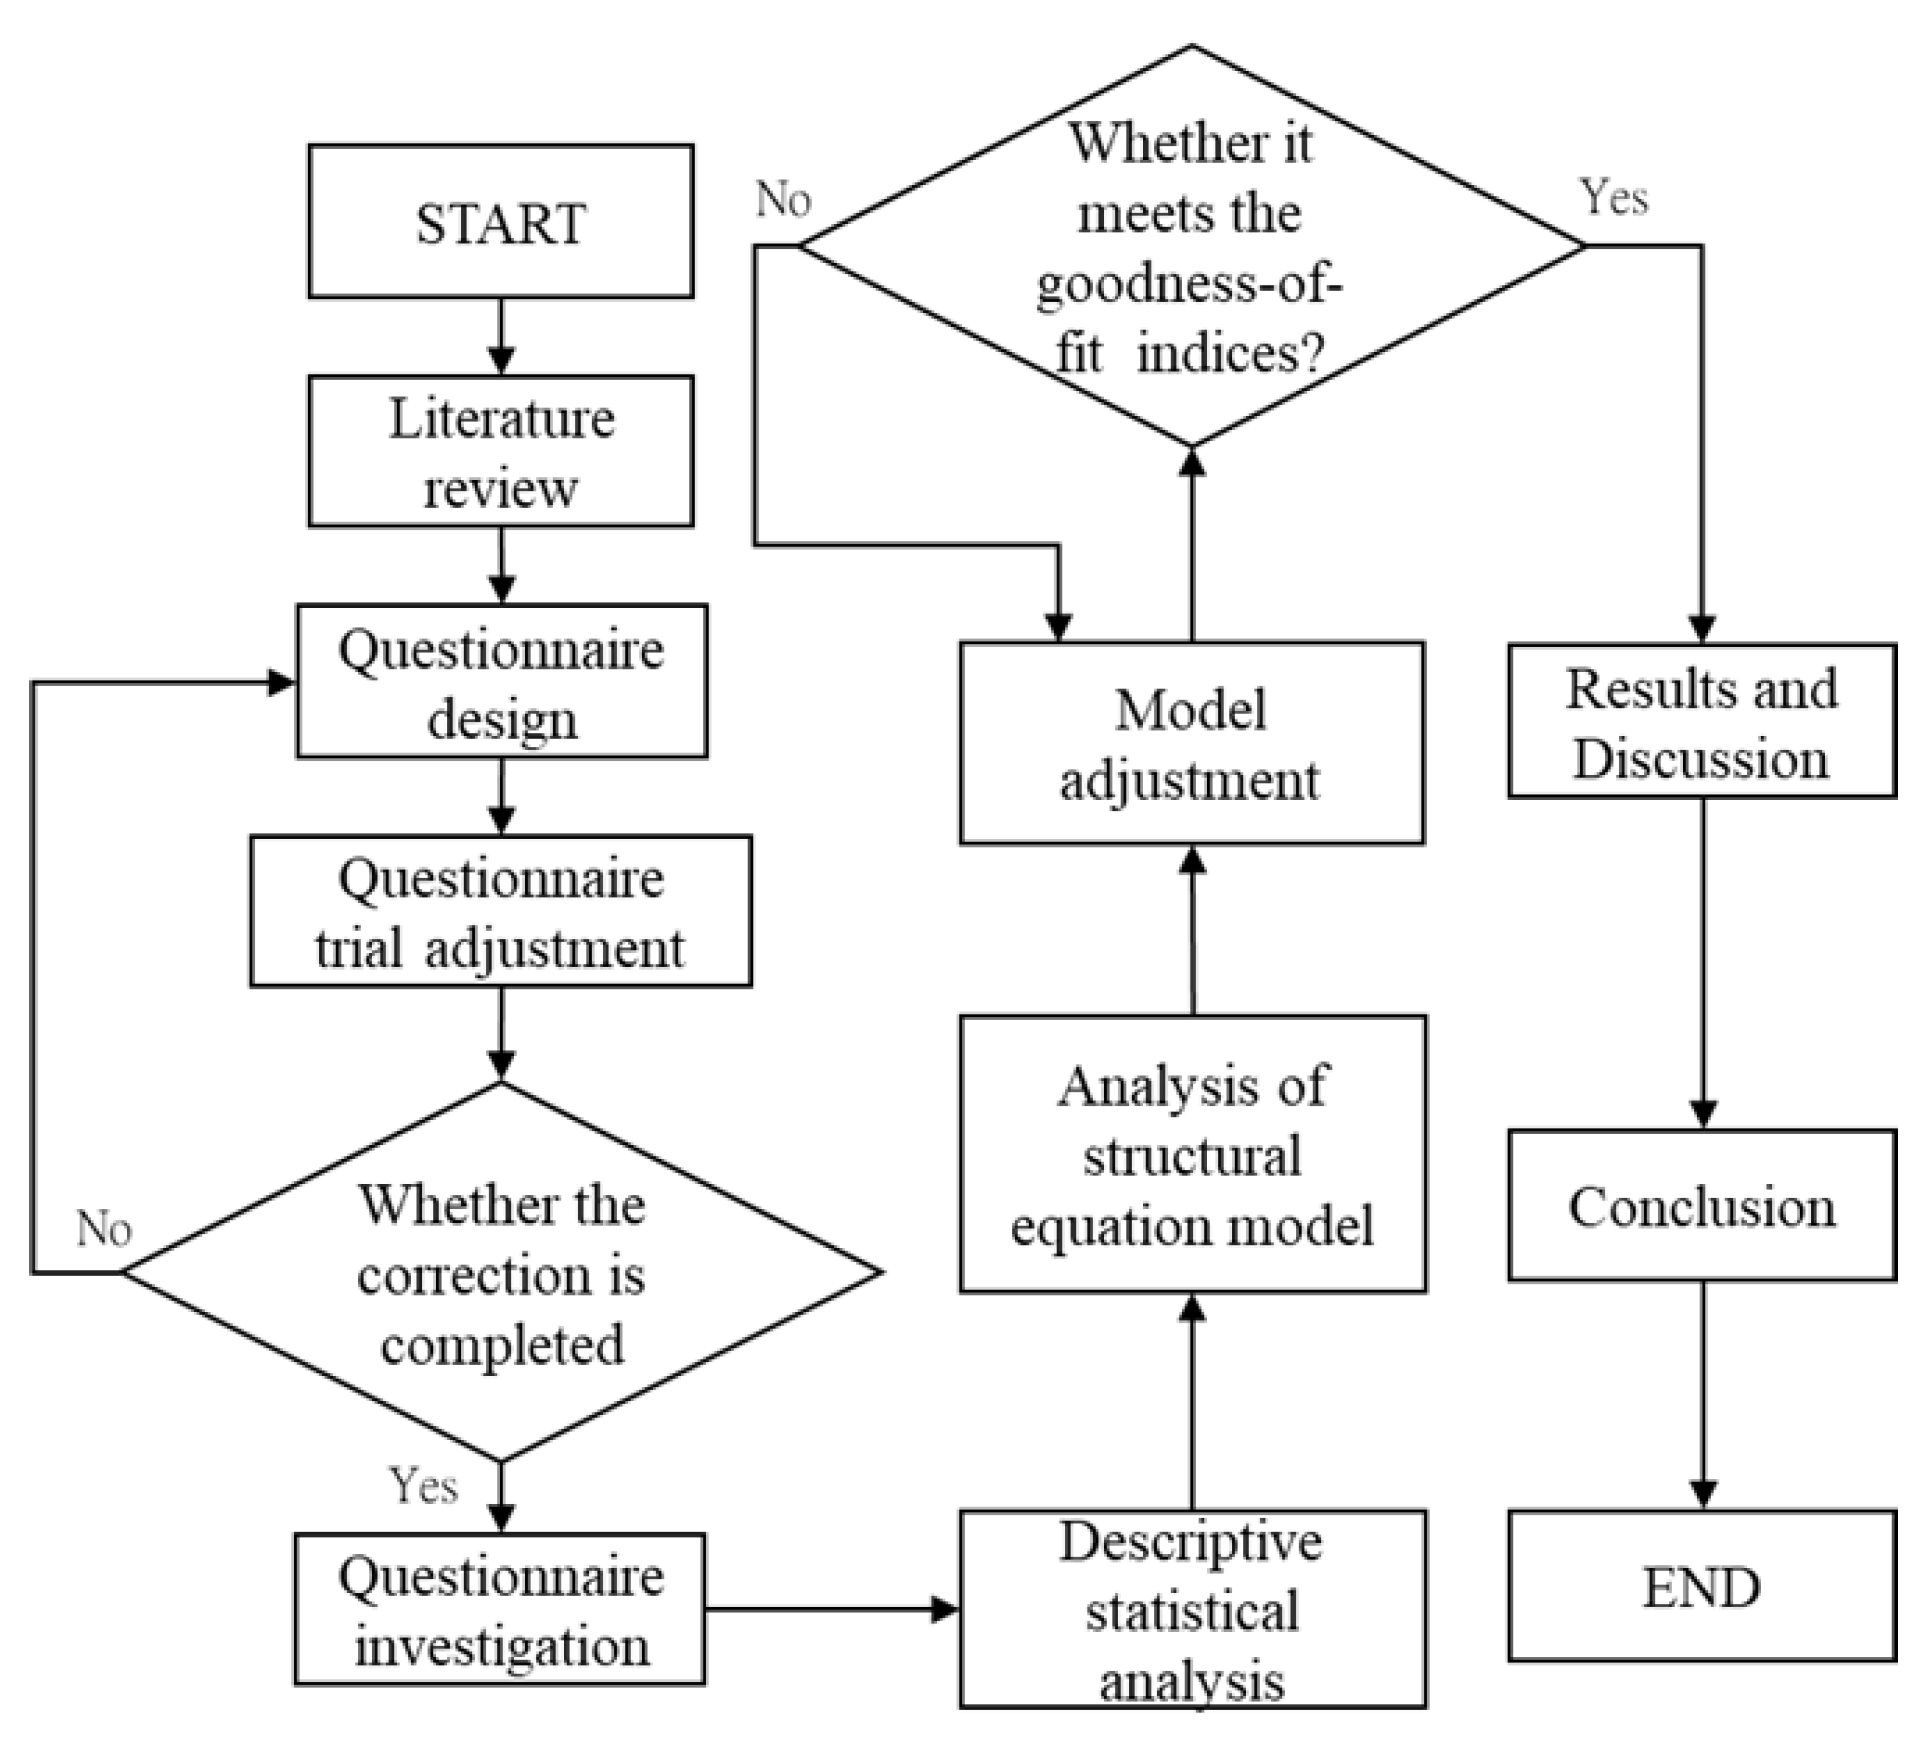
3.2. Research Framework
Figure 2 illustrates the research framework of this study. A literature review is conducted to design a questionnaire addressing residents’ satisfaction with public facility services, urban disaster prevention planning, expectations for future development, and residential intentions. Subsequently, the preliminary questionnaire results are subjected to expert review by five scholars for refinement. After the necessary adjustments are made, a formal questionnaire is finalized. Using the snowball sampling method, a survey is administered to residents, and the collected valid responses are subjected to statistical analysis, including descriptive statistics and Structural Equation Modeling (SEM). Finally, the SEM results are examined to explore the impact of satisfaction with sustainable urban disaster prevention planning on residential intentions and its mediating effect on satisfaction with public facility services, providing insights for assessing urban disaster prevention effectiveness.
3.3. Structural Equation Model
- (1)
Model Composition and Effects
Structural Equation Modeling (SEM) is a sophisticated method within multivariate statistics that combines elements of factor analysis and path analysis. This integration allows SEM to examine the relationships among observed variables (directly measured), latent variables (conceptual constructs), and error variables (measurement errors) within a specified model. SEM is primarily used in confirmatory model analysis to validate hypothesized relationships but can also be applied exploratorily to examine new data structures, such as survey responses.
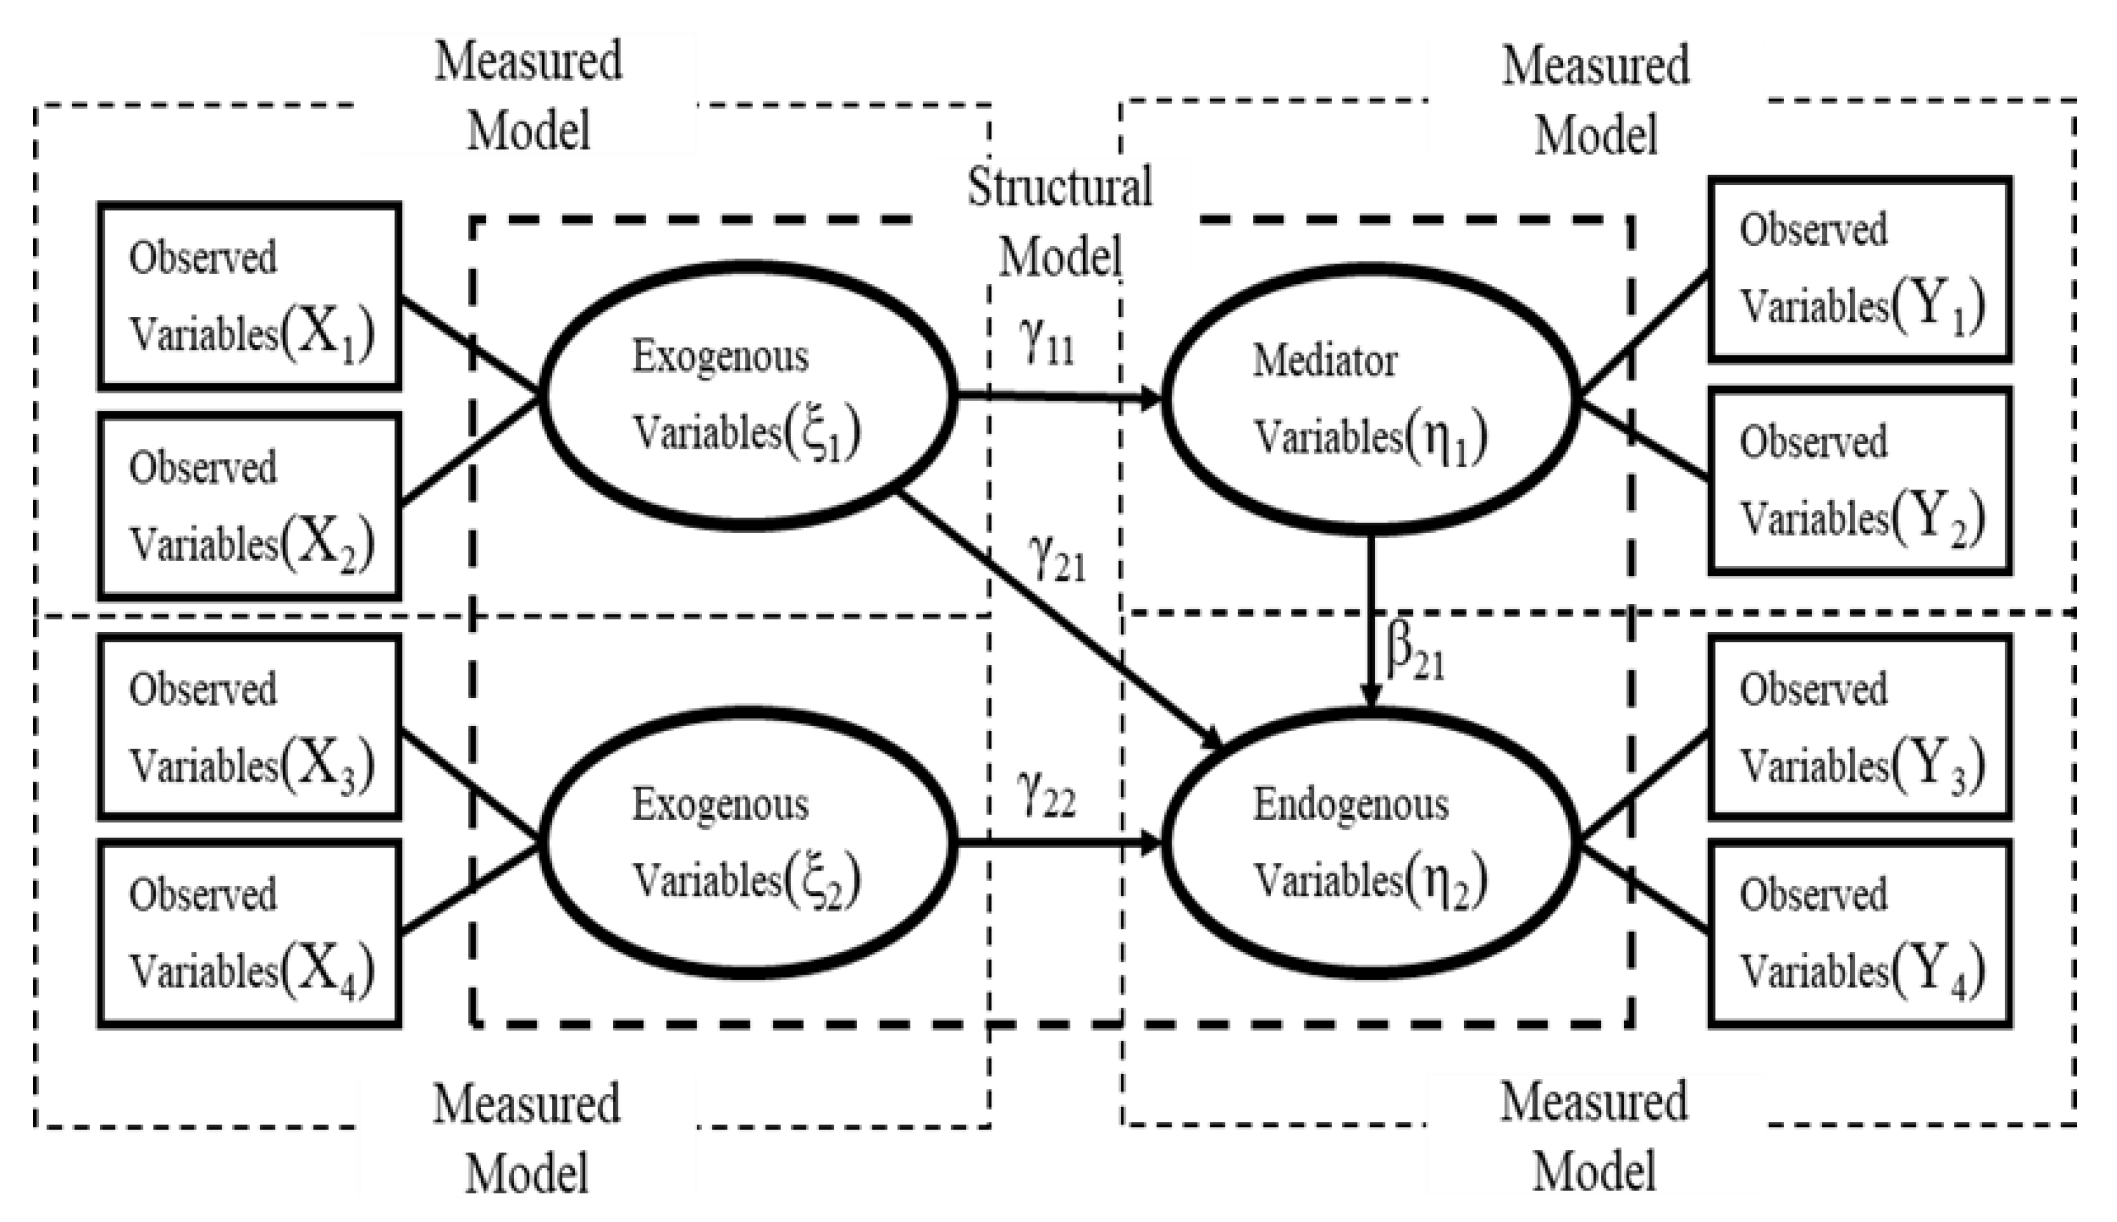
A SEM framework consists of two main components: the measurement and structural models, as illustrated in
Figure 3. Based on factor analysis, the measurement model demonstrates how observed variables combine to form latent variables, thus defining latent constructs through specific observable items. The structural model, informed by path analysis, elucidates the causal relationships among latent variables, establishing a structural pattern [
26]. These latent variables are classified into exogenous (independent variables exerting influence), endogenous (dependent variables being influenced), and mediator variables (which both influence and are influenced by others). Causal relationships are indicated by arrows, depicting the direction of influence from the cause to the effect.
In
Figure 3, the linear regression equations for the mediator variable (η
1), endogenous variable (η
2), and exogenous variables (ξ
1, ξ
2) can be expressed as follows [
27]:
In the above equations, γ and β denote the regression coefficients for exogenous and mediator variables, while ε represents the residual term. The regression coefficients, also known as path coefficients, elucidate the causal relationship or, equivalently, the effect value between the variables. Substituting Equation (1) into Equation (2) yields:
In the above equation, γ21 is referred to as the direct effect of ξ1 on η2. The term β21 × γ11 is termed the indirect effect of ξ1 on η2. The indirect effect represents the influence of the exogenous variable ξ1 on the endogenous variable η2 through the mediator variable η1. Therefore, β21 × γ11 + γ21 is termed the total effect of ξ1 on η2. The analytical results in SEM align with those obtained through multiple regression analysis when considering path coefficients, direct effects, indirect effects, and total effects. However, SEM analysis provides the advantage of evaluating the overall fit between the SEM model and the data. This holistic assessment of goodness of fit will be expounded upon in the subsequent section of the article.
The linear regression equations for the measurement model in the above figure can be expressed as follows:
In the above expression, ΛX and ΛY represent the standardized (regression) coefficients of the measurement variables, also known as factor loadings. At the same time, δ and υ denote the error terms of the measurement variables. Suppose the factor loadings in the measurement model are all statistically significant (p < 0.05 or an absolute t-value greater than 1.96). In that case, it indicates that the observed variables in the measurement model can effectively reflect their latent variables. The squared value of the standardized coefficients, known as the coefficient of determination (R2), represents the reliability of the observed variables. Generally, it is required that factor loadings reach a significant level, and their values should exceed 0.5, i.e., R2 > 0.25, indicating acceptable reliability of the observed variables. When R2 > 0.5, meaning that the factor loading is greater than 0.71, it implies that the observed variable’s variance explained by its latent variable exceeds its error variance, signifying good reliability. In such cases, the observed variable is called an indicator variable.
- (2)
Goodness of Fit Statistics
In Structural Equation Modeling (SEM), goodness of fit statistics are used to assess the consistency between the model and the data. These statistics help us understand whether the model can effectively explain the data. The evaluation of model fit involves the following three aspects [
28]:
Preliminary fit criteria
Error variances should not be negative, i.e., the coefficient of determination R2 < 1.
Error variances must be significant (t > 1.96).
Factor loadings should range between 0.5 and 0.95.
Correlation coefficients should be less than 1.
Overall Model Fit Indices
The overall model fit indices and their standards (threshold values) are presented in
Table 1, including absolute fit indices, relative fit indices, and parsimonious fit indices.
3.4. Questionnaire and Survey Design
The research questionnaire adopts a structured design, covering two main categories of items: respondent demographics and perceptions. Demographic information includes gender, age, marital status, education level, average monthly income, residence, and duration of residence. Perception items utilize a Likert five-point scale, with 1 indicating “Very Dissatisfied”, 2 for “Dissatisfied”, 3 for “Neutral”, 4 for “Satisfied”, and 5 for “Very Satisfied”. Perception items are categorized into five types: reasons for residence, satisfaction with public facility services, satisfaction with urban disaster prevention planning, expectations for future public facilities in Kaohsiung, and willingness to live. The first four categories cover current public services and disaster prevention planning in Kaohsiung. The willingness to live items include personal willingness and the willingness to recommend to friends and family, as shown in
Table 2. The significance of the questionnaire design for willingness to live lies in expanding from the respondent’s willingness to recommend it to friends and family, capturing a broader perspective.
The statement mentions that, apart from the basic information of the interviewee (Category A), other perception items in the research questionnaire include satisfaction with public facility services (Category D), satisfaction with disaster prevention planning (Category E), and expectations for future development (Category F). Items in Categories D to F all use a Likert five-point scale, as shown in
Table 3.
3.5. Enhanced Verification of Survey Reliability and Statistical Analysis
To ensure the reliability of our survey results, the questionnaire underwent rigorous pre-testing with a small subset of the target population in Kaohsiung City. This pilot study helped refine the survey questions, ensuring clarity and relevance. The reliability of the scales was confirmed with a Cronbach’s alpha of 0.85, indicating strong internal consistency among the items.
The Structural Equation Modeling (SEM) was applied to test the hypothesized relationships. The model’s goodness of fit was assessed using several indices. The Root Mean Square Error of Approximation (RMSEA = 0.025), Goodness of Fit Index (GFI = 0.954), and Comparative Fit Index (CFI = 0.997) all suggest a good fit, confirming the model’s robustness and the validity of the findings. These indices demonstrate that the model adequately represents the data and supports the hypothesized relationships.
Additionally, to further verify the positive determination of our results, the analysis was subjected to several robustness checks, including alternative model specifications and bootstrapping, to assess the stability of the parameter estimates. These tests confirmed that the findings are not sensitive to specific model assumptions, lending additional credibility to our results.
By incorporating these enhanced methodological details and results verification processes, we address the concerns regarding the reliability of the survey and the verifiability of our findings, ensuring that our conclusions are robust and replicable.
4. Results
4.1. Respondent Structure
This study’s survey in Kaohsiung City garnered 500 responses, with valid submissions totaling 327 after excluding incomplete, duplicate, and uniformly answered questionnaires, achieving a 65.4% effective response rate. The demographic distribution of respondents is as follows:
Regarding gender, male respondents constituted 56.6%, while female respondents accounted for 43.4%. This indicates a relatively balanced distribution in the gender responses, with a roughly similar proportion between males and females.
Regarding age, most respondents fell within the 46–60 age range, constituting 33% of the total. Following this, the 36–45 age group comprised 21.4% of the respondents, while the 26–35 age group accounted for 18.3%. The remaining distribution includes respondents aged over 60 (13.5%), those aged 21–25 (8.6%), and finally, respondents aged 20 and below (including 20), who make up 5.2%. This indicates that approximately 86% of the survey participants in this study are aged 25 and above, aligning with the study’s focus on a more experienced demographic.
Regarding marital status, most respondents are married, constituting 62.7%, while unmarried respondents comprise 37.3%.
Regarding educational attainment among respondents, 60.6% possess a university degree, making it the most common level of education. Those with a high school education or lower comprise 22.3%. Additionally, 15.9% have a master’s degree, while doctoral holders account for 1.2%.
Regarding residence duration among survey respondents, 31.2% have lived in their current location for over 31 years. The next largest group, 15.6%, have resided for 16–20 years, followed by 12.8% for 21–25 years and 11.3% for 6–10 years. Other segments include 10.7% for 11–15 years, 9.2% for up to 5 years, and another 9.2% for 26–30 years. This distribution indicates that over 90% of participants have been living in their current location for more than five years, highlighting their substantial residential tenure.
Regarding professional experience, the survey revealed varied work tenures among respondents. The largest group, encompassing 22.0%, has less than 5 years of experience. This is followed by 19.0% with over 31 years, 13.8% with 16–20 years, 11.9% with 21–25 years, and 11.6% with 6–10 years of experience. Smaller segments include 11.3% with 11–15 years and 10.4% with 26–30 years of experience. Notably, 78% of participants have more than 5 years of experience, reflecting the study’s emphasis on individuals with significant professional backgrounds.
Regarding occupation, the majority of respondents, 36.7%, are employed in the service industry. The following significant segments include individuals working in the business sector, constituting 15.0%, followed by those in the engineering field at 13.1%, and individuals in the education sector at 12.8%. The remaining categories encompass individuals in other occupations at 9.5%, those in the public sector at 4.9%, and individuals in the industrial industry at 4.49%.
In the engineering profession, the largest group comprises individuals without specific engineering-related knowledge, accounting for 74.0%. The following significant segments include those involved in construction and project management, constituting 9.2%, followed by individuals in engineering education at 4.3%, and those specializing in building materials at 3.4%.
In terms of average monthly income, the survey respondents’ earnings predominantly fall between 41 to 50 thousand NTD (19.9%). The subsequent income brackets include 31 to 40 thousand NTD (18.3%), 51 to 60 thousand NTD (14.1%), and 61 to 80 thousand NTD (13.8%). Smaller segments earn under 30 thousand NTD and over 100 thousand NTD, each comprising 12.5%, while 81 to 100 thousand NTD earners account for 8.9% of the respondents.
In terms of the reasons for residence, the majority, at 92%, are long-term residents. The remaining categories include individuals residing for short-term employment at 5.2% and those living for short-term education at 2.8%.
4.2. SEM Analysis
- (1)
Fit Testing of the Adopted model
This study utilized LISREL 8.8 software to perform SEM analysis, detailed in
Table 1 and
Table 4. The adopted model demonstrates strong fit indices: Chi-square (χ
2) = 148.19 with 123 degrees of freedom and a
p-value of 0.061, suggesting good alignment with the survey data. Notable fit indices include RMSEA = 0.025 and SRMR = 0.037, both well below the 0.05 threshold, indicating an adequate model fit. Comprehensive indices further validate the model’s robustness: GFI = 0.954, AGFI = 0.929, NFI = 0.987, NNFI = 0.996, CFI = 0.997, IFI = 0.997, and RFI = 0.982, all surpassing the 0.90 threshold.
The parsimonious fit indices for the adopted model indicate a superior fit compared to both independent and saturated models. The AIC (282.187) and CAIC (603.115) values are substantially lower than those for the independent (AIC: 1282.014, CAIC: 12,173.023) and saturated models (AIC: 380, CAIC: 1290.062). The ECVI value of 0.866 confirms a better fit than the saturated (1.116) and independent models (37.061). A well-aligned path diagram supports this model’s effectiveness, and all error variances are reported as positive. The R2 values are mostly above 0.5, indicating solid indicators, except for “Urban Renewal (D5)”, “Building Safety (E5)”, and “Project Management (E6)”. T-values exceed the significance threshold of 1.96, and factor loadings range from 0.5 to 0.95, affirming the model’s adequacy. The average variance extracted exceeds 0.5, and composite reliabilities are above 0.6, demonstrating the model’s reliable and valid representation of latent variables.
- (2)
SEM Analysis Results
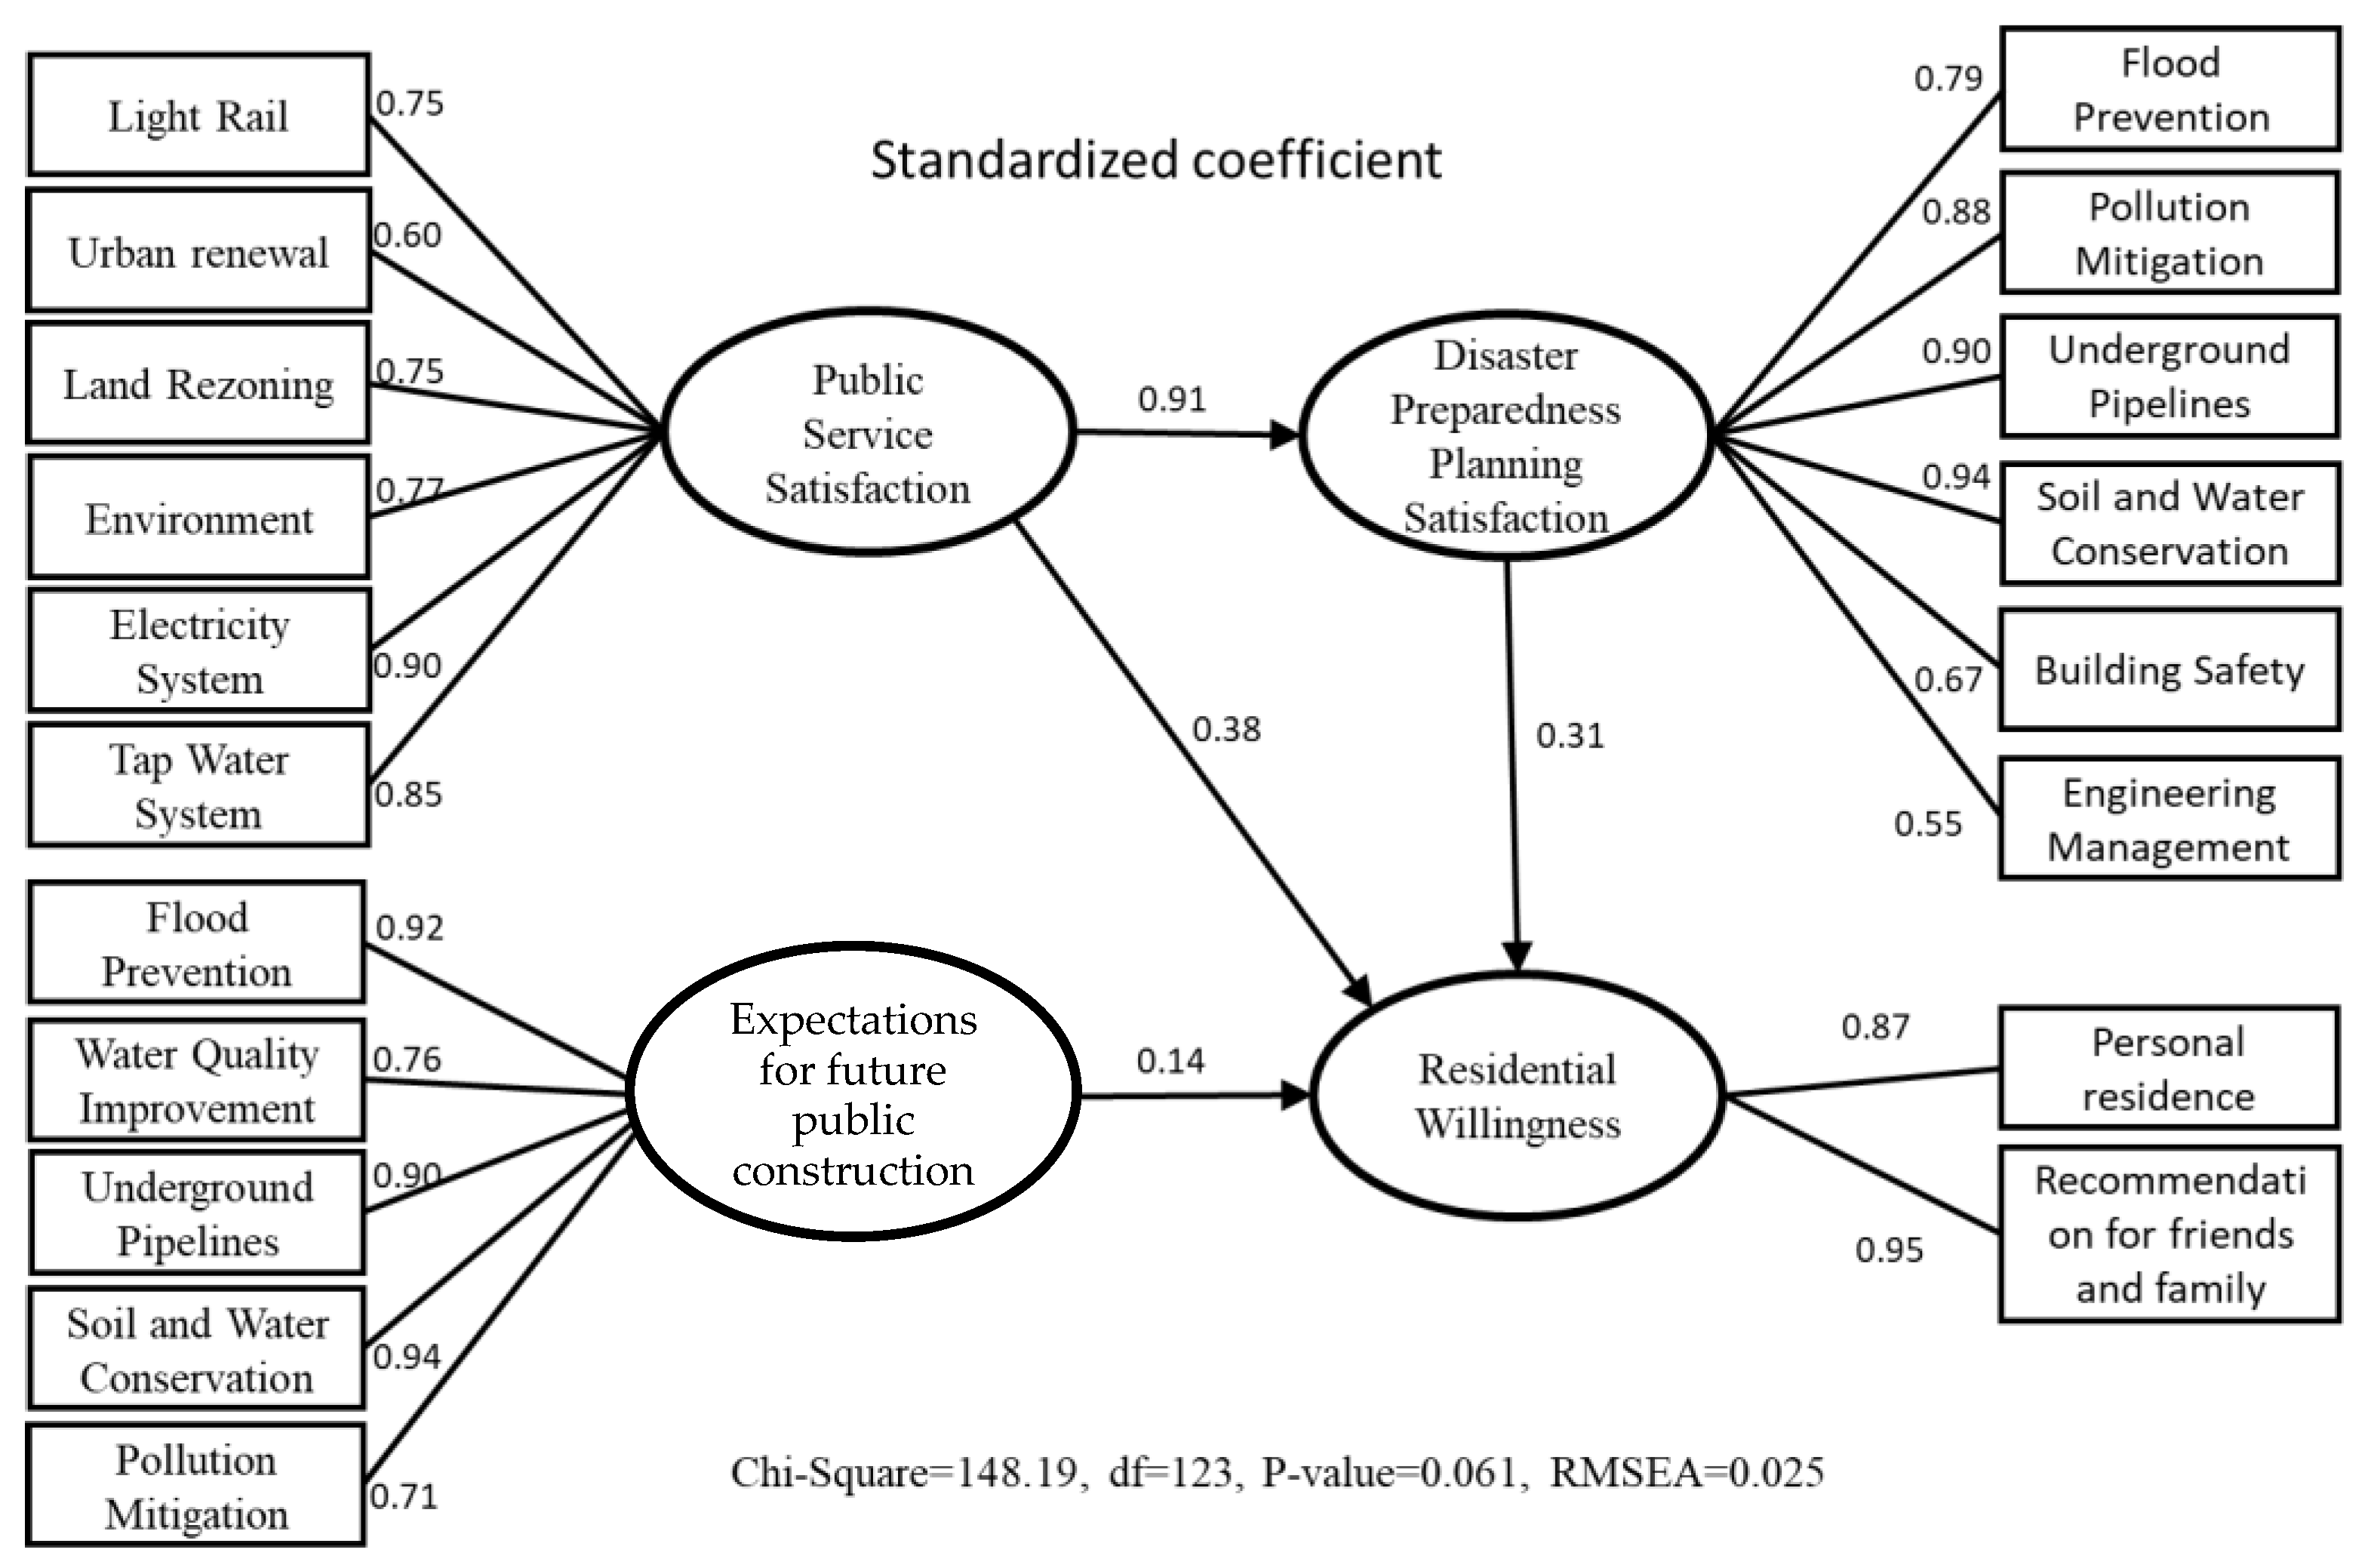
Figure 4 depicts the causal relationships within our study, showing standardized coefficients that all surpass the significance threshold (t > 1.96), validating the four proposed hypotheses. These coefficients illustrate factor loadings (Λ
X and Λ
Y) between latent and observed variables and path coefficients (γ
ij) among latent variables.
For the latent variable “Public Service Satisfaction (SAT)”, factor loadings are ranked from highest to lowest as follows: Electricity System (D9) at 0.90, Tap Water System (D10) at 0.85, and so forth, with most loadings above the threshold, indicating robust indicator variables, except for Urban Renewal (D5) at 0.60.
“Expectations for future public construction (HOP)” shows factor loadings for Soil and Water Conservation (F4) at 0.94, and Flood Prevention (F1) at 0.92, highlighting strong expectations towards infrastructure projects.
“Disaster Prevention Planning Satisfaction (PLA)” has high loadings for Soil and Water Conservation (E4) at 0.94 down to Engineering Management (E6) at 0.55, identifying key factors in disaster planning.
For “Residential Willingness (LIV)”, the top loading is Recommendation to Family and Friends (G2) at 0.95, indicating a strong propensity to endorse their residential environment.
Path coefficients reveal significant direct and mediated relationships: SAT to PLA is 0.91, and SAT directly to LIV is 0.38. The total effect of SAT on LIV, combining direct and PLA-mediated paths, is 0.66, affirming strong influences from public services to residential willingness.
Table 5 and
Table 6 summarize these relationships, showing that SAT, PLA, and HOP contribute indirect effects of 0.578, 0.268, and 0.126 to residential willingness (G1). This quantifies the comparative impact of these factors, with public service satisfaction notably influencing residential decisions, often through disaster planning satisfaction.
5. Conclusions
Utilizing Structural Equation Modeling (SEM) based on a survey of residents in Kaohsiung City, this study developed a causal model to explore the determinants of residential intentions. The robust fit of the SEM model with the collected data substantiates our findings, which are delineated below:
Dual Role of Satisfaction: Satisfaction with urban disaster prevention planning plays a dual role in shaping residential intentions, functioning directly and as a mediator in the influence of public service satisfaction. Quantitatively, the total effect of satisfaction with disaster prevention planning on residential intentions is significant at 0.308, whereas public service satisfaction demonstrates a higher total effect of 0.664. Notably, approximately 42.3% of the impact from public service satisfaction (indirect effect of 0.281) is mediated through satisfaction with disaster prevention planning, emphasizing its pivotal mediating role.
This aligns with the findings of Heo et al. (2022) [
24], who emphasized the importance of integrating direct and indirect effects in evaluating disaster prevention projects. Similarly, Fei, Lu, and Li (2023) [
17] work on the layout of urban green spaces for disaster prevention also supports our findings that effective spatial planning significantly enhances residents’ safety perceptions and satisfaction.
Influence of Public Services on Residential Intentions: Regarding the weighted influence on residential intentions, public service satisfaction is twice as impactful as disaster planning satisfaction and four times more than approval of future aspirations. However, given the mediating influence of disaster prevention planning, its impact on residential intentions aligns closely with public service satisfaction.
Our findings underscore the significant impact of public service satisfaction on residential stability, which is consistent with recent studies that highlight the importance of urban infrastructure in influencing residents’ quality of life and their decisions to remain in a city (Mouratidis, 2021 [
16]). Notably, our study extends these insights by quantifying the direct and mediated effects of such satisfaction on residential intentions, a methodological enhancement that offers a more nuanced understanding of these dynamics.
Comparative Analysis with Disaster Preparedness and Urban Planning: Our study’s mediation effect of disaster preparedness satisfaction aligns with Kalaycıoglu et al. (2023) [
22], who identified social vulnerability as a critical factor in urban disaster resilience. By integrating these insights with the findings from Bristow and Deelstra (2023) [
23] on the effectiveness of disaster risk reduction strategies, our study contributes to a more comprehensive understanding of how urban planning and disaster preparedness intersect to influence urban resilience.
Implications for Urban Sustainability and Resilience: Highlighting the practical implications of our findings, enhancing urban disaster prevention capabilities, and improving public services are crucial for strengthening residents’ willingness to stay. This contributes significantly to urban sustainability and resilience, particularly in industrially dense cities like Kaohsiung, where long-term planning is essential but often overshadowed by short-term political gains. This observation is critical for policymakers focusing on sustainable urban development.
Future Research Directions: Considering the dynamic interplay of public service satisfaction, disaster preparedness, and residential intentions, further research in different urban contexts could elucidate the broader applicability of these findings. Such studies would enrich our understanding of how urban planning and disaster management strategies impact resident retention and satisfaction across urban settings. Only by increasing the willingness of urban residents to stay in the city can the city’s sustainability be significantly enhanced.


