Article

An Assessment Method of Deviation Electricity Responsibility in China’s Forward Electricity Market Based on Time-Sharing Trading Prices

School of Economics and Management, Changsha University of Science and Technology, Changsha 410076, China
*
Author to whom correspondence should be addressed.
Sustainability 2024, 16(12), 5130; https://doi.org/10.3390/su16125130
Submission received: 12 May 2024 / Revised: 12 June 2024 / Accepted: 14 June 2024 / Published: 16 June 2024

Abstract

:
Electricity forward market contract trading constitutes a principal trading method in the electricity market. To address deviations from or non-compliance with contracts in China’s forward electricity market, an Energy Deviation Settlement (EDS) mechanism has been implemented. However, the current EDS mechanism is marred by unscientific penalties and imprecise deviation cost assessments. Consequently, this paper proposes a deviation responsibility assessment method based on time-sharing trading prices. Initially, the total annual contracted power is decomposed to derive the hourly deviation power for all 8760 h of the year. Subsequently, considering the power supply cost and load level, this paper proposes four pricing strategies for typical supply–demand scenarios and constructs a time-sharing trading pricing model based on cost pricing. Finally, this paper conducts a simulation using actual electricity data from China’s Province H. The results demonstrate that, compared to the traditional EDS mechanism, the proposed method can more accurately and reasonably measure the value of deviation responsibility. Concurrently, it can be better integrated with the future development of real-time spot market operations.

1. Introduction

To advance the construction of the power market, China initiated a new round of power system reforms in 2015. This reform accelerated the formation of a power market system characterized by a “Forward Electricity Market to mitigate risk + Power Spot Market to discover price” [1,2]. In 2017, China began piloting the power spot market, conducting various experiments and gaining experience in trading and settlement modes. However, the late start in establishing the spot market, coupled with challenges in rule formulation and constraints in technical support, means that the transition from conceptual design to operational status will require considerable time. As a result, China is expected to experience an extended transitional period, with forward electricity trading continuing to predominate. In 2023, for instance, forward electricity trading constituted over 90% of China’s total electricity trading volume.
China’s forward electricity trading is generally dominated by annual and monthly contracts. The two parties agree in advance on the delivery power (contracted power) within a specific program time unit (PTU). The dispatching agency then coordinates the output from generators based on the contracted power. However, forward contracts often lead to deviation electricity (DE) due to factors like discrepancies in load forecasting, uncertainties in generation output, and grid operational constraints [3]. To resolve DE, the dispatching agency must adjust the output of other generators to achieve overall system power balance.
Utilizing economic mechanisms to regulate deviation electricity constitutes the essence of the power balancing market (BM). Numerous countries achieve real-time power balancing via electricity spot markets [4,5,6]. For instance, the U.S. PJM power markets employ a dual settlement system, comprising day-ahead and real-time markets, to settle forward contract deviations at spot market prices. Their over-the-counter (OTC) contracts include financial contracts for difference (CFDs), power futures, and options contracts, all of which do not require physical delivery. Conversely, in the UK BETTA market, bilateral physical contracts must agree on a time-sharing delivery curve and report it to the imbalance clearing agency ELEXON. The dispatching agency accepts balancing service offers with the goal of minimizing adjustment costs. DE resulting from market participants’ actions is settled based on the marginal cost of the balancing service during the corresponding time period. The Australian electricity market operates on a single real-time electricity market model. Real-time power balancing is achieved through a rolling pre-clearance mechanism, along with security-constrained economic dispatch every 5 min. Its OTC contracts mainly include CFDs, as well as electricity futures and options contracts.
Currently, China’s power spot market remains immature, while the forward power market mitigates deviation behaviors via the Energy Deviation Settlement (EDS) mechanism and deviation penalties. The system operator (SO) regulates a generator’s output through equal proportional adjustment, rolling adjustment of base power, and a pre-listed balancing mechanism. It also provides financial compensation for balancing services. Simultaneously, an assessment method for DE was formulated, charging the balance responsibility party (BRP) a deviation assessment fee according to a specific standard. This fee is primarily used to compensate for balancing services, with any surplus shared between the generation and consumption sides in proportion to the amount of electricity [7]. In conclusion, the EDS mechanism provides a method for balancing and settling DE, effectively addressing the imbalance between system power generation and consumption. However, there are several shortcomings: (1) For balance service providers (BSPs), the clearing price of balance services is usually set artificially, with little consideration of market supply–demand dynamics and the cost of service provision. (2) For a BRP, there is no differentiation between the direction of their DE and its impact. For instance, during tight power supply periods, less DE can positively ease supply pressure. Additionally, it is difficult to refine the deviation responsibility in the measurement of DE over a longer period of time. (3) For an SO, if the compensation fee for balancing services exceeds the fee charged for deviation assessments, the SO may incur additional losses. (4) For market development, the spot power market is the current focus of China’s power market development, but there is a lack of effective integration between the monthly EDS mechanism and real-time power, necessitating a more refined deviation processing method with finer time granularity.
Based on the aforementioned background, this paper proposes a method for measuring the deviation responsibility value using time-sharing trading prices within the forward electricity market. The framework of the proposed method is illustrated in Figure 1 below. The process begins with an analysis of the causes of DE and the fundamental principles of the EDS mechanism. We then construct a basic measurement for deviation electricity settlement through a CFD and examine the significant influencing factors of deviation costs along with their improvement practices. For DE, the total contracted power is broken down into hourly units based on national guidelines, and DE is calculated on an hourly basis. Regarding deviation pricing, we explore four typical supply and demand scenarios, and establish the time-sharing trading tariff model. Finally, we simulate and measure the annual 8760 h DE and costs using actual load data from Province H in China. Based on the results, we analyze and demonstrate the rationality of the proposed method.

1.1. Literature Review

Previous research has primarily focused on the management and treatment of deviation power, as well as the assessment and optimization of deviation costs.
Regarding the management and treatment of DE, Wang et al. employed the Analytic Hierarchy Process to quantify DE from aspects such as transaction type weight and inter-regional, inter-provincial weight [8]. They established a DE responsibility judgment mechanism and a deviation accounting model, clarifying the responsibility for DE across regions and provinces, as well as the deviation volume that trading entities should bear. Zhu et al. addressed the issues of poor control precision and time consumption in traditional DE control methods by utilizing a rolling compensation mechanism for user electricity consumption, proposing a real-time DE control model for regional electricity spot markets [9]. This method can control DE within a short time frame, with an error margin of only 1%. Manju et al. examined a frequency-linked real-time pricing scheme based on a deviation settlement mechanism in the Indian power market, discussed the commercial mechanism based on an Availability-Based Tariff (ABT), and proposed an improved controller to reduce frequency deviation [10]. Burak et al. utilized all-vanadium redox flow batteries (VRFBs) to avoid wind power deviation penalties in the power market and incorporated the VRFB costs and deviation penalty amounts due to inaccurate forecasting into financial assessments, showing that the use of batteries could reduce power deviation [11]. Miao et al. proposed a market transition period short-term joint dispatch model for hydro and thermal power based on electricity decomposition, processing DE by adjusting the power output of thermal power units to minimize the contractual DE of the units [12]. Song et al. and Wang et al. utilized demand-side response strategies to reduce the test errors caused by load forecast deviations [13,14].
Regarding the pricing of DE, Alberto et al. modeled DE using probability density functions that represent the accuracy of forecasting models [15]. They utilized supple-mental energy sources to address deviated power at the market price and calculated the cost of deviation for wind power by multiplying the hourly deviation of expected power generation by the hourly price of the supplemental energy reserve. Yang et al. proposed a deviation penalty scheme that incorporates energy storage systems and frequency regulation services to mitigate the erratic fluctuations between renewable energy generation output and power demand [16]. Their case study demonstrated that setting a penalty price for deviations can suppress market volatility and consistently yield a non-negative market surplus. Bharti et al. suggested that in the Indian power grid system, both excess and insufficient DE from planned transactions could be managed by penalties and incentive payments to stabilize grid frequency [17]. Reinier et al. examined the impact of DE pricing mechanisms on market balance in the European market, analyzing six alternative pricing mechanisms based on an Agent model, with the single pricing mechanism resulting in the lowest deviation costs [18]. Wu et al. considered imbalance power pricing mechanisms, evaluating methods for resolving DE using intelligent body modeling and a multicriteria decision analysis [19]. Their arithmetic example showed that a dual pricing mechanism effectively regulated the market behavior of balancing responsible parties. Zani et al. compared different methods of calculating the deviation settlement price in the German market and proposed a method for calculating the imbalance price based on nodal tariffs [20].
Regarding the settlement and optimization of deviation costs, Zhang et al. proposed a mutual aid insurance mechanism for deviation to tackle the issue of high ED assessment costs faced by power retailers [21]. Retailers have the option to reduce ED by transferring contracts. Concurrently, an alliance revenue model was established, allowing entities within the alliance to choose suitable partner alliances to lower EDS costs. Lu et al. proposed a coordinated peer-to-peer (P2P) transaction model with aggregated alliances and reserve purchases [22]. To mitigate the risk of deviation penalties in P2P transactions, agents can maximize alliance welfare by purchasing reserves from mobile energy storage providers. Liu et al. investigated the balancing mechanisms for downstream power stations to offset electricity volume deviations through intraday power contract transactions or system penalties [23]. They constructed a risk decision model for the trading portfolio of DE at downstream power stations based on the Conditional Value at Risk (CVaR) framework, achieving minimal CVaR risk for DE at these stations. Li et al., aiming to address the profit reduction caused by DE, proposed a deviation dynamic quantity prediction method for load aggregation-level users based on Markov chains, effectively alleviating grid pressure and enhancing the profits of load aggregators by approximately 1.2% [24]. Huang et al. developed a stochastic Cournot equilibrium model using scenario reduction techniques to depict wind speed uncertainty and employed a nonlinear complementarity approach to solve the model [25]. The results indicated that an appropriate penalty mechanism would incentivize wind power enterprises to reduce bidding errors.
Synthesizing the aforementioned literature reveals that DE is primarily addressed through enhanced deviation management and frequency control, the use of supplementary energy sources such as batteries and thermal power, and the implementation of demand response mechanisms. To constrain deviation behaviors and ensure a non-negative market surplus, DE is typically subject to punitive pricing, including both single-price and dual-price methods. Current research commonly employs Monte Carlo methods and scenario reduction techniques to simulate the uncertainty of new energy output, using the CVaR model to measure deviation risk or directly calculating costs based on quantity and price [26,27]. To reduce deviation costs and increase corporate profits, researchers have incorporated deviation costs into the objective functions of multi-objective optimization problems, employing game theory and related theories to explore optimal equilibrium solutions under multiple participating entities [28,29]. These studies have provided significant insights for this research. However, the existing literature primarily focuses on the spot market context, with few studies addressing deviation handling mechanisms in the context of forward markets. While these studies calculate deviation penalty costs based on the existing EDS mechanism as a given condition and rule, they do not delve into the shortcomings of the EDS mechanism itself, nor the accuracy and economic aspects of deviation responsibility measurement. Yet, a scientific and rational measurement method is the premise and foundation for all optimization problems. Against the backdrop of China’s forward power market implementing the EDS mechanism, this paper aims to seek a more scientific and economical method for measuring deviation responsibility, providing methodological guidance for the provinces in China to better carry out the settlement work of DE.

1.2. Aims and Contributions

This study proposes a method for measuring the deviation responsibility value based on time-sharing trading prices under the electricity forward market. The method takes into account the supply and demand of the system as well as the supply cost, optimizing the current EDS mechanism in China. This paper aims to enhance the accuracy and economy of deviation responsibility measurement. We hope this study will provide valuable insights and practical guidance for stakeholders. The contributions of this paper are as follows:
(1)
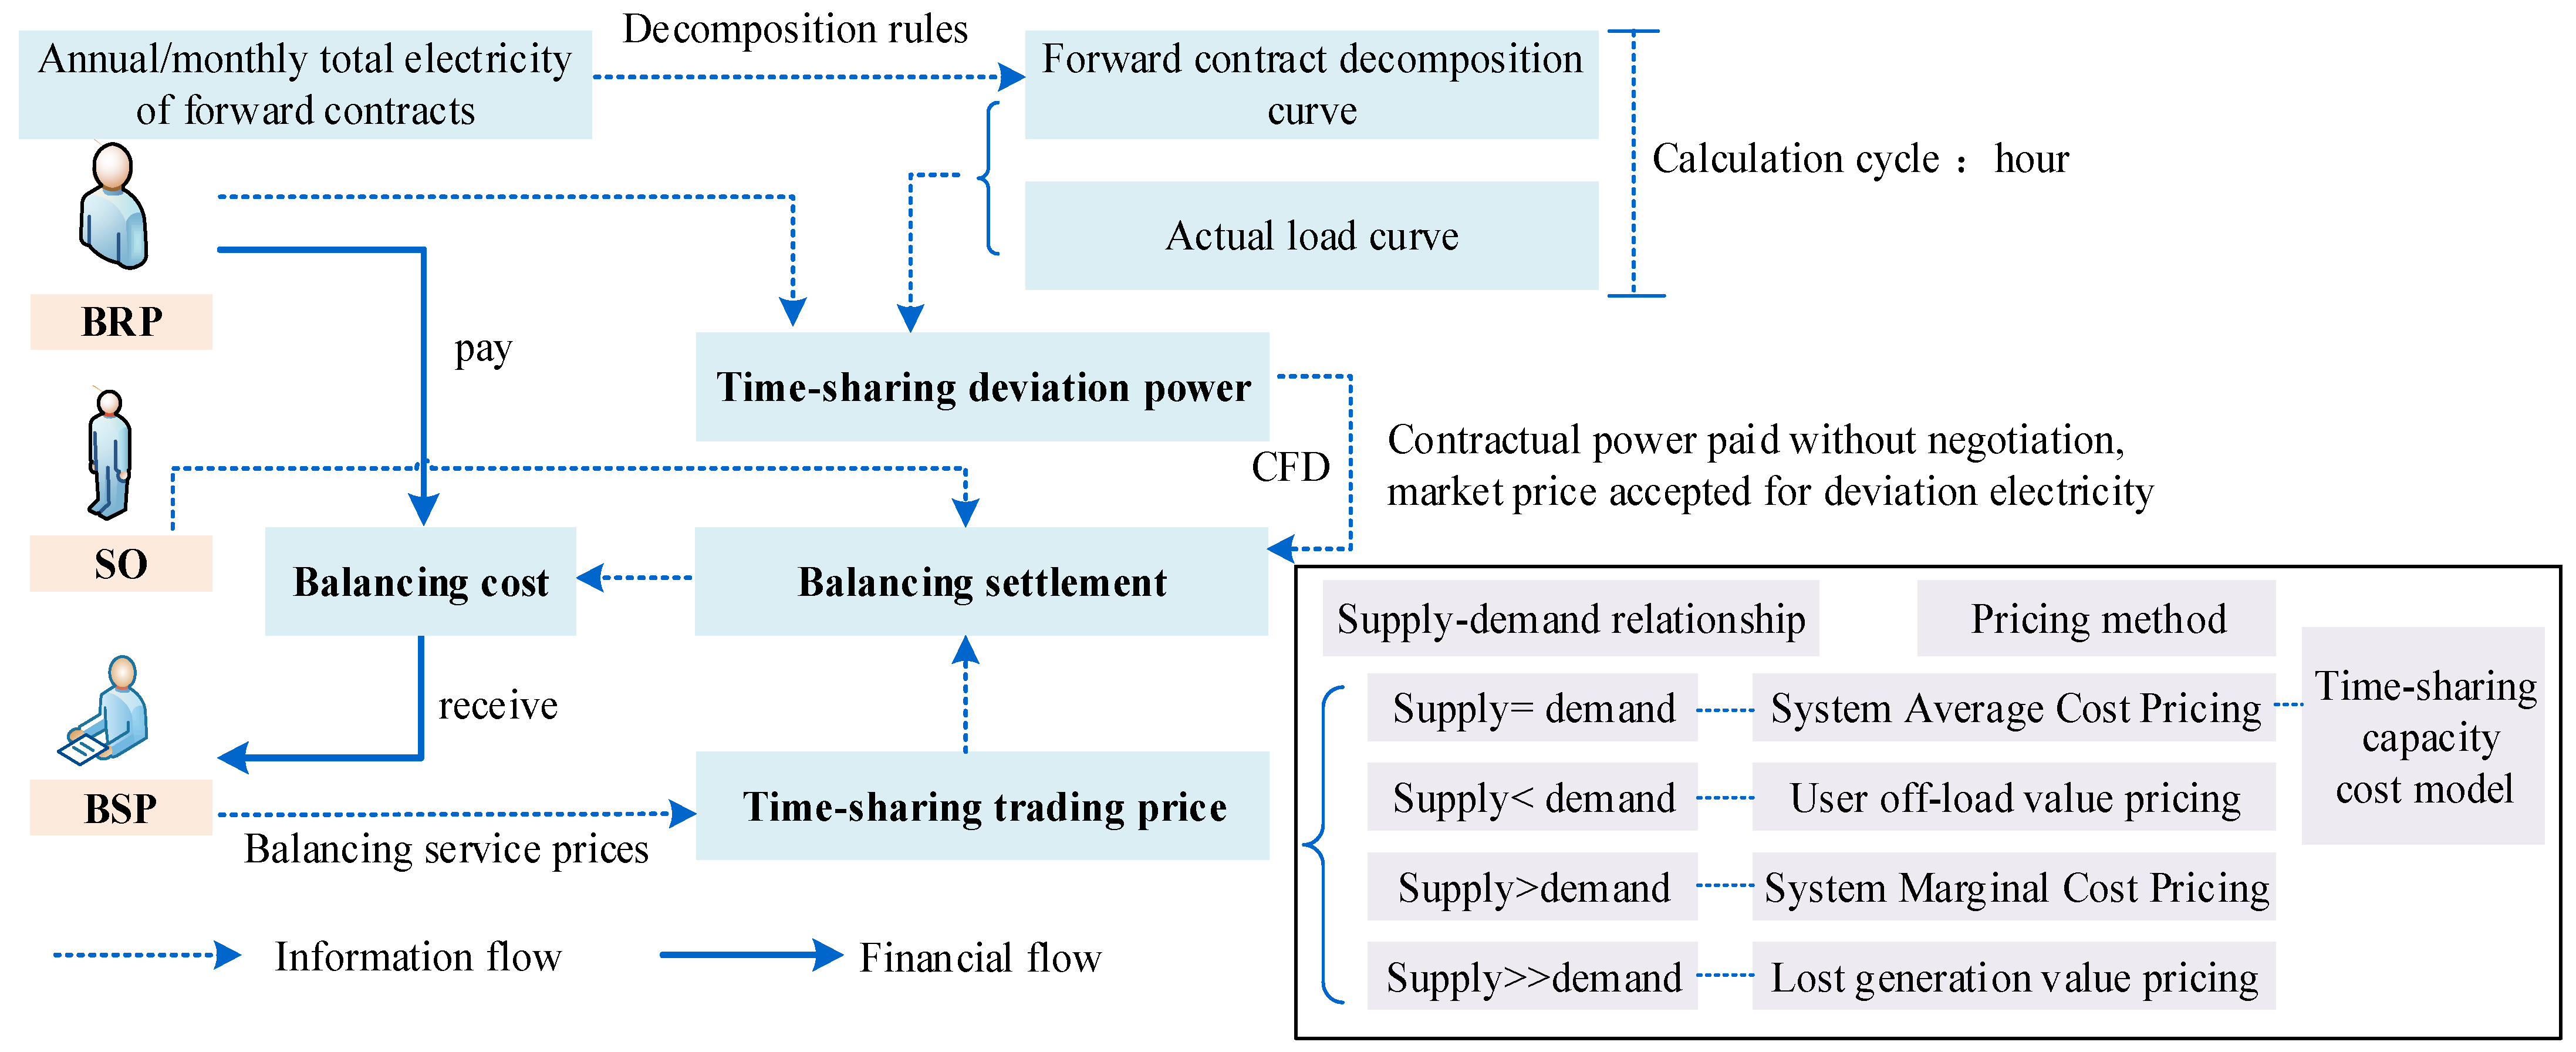
This paper refines the settlement rule of “monthly clearing and monthly settlement” for DE in the forward electricity market and proposes a novel settlement method of “hourly basic calculation and monthly settlement” for DE, which refines the time-sharing deviation responsibility for a BRP. At the same time, the EDS mechanism with smaller granularity of calculation time strengthens the connection with the electricity spot market.
(2)
We examine how DE participates in the spot market through CFDs within an electricity market where both spot and forward markets coexist. We propose that DE in the forward electricity market can also be settled using CFDs at time-sharing prices, allowing for a more comprehensive response to the economic responsibility of DE.
(3)
To enhance the price signal for deviation settlement, we comprehensively consider the supply–demand relationship and power supply costs. We analyze four typical scenarios and their pricing methods, and propose a time-sharing price model. Both the BRP and BSP refer to this price for settlement, allowing the grid to avoid generating imbalance funds that should not be borne by itself due to differences in settlement prices.
The rest of this paper is organized as follows: Section 2 introduces the theoretical foundation and proposes a method for assessing the value of deviation liability based on time-sharing transaction prices. Section 3 conducts a case study. The main conclusions are presented in Section 4.

2. Methods and Models

2.1. Principle Analysis of the EDS Mechanism

2.1.1. Causes of Deviation Electricity

Power trading, the same as general commodity trading, operates under its own set of inherent rules regarding trading methods, volume, and price formation mechanisms. However, a key distinction lies in the necessity for the forward electricity market to establish the EDS mechanism to achieve system power balance. This necessity arises from several factors:
  • Product specificity: Electric energy products encompass power generation, transmission, distribution, and consumption simultaneously. Consequently, power system operation and market transactions require real-time power balance to ensure grid safety.
  • Contract default penalties: Given the inevitable generation of DE, the power grid must establish a settlement mechanism with varying constraint strengths based on market players’ performance awareness and ability. This encourages market players to fulfill balancing responsibilities outlined in the trading contract.
  • Total deviation settlement: Electric energy delivery in the forward electricity market cannot be individually measured at specific moments. The grid accumulates the total deviation of electric energy transactions over the PTU and establishes uniform settlement and assessment rules.

2.1.2. The ESD Mechanism

Electricity markets in various countries rely on well-established market trading rules, and they have formed a more mature treatment for DE, which is summarized in Table 1 below [30]. In centralized power markets, power financial derivatives trading is employed to mitigate spot market price risk, and contract transactions involve cash delivery without physical transfer, exemplified in markets like Australia or the U.S. PJM power market. Conversely, decentralized power markets feature physical delivery in electricity forward trading contracts and trade an electricity spot in day-ahead, intraday, and real-time balancing markets, as seen in the UK and Nordic power markets.
Since 2017, China has been implementing the pilot construction of the electricity spot market, with some regions balancing deviation power through the real-time spot market [30]. However, the majority of regions in China still employ the forward market trading model, utilizing the EDS mechanism to maintain system supply–demand balance. The EDS mechanism is illustrated in Figure 2, where the system operator (SO) establishes a deviation power exemption range for the balance responsibility party (BRP) [21,22]. Deviations within this range are resolved at the average contract price, whereas those exceeding it incur additional penalties. Typically, the penalty price set by the SO surpasses the market clearing price. Consequently, the BRP incurs penalties corresponding to the price differential, termed as the EDS penalty cost. There are large differences in the standards and limits for charging deviation assessment amounts across Chinese provinces, as shown in Table 2.
The setting of penalty prices limits deviation behavior to a certain extent and reinforces the strict enforcement of forward contracts. However, the current EDS mechanism for different market participants still has deficiencies.
(1)
SO: The SO bears the responsibility for instantaneous deviations at each moment, and the EDS mechanism with longer settlement periods overlooks the cost incurred by the SO to maintain real-time power balance. Additionally, the deviation penalty price is artificially set by the grid and will be used for a long time once it is determined. However, the cost incurred by the SO for procuring balancing services from BSPs is dynamic, fluctuating with the supply cost and the supply–demand conditions. Consequently, the SO may risk that the deviation assessment fees charged do not fully cover the deviation balancing costs.
(2)
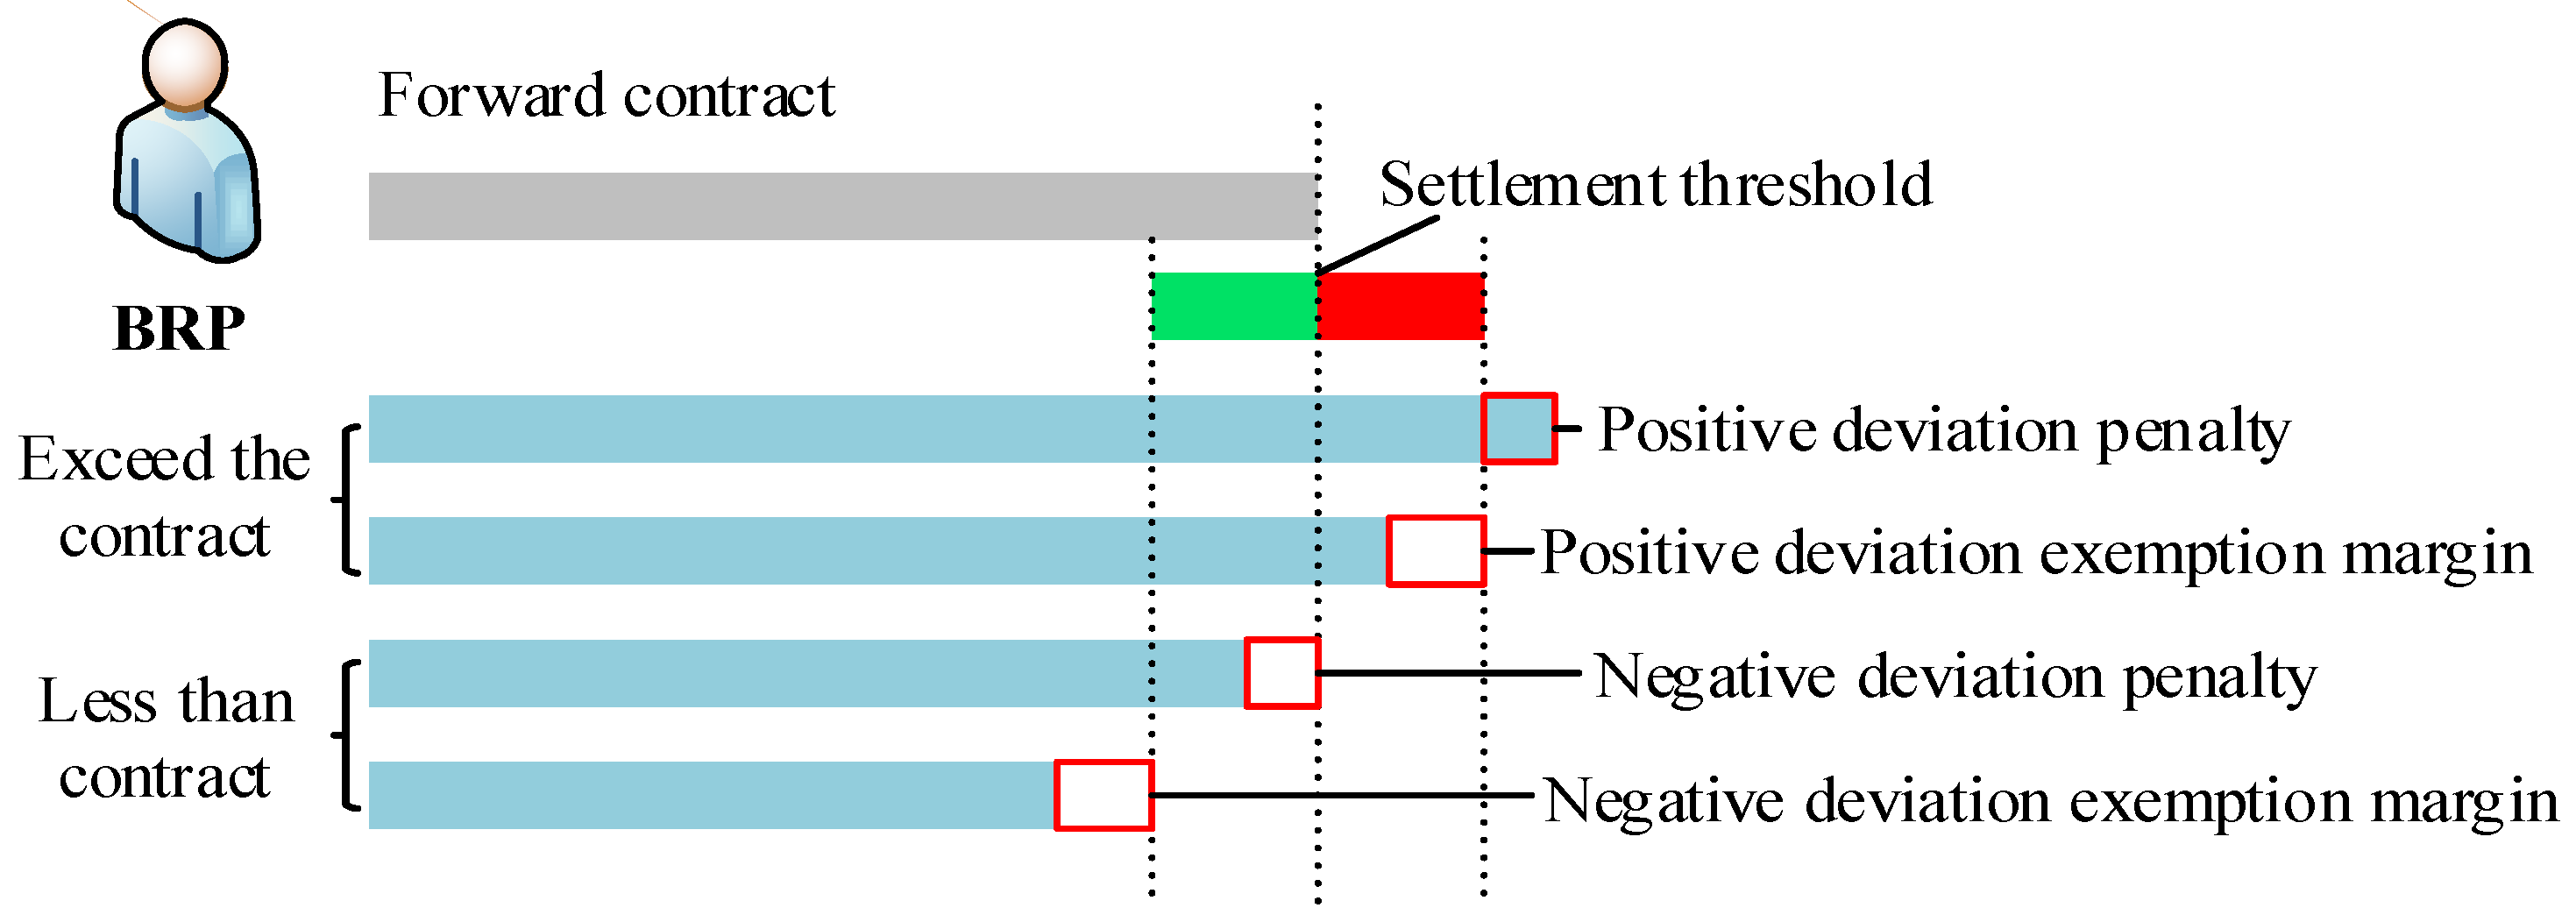
BRPs: DE by BRPs is penalized regardless of its direction if it exceeds the threshold. However, the contribution and impact of DE vary significantly under different conditions. If there is a surplus in the deviation assessment cost after covering the balancing service cost, the SO will distribute this surplus in an electricity proportion, allowing the BRP to receive a portion of the revenue. This reduces the actual economic responsibility of the BRP and weakens the constraining effect of the EDS mechanism.
(3)
BSPs: The cost of balancing services varies with the market’s supply and demand conditions and the cost of power supply. The SO should develop a more economical and accurate pricing guide for BSPs, fully considering the economics of deviation adjustments.

2.1.3. Misalignment in Deviation Responsibility

Under the EDS mechanism in the forward electricity market, the SO regulates the output of other generating units and pays for their balancing services in order to achieve real-time power balance in the power system. This fee is not equal to the cost of deviation responsibility borne by the BRP, leading to the risk that the grid will bear additional costs during the settlement process for the following two reasons [31]:
(1)
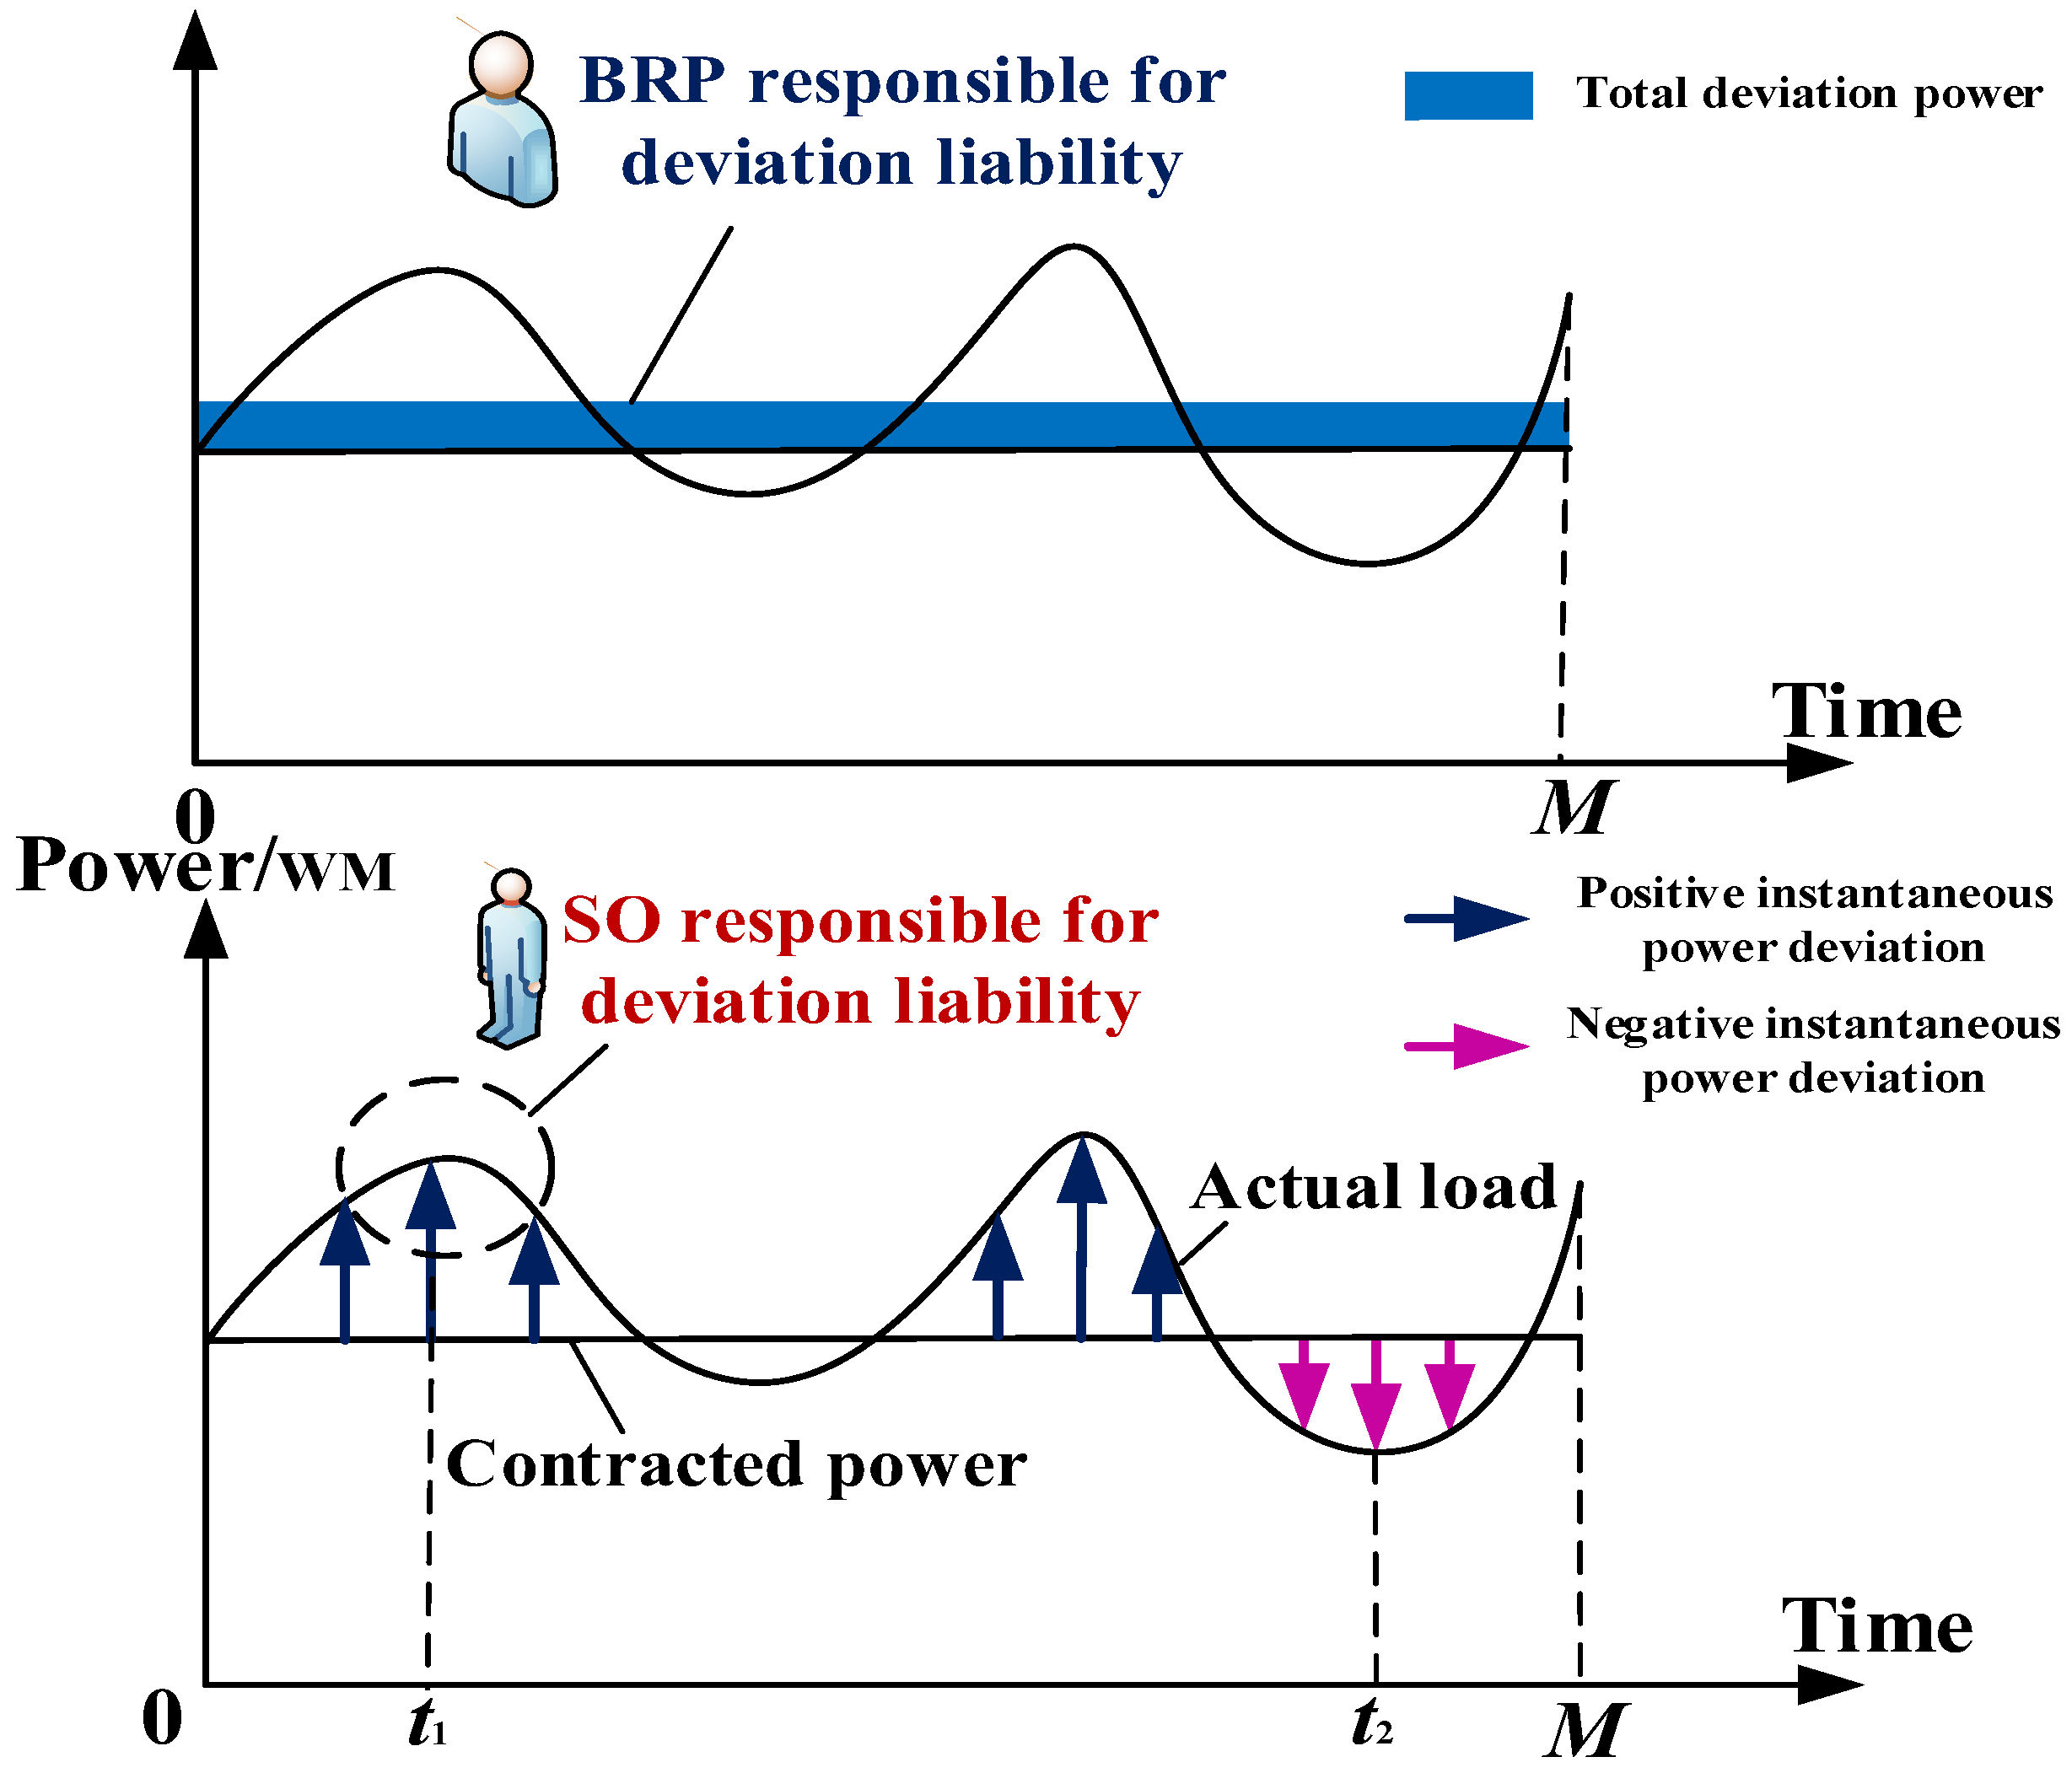
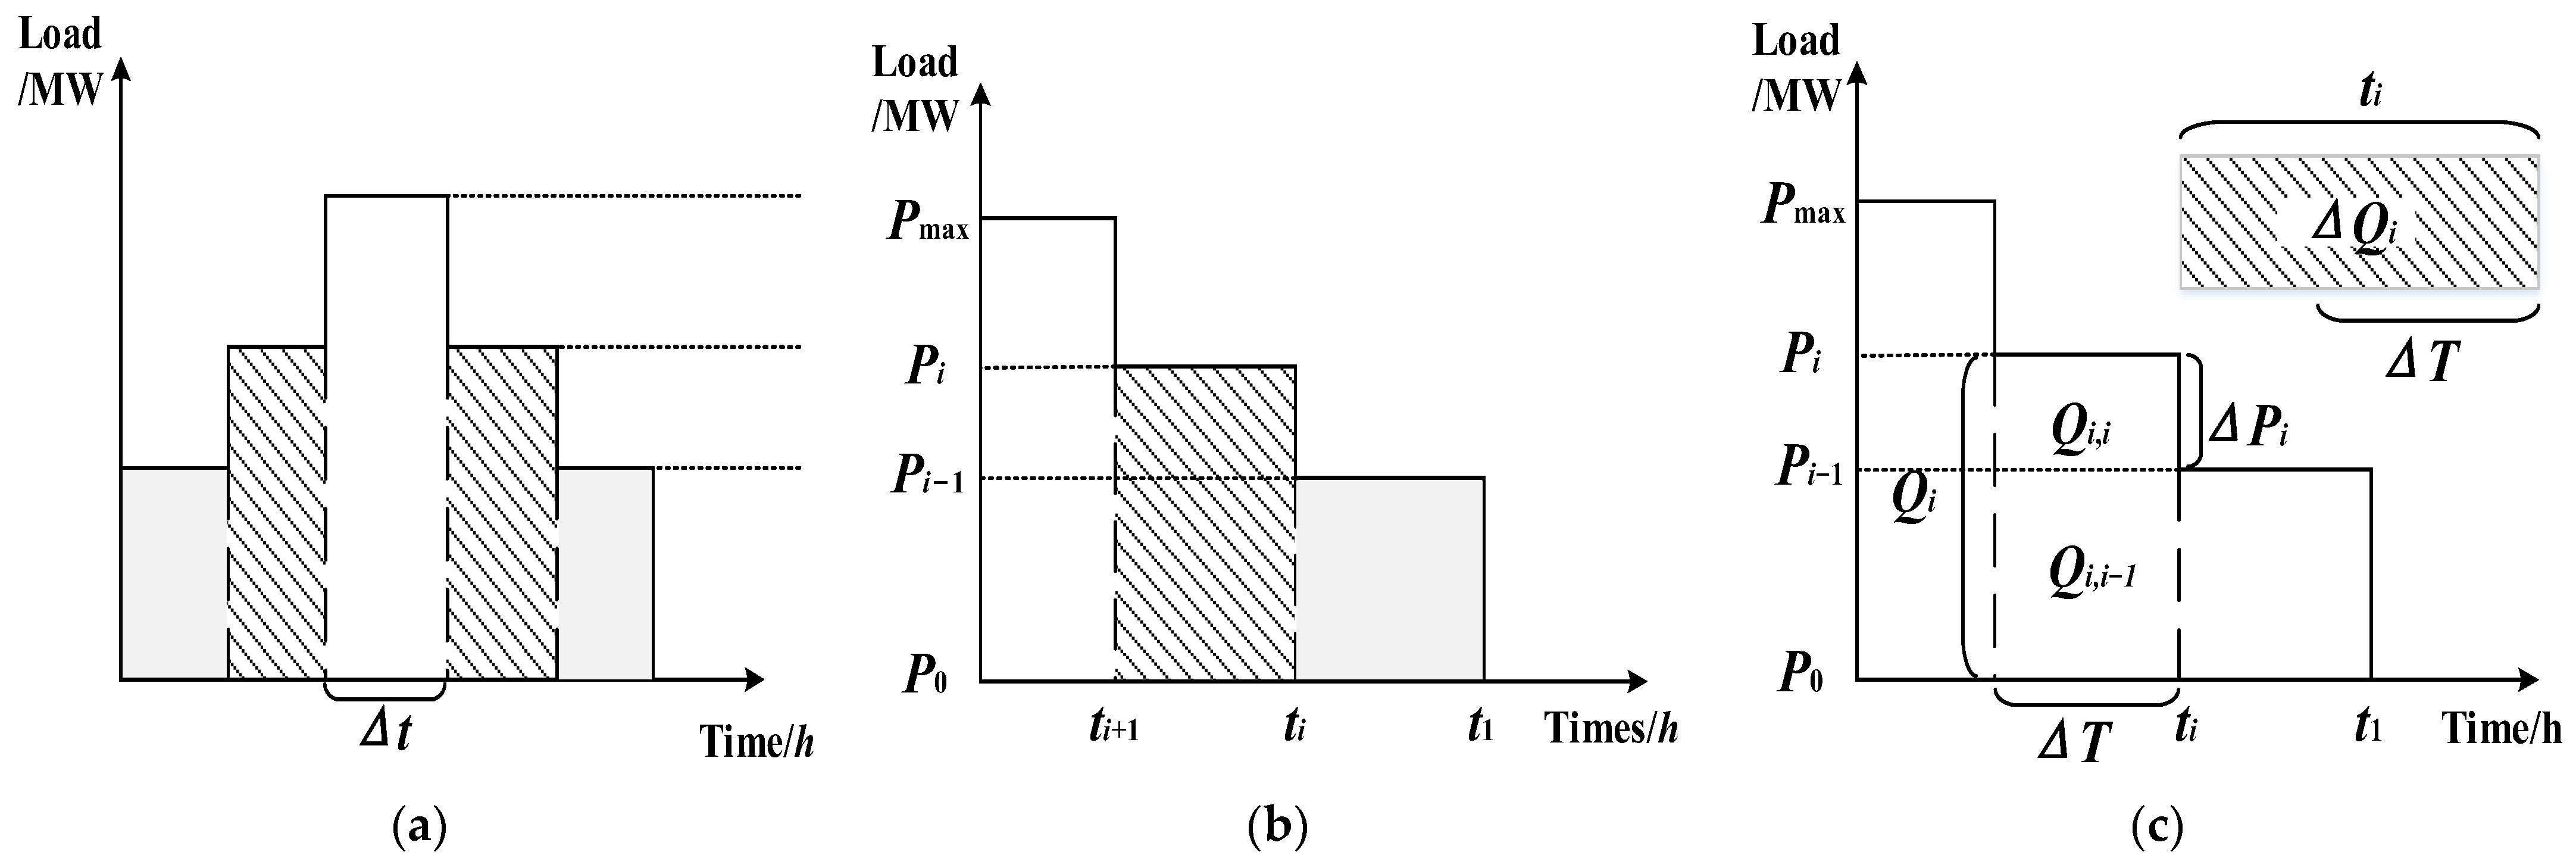
Inconsistency in assumed balancing responsibilities: As illustrated in Figure 3 below, the BRP is solely accountable for balancing corresponding to its total deviation power within each settlement unit (typically monthly), corresponding to the blue rectangle in the figure, without bearing the costs associated with positive and negative offsetting DE within the unit. Conversely, the SO must procure balancing services from the BSP to maintain system supply–demand equilibrium at each moment, corresponding to the positive and negative instantaneous DE—blue and purple arrow markings. The former concerns the total DE of a settlement unit, while the latter pertains to the instantaneous DE of each moment. This disparity in balancing responsibilities between the SO and BRP can result in inaccuracies in the financial responsibility attributed to measured BRP deviation.
(2)
Disparities in DE settlement prices exist: To safeguard the interests of all stakeholders and incentive market players to minimize their deviations, many countries or regions incorporate punitive pricing into their balancing mechanisms. For instance, Spain and Belgium implement the “two-price method,” assigning distinct prices for positive and negative deviations. Similarly, the EDS mechanism in China’s forward market penalizes deviation behavior among market players, as indicated by the deviation punitive prices in select provinces outlined in Table 2. However, this variability in settlement prices for positive and negative DE can result in discrepancies in economic responsibility assessment.

2.2. Methodology for Evaluating Deviation Responsibility

2.2.1. EDS Mechanism Based on CFDs

Contracts for difference (CFDs), pivotal financial instruments for risk mitigation in the electricity market, are frequently employed as a bridge between the forward and spot markets [32,33]. However, CFDs also serve as vital tools for assessing the deviation responsibility of market participants. For instance, in Chinese Yunnan Province, CFDs are extensively utilized in the forward market to settle deviation power at the benchmark price.
CFDs enable contracting parties to agree on the settlement of a specific quantity of a commodity at varying prices across a designated timeframe. CFDs involve paying the counterparty the disparity between the contract price and the benchmark price, all without physical delivery [34]. The fundamental principle of CFDs is depicted in Figure 4. If the contract price of electricity exceeds the benchmark price, the contract buyer compensates the seller for the difference, while conversely, the contract buyer receives compensation.
The core of a CFD-based EDS mechanism is that the contracted portion of electricity is paid at the agreed price, while any DE from the contracted portion is settled based on the deviation base price [35].
E = Q c × P c + ( Q m Q c ) × P d
where E represents the total electricity cost for the generator or the user; Q c represents the negotiated electric quantity of forward physical contracted electricity; P c denotes the negotiated price for the forward physical contract; Q m represents the actual electricity generation or consumption; and P d denotes the baseline price of the DE.
Deviation costs are influenced by deviation power and price. Under traditional EDS mechanisms, the SO operates on a monthly settlement cycle, aggregating and computing the monthly total deviation power. It establishes a threshold for exemptions, allowing deviations in both positive and negative directions within the settlement unit to be offset without incurring relevant costs. The price of deviations is set artificially by the SO, typically at 1.2–2 times the average market price to ensure that costs are covered.
On one hand, the SO needs to ensure real-time supply–demand balance and address instantaneous power imbalances rather than focusing solely on the total deviation power. Additionally, Chinese policy emphasizes time-sharing for forward contracts. Building upon this context, this study decomposes the total contracted electricity into contracted time-sharing curves referring to 8760 h, in accordance with policy regulations. On the other hand, the price of deviation transactions is an important factor influencing the deviation cost, and the penalty price, which disregards the deviation direction and supply–demand dynamics, distorts the true cost of deviation responsibility. There are variations in electricity supply costs across different time periods of the power system, and in a perfectly competitive market, welfare maximization occurs when the market price equals the marginal generation cost [36]. Therefore, this paper proposes a time-of-day trading price model that considers production costs and demand levels, as the settlement price for hourly DE.

2.2.2. Time-Sharing Trading Pricing Model

  • Pricing model
Prices are determined based on supply and demand, and various supply and demand dynamics employ different pricing methods [37]. Typical supply and demand scenarios and associated pricing methods in the electricity market are illustrated in Table 3.
By comparing the net system load against thermal unit output constraints, four supply and demand scenarios can be identified.
P CD , i = P D , i P H , i P W , i P PV , i
P G min P CD , i P G max
where P D , i denotes the load of the system at the moment i; P CD , i denotes the net load of the system at the moment i; P H , i denotes the output of the hydropower unit at the moment i; P W , i denotes the output of the wind power unit at the moment i; P PV , i denotes the output of the photovoltaic unit at the moment i; P G min denotes the minimum output of the thermal power unit; and P G max denotes the maximum output of the thermal power unit.
Scenario 1: In the equilibrium of supply and demand, system average cost pricing is employed, determined by adding the time-sharing capacity cost to the marginal variable cost. Here, the time-sharing capacity cost model, based on the peak-load responsibility method, is utilized to compute the time-sharing capacity cost. The marginal variable cost can be calculated as Equation (5).
P G min P CD , i P G max
V i = η α P G , i + λ H P H , i + λ W P W , i + λ PV P PV , i P D , i
P 1 , i = V i + C i
where P G , i denotes the output of the thermal power unit at the moment i; η denotes the standard coal consumption rate of thermal power; α denotes the standard coal unit price; λ H represents the variable cost coefficient of hydropower; λ W represents the variable cost coefficient of wind power; λ PV represents the variable cost coefficient of photovoltaics; and C i denotes the time-sharing capacity cost.
Scenario 2: When the power system is in short supply, net system load is in excess of maximum thermal power output power. The production function valuation method is employed to determine the value of user lost load pricing.
P CD , i P G max
P 2 , i = E G D P / D
where E G D P denotes the total value added to the GDP of the user; and D denotes the electricity consumption of the user.
Scenario 3: When supply exceeds demand, pricing is based on the marginal cost.
P CD , i P G min
P 3 , i = V i
Scenario 4: In cases of extreme oversupply, pricing is determined based on the value of lost generation for the generator, typically calculated using unit startup and shutdown costs.
P CD , i 0
P 4 , i = C up / down / G
where C up / down is the startup and shutdown cost of the unit; and G is the amount of generation lost due to the unit shutdown.
2.
Time-sharing capacity cost model
Scenario 1 discusses employing a time-sharing capacity cost model based on the peak-load responsibility method, calculated as follows. Total capacity cost of the system includes depreciation costs of the fixed assets of the generating units, material costs, repair costs, and employee salary and benefit expenses. The mathematical expression for this is as follows:
F c = C d + C m + C r + C s + C e
where F c denotes the total system capacity cost; C d denotes the depreciation cost of fixed assets of the generating unit; C m denotes the material cost of the generating unit; C r denotes the repair cost of the generating unit; C s denotes the employees’ salary and welfare expenditure of the generating unit, etc.; and C e denotes the other costs of the generating unit.
We employ generation capacity utilization to calculate time-sharing capacity costs [38]. This method takes into account both the demand level and the duration of the load, meaning that the price of capacity remains constant for identical load duration. Initially, the annual time-series load profile is sampled at Δ t intervals to derive the load profile depicted in Figure 5a. Subsequently, the durations of identical load levels are aggregated and sequentially arranged to generate the load duration curve, illustrated in Figure 5b. Finally, the capacity cost components at various load levels are determined, as illustrated in Figure 5c.
Firstly, by cutting horizontally, the capacity cost C i , i apportioned to the blocks Q i , i at the same load level is found. Then, in the vertical direction, the capacity costs of the different blocks are summed up and the capacity cost F i apportioned to the load level P i is calculated as
Δ Q i = t i Δ P i
Q i , i = Δ P i Δ T
Δ C i = F c Δ P i P max
Δ F i = Δ C i Δ Q i = F c P max t i
C i , i = Δ F i Q i , i = F c Δ P i Δ T P max t i
C i = F c P max P i j = 1 i Δ P j t j
where t i denotes the i hour; P i denotes the load at the i hour; Q i denotes the total amount of electricity at the load level P i , which consists of the vertical blocks Q i , i ; Δ Q i denotes the amount of electricity between the load level P i and P i 1 ; and Δ P i denotes the difference in load between the load level P i and P i 1 .

2.2.3. Unit Output Model

The time-sharing variable cost is related to the system power structure and the unit generation in each time period. The modeling and constraints regarding various unit outputs are elucidated in Appendix A.

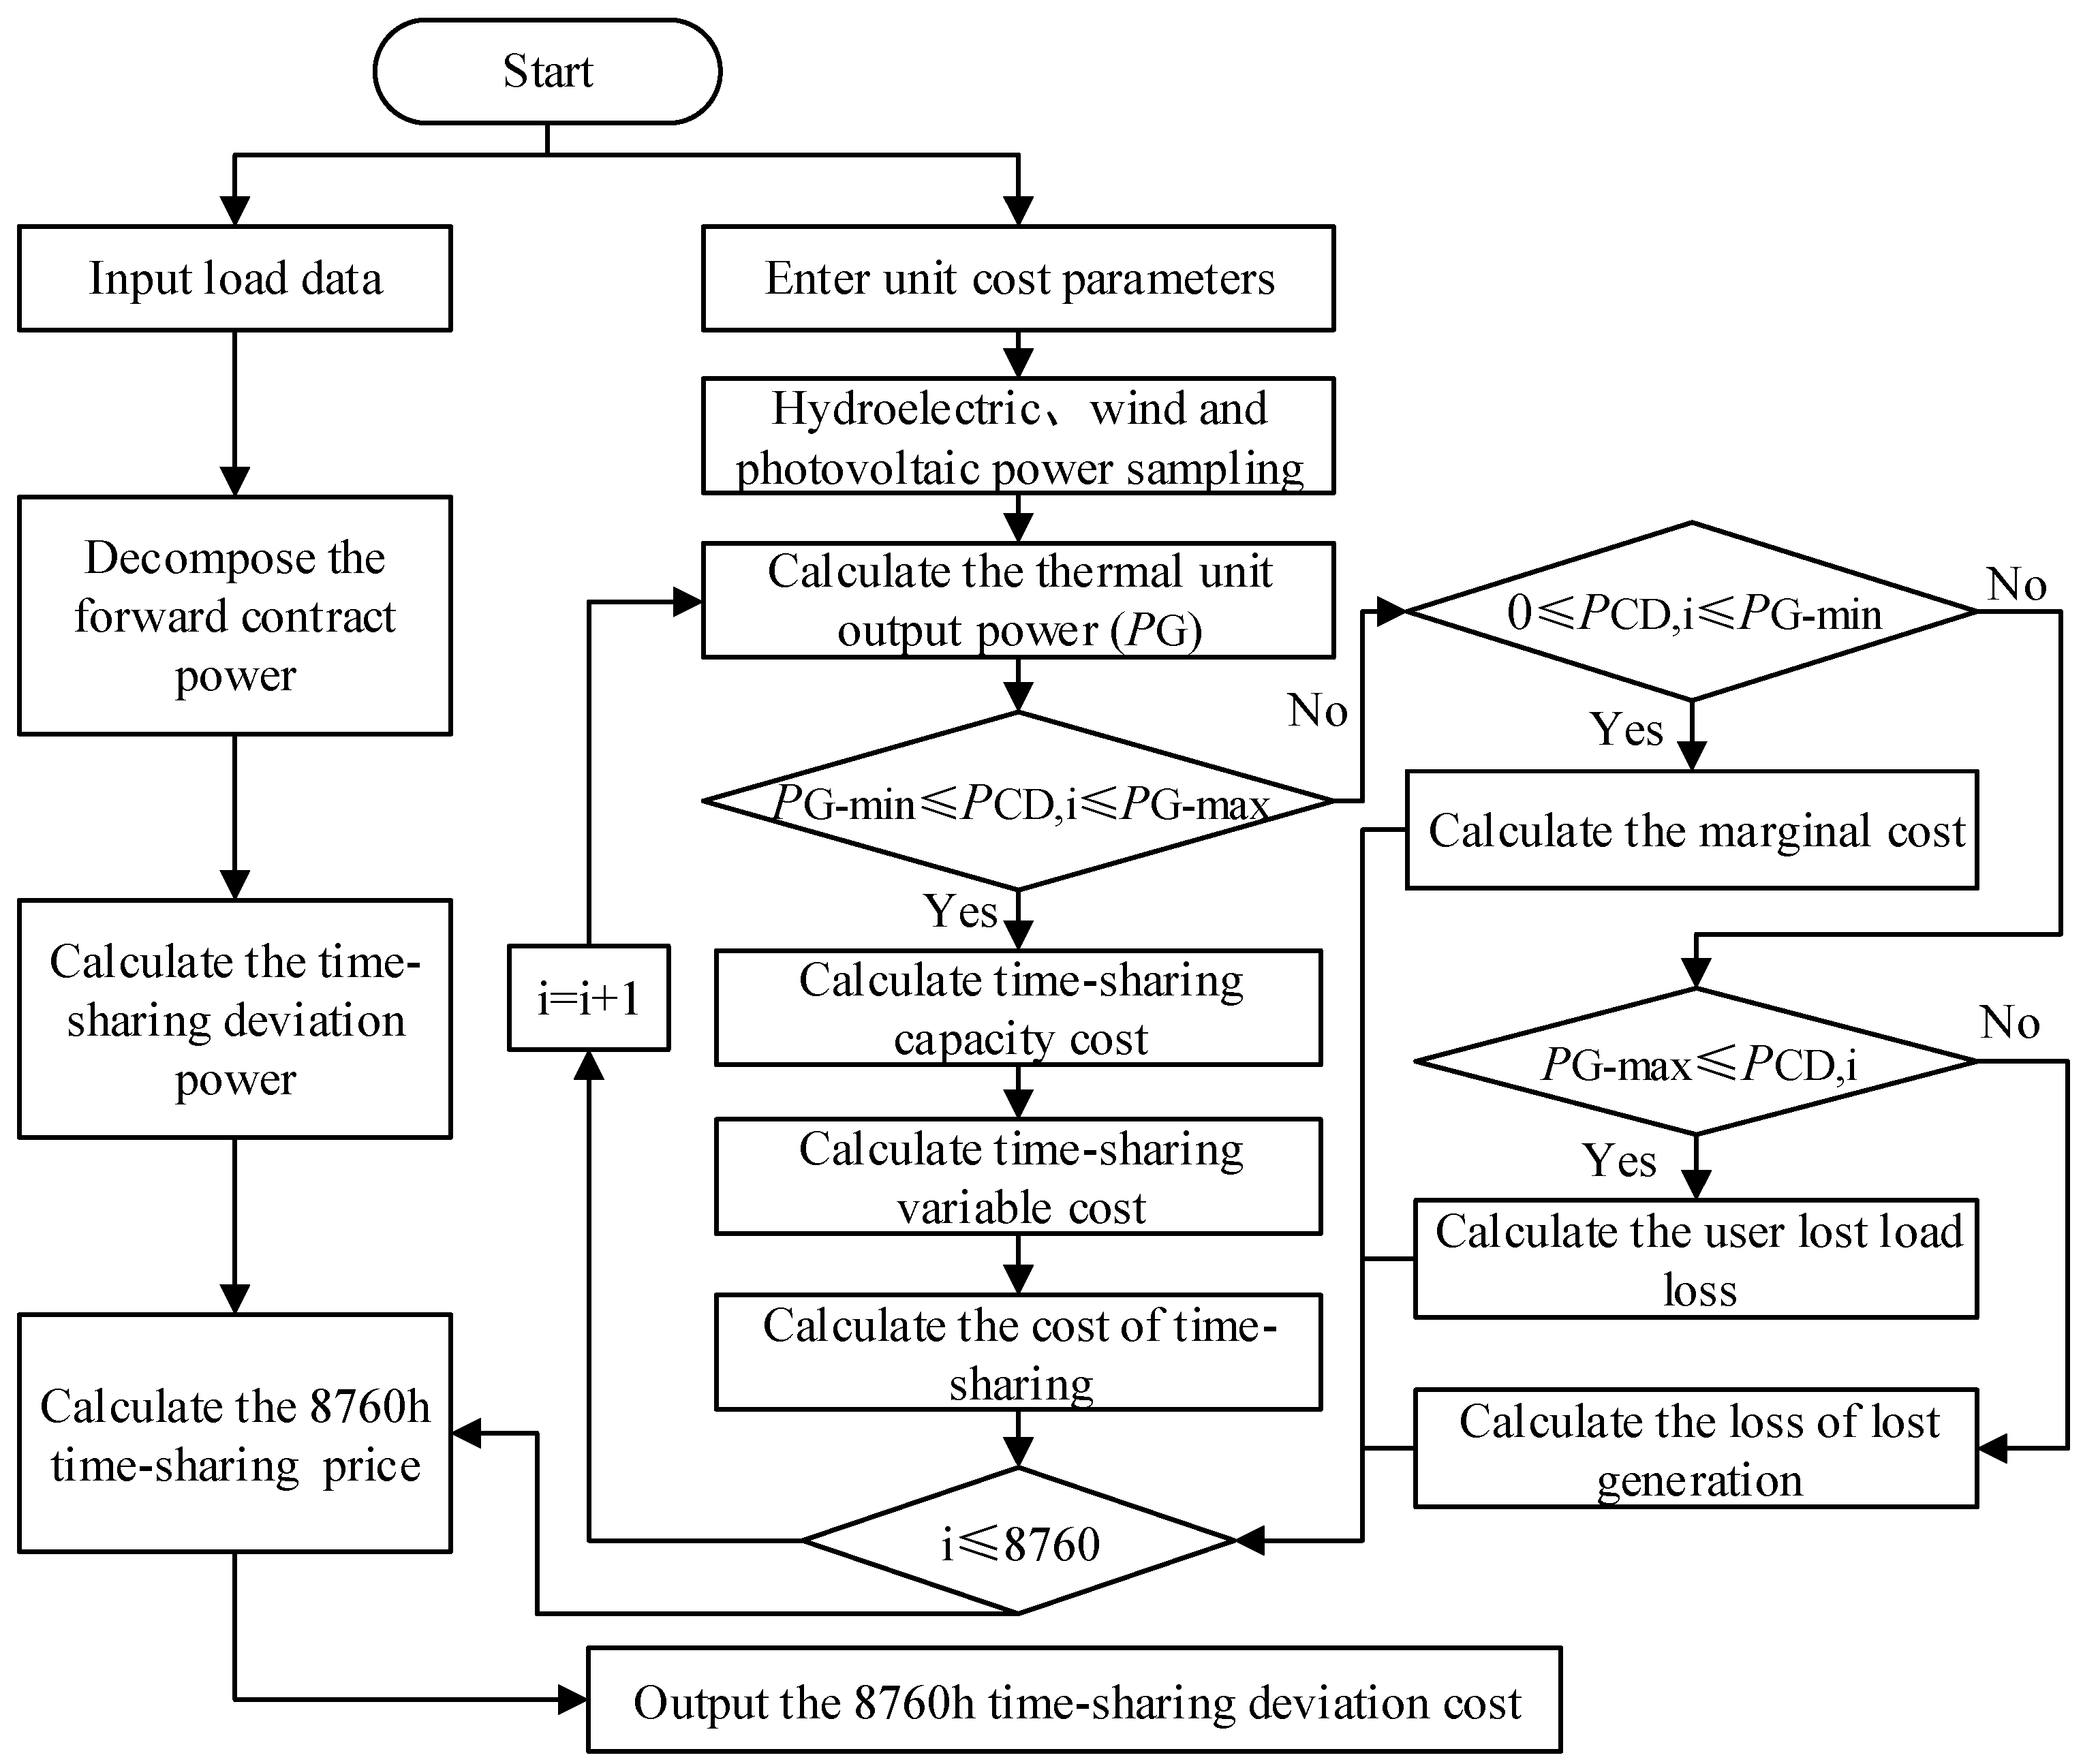
2.2.4. Solution Flow

The operational flow of the deviation responsibility value assessment method, which is based on the time-sharing trading price proposed in this paper, is depicted in Figure 6. The process involves several steps: the forward contract power decomposition, calculation of hourly DE, determination of the time-sharing trading price, and assessment of the time-sharing deviation cost. The solution process is implemented using the MATLAB R2024a platform.

3. Simulation Results and Discussion

3.1. Basic Settings

This paper conducts simulations and assessments on time-sharing trading tariffs and the deviation costs in China’s Province H, utilizing the annual 8760 h load data, power generator cost data, coal price index, power supply structure, and typical daily hydropower output. The power supply in Province H is primarily composed of hydropower and thermal power, with a total approved system capacity cost of CNY 17.785 billion. The standard coal consumption factor stands at 0.32 KG/KWH. The user lost load is valued at 7.823 CNY/KWH, using the value added to the industrial GDP of Province H in 2019. The marginal variable cost coefficient for hydropower, wind power, and photovoltaic sources is set at 0.
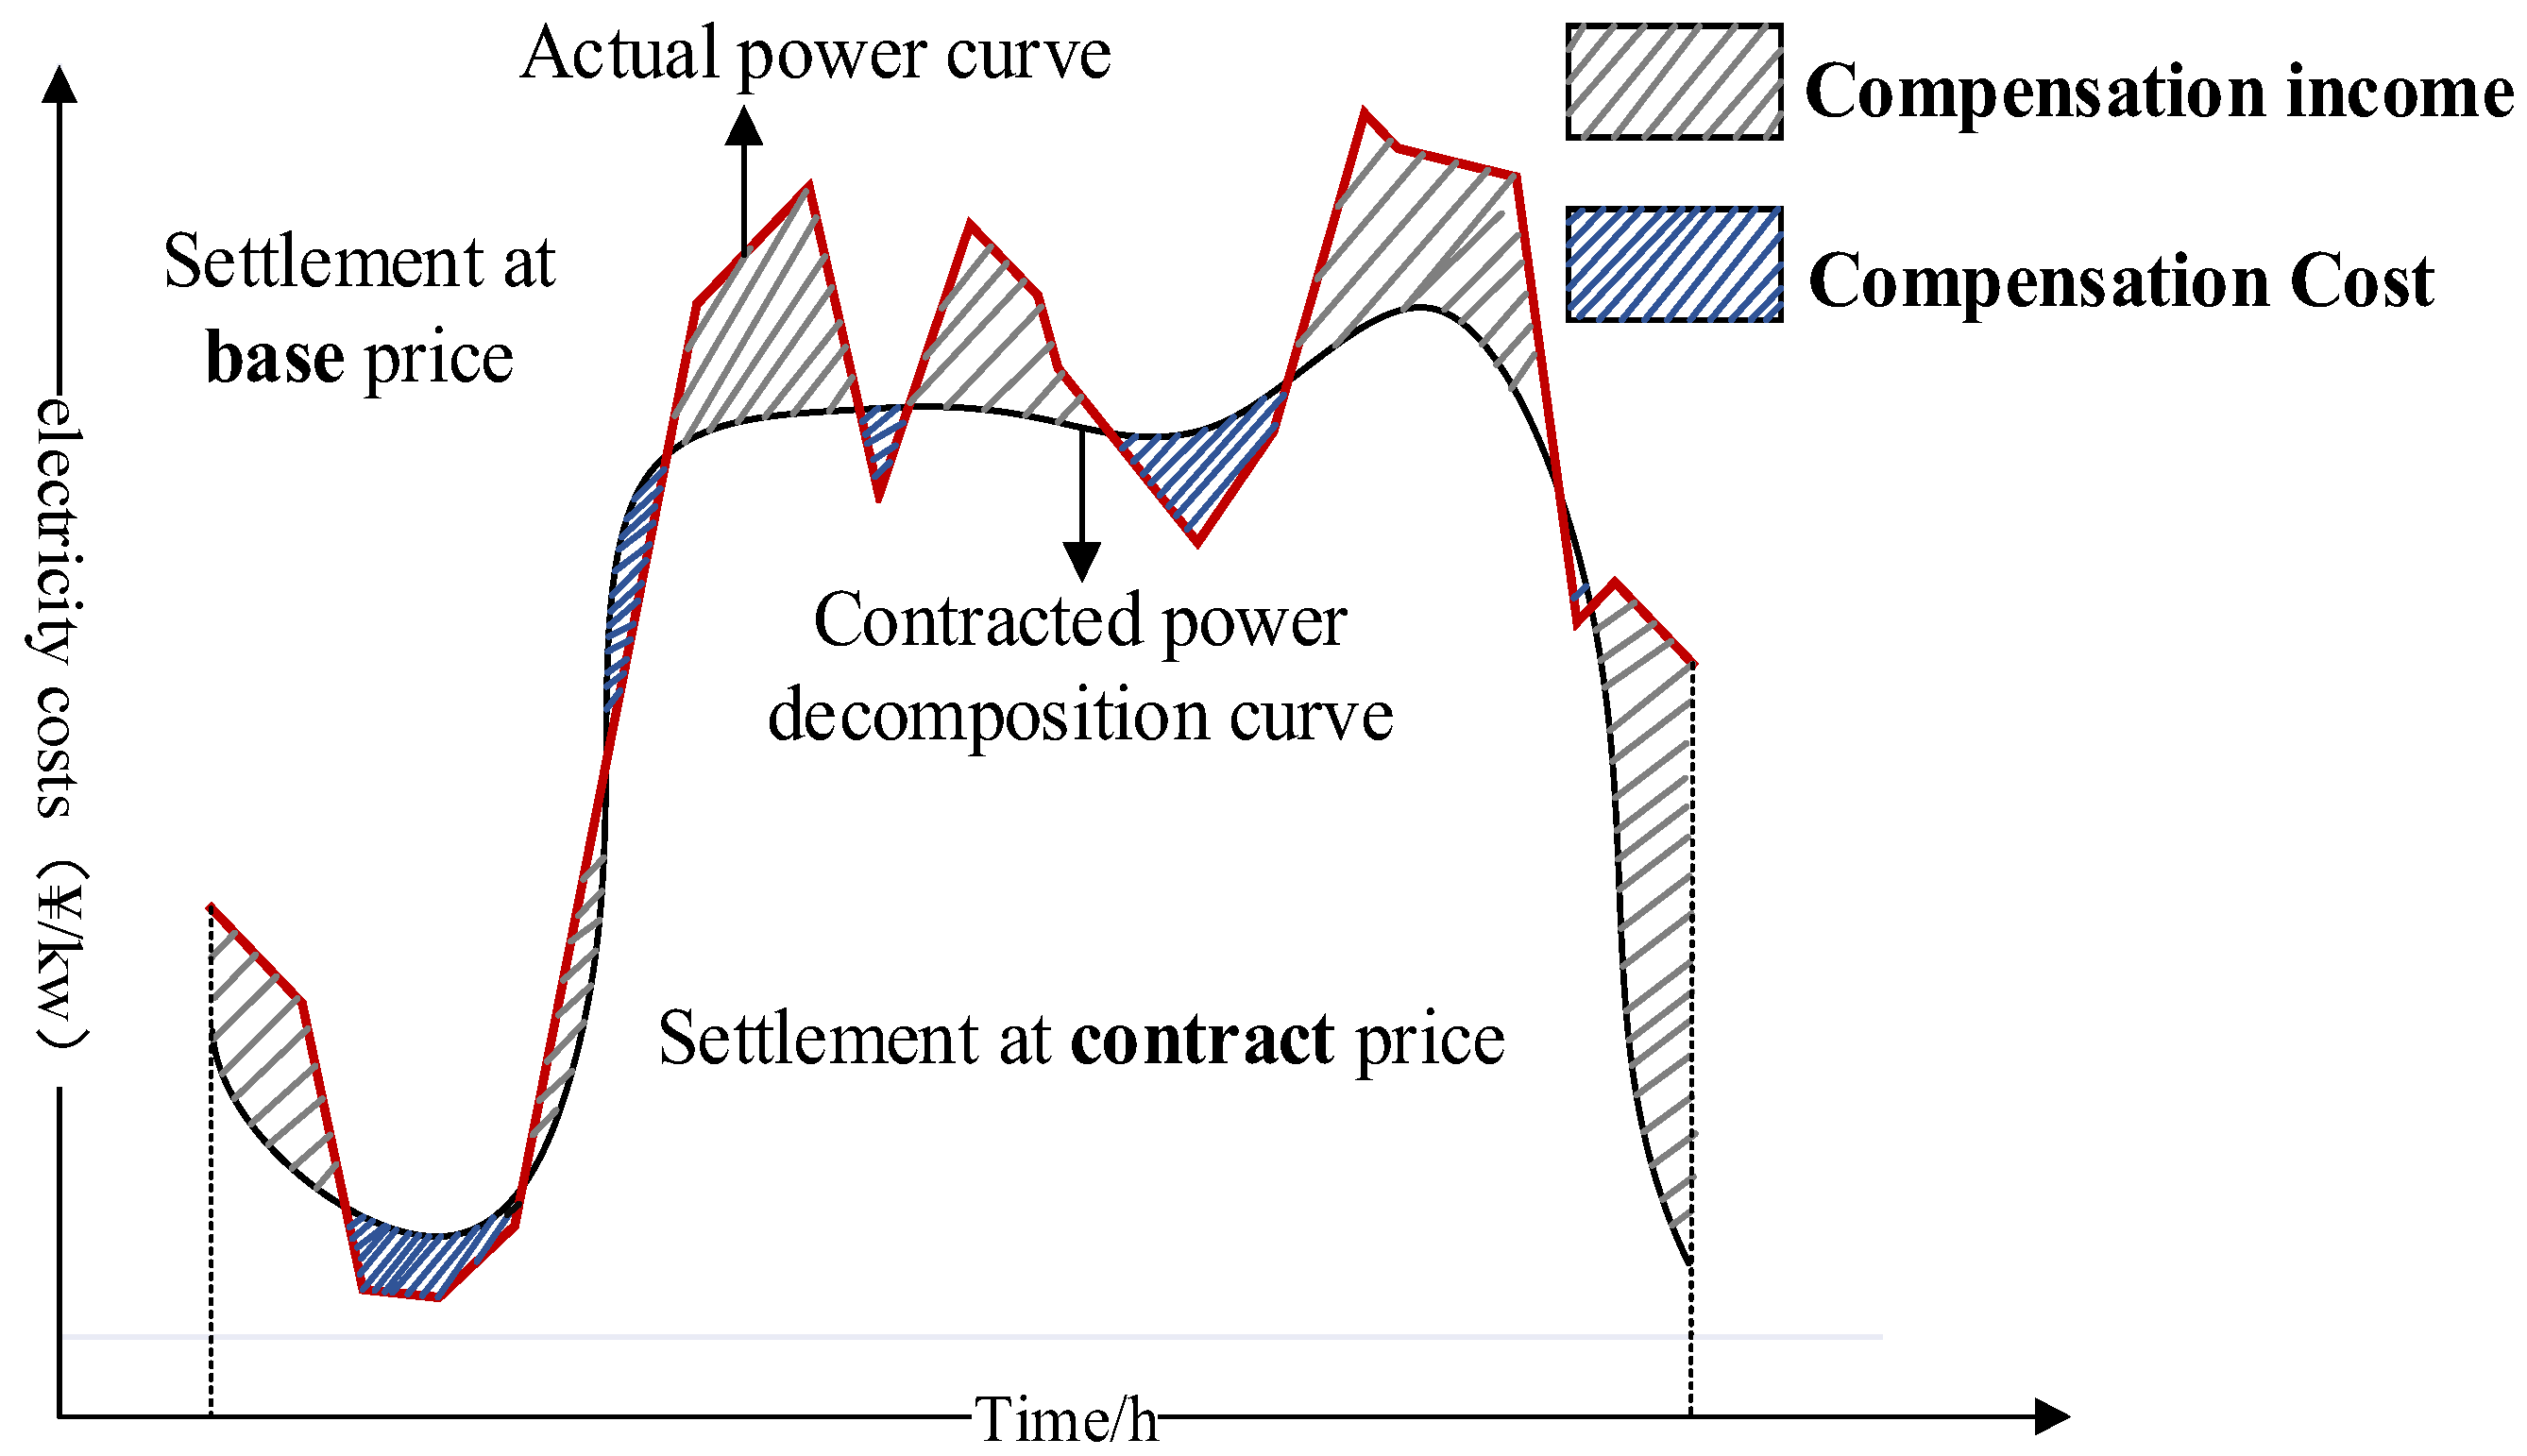
  • Decomposition of forward contract
In 2021, the total annual forward contract volume of Province H reached 230 billion KWH. According to the Basic Rules for Medium- and Long-Term Trading of Electricity in China, the specific steps for decomposing the forward contract curve are outlined as follows:
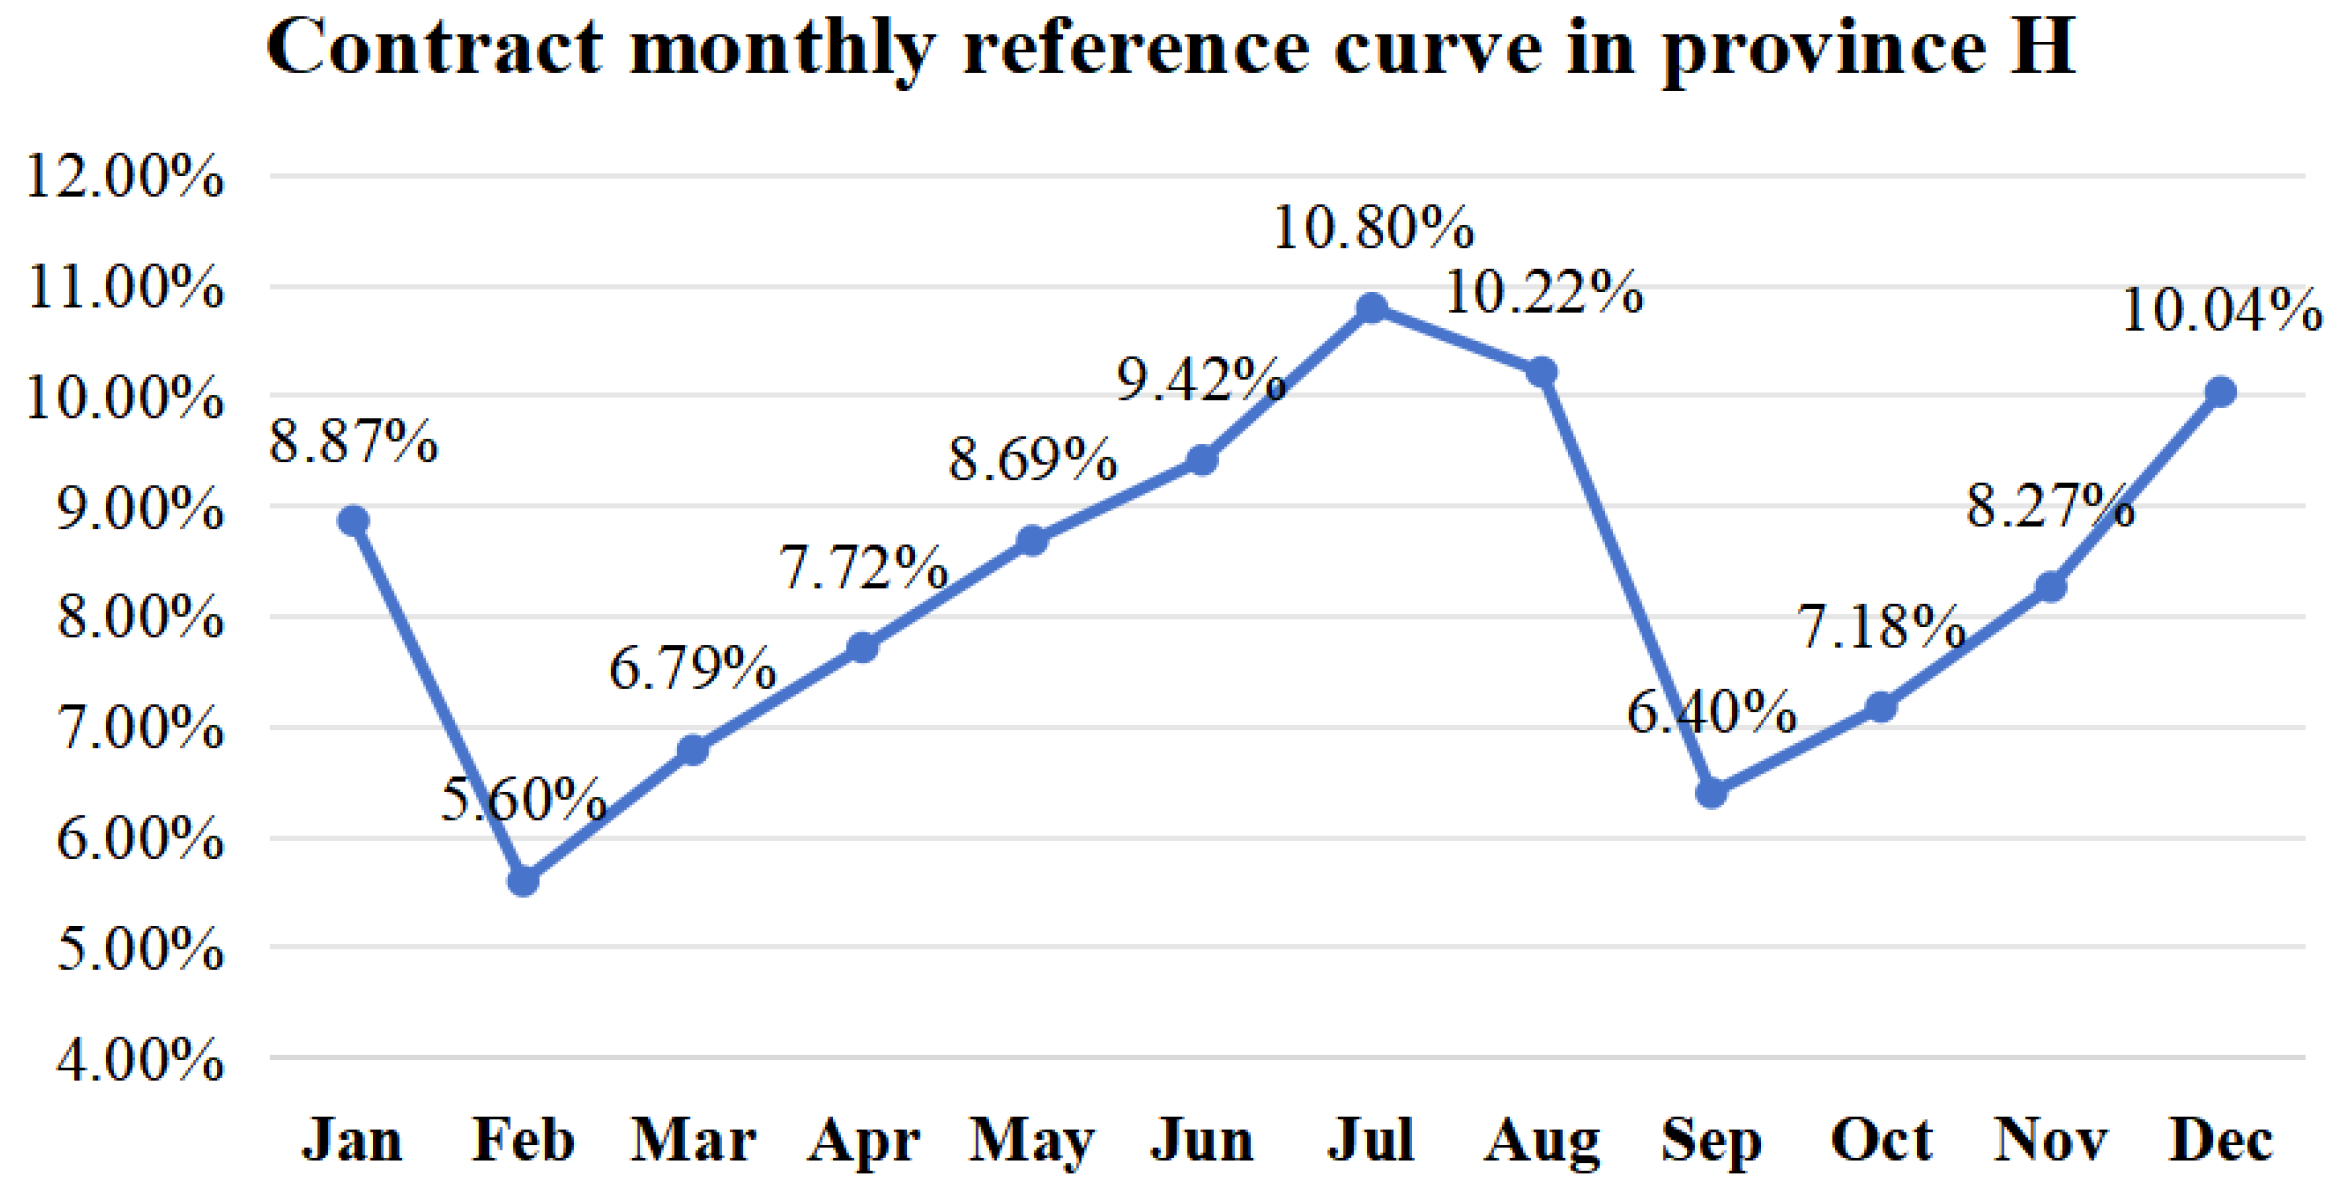
  • Decompose the total annual contract power into monthly contract power, guided by the reference curve. The reference decomposition curve is depicted in Figure 7.
  • Breakdown monthly total power into daily power on an average basis by days.
  • Decompose daily power into hourly power, referencing the integrated daily typical curve. The decomposition ratios are as follows: 20% of electricity within the time period 0:00~9:00; 50% within 9:00~18:00; and 30% within 18:00~24:00.
Through the above process, the forward contract power decomposition curve of 8760 h for Province H in 2021 is obtained. Upon the comparison of this curve with the actual load curve of Province H, illustrated in Figure 8, the total actual load for 2021 in Province H amounts to 233.5 billion KWH. The load curve demonstrates “double peak” characteristics of a “double high and double low”, with higher load levels in summer and winter, and higher load levels in the middle of the day and in the evening. As depicted in Figure 8, while the contract decomposition curve and the actual load curve exhibit general similarity, there are discernible deviations between them at specific instances.
2.
Time-sharing deviation electricity
Figure 9 depicts the distribution of time-sharing DE in Province H. In 2021, the total amount of DE in Province H was 3.5 billion KWH. This total consists of 32 billion KWH of positive deviation and 35.5 billion KWH of negative deviation, yielding a deviation rate of 1.5 percent. The analysis reveals that Province H experiences higher deviation levels from May to September and December, corresponding with the use load feature and increased electricity demand during summer and winter, resulting in heightened deviation due to peak loads. The peak monthly deviation occurred in August, reaching 6.97 billion KWH, while the lowest was recorded in February at 3.35 billion KWH. July saw the highest hourly deviation of 21.08 million KWH, while the minimum hourly deviation was 0. On average, hourly deviation stood at 7.7 million KWH, resulting in an hourly deviation rate of 28.89%, notably surpassing the annual deviation rate. This disparity arises from the offsetting calculation of positive and negative deviations throughout the year. Utilizing the absolute value of the DE for computation would inflate the annual deviation to 67.5 billion KWH, resulting in a deviation rate surge from 1.5% to 29.34%.

3.2. Simulation Results

Figure 10 shows the measurement results of the annual 8760h time-sharing deviation trading price in Province H. Based on the measurement results, we analyze the following features of the time-sharing transaction prices in Province H: (a) The overall variation of electricity generation costs is significant. The average annual transaction price in Province H in 2021 is 0.2108 CNY/KWH, with the maximum transaction price at 7.008 CNY/KWH, and the minimum transaction price at −0.0868 CNY/KWH, a difference of about 80 times. (b) The seasonal variation in trading prices is evident in Province H, with significantly higher prices observed in summer and winter compared to spring and fall and summer prices notably surpass winter prices, attributable to the heightened supply–demand imbalance during peak summer and winter periods in Province H. (c) Changes in daily trading power costs are small compared to annual and quarterly variations, but spike costs can occur on specific dates. (d) Time-sharing trading prices fluctuate around the average cost annually, except for brief periods of exceptionally high prices from June to August, during periods of high demand and limited supply.
Figure 11 and Table 4 provide a comparative analysis of the monthly average, maximum, and minimum deviation transaction prices alongside the annual average deviation transaction price in Province H. The analysis indicates minimal variation in the monthly average and minimum transaction prices, with the monthly average closely resembling the annual average transaction price of 0.2108 CNY/(KWH). In contrast, there is significant fluctuation in the monthly maximum transaction price, particularly evident with a sharp spike from June to August. These findings suggest that the time-sharing trading model proposed in this paper, characterized by a lower annual mean but a larger variance in price change, effectively facilitates price-guided resource allocation while aligning with the Chinese government’s objective of maintaining stable electricity prices.
Figure 12 illustrates the annual time-sharing cost calculation results in Province H. The total deviation transaction cost for the entire year is CNY 1.248 billion, resulting in an average transaction cost per hour of CNY 14.24 thousand. The highest deviation transaction cost amounts to CNY 16.94 million, while the lowest is CNY -6.36 million, resulting in a difference of CNY 23.3 million. From April to August and November to December, total monthly deviation trading costs are negative, indicating gains for the BRP from trading DE. In July, the largest gain of CNY 515.77 million is recorded due to the availability of more negative DE for sale, due to higher time-sharing trading prices. In other months, the total monthly deviation trading cost is positive, reflecting the cost incurred by the BRP for purchasing balancing services from the BSP. September records the largest cost of CNY 1.525 billion. This method, as proposed in this paper, provides a detailed insight into the hourly deviation responsibility for the BRP. It no longer penalizes deviation power with price increases but considers the direction and contribution of the deviation power, calculating the economic value of deviation responsibility based on the time-sharing trading price, which may result in either a benefit or a cost.

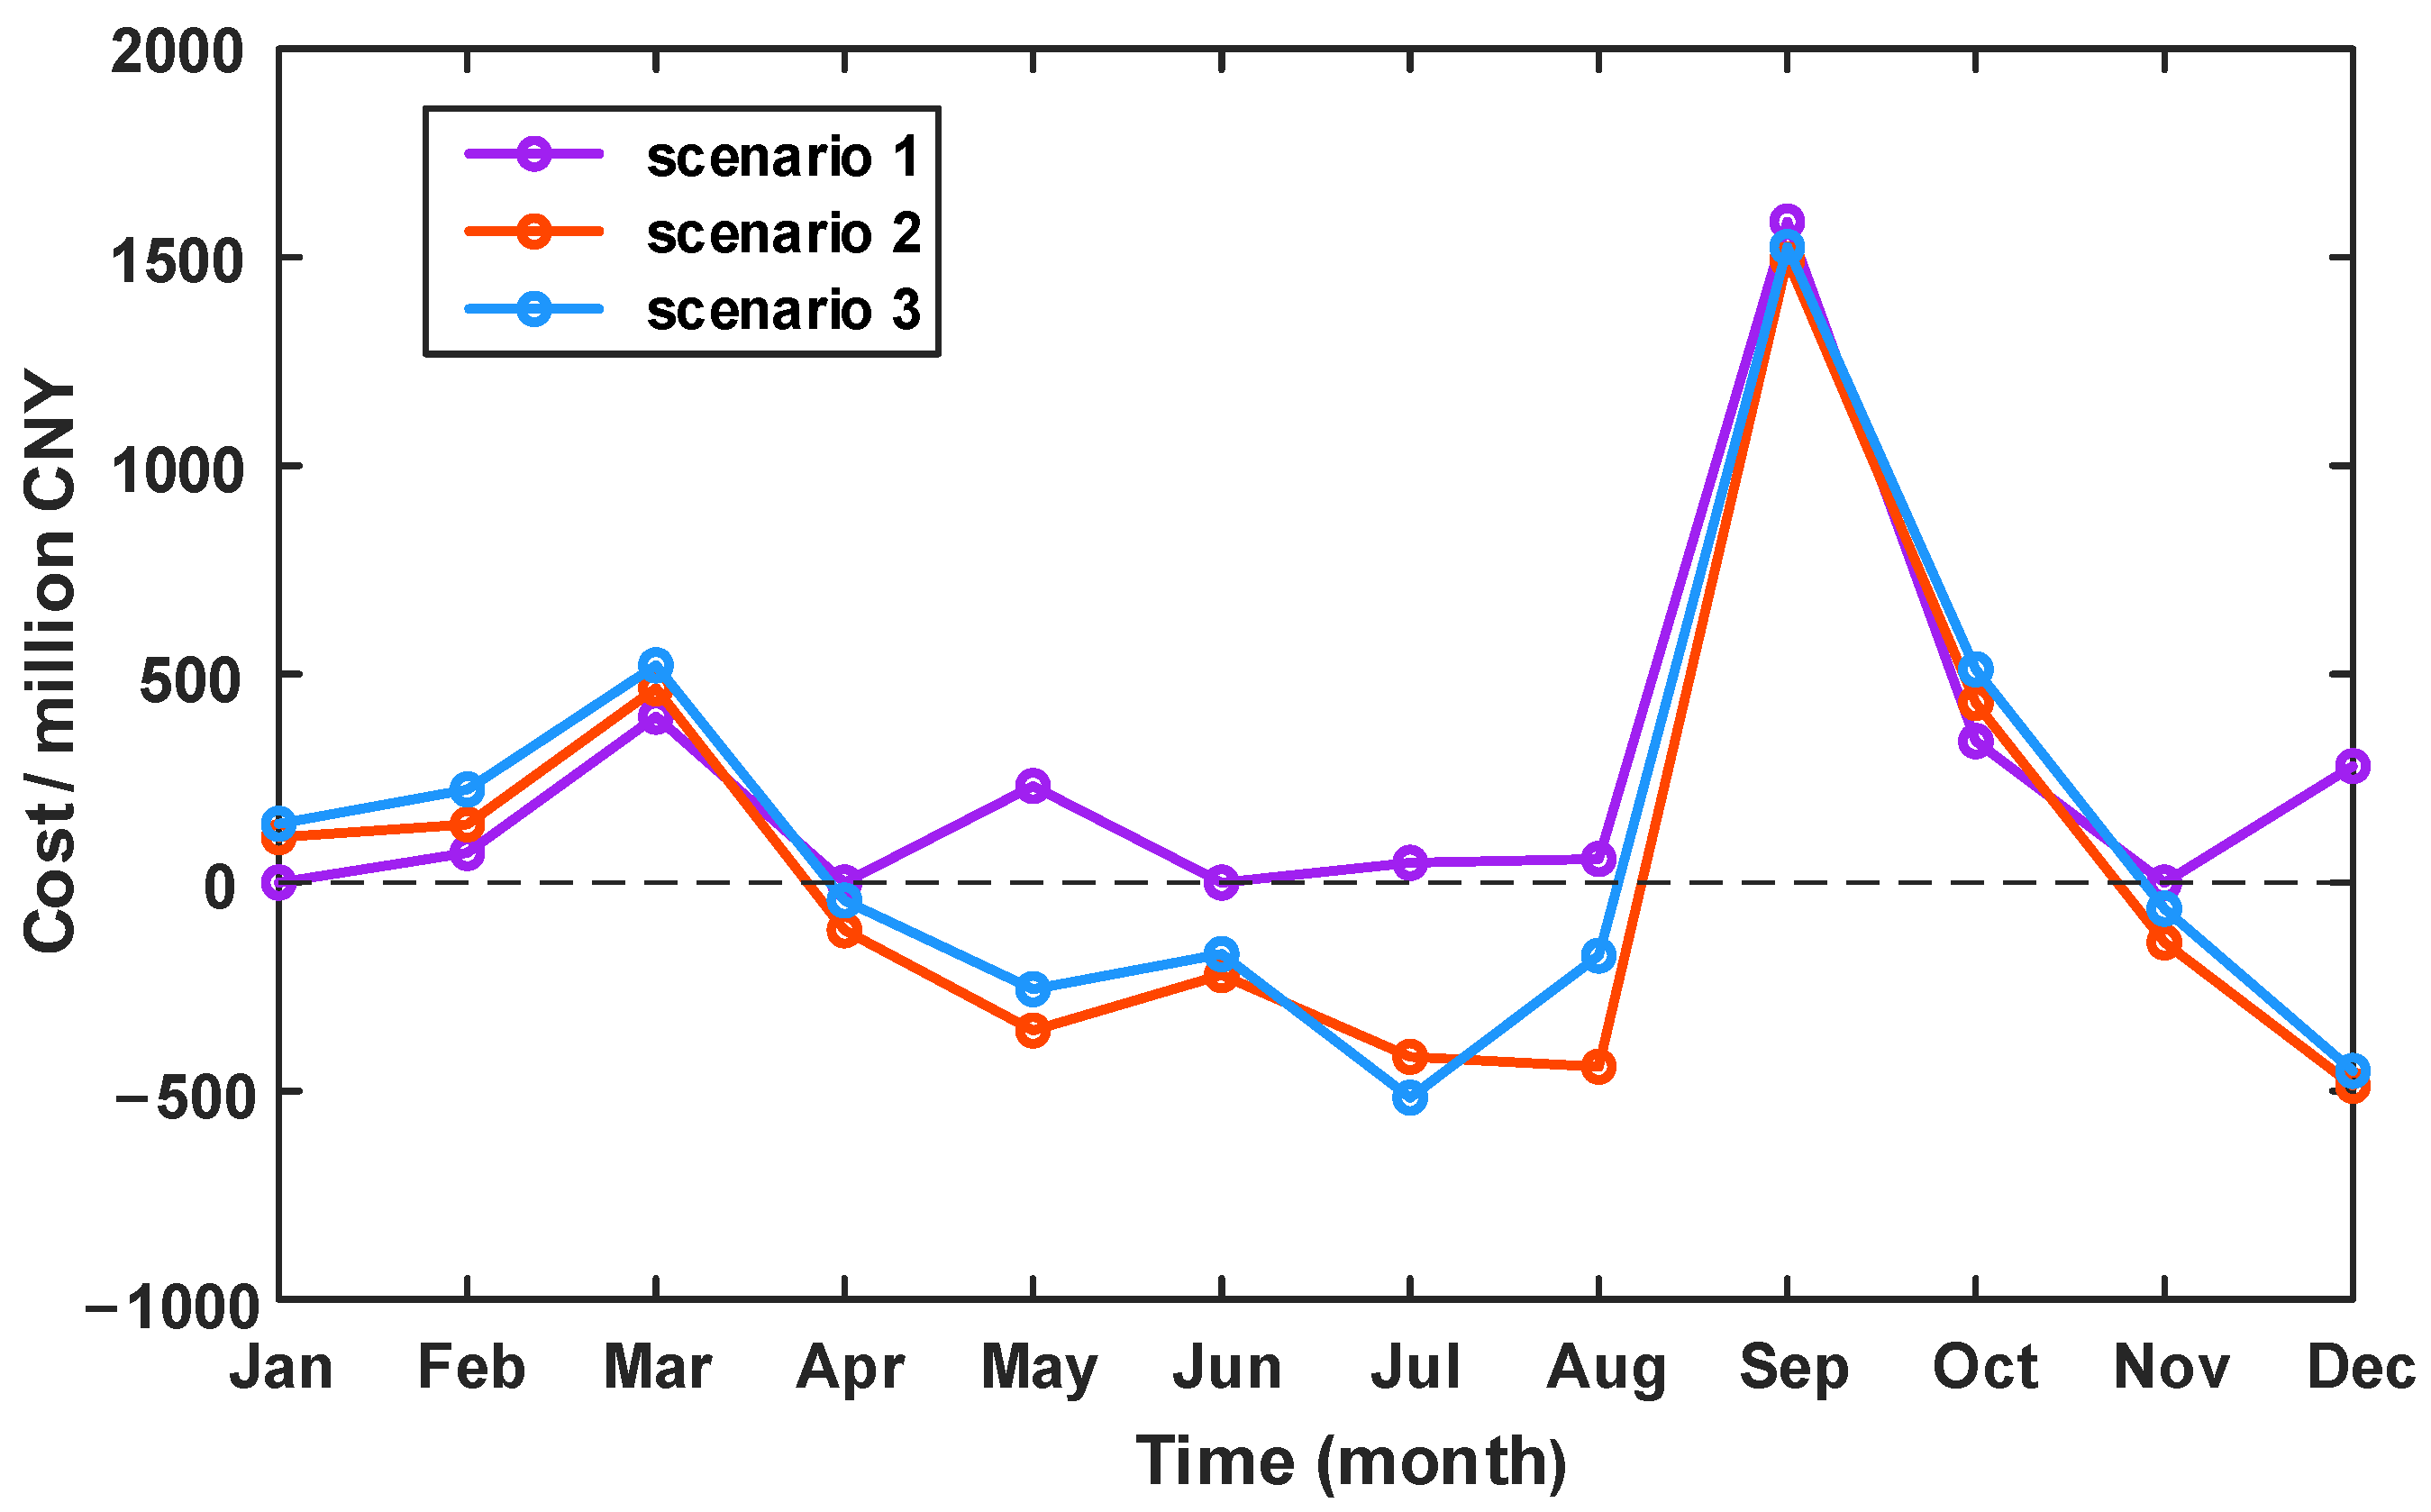
3.3. Comparative Analysis of Different Scenarios

To analyze the impact of various EDS mechanisms on deviation costs, three scenarios were established for comparison. The total contracted power, actual power, and contracted price remain consistent across all three scenarios, with the average annual transaction price set at 0.2108 CNY/KWH for the contracted power.
Scenario 1: DE is calculated and settled monthly. A 5% exemption assessment range is set. The SO purchases balancing services from the BSP based on the monthly average trading price and levies a penalty assessment fee on the BRP at 1.2 times the monthly average trading price.
Scenario 2: DE is calculated and settled monthly. No exemption assessment is provided. The BRP accepts the monthly trading average price in the form of CFDs. Similarly, the BSP settles the balancing services at the monthly trading average price, and the grid is not assessed for deviation.
Scenario 3: DE is calculated hourly and settled monthly. No exemption is provided. The BRP’s hourly DE participates in time-sharing transactions in the form of CFDs, and the BSP settles balancing services at the time-sharing transaction price, and the grid is not assessed for deviation.
Table 5 presents a comparison of the results of arithmetic examples across various scenarios. (a) Results illustration: (1) Scenario 1 only charges a penalty assessment for deviation power beyond the exemption threshold, and does not distinguish between positive and negative directions of deviation power, all of which are penalized according to 1.2 times the monthly average trading price, resulting in a deviation cost of CNY 3009.54 million, and the SO is required to pay balancing fees to the BSP according to the total DE of the month (including both in threshold and out of threshold) of CNY 459.52 million, and the difference of 2550 million is borne by the SO or shared proportionally to the market players. (2) In Scenario 2, the monthly total DE is settled at the monthly average transaction price. At the same time, BRP payment is consistent with the fee charged by the BSP, and the power grid will no longer bear additional costs. (3) In Scenario 3, the basic calculation period is hours, and time-sharing deviation electricity is settled at the time-sharing trading price. Consequently, the power grid does not incur additional costs. The deviation electricity involved in the transaction is the absolute sum of the time-sharing deviation electricity.
(b) Comparative analysis: (1) Among all scenarios, only Scenario 1 may incur additional costs due to discrepancies in settlement prices. In Scenario 2 and Scenario 3, the income and expenditure costs of SO settlement are consistent, and no other costs will be generated. To fulfill the role of an SO as an independent third-party settlement institution, it is recommended that the deviation electricity be settled through CFDs accepting the market price. (2) The deviation cost in Scenario 2 and Scenario 3 is lower than that in Scenario 1 because they can generate revenue by selling negative deviation electricity. However, the deviation cost in Scenario 2 is lower than that in Scenario 3 because the settlement period (month) in Scenario 2 is longer, allowing for the offsetting of positive and negative deviation electricity within the month without incurring deviation costs. (3) The average deviation cost of Scenario 3 is the smallest at CNH 0.0185/KWH. Although the deviation cost of Scenario 3 is not the lowest, the deviation power base of Scenario 3 is the sum of the absolute values of all time-sharing deviations, resulting in the smallest average deviation cost.
Figure 13 further presents a comparison of monthly deviation costs across various scenarios. Monthly deviation assessment costs for Scenario 1 are consistently not less than zero, with no costs incurred in January, April, June, and November. The reason for this phenomenon is that the current EDS mechanism establishes a 5% exemption threshold, meaning that DE less than 5% is not subject to deviation costs. Consequently, the DE in January, April, June, and November did not incur assessment costs as it did not exceed the threshold. Both Scenario 2 and Scenario 3 have positive and negative monthly deviation transaction costs. Specifically, negative deviation costs are observed from April to August and from November to December, with positive costs occurring in the remaining months. Scenario 3 exhibits slightly greater variation in monthly deviation costs compared to Scenario 2. However, when considering the DE base, the average deviation cost in Scenario 3 is lower than in Scenario 2. Furthermore, BRPs participating in market transactions clearly benefit from deviations in May and December but incur costs associated with deviation appraisal under Scenario 1. This indicates that the current mechanism does not adequately respond well to BRPs’ financial responsibility. Overall, the methodology proposed in this paper enables a detailed presentation of a BRP’s responsibility for deviations over time, mitigates additional costs borne by SOs due to inconsistencies in settlement prices, offers BSPs price guidance to derive greater service benefits, and results in a lower average deviation cost.

3.4. Sensitivity Analysis

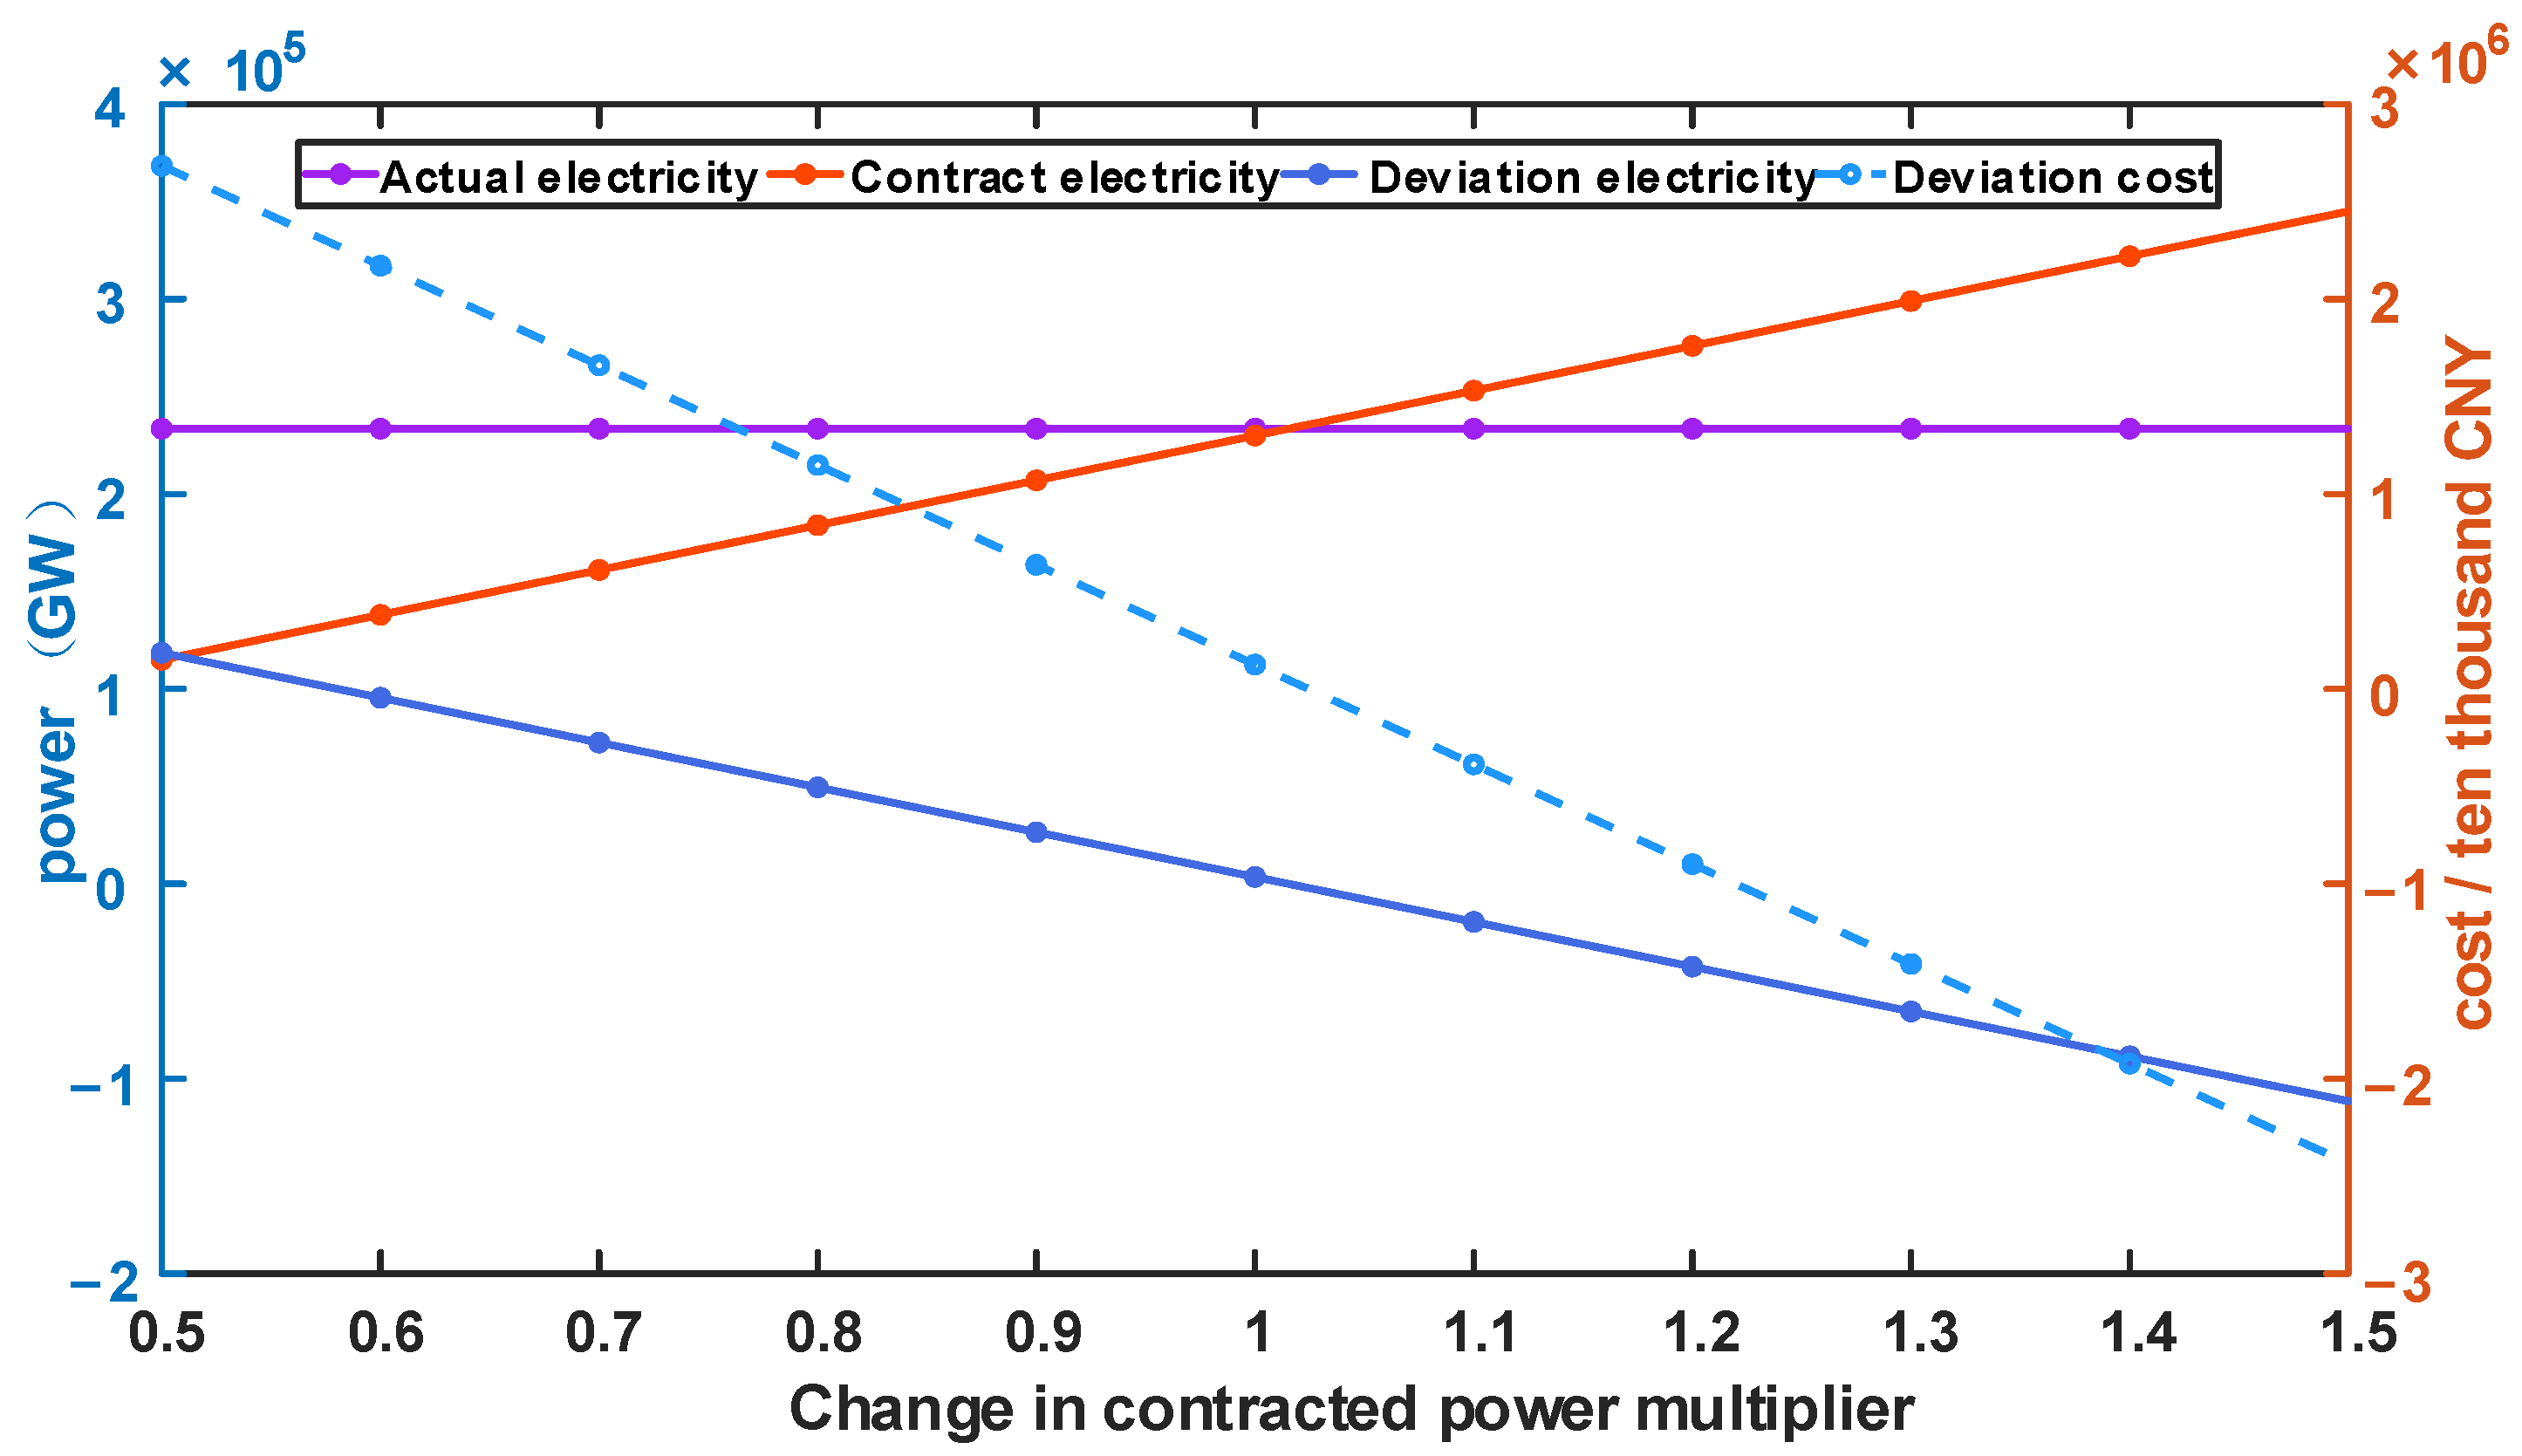
3.4.1. Contracted Electricity

Variations in contracted electricity influence DE, consequently impacting deviation costs. Figure 14 analyzes alterations in total DE and deviation cost in Province H, when actual load power remains constant while contract power varies. As depicted in Figure 13, when contracted power equals actual load, total deviation accumulates to zero. However, deviation transaction costs persist due to varying time-sharing deviation transaction prices. An increase in contracted power correlates with a decrease in both total deviation power and total cost. However, when contracted power is less than actual power, both total deviation power and total deviation cost are positive; conversely, they are negative.

3.4.2. Decomposition Methods

The forward contract decomposition varies, and different decomposition methods result in variations in time-phased deviation power, thereby influencing deviation transaction costs. Figure 15 analyzes the effects of three decomposition methods on monthly deviation costs and average costs. The three decomposition methods include decomposition based on the 2:5:3 ratio, decomposition based on the 24 h average, and decomposition based on the 3.5:4:2.5 ratio. The analysis of the results reveals that the monthly deviation costs of Mode 2 and Mode 3 exhibit similarity, whereas Mode 1 incurs significantly lower deviation costs from June to September compared to the other two decomposition methods. The total deviation cost for Mode 1 amounts to CNY 1247.26 million, significantly lower than the CNY 2147.45 million for Mode 2 and CNY 2252.10 million for Mode 3. The average monthly deviation cost of Mode 1 is CNY 103.93 million, also lower than the CNY 178.95 million of Mode 2 and CNY 187.67 million of Mode 3. These figures indicate that the daily power allocated according to a ratio of 2:5:3 aligns more closely with the load characteristics of Province H.

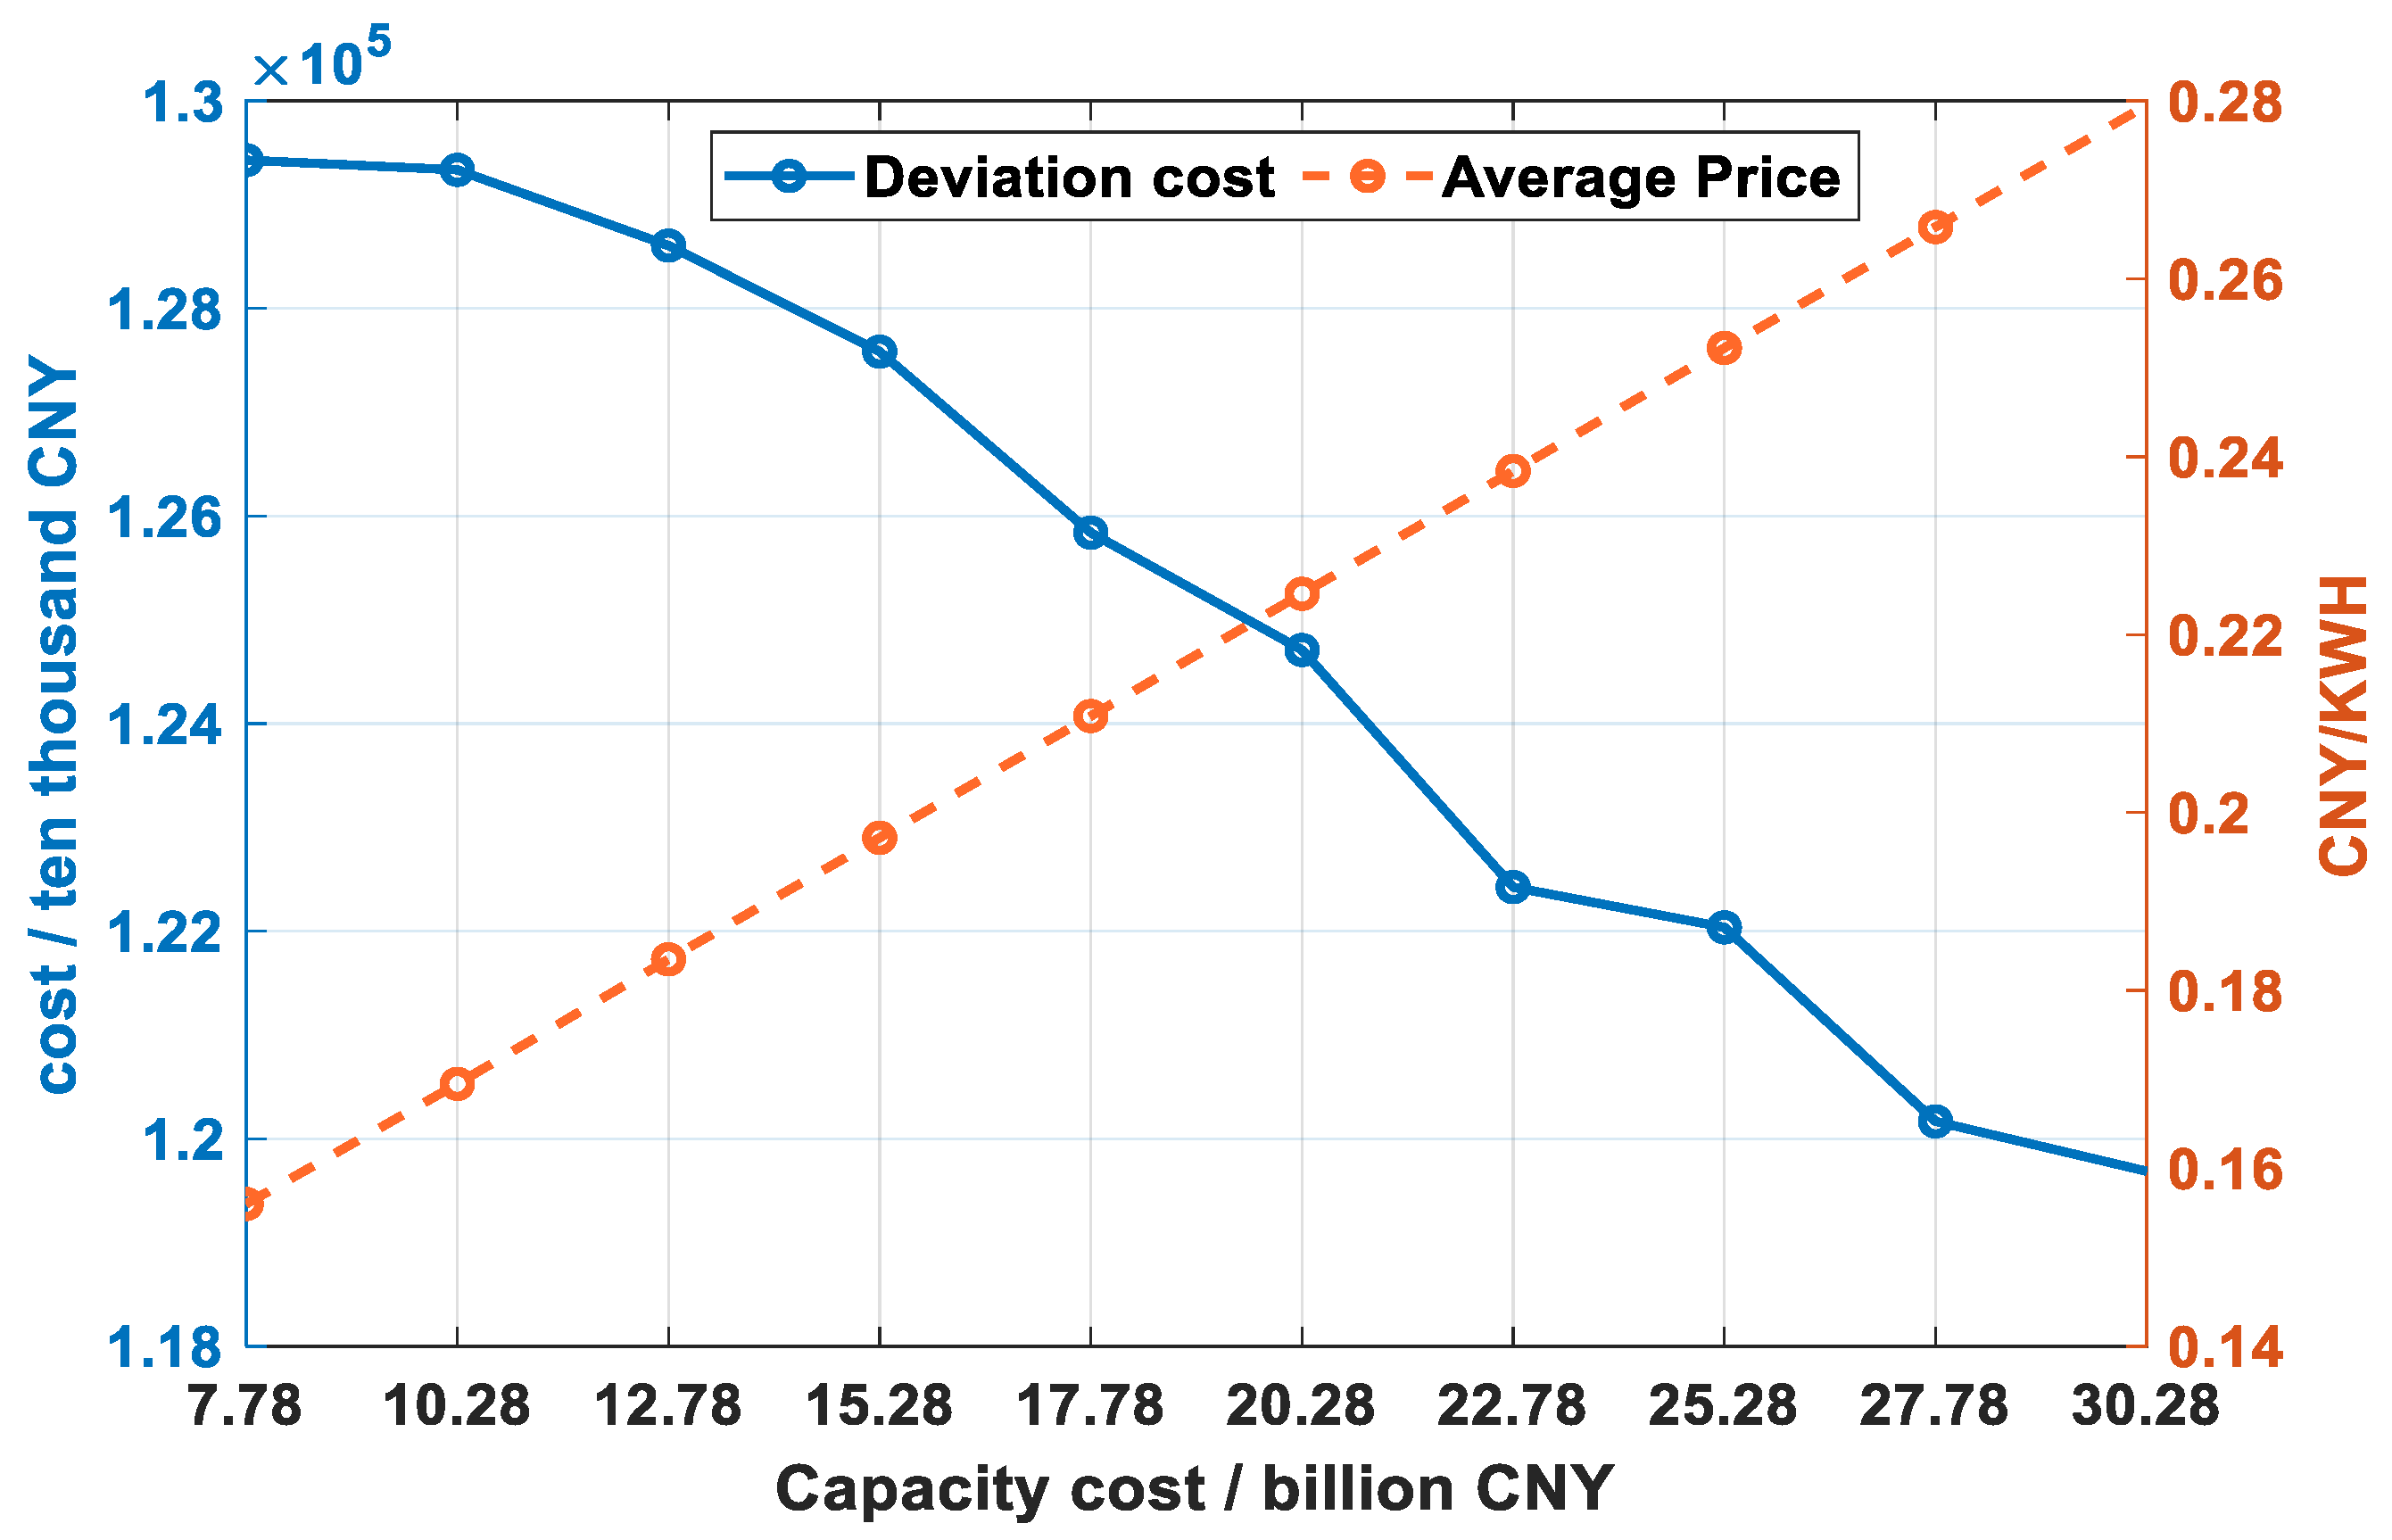
3.4.3. Capacity Cost

We further analyze the influence of capacity cost on the annual average trading price and deviation cost, as depicted in Figure 16. With the increase in total capacity cost, the annual average transaction price demonstrates a consistent upward trend, while the total deviation cost exhibits a declining trend. This phenomenon arises because, from June to September, when the time-sharing trading price is high, the actual load falls below the contracted power, resulting in negative deviation power. This negative deviation power is sold at a high price to generate revenue, thereby offsetting the deviation cost for the entire year. Hence, it becomes evident that the magnitude of the deviation cost cannot be solely determined by the level of the time-sharing trading price but is also influenced by the direction of the deviation at that time.

4. Conclusions and Policy Implications

In this study, a method is proposed for measuring deviation responsibility using time-sharing transaction prices. The method calculates time-sharing DE by breaking down forward contract power, then analyzes and develops a pricing model for time-sharing trading considering typical supply and demand relationships. This method is applied to assess the time-sharing trading prices and deviation costs in Province H, and to compare different mechanisms. The main findings of this study are as follows:
(1)
The unique characteristics of electric power products and the uncertainty in electric power consumption and production are the primary causes of DE. Many countries manage and settle DE through the electricity spot market, while China, dominated by the forward electricity market, utilizes the EDS mechanism to address DE.
(2)
The existing EDS mechanism has shortcomings for stakeholders such as a BRP, BSP, and SO, and it hinders future market development. Inconsistencies in balancing responsibilities and disparities in settlement prices are the primary causes of inaccurate deviation responsibility measurement.
(3)
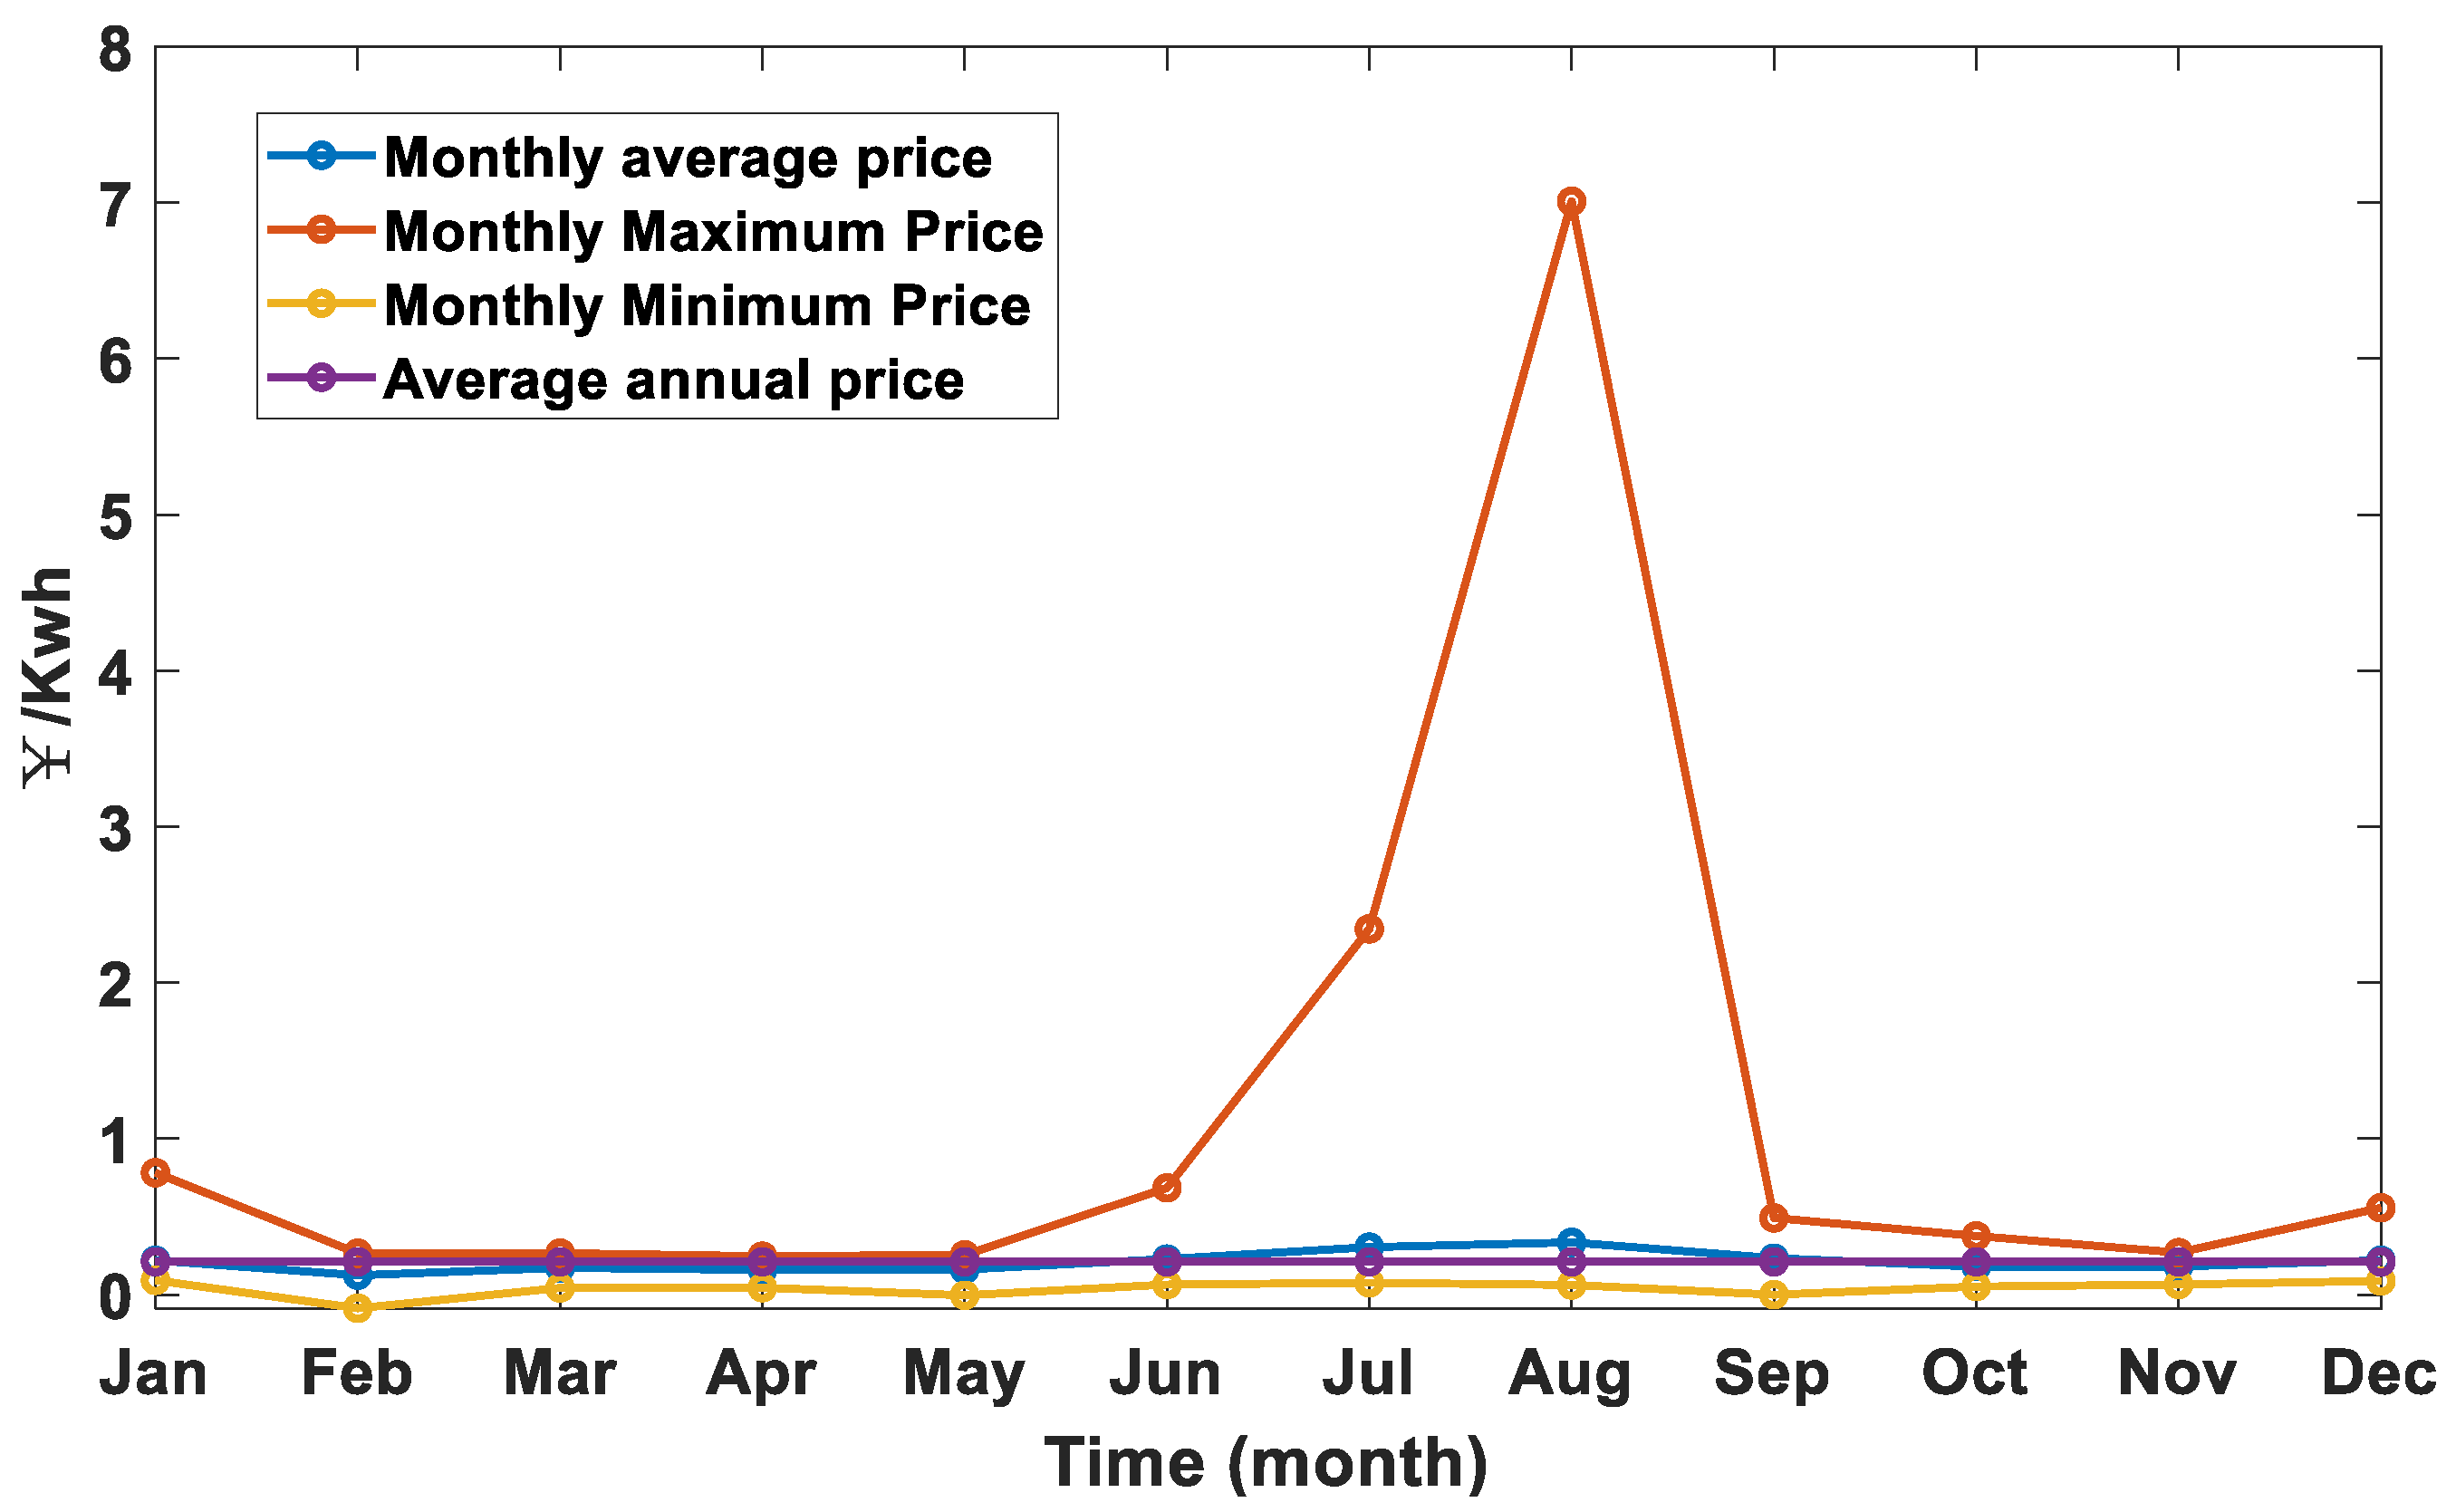
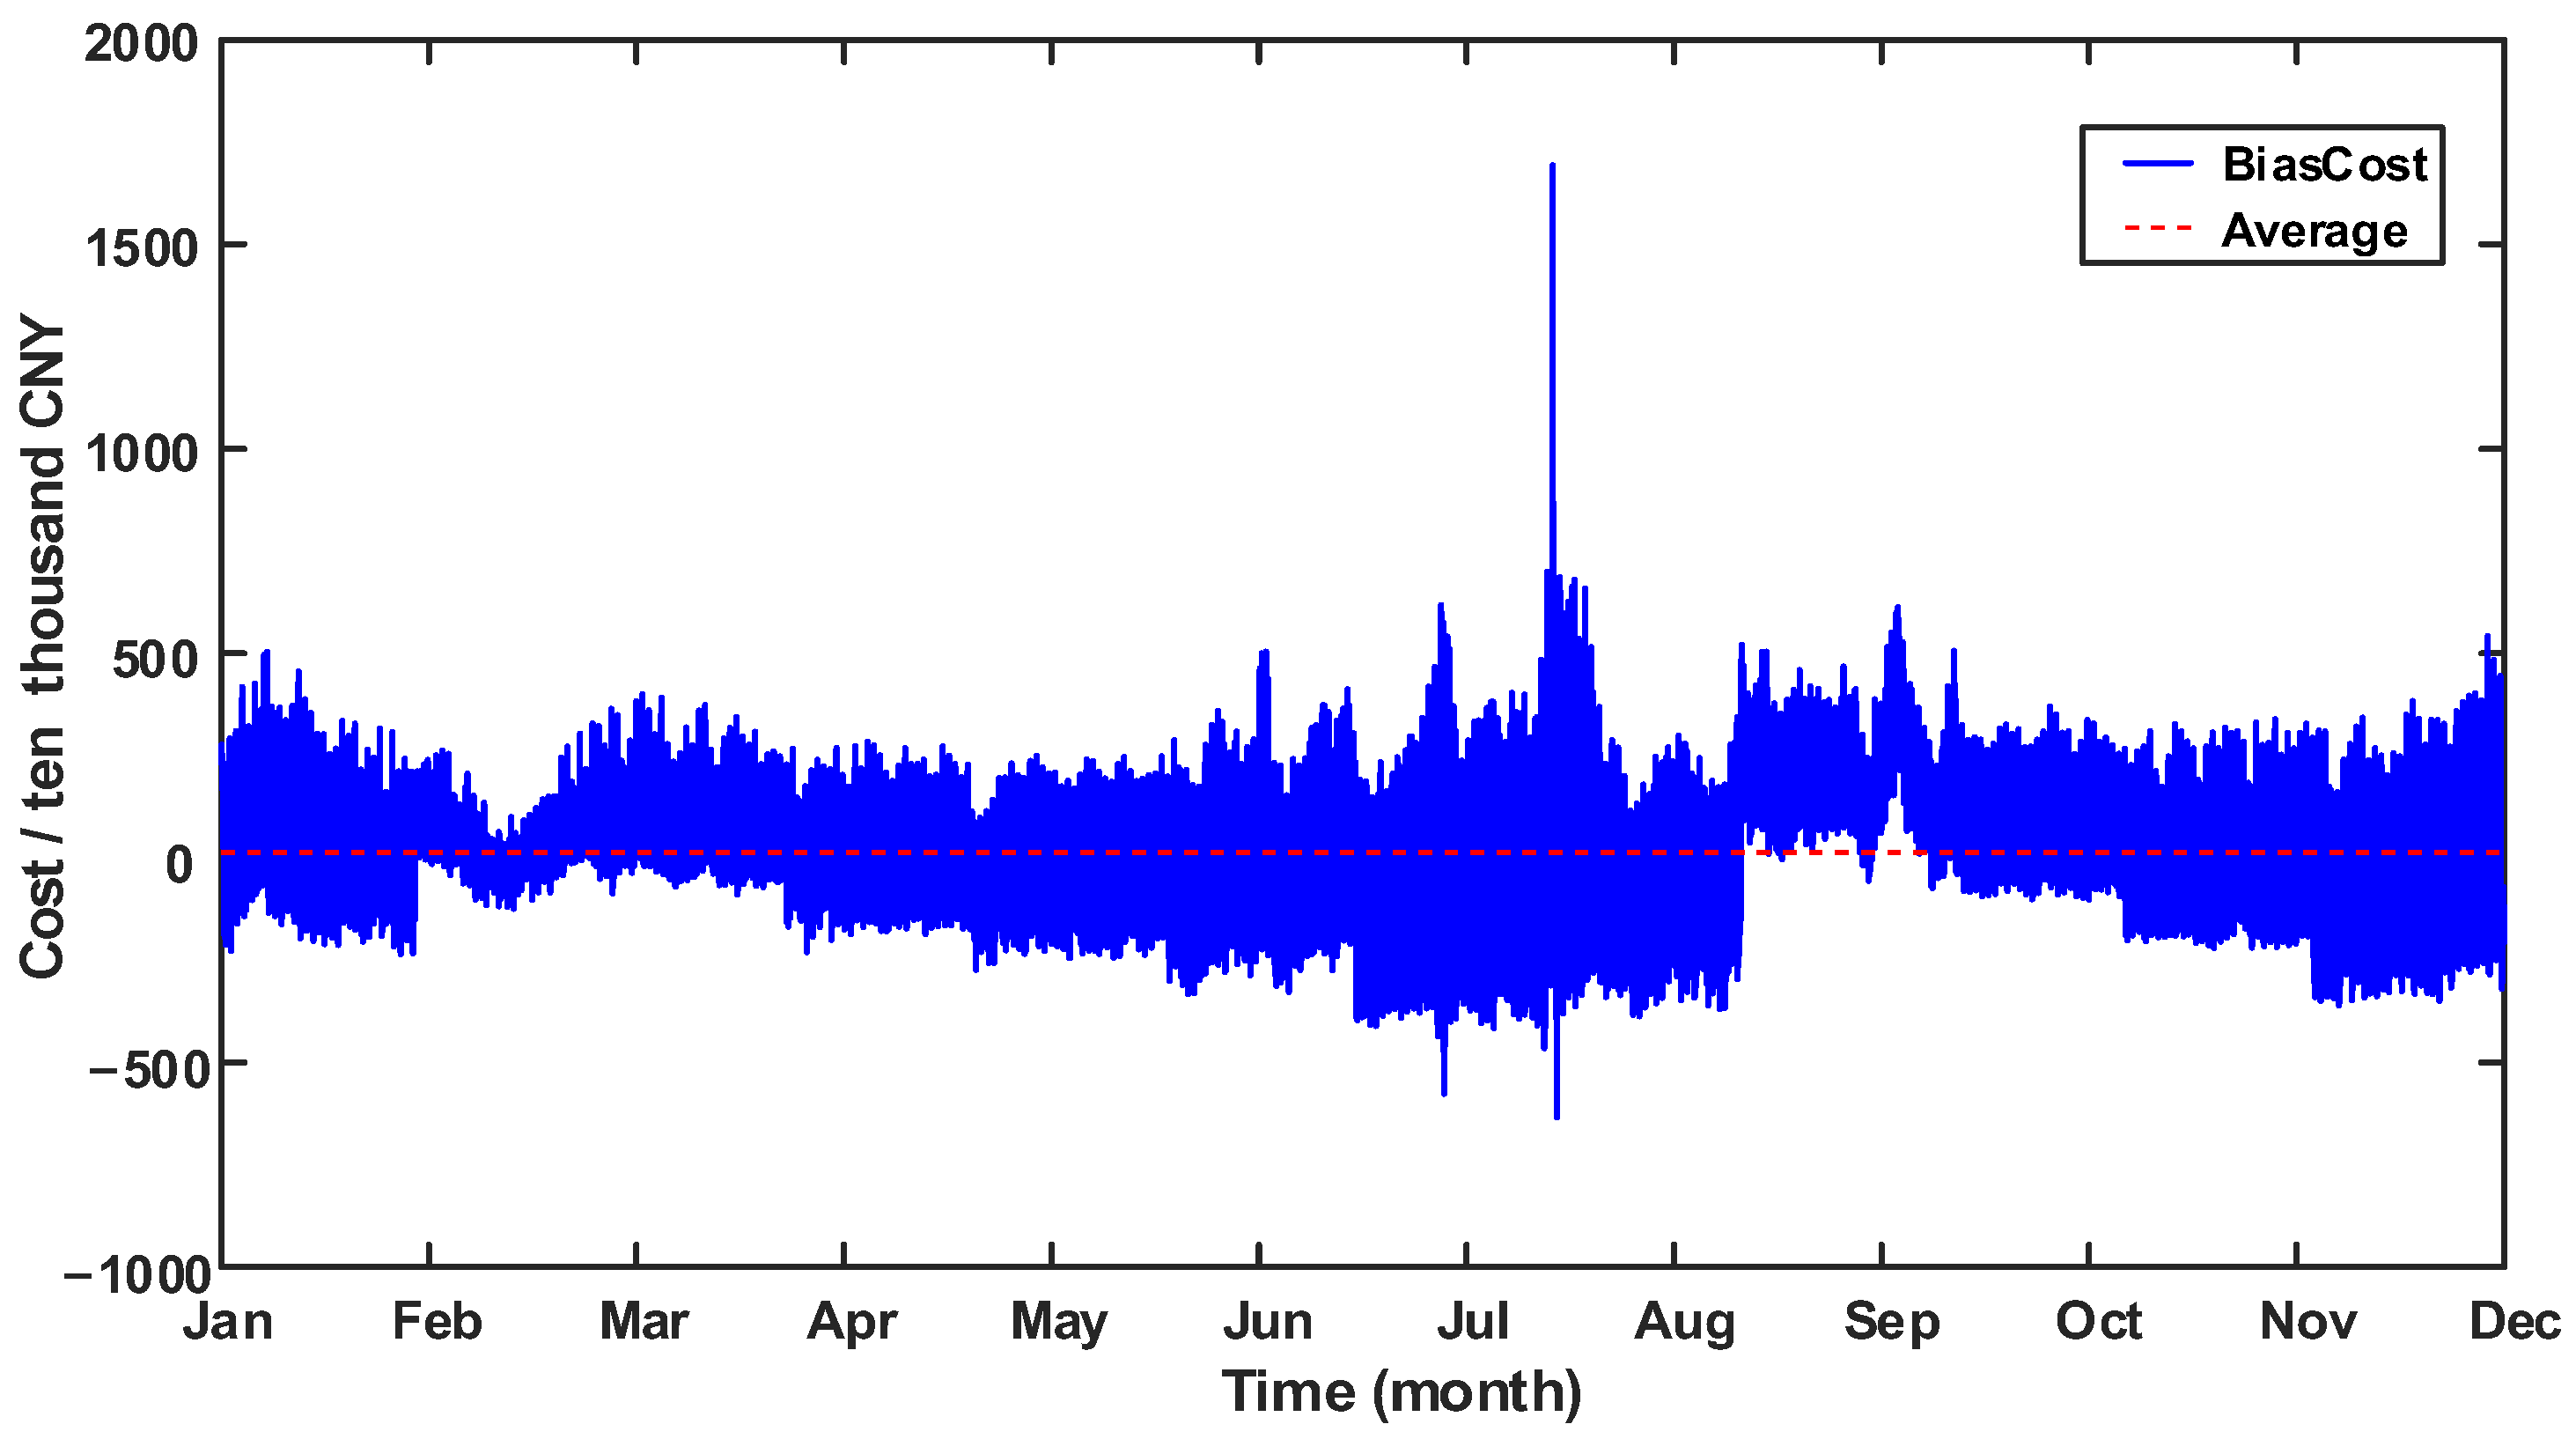
Deviation costs are influenced by the calculation and settlement period, DE, deviation price, and deviation direction. The proposed method for measuring deviation responsibility, based on time-sharing transaction prices, features a shorter calculation cycle, facilitating a detailed demonstration of the deviation responsibility borne by the BRP. The developed time-sharing trading price model offers price guidance for BRPs to settle DE and for BSPs to settle balancing services. The lower annual average price and wider price change range reflect supply and demand relationships and power supply costs in different time periods while ensuring overall price stability.
(4)
Sensitivity analysis results indicate that the quantity of contracted power and the way it is broken down affect the deviation cost by influencing the amount of DE. The system’s fixed capacity cost impacts deviation costs by affecting deviation prices. It is evident that the absolute values of the DE, deviation price, and deviation cost are positively correlated, while the direction of DE determines whether the deviation cost is positive or negative.
The research results validate the proposed method’s rationality, which holds significant importance for policymakers and stakeholders under the EDS mechanism in the forward electricity market. Based on these results, the following policy recommendations are proposed to enhance the EDS mechanism in China’s forward market: (1) It is recommended to reduce the reliance on the artificial appraisal system for DE and trade DE through CFDs. This approach helps avoid unequal deviation responsibility due to inconsistent settlement prices and ensures that market trading prices more accurately reflect the economic nature of deviation responsibility. (2) It is recommended to refine the settlement cycle for DE by adopting an hourly calculation cycle and a monthly settlement cycle, aligning better with future real-time trading in the spot market. (3) Before the spot market is launched, it is suggested to establish a pricing model that considers supply costs and the supply–demand relationship. The government should enhance data collection and analyses on generation output, generation costs, and DE, and design an effective and dynamic pricing mechanism to guide relevant decision-makers and stakeholders.
In this article, we explore the economic accountability of DE and its assessment methods, but we believe that this study still has some limitations. Firstly, some DE does not result from the default behavior of market players but rather from objective factors like weather and technology. We did not classify deviation power types. Secondly, this paper concentrates on measuring the deviation responsibility value and did not delve into subsequent optimization strategies for deviation costs. Lastly, the simulation data utilized in this paper have limitations, and the proposed methodology is also applicable within the special EDS mechanism, which may lack global generalization. In subsequent studies, we will analyze the deviation power and deviation cost incurred by new energy entities participating in the market. Additionally, we will devise a cost optimization strategy considering their interests and market stability.

Author Contributions

Conceptualization, Z.Y. and D.L.; methodology, S.H.; software, M.W.; validation, Z.Y. and M.W.; formal analysis, M.W.; investigation, D.L.; resources, S.H.; data curation, O.L.; writing—original draft preparation, M.W.; writing—review and editing, Z.Y. and D.L.; visualization, M.W.; supervision, D.L.; project administration, D.L.; funding acquisition, Z.Y. All authors have read and agreed to the published version of the manuscript.

Funding

This research was funded by The Project of Research on the Calculation and Apportionment Method of Operating Costs of Hubei Electricity Spot Market, grant number SGDLJYJSJS2200029.

Institutional Review Board Statement

Not applicable.

Informed Consent Statement

Not applicable.

Data Availability Statement

The data can be requested from the corresponding author upon reasonable request.

Conflicts of Interest

The authors declare no conflicts of interest.

Appendix A

  • Hydropower output model
P H , i = g φ ε i μ i
where P H , i represents the output power of the hydropower unit at moment i; g denotes the acceleration of gravity; φ denotes the power generation efficiency of the hydropower unit; ε i denotes the net head of power generation at moment i, which is generally a constant; and μ i denotes the flow rate of water at moment i.
Hydropower output is seasonal and limited by reservoir capacity. Hydropower output constraints are
P H min P H , i P H max
where P H min denotes the minimum output of the hydropower unit; and P H max denotes the maximum output of the hydropower unit.
2.
Wind power output model
Wind power output is mainly affected by wind speed.
P W , i = 0 0 γ i γ ci   or γ γ cu P r γ i γ ci γ r γ ci γ ci γ i γ r P r γ r γ i γ cu
where P W , i denotes the output power of the wind power at moment i; γ i denotes the wind speed at moment i; γ r , γ ci , and γ cu denote the rated wind speed, the cut-in wind speed, and the cut-out wind speed; and P r denotes the rated power of the wind power.
The wind speed is generally represented by a Weibull distribution for its distribution probability as follows:
γ i = l ( ln β ) 1 / k
l = E W Γ 1 + 1 / k
k = σ W E W 1.086
where l denotes the scale parameter; β denotes a random number obeying a uniform distribution on 0~1; k denotes the shape parameter; E W denotes the mean value of the wind speed; σ W denotes the standard deviation of the wind speed; and Γ ( ) denotes the gamma function.
3.
PV output model
P Pv , i = χ Pv ω Pv S Pv
where P Pv , i denotes the predicted output of PV at moment i; χ Pv denotes the rated photovoltaic conversion efficiency; ω Pv denotes the radiation intensity of the irradiated PV module; and S Pv denotes the total area of the PV module.
The radiation intensity obeys Beta distribution and its probability density function is as follows:
f ( ω Pv , i ) = Γ ( a + b ) ω max Γ ( a ) Γ ( b ) ω Pv , i ω max a 1 1 ω Pv , i ω max b 1
where ω max denotes the maximum value of the radiation intensity of the PV module; and a and b denote the shape parameters of the Beta distribution.

References

  1. Ye, Z. The “Chinese Characteristics” of Electricity Markets. China Power Enterp. Manag. 2021, 1, 35–40. [Google Scholar]
  2. Qian, C.; Yun, Y.; Jing, Z. Discussion on the Target and Structure of Electricity Market and the Key Issues in the Construction of China’s Electricity Market. J. Glob. Energy Interconnect. 2020, 3, 508–517. [Google Scholar]
  3. Xu, C.; Zhang, L.; Chen, D.; Tang, C. A Monthly Balancing Mechanism Based on Pre-bidding and Its Multi-period Generation Schedule Optimization Model. Proc. CSEE 2019, 39, 5085–5094. [Google Scholar]
  4. Wang, Y.; Zhang, B.; Sun, H.; Shang, J.; Huang, Y. An Introduction to Foreign Balancing Market Mechanism and Suggestions on Constructing Real-Time Balancing Market in China. Power Syst. Technol. 2003, 27, 10–13. [Google Scholar]
  5. Zhou, M.; Yan, Y.; Ding, Q.; Wu, Z.; He, Y.; Long, S. Transaction and Settlement Mechanism for Foreign Representative Power Markets and Its Enlightenment for Chinese Power Market. Autom. Electr. Power Syst. 2017, 41, 1–8. [Google Scholar]
  6. He, Y.; Zhou, M.; Wu, Z.; Long, S.; Xun, J. Study on Operation Mechanism of Foreign Representative Balancing Markets and Its Enlightenment for China. Power Syst. Technol. 2018, 42, 3520–3528. [Google Scholar]
  7. Chen, Z.; Lin, Z.; He, C.; Qian, H.; Zhang, Z.; Lin, Z.; Wen, F. An assessment mechanism for contract energy deviation in a medium and long-term electricity market. J. Electr. Power Sci. Technol. 2020, 35, 31–39. [Google Scholar]
  8. Wang, D.; Ding, W.; Gao, F.; Xu, Y.; Miao, Q. A Method to Deal With Inter-Regional and Inter-Provincial Transaction Settlement Deviation Quantity Based on Kernel Density–Entropy Weight. Front. Energy Res 2021, 9, 667163. [Google Scholar] [CrossRef]
  9. Zhu, D.; Ma, R.; Xia, X.; Zhang, S.; Liu, J. Construction of Real-Time Deviation Electric Quantity Control Model for Regional Electricity Spot Market. Meas. Control 2022, 55, 595–602. [Google Scholar] [CrossRef]
  10. Gupta, M.; Gupta, S.; Thakur, T. Implementation of New Electricity Regulatory Norms for Deviation Settlement Mechanism: A Case Study of India. Cogent Eng. 2019, 6, 1623152. [Google Scholar] [CrossRef]
  11. Turker, B.; Arroyo Klein, S.; Komsiyska, L.; Trujillo, J.J.; Von Bremen, L.; Kühn, M.; Busse, M. Utilizing a Vanadium Redox Flow Battery to Avoid Wind Power Deviation Penalties in an Electricity Market. Energy Convers. Manag. 2013, 76, 1150–1157. [Google Scholar] [CrossRef]
  12. Miao, S.; Luo, B.; Shen, J.; Cheng, C.; Li, G.; Sun, Y. Short-Term Multi-Objective Hydro-Thermal Generation Dispatch Considering Electricity Market Transition and Mid-and Long-Term Contract Decomposition. Power Syst. Technol. 2018, 42, 2221–2231. [Google Scholar]
  13. Song, S.; Guo, H.; Yang, P.; Xu, Z.; He, T.; Lu, Z. Research on Demand Response Strategy of the Electricity Deviation Assessment. J. Eng. 2017, 2017, 2221–2225. [Google Scholar] [CrossRef]
  14. Wang, X.; Zhang, K.; Zhang, S.; Wu, L. Equilibrium Analysis of Electricity Market With Demand Response Exchange to Counterbalance Bid Deviations of Renewable Generators. IEEE Syst. J. 2020, 14, 2713–2724. [Google Scholar] [CrossRef]
  15. Fabbri, A.; GomezSanRoman, T.; RivierAbbad, J.; MendezQuezada, V.H. Assessment of the Cost Associated With Wind Generation Pre-diction Errors in a Liberalized Electricity Market. IEEE Trans. Power Syst. 2005, 20, 1440–1446. [Google Scholar] [CrossRef]
  16. Yang, J.; Dong, Z.Y.; Wen, F.; Chen, Q.; Luo, F.; Liu, W.; Zhan, J. A Penalty Scheme for Mitigating Uninstructed Deviation of Generation Outputs from Variable Renewables in a Distribution Market. IEEE Trans. Smart Grid 2020, 11, 4056–4069. [Google Scholar] [CrossRef]
  17. Koul, B.; Singh, K.; Brar, Y.S. Improvements in Deviation Settlement Mechanism of Indian Electricity Grid System through Demand Response Management. Int. J. Emerg. Electr. Power Syst. 2022, 23, 605–620. [Google Scholar] [CrossRef]
  18. Van Der Veen, R.A.; Abbasy, A.; Hakvoort, R.A. Agent-Based Analysis of the Impact of the Imbalance Pricing Mechanism on Market Behavior in Electricity Balancing Markets. Energy Econ. 2012, 34, 874–881. [Google Scholar] [CrossRef]
  19. Wu, Z.; Zhou, M.; Zhang, T.; Li, G.; Zhang, Y.; Liu, X. Imbalance Settlement Evaluation for China’s Balancing Market Design via an Agent-Based Model with a Multiple Criteria Decision Analysis Method. Energy Policy 2020, 139, 111297. [Google Scholar] [CrossRef]
  20. Zani, A.; Rossi, S. Nodal Pricing Applied to Imbalance Settlement: Issues for Implementation in Zonal Markets. In Proceedings of the 2018 15th International Conference on the European Energy Market (EEM), Lodz, Poland, 27–29 June 2018; pp. 1–5. [Google Scholar]
  21. Zhang, Z.; Jiang, Y.; Lin, Z.; Wen, F.; Ding, Y.; Yang, L.; Lin, Z.; Li, Y.; Qian, H.; Li, J.; et al. Optimal Alliance Strategies Among Retailers Under Energy Deviation Settlement Mechanism in China’s Forward Electricity Market. IEEE Trans. Power Syst. 2020, 35, 2059–2071. [Google Scholar] [CrossRef]
  22. Lu, Z.; Wang, J.; Yong, W.; Tang, Z.; Yang, M.; Zhang, B. Coordinated P2P Electricity Trading Model with Aggregated Alliance and Reserve Purchasing for Hedging the Risk of Deviation Penalty. Energy Rep. 2021, 7, 426–435. [Google Scholar] [CrossRef]
  23. Liu, F.; Xu, Y.; Zhu, D.-D.; Wei, S.-M.; Tang, C.-P. Equilibrium Risk Decision Model for Bidding Electricity Quantity Deviation of Cascade Hydropower Stations. J. Electr. Eng. Technol 2024, 19, 977–991. [Google Scholar] [CrossRef]
  24. Li, L.; Dou, X.; Yang, H.; Fu, Y.; Yu, J.; Huo, X.; Pang, C. Dynamic Aggregation Method for Load Aggregators Considering Users’ Deviation Electricity. Electronics 2024, 13, 278. [Google Scholar] [CrossRef]
  25. Huang, M.; Wang, X.; Zhang, S. Analysis of an Electricity Market Equilibrium Model with Penalties for Wind Power’s Bidding Deviation. In Proceedings of the 2015 5th International Conference on Electric Utility Deregulation and Restructuring and Power Technologies (DRPT), Changsha, China, 26–29 November 2015; pp. 35–40. [Google Scholar]
  26. Momoh, J.A. Electric Power System Applications of Optimization, 2nd ed.; CRC Press: Boca Raton, FL, USA, 2017; ISBN 978-1-315-21895-3. [Google Scholar]
  27. Biggar, D.R.; Hesamzadeh, M.R. The Economics of Electricity Markets; John Wiley & Sons: Hoboken, NJ, USA, 2014; ISBN 978-1-118-77572-1. [Google Scholar]
  28. Kreps, D.M. Game Theory and Economic Modelling; Oxford University Press: Oxford, UK, 1990; ISBN 978-0-19-828381-2. [Google Scholar]
  29. Rau, N.S. Optimization Principles: Practical Applications to the Operation and Markets of the Electric Power Industry; John Wiley & Sons: Hoboken, NJ, USA, 2003; ISBN 978-0-471-45130-3. [Google Scholar]
  30. Zhang, L.; Xu, C.; Chen, C.; Yang, S. Research on Decoupling and Settlement Mechanism of Electric Energy Market in Electricity Spot Market Environment. Price Theory Pract. 2020, 30–36. [Google Scholar] [CrossRef]
  31. Wu, Z.; Zhou, M.; Kou, Y.; Sun, P.; Wang, X.; Li, G. Imbalance Capital Allocation Mechanism Based on Agent-based Model. Power Syst. Technol. 2021, 45, 3408–3416. [Google Scholar]
  32. Chen, X.; Liu, J.; Song, Y.; Wang, P.; Su, S. Use of CFDS and FTRS to Hedge Against Risks of Power Market. Proc. CSEE 2005, 75–81. Available online: https://kns.cnki.net/kcms2/article/abstract?v=bnAgTRNiloI5N-pKpKlFzkydwMiccsgwf4iobybEf1Hn_BlnjVDG09xD7hJmGGqm2a1u63Ubl3rGJlOvJWDQuX8e_dqjIKga1AXOTl5EIhG6BMe4ZOqHteDYPxxUHHQM&uniplatform=NZKPT&language=CHS (accessed on 10 June 2024).
  33. Kristiansen, T. Pricing of Contracts for Difference in the Nordic Market. Energy Policy 2004, 32, 1075–1085. [Google Scholar] [CrossRef]
  34. Luo, Z.; Ji, T.; Jing, Z.; He, A. Design and Application of Contract for Difference in Electricity Market. Power Syst. Technol. 2019, 43, 2743–2751. [Google Scholar]
  35. Ye, Z.; Li, M. Analysis on Generation Companies’ Trading Strategy for Medium and Long-term Electricity Contracts Based on CfD. Electr. Power Technol. Econ. 2008, 24–27. Available online: https://kns.cnki.net/kcms2/article/abstract?v=bnAgTRNiloIVUja-jlufBQCG3AnrysuOKZl8UoBEzu6fxp0rFppG9ZSjK7nESsaIFmC6R2Iy7arM84nubYrRp_v64kyrK7nE-Iu7mlhkJ66TiGrNSt4LMAYZqVG91yKLFW7HS1xhuTMGM7LiSebDnQ==&uniplatform=NZKPT&language=CHS (accessed on 10 June 2024).
  36. Ye, Z. The principle of marginal cost pricing and its application in the formulation or formation of electricity price. China Power Enterp. Manag. 2020, 33–37. Available online: https://kns.cnki.net/kcms2/article/abstract?v=bnAgTRNiloLwzHO6OImjNYs-HfV4Zv_X0skLNbLjoKZEXU6YbT1iMjy-uMPhZWbCK685_HkuupLZDQdQZZs9YUGv1otd06CsGuV2bYvo1K40hkLERifUEIfwQ58LtN4mlJwnIXRQcEk=&uniplatform=NZKPT&language=CHS (accessed on 10 June 2024).
  37. Huang, S.; Ye, Z.; Luo, M.; Chen, L.; Wei, W.; Yao, J. Time-Sharing Trading Price Formation Mechanism and Model of China’s Mid to Long-Term Electricity Market. Electr. Power 2023, 56, 17–27. [Google Scholar]
  38. Jia, X.; Xia, Q.; Chen, Q.; Ding, M.; Ning, B. Electricity Pricing Mechanism Based on Effective Capacity Cost of Power Generation. Autom. Electr. Power Syst. 2013, 37, 6–13. [Google Scholar]
Figure 1. Schematic of research framework.
Sustainability 16 05130 g001
Figure 2. EDS mechanism in China’s forward electricity market.
Sustainability 16 05130 g002
Figure 3. Inconsistency of balancing responsibilities between SO and BRP.
Sustainability 16 05130 g003
Figure 4. The basic principles of CFDs.
Sustainability 16 05130 g004
Figure 5. (a) Sequential Load Curve; (b) continuous Load Curve; (c) capacity cost components and apportionment.
Sustainability 16 05130 g005
Figure 6. Flowchart of time-sharing deviation cost.
Sustainability 16 05130 g006
Figure 7. Contract monthly reference curve in Province H.
Sustainability 16 05130 g007
Figure 8. (a) Forward Contract Decomposition Curve in Province H; (b) actual load curve in Province H.
Sustainability 16 05130 g008aSustainability 16 05130 g008b
Figure 9. Time-sharing deviation electricity in Province H.
Sustainability 16 05130 g009
Figure 10. Time-sharing trading prices of 8760 h in Province H.
Sustainability 16 05130 g010
Figure 11. Time-sharing trading prices for each month in Province H.
Sustainability 16 05130 g011
Figure 12. Time-sharing deviation cost of 8760h in Province H.
Sustainability 16 05130 g012
Figure 13. Comparison of monthly deviation costs for three scenarios.
Sustainability 16 05130 g013
Figure 14. Impact of contracted power on deviation costs.
Sustainability 16 05130 g014
Figure 15. Impact of contract decomposition methods on deviation costs.
Sustainability 16 05130 g015
Figure 16. Impact of capacity costs on deviation costs.
Sustainability 16 05130 g016
Table 1. Summary of deviation settlement among countries.
Country or RegionMarket ModelTreatment1 Energy Consumption/EJ1 Energy Generation/TWH
AustraliaCentralized wholesale marketa. No deviation electricity settlement
b. All actual electricity is accepted for settlement at real-time market prices
5.98273.6
American PJMa. Spot market dual settlement system
b. Hedging of spot price risk through CFDs and future financial transactions
7.314547.7
UKDecentralized electricity marketa. Forward trading contracts for physical delivery
b. Real-time power balancing is guaranteed through the BM
1.36326
Northern Europea. Establishment of co-regulated markets
b. Adoption of a pre-listed balancing mechanism
1.9 (Norway)146.8 (Norway)
1 Source derived from BP Statistical Review of World Energy 2023.
Table 2. Overview of deviation settlement in Selected Chinese Provinces.
ProvinceExemption MarginPenalty Price 1
ExceedLess
Shandong−2~6%5% of the contractual weighted average electricity purchase priceReduction in the power compensation tariff
Guangdong−5~5%2× absolute monthly market clearing spreads
Sichuan−2~2%Hydroelectricity trading tariff cap70% of hydroelectricity trading tariff cap
Hubei−5~5%Assessed at 0.05 CNY/KWH
1 Source derived from fundamental regulations governing medium- and long-term electricity trading in individual provinces.
Table 3. Overview of typical supply and demand scenarios and associated pricing methods.
ScenariosSupply–Demand RelationshipPricing MethodsConcrete Operation
1Basic balanceSystem average cost pricingTime-sharing capacity costs overlaid on time-sharing variable costs
2Supply less than demandUser off-load value pricing clearing spreadsGeneral use of KWH GDP value added
3Supply exceeds demandSystem marginal cost pricingRecovery of time-sharing variable costs only
4Extreme oversupplyLost generation value pricingGenerally use unit start or stop costs
Table 4. Monthly time-sharing trading prices Summary in Province H.
MonthJanFebMarAprMayJunJulAugSepOctNovDec
monthly average0.22000.12440.17210.15920.16160.22870.30460.33530.23440.17950.18050.2203
monthly maximum0.78180.26540.26630.24670.25530.68482.34477.00850.49180.37620.26950.5570
monthly minimum0.0921−0.08690.04340.0450−0.00390.06490.07640.06240.00000.05190.06530.0883
Table 5. Calculation results for different scenarios.
Scenarios123
Total contracted electricity/GW230,000
Total actual electricity/GW233,500
Total deviation electricity/GW3500
Deviation assessment costs/CNY million3009.5459.521247.24
DE base/GW12,12822,66367,516
BSP balance service fee/CNY million459.52459.52459.52
Additional costs borne by SO/CNY million2550.0200
Average deviation cost/CNY/KWH0.24810.02030.0185
Disclaimer/Publisher’s Note: The statements, opinions and data contained in all publications are solely those of the individual author(s) and contributor(s) and not of MDPI and/or the editor(s). MDPI and/or the editor(s) disclaim responsibility for any injury to people or property resulting from any ideas, methods, instructions or products referred to in the content.

