Tracking Happiness in Times of COVID-19: A Bibliometric Exploration


Abstract
1. Introduction
2. Materials and Methods
2.1. Dataset Extraction
- ▪
- Science Citation Index Expanded (SCIE)—1900–present.
- ▪
- Social Sciences Citation Index (SSCI) 1975–present;
- ▪
- Arts & Humanities Citation Index (A&HCI)—1975–present.
- ▪
- Conference Proceedings Citation Index—Social Sciences and Humanities (CPCI-SSH)—1990–present.
- ▪
- Conference Proceedings Citation Index—Science (CPCI-S)—1990–present.
- ▪
- Emerging Sources Citation Index (ESCI) 2005–present.
- ▪
- Book Citation Index—Science (BKCI-S)—2010–present.
- ▪
- Current Chemical Reactions (CCR-Expanded)—2010–present.
- ▪
- Book Citation Index—Social Sciences and Humanities (BKCI-SSH)—2010–present.
- ▪
- Index Chemicus (IC)—2010–present.
2.2. Bibliometric Analysis
3. Dataset Analysis
3.1. Dataset Overview
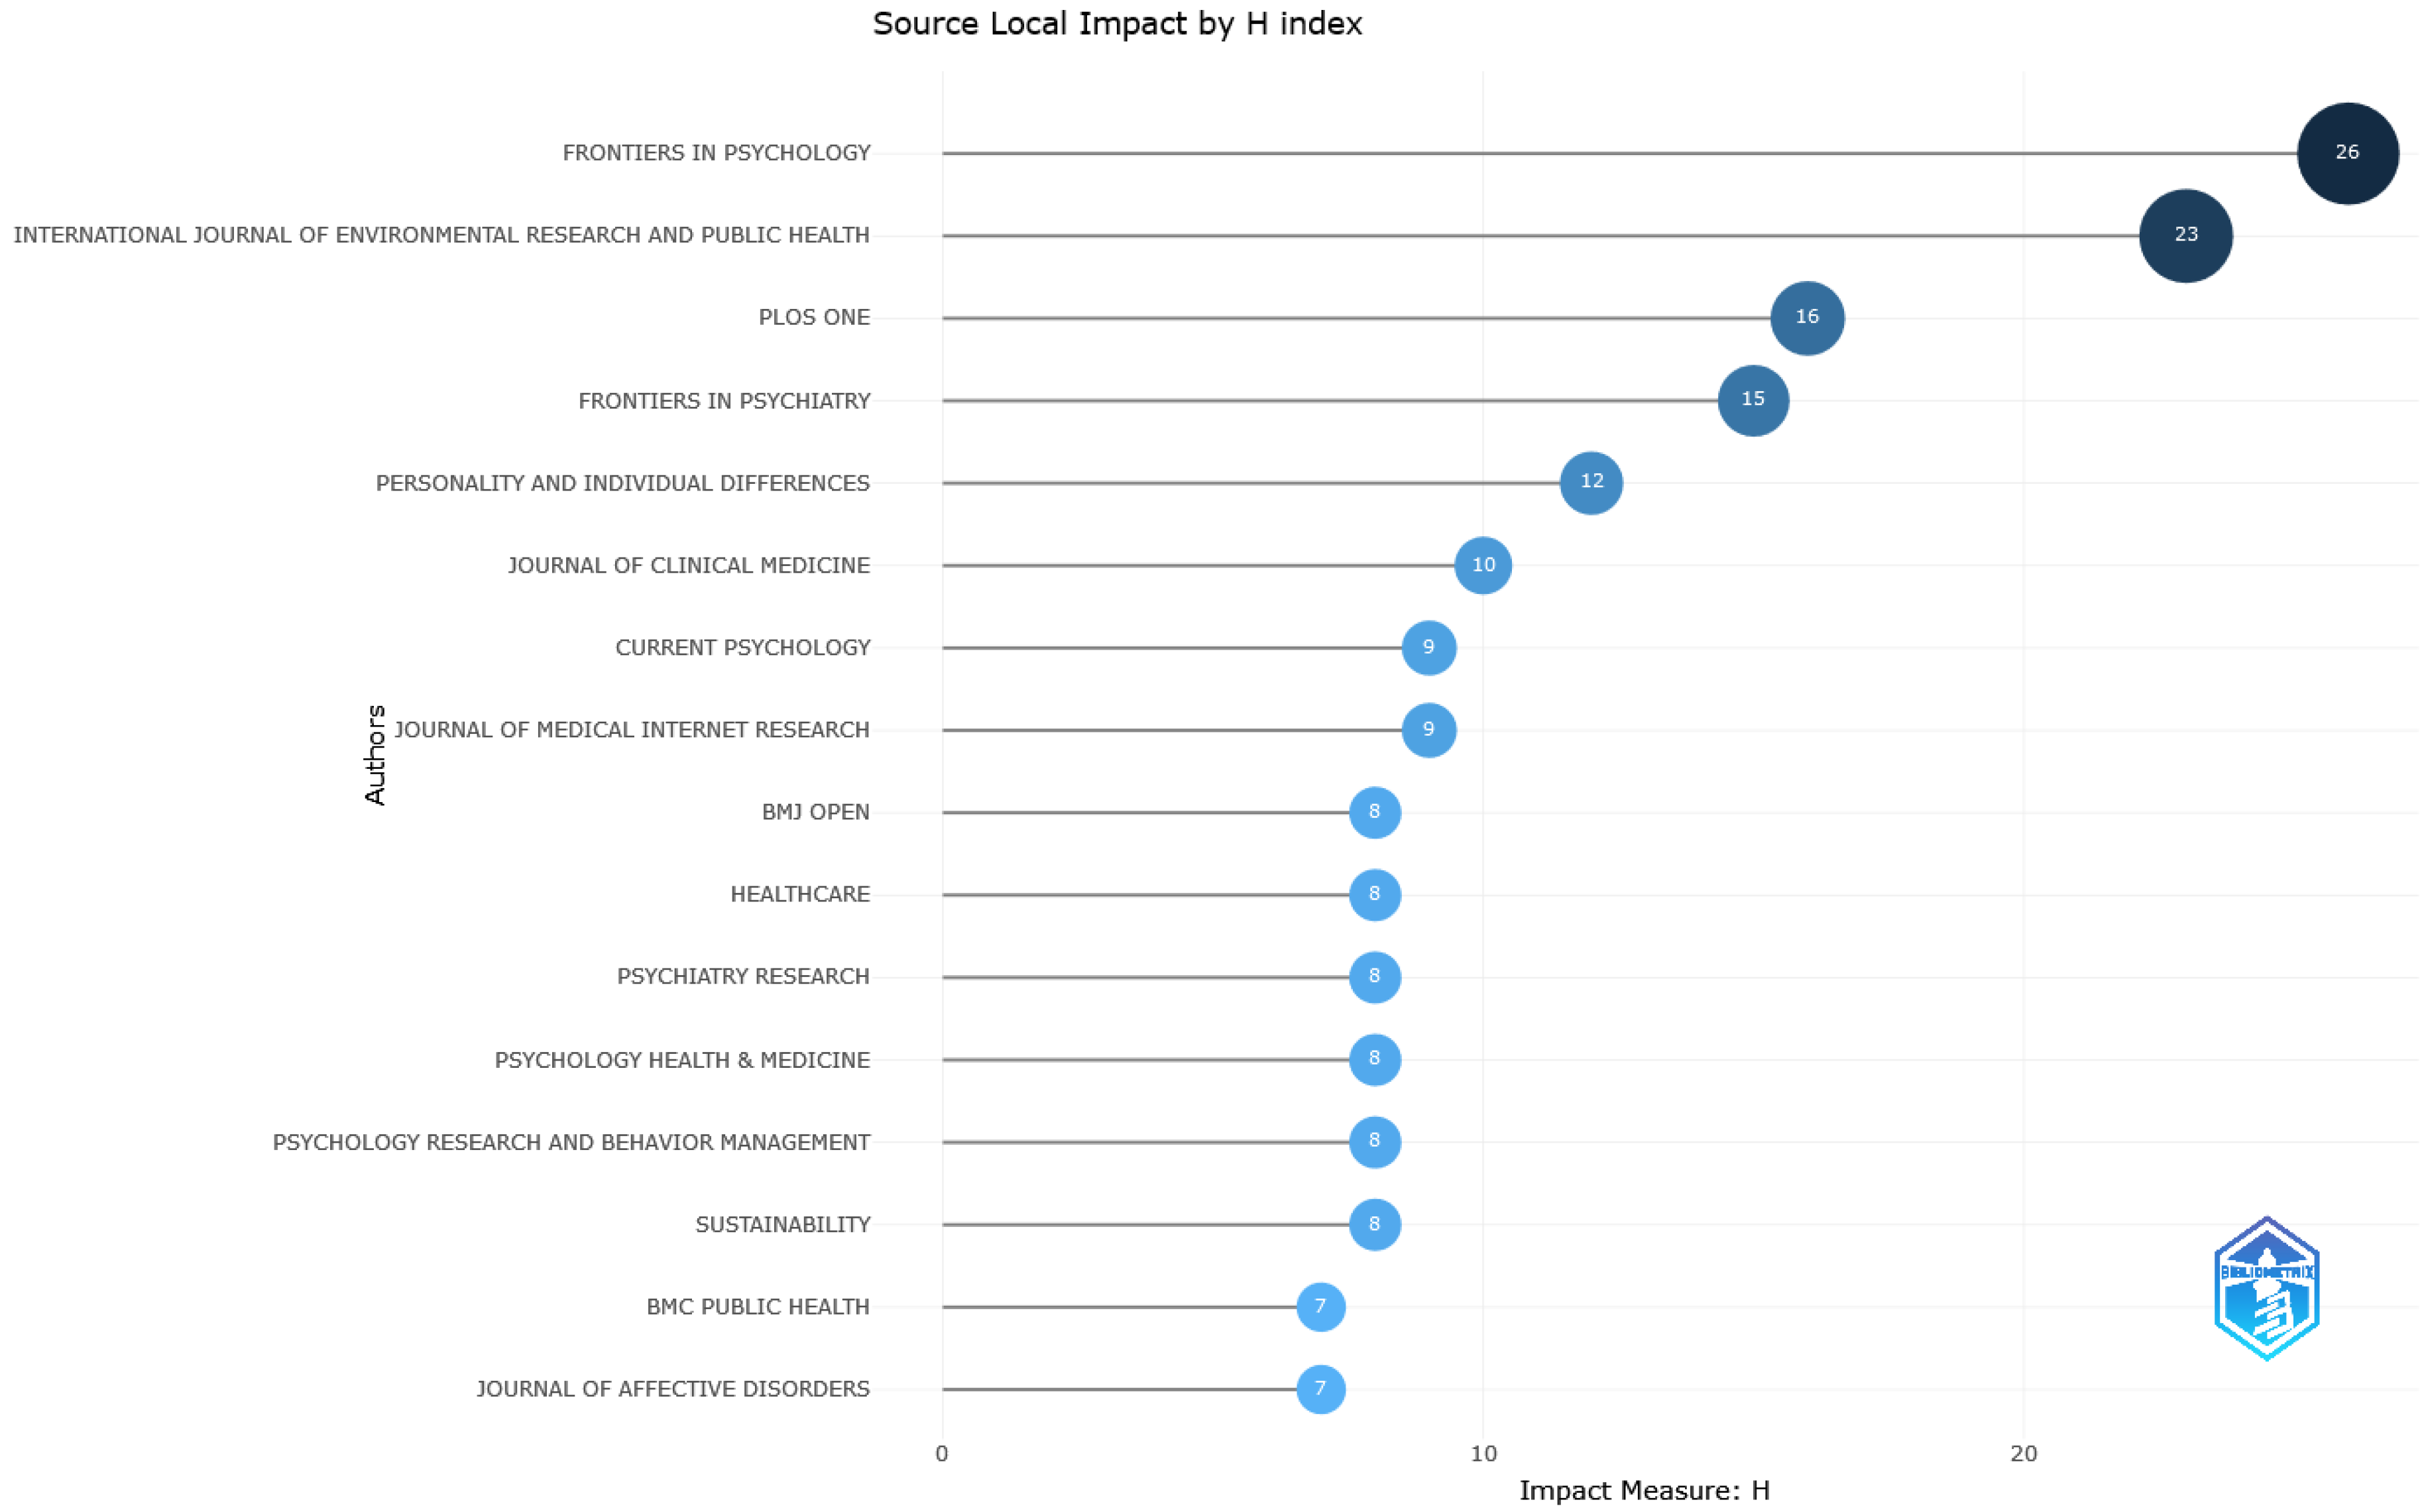
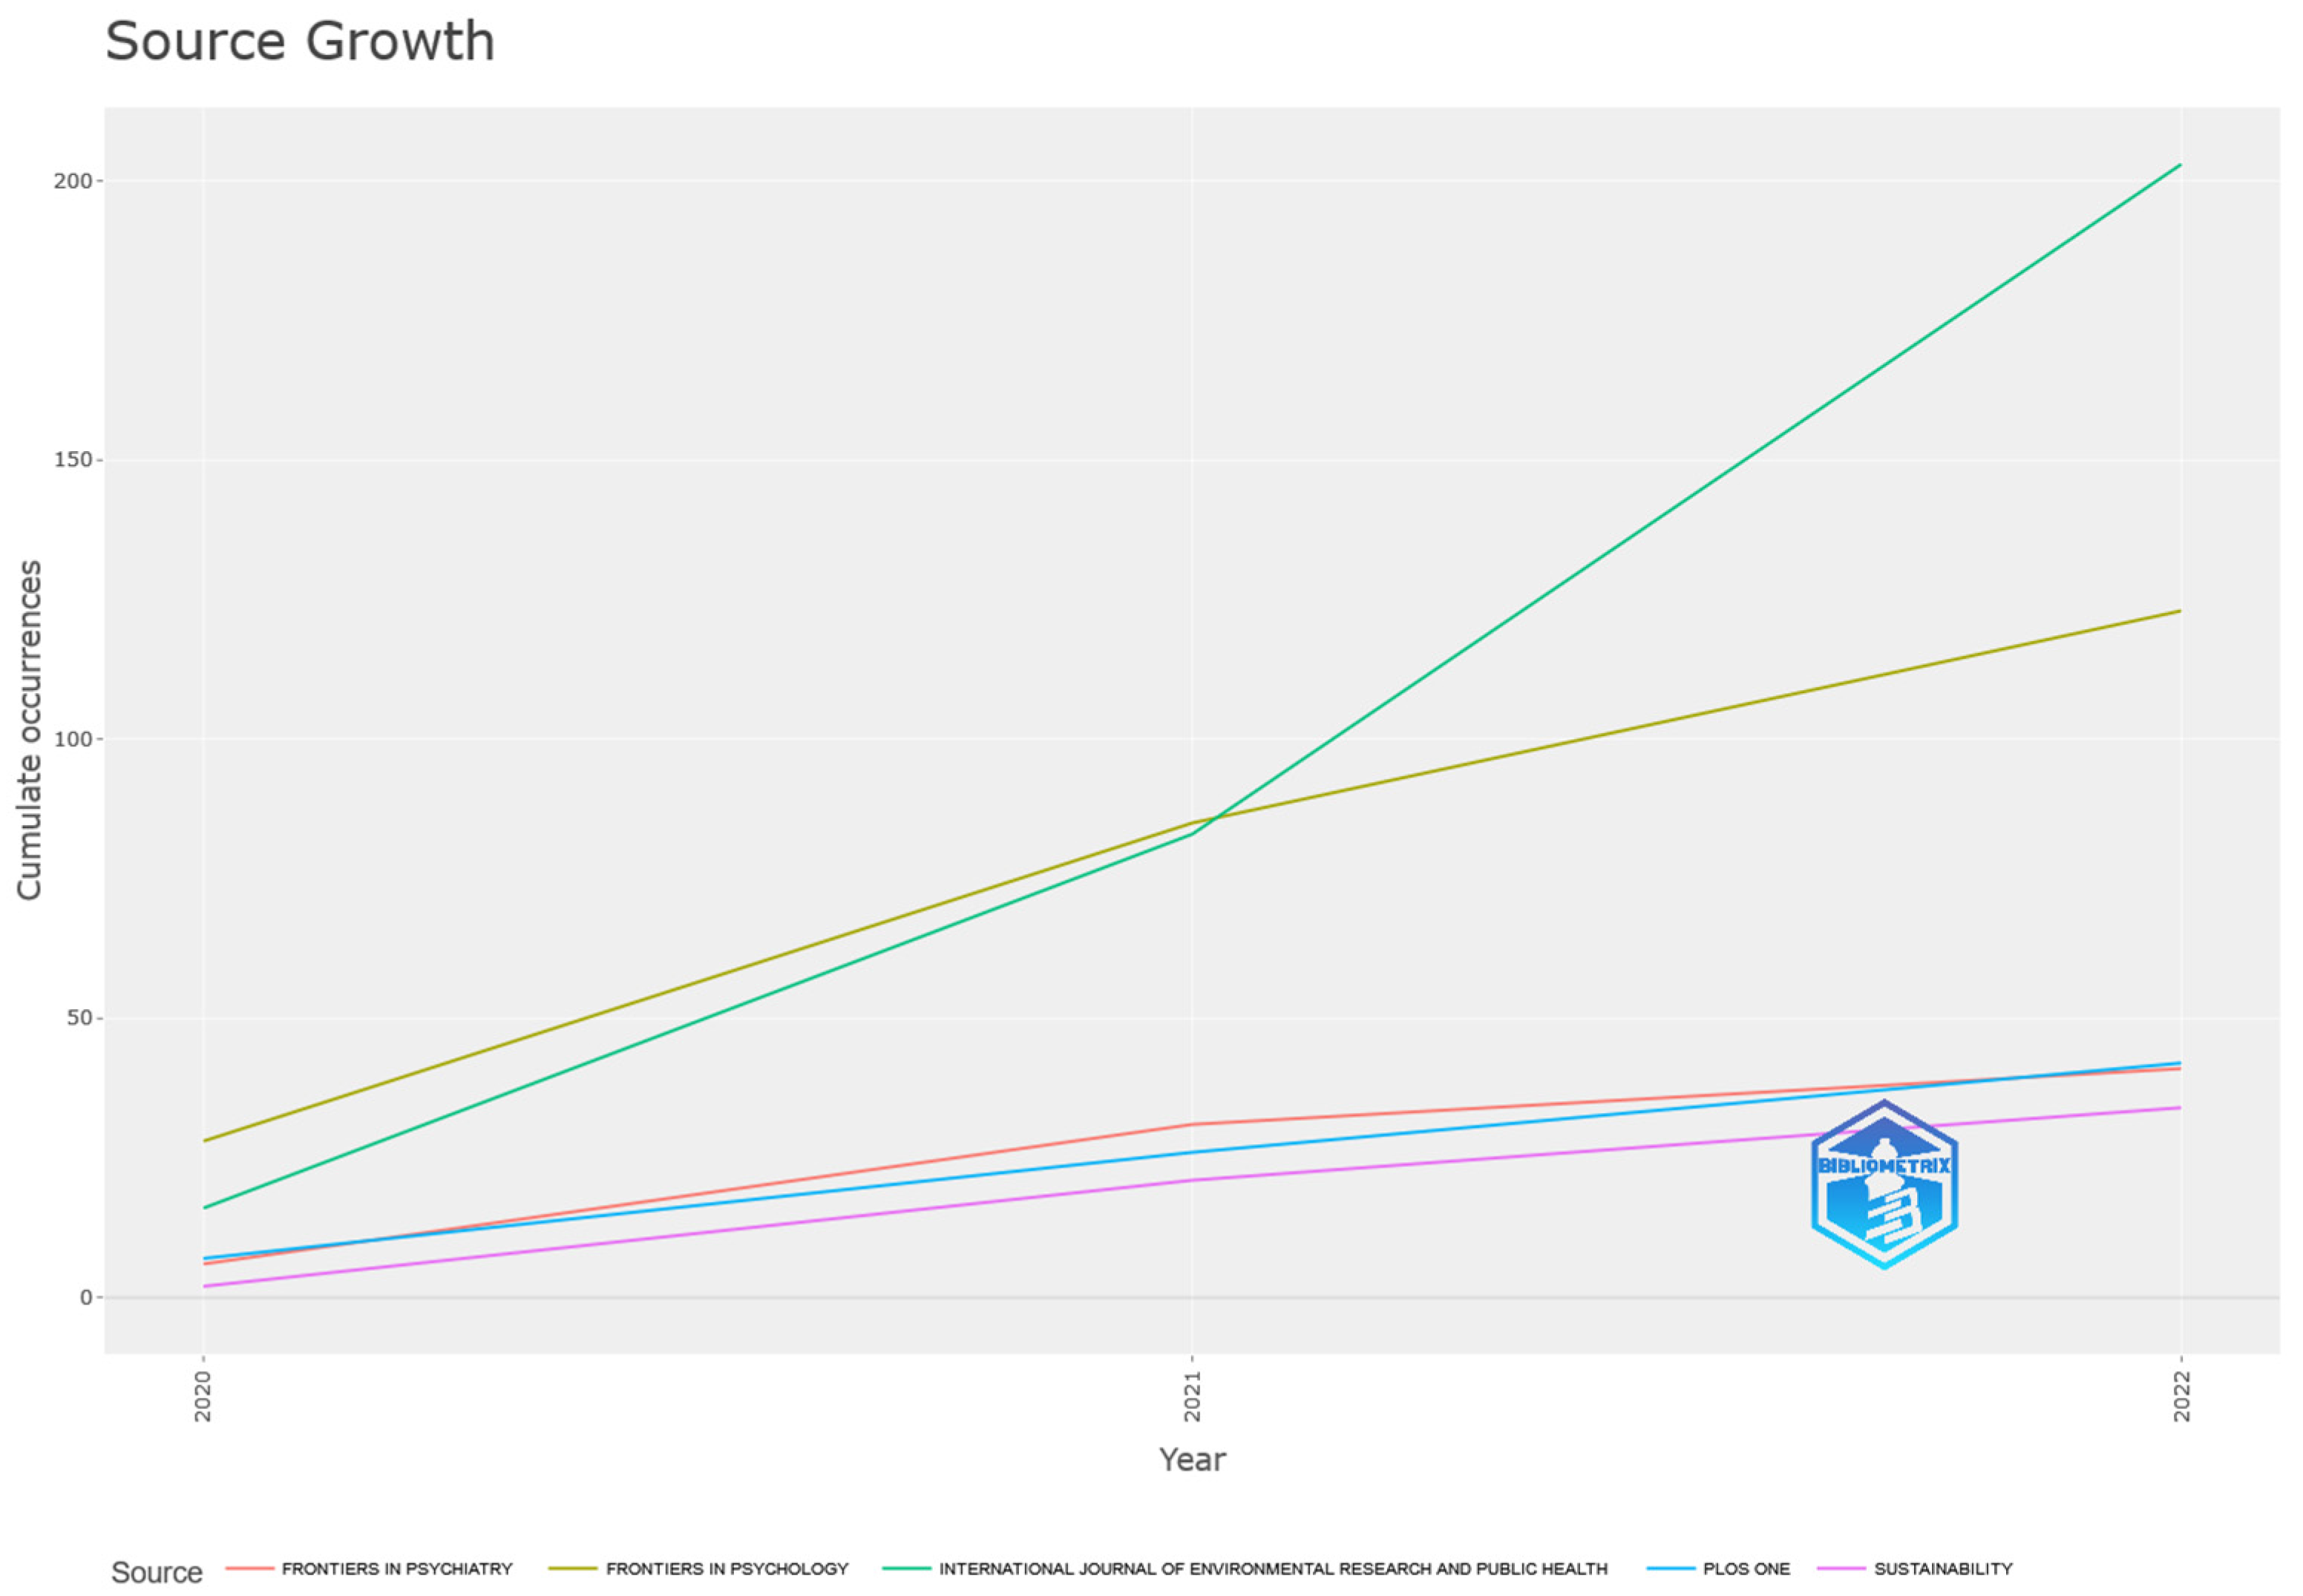
3.2. Sources
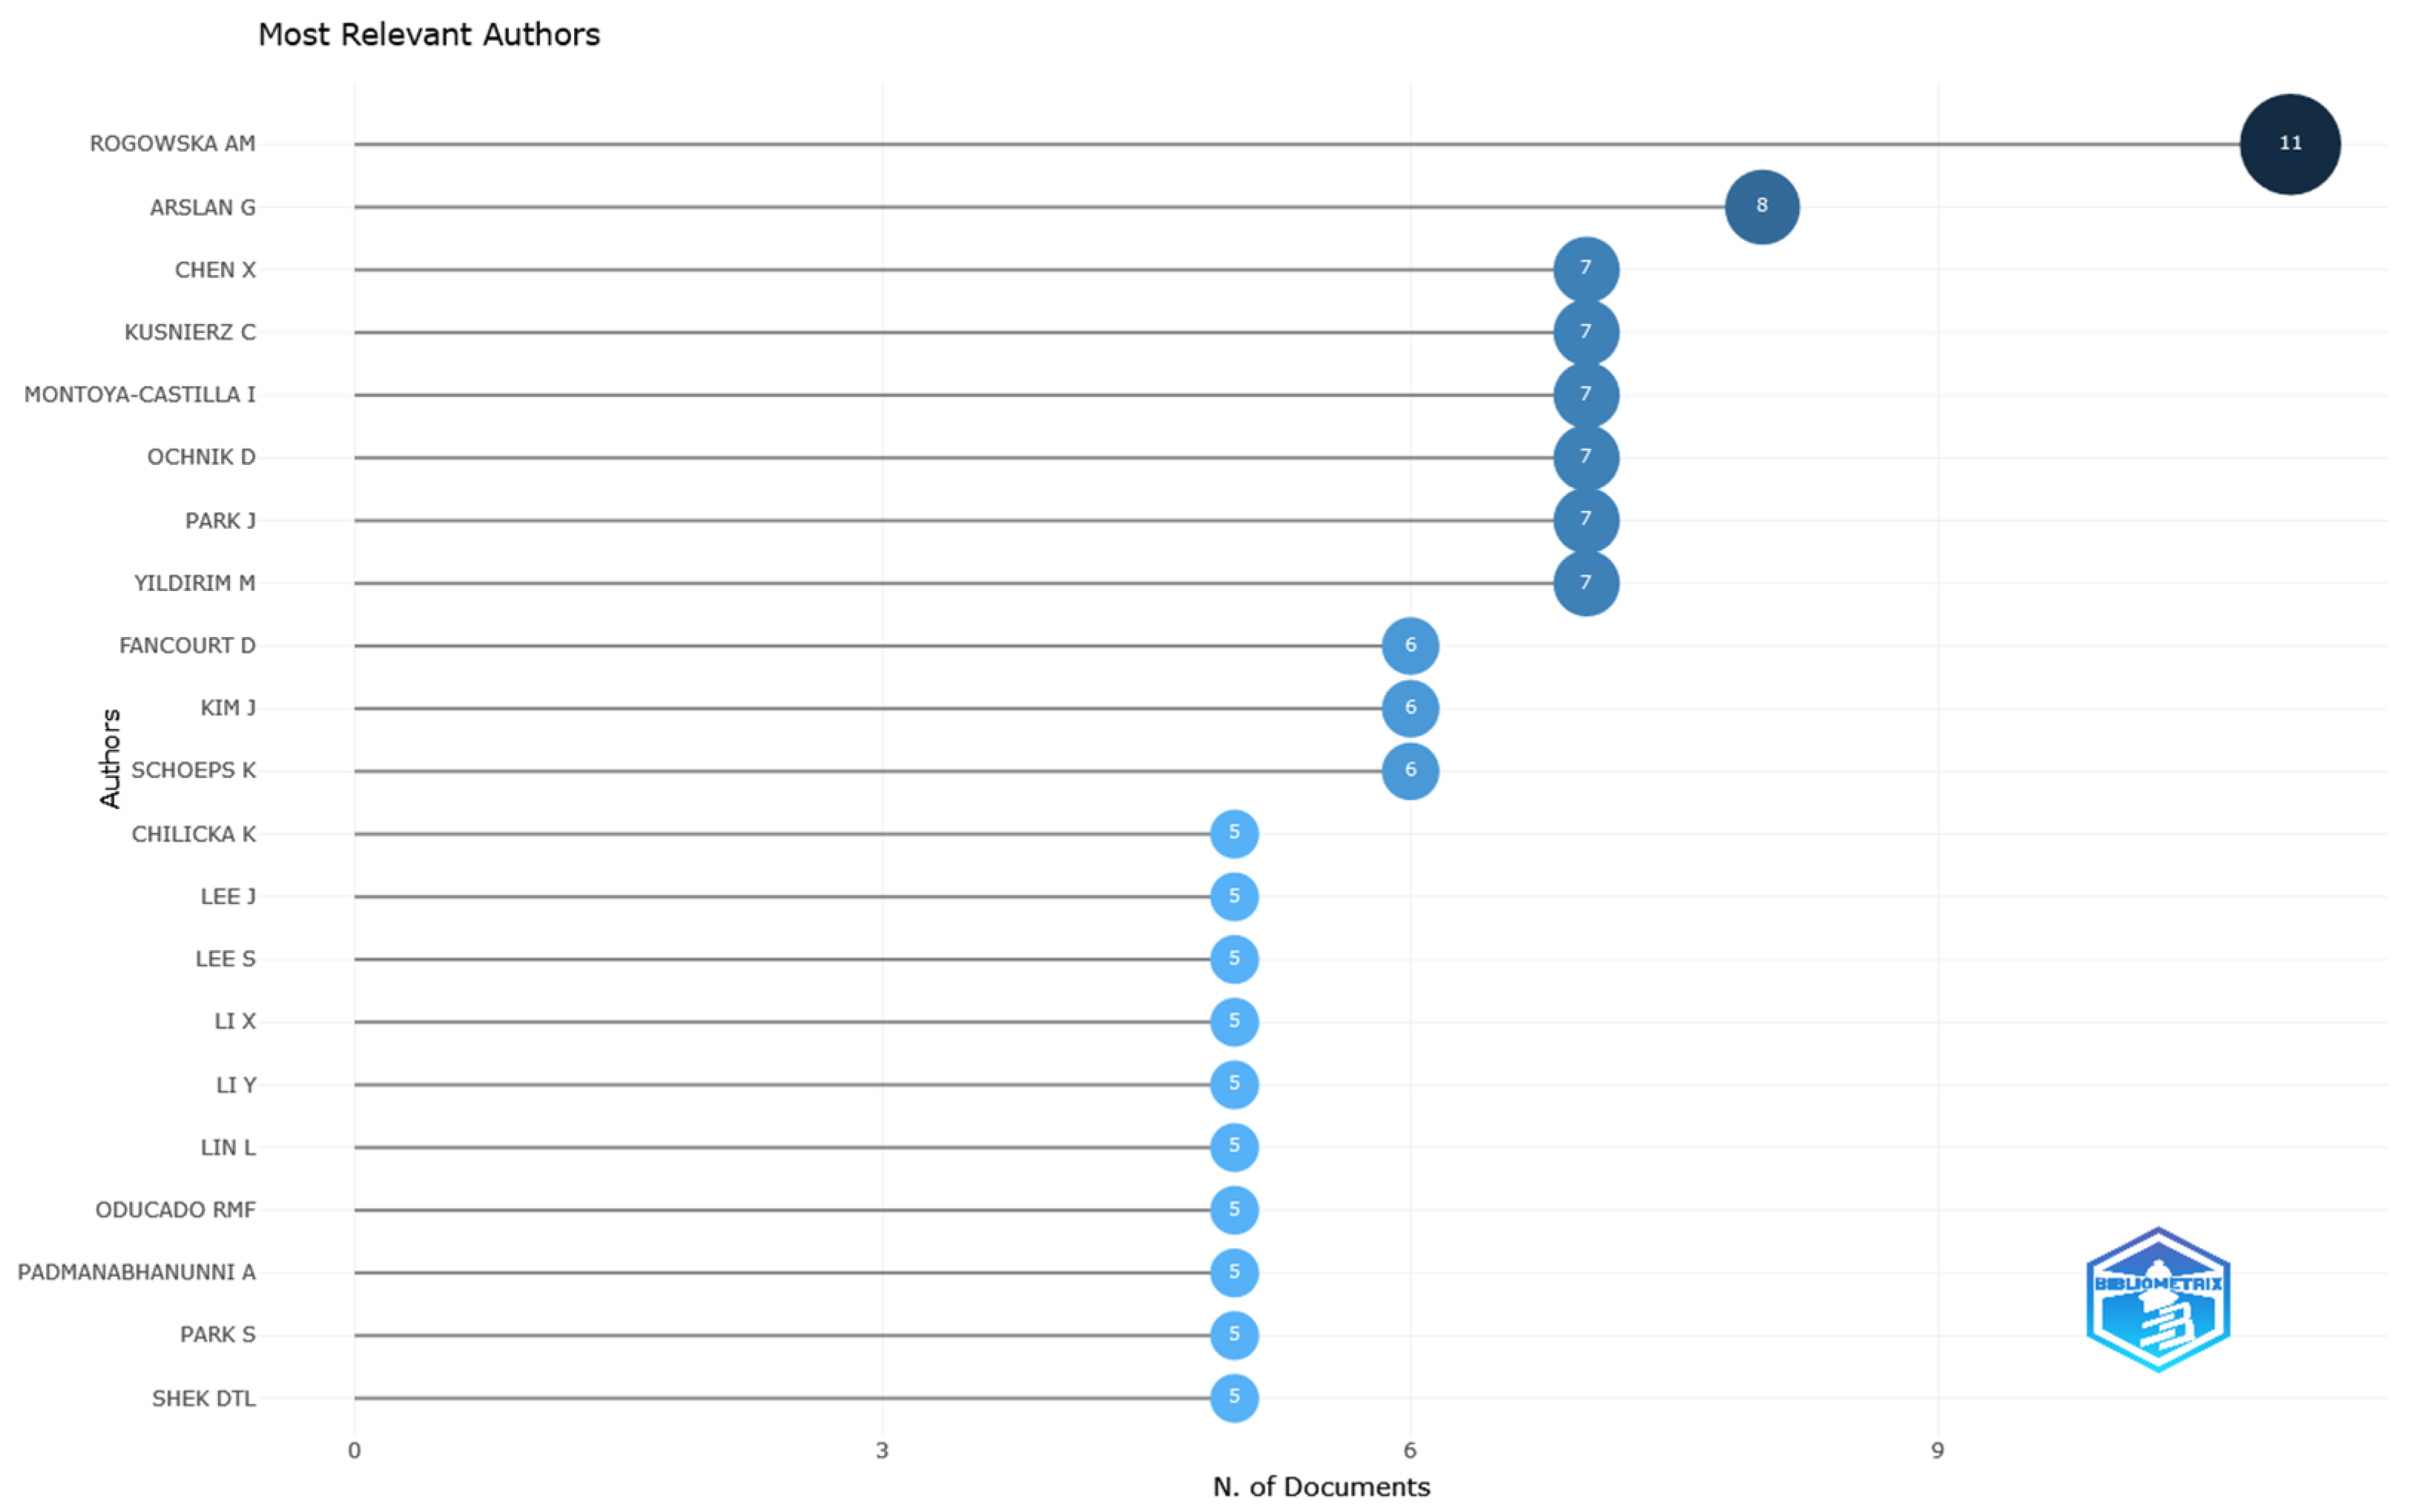
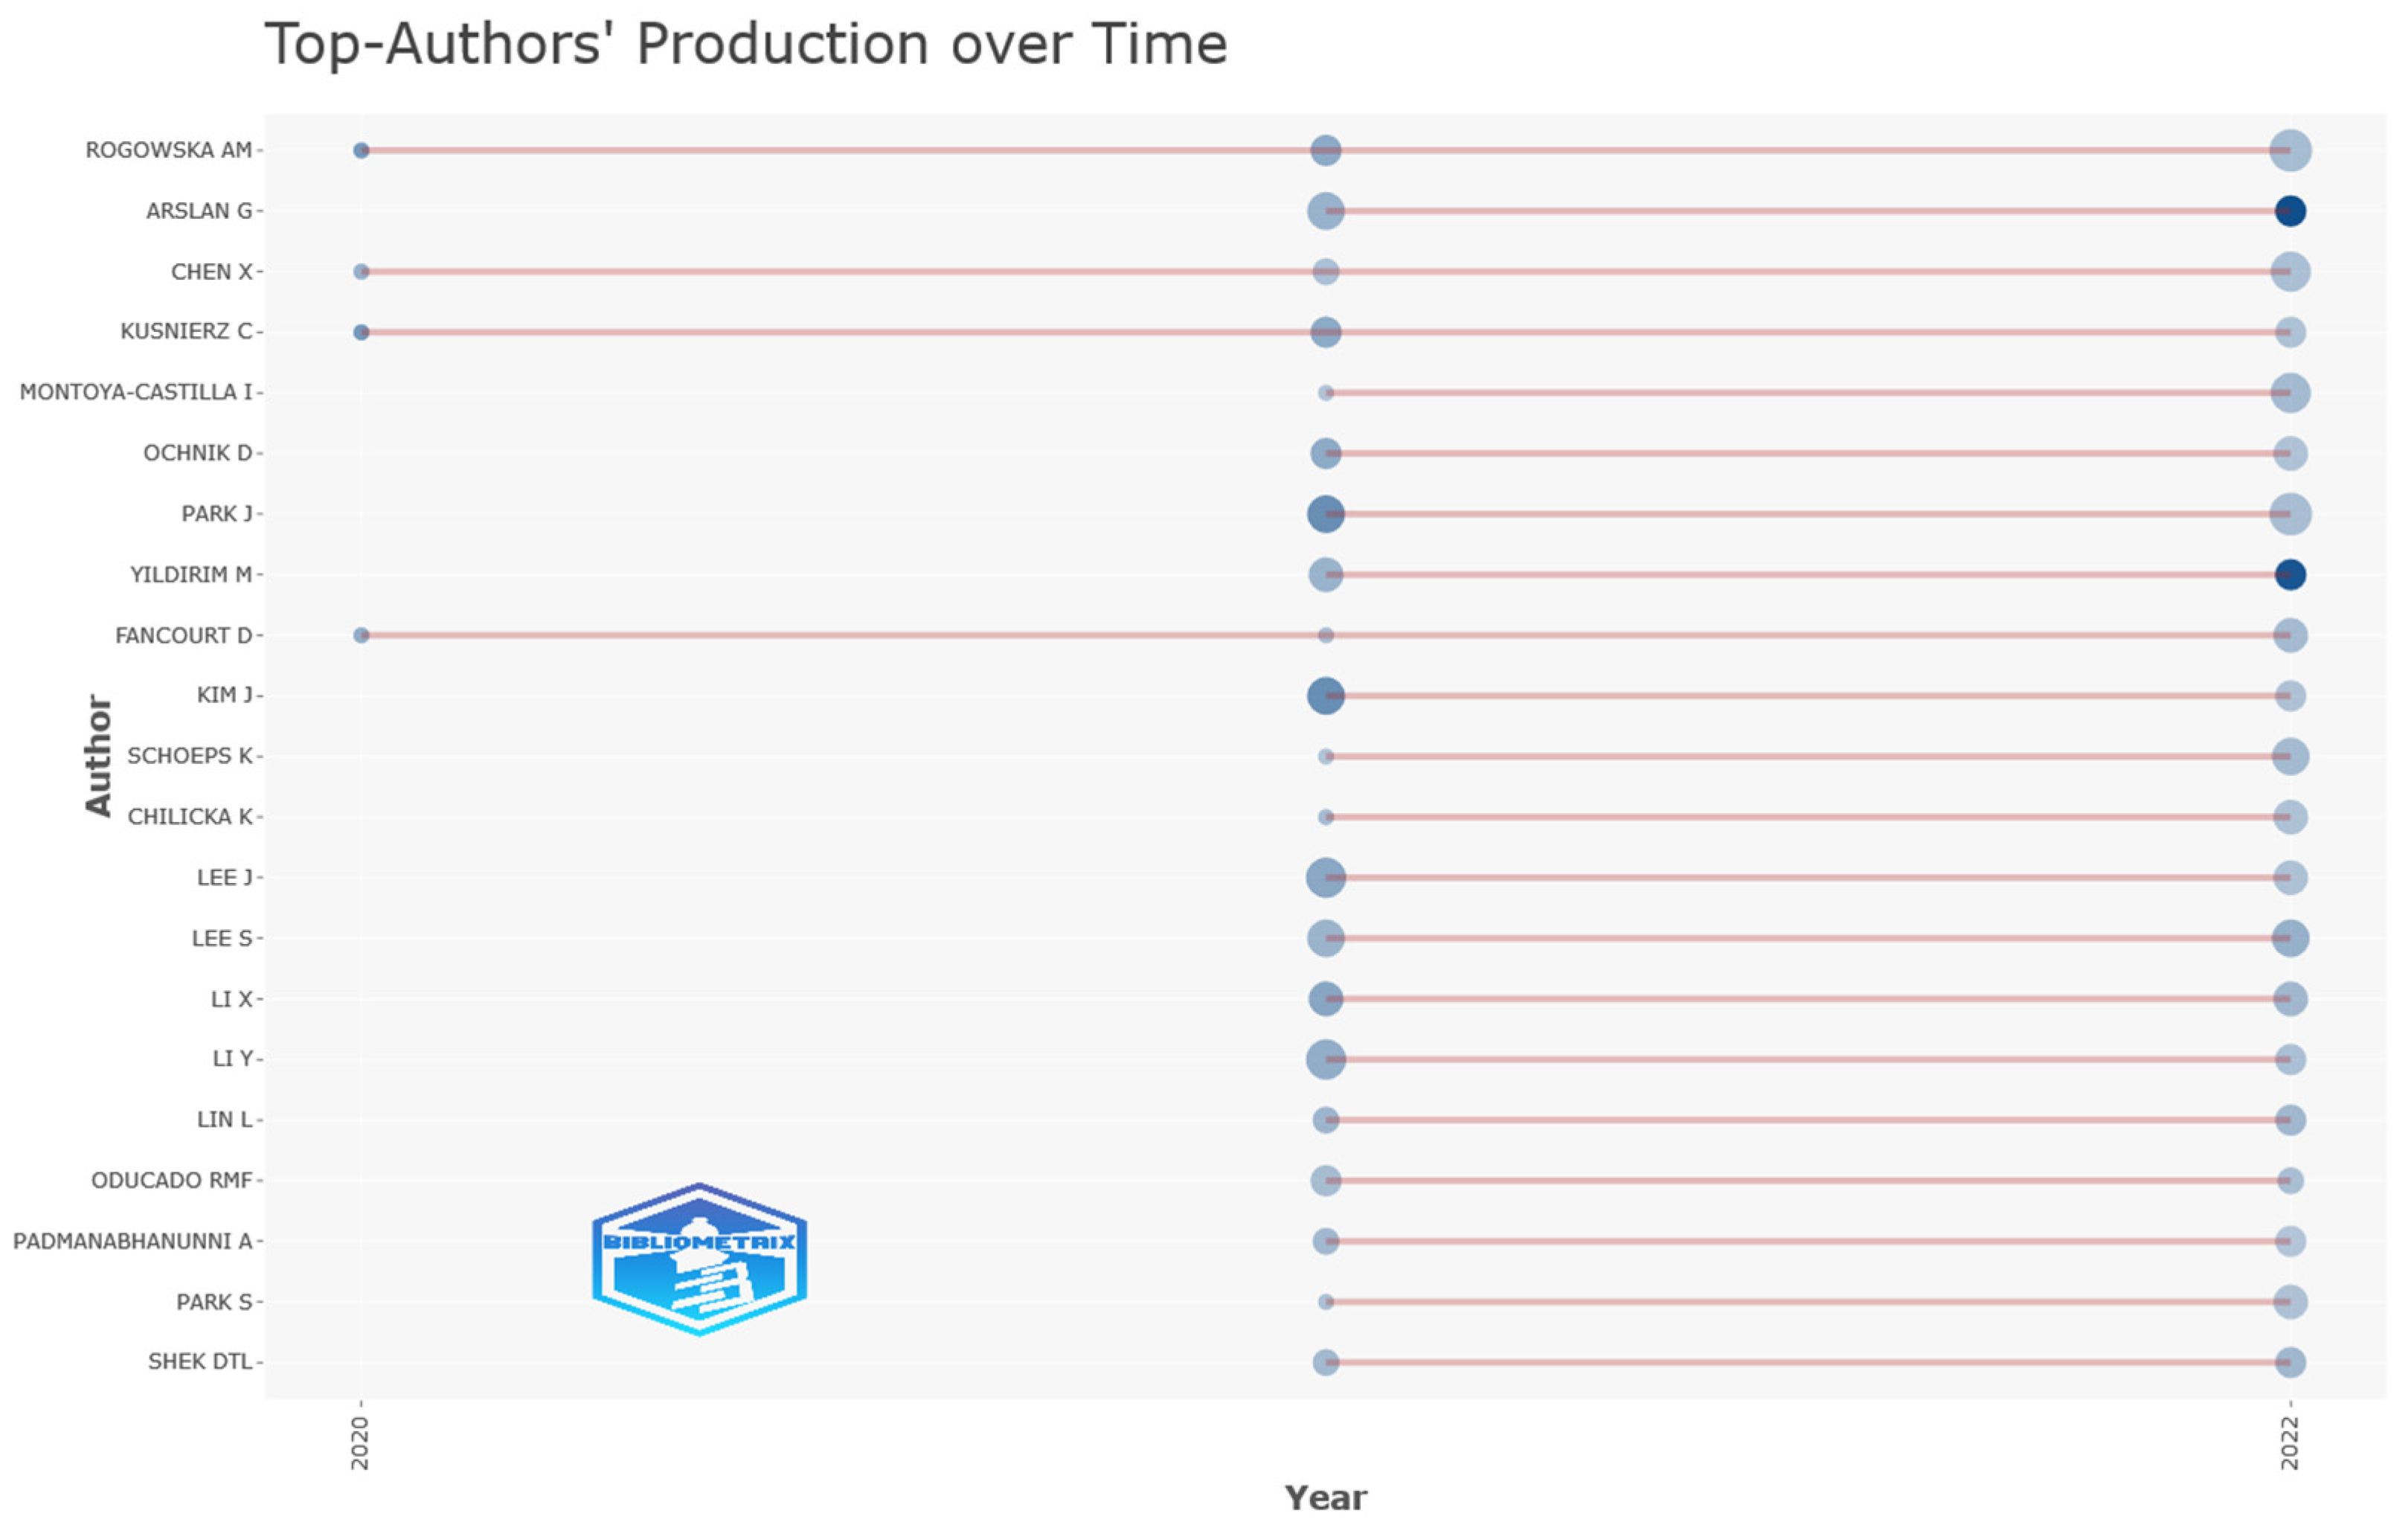
3.3. Authors
3.4. Analysis of the Literature
3.4.1. Top 10 Most Cited Papers—Overview
3.4.2. Top 10 Most Cited Papers—Review
3.4.3. Words Analysis
3.5. Mixed Analysis
4. Discussions
5. Limitations
6. Conclusions
Author Contributions
Funding
Institutional Review Board Statement
Informed Consent Statement
Data Availability Statement
Acknowledgments
Conflicts of Interest
References
- Kringelbach, M.L.; Berridge, K.C. The Neuroscience of Happiness and Pleasure. Soc. Res. 2010, 77, 659–678. [Google Scholar] [CrossRef]
- Ami̇rzai̇, F.R.; Sönmez, A. Socio-Economic Determinants of Happiness: The Case of Afghanistan. Sosyoekonomi 2022, 30, 183–198. [Google Scholar] [CrossRef]
- Diener, E.; Suh, E.M.; Lucas, R.E.; Smith, H.L. Subjective Well-Being: Three Decades of Progress. Psychol. Bull. 1999, 125, 276–302. [Google Scholar] [CrossRef]
- Kahneman, D.; Diener, E.; Schwarz, N. (Eds.) Well-Being: The Foundations of Hedonic Psychology; Russell Sage Foundation: Manhattan, NY, USA, 1999. [Google Scholar]
- Veenhoven, R. Conditions of Happiness; Springer: Dordrecht, The Netherlands, 1984; ISBN 978-94-009-6434-1. [Google Scholar]
- Moeinaddini, M.; Asadi-Shekari, Z.; Aghaabbasi, M.; Saadi, I.; Zaly Shah, M.; Cools, M. Proposing a New Score to Measure Personal Happiness by Identifying the Contributing Factors. Measurement 2020, 151, 107115. [Google Scholar] [CrossRef]
- Ronald, I. World Values Surveys and European Values Surveys, 1981–1984, 1990–1993, and 1995–1997. 2000. Available online: http://web.stanford.edu/group/ssds/dewidocs/icpsr2790/cb2790.pdf (accessed on 27 May 2024).
- Ahrendt, D.; Dubois, H.; Mezger, E. An Overview of Quality of Life in Europe. In Global Handbook of Quality of Life: Exploration of Well-Being of Nations and Continents; Glatzer, W., Camfield, L., Møller, V., Rojas, M., Eds.; International Handbooks of Quality-of-Life; Springer: Dordrecht, The Netherlands, 2015; pp. 625–661. ISBN 978-94-017-9178-6. [Google Scholar]
- Kristapsone, S.; Bruna, S. Changes in the Subjective Assessment of Quality of Life in Latvia and the European Union: Results of European Quality of Life Survey 2016; University of Latvia: Rīga, Latvia, 2019; ISBN 978-9934-18-428-4. [Google Scholar]
- Piper, A.T. Europe’s Capital Cities and the Happiness Penalty: An Investigation Using the European Social Survey. Soc. Indic. Res. 2015, 123, 103–126. [Google Scholar] [CrossRef]
- Powdthavee, N.; Burkhauser, R.V.; De Neve, J.-E. Top Incomes and Human Well-Being: Evidence from the Gallup World Poll. J. Econ. Psychol. 2017, 62, 246–257. [Google Scholar] [CrossRef]
- Xia, X.; Yu, Y.; Zou, Y. Air Pollution, Social Engagement and Subjective Well-Being: Evidence from the Gallup World Poll. Environ. Sci. Pollut. Res. 2022, 29, 52033–52056. [Google Scholar] [CrossRef]
- Joshanloo, M.; Jovanović, V. Subjective Health in Relation to Hedonic and Eudaimonic Wellbeing: Evidence from the Gallup World Poll. J. Health Psychol. 2021, 26, 438–448. [Google Scholar] [CrossRef] [PubMed]
- Diener, E.; Tay, L. Subjective Well-Being and Human Welfare around the World as Reflected in the Gallup World Poll. Int. J. Psychol. 2015, 50, 135–149. [Google Scholar] [CrossRef]
- Salameh, A.A.; Amin, S.; Danish, M.H.; Asghar, N.; Naveed, R.T.; Munir, M. Socio-Economic Determinants of Subjective Wellbeing toward Sustainable Development Goals: An Insight from a Developing Country. Front. Psychol. 2022, 13, 961400. [Google Scholar] [CrossRef]
- Happiness Should Have Greater Role in Development Policy–UN Member States|UN News. Available online: https://news.un.org/en/story/2011/07/382052 (accessed on 27 May 2024).
- O’Brien, C. Sustainable Happiness and Well-Being: Future Directions for Positive Psychology. Psychology 2012, 03, 1196–1201. [Google Scholar] [CrossRef]
- Sustainable Development and Human Well-Being. Available online: https://worldhappiness.report/ed/2020/sustainable-development-and-human-well-being/ (accessed on 27 May 2024).
- Cloutier, S.; Pfeiffer, D. Sustainability Through Happiness: A Framework for Sustainable Development. Sustain. Dev. 2015, 23, 317–327. [Google Scholar] [CrossRef]
- THE 17 GOALS|Sustainable Development. Available online: https://sdgs.un.org/goals (accessed on 27 May 2024).
- Home. Available online: https://worldhappiness.report/ (accessed on 27 May 2024).
- Helliwell, J.F.; Layard, R.; Sachs, J.D.; Neve, J.-E.D. World Happiness Report 2020. Available online: https://worldhappiness.report/ed/2020/ (accessed on 27 May 2024).
- O’Brien, C. Happiness and Sustainability Together at Last! Sustainable Happiness. Can. J. Educ. /Rev. Can. De L'éducation 2013, 36, 228–256. [Google Scholar]
- The Team behind the Happy Planet Index–Happy Planet Index. Available online: https://happyplanetindex.org/learn-about-the-happy-planet-index/ (accessed on 9 January 2024).
- Li, Q.; Guan, X.; Wu, P.; Wang, X.; Zhou, L.; Tong, Y.; Ren, R.; Leung, K.S.M.; Lau, E.H.Y.; Wong, J.Y.; et al. Early Transmission Dynamics in Wuhan, China, of Novel Coronavirus-Infected Pneumonia. N. Engl. J. Med. 2020, 382, 1199–1207. [Google Scholar] [CrossRef]
- Rana, R.; Tripathi, A.; Kumar, N.; Ganguly, N.K. A Comprehensive Overview on COVID-19: Future Perspectives. Front. Cell. Infect. Microbiol. 2021, 11, 744903. [Google Scholar] [CrossRef]
- Fan, J.; Gao, Y.; Zhao, N.; Dai, R.; Zhang, H.; Feng, X.; Shi, G.; Tian, J.; Chen, C.; Hambly, B.D.; et al. Bibliometric Analysis on COVID-19: A Comparison of Research Between English and Chinese Studies. Front. Public Health 2020, 8, 477. [Google Scholar] [CrossRef] [PubMed]
- Shen, X.; Yan, S.; Cao, H.; Feng, J.; Lei, Z.; Zhang, W.; Lv, C.; Gan, Y. Current Status and Associated Factors of Depression and Anxiety Among the Chinese Residents During the Period of Low Transmission of COVID-19. Front. Psychol. 2021, 12, 700376. [Google Scholar] [CrossRef]
- Xiong, J.; Lipsitz, O.; Nasri, F.; Lui, L.M.W.; Gill, H.; Phan, L.; Chen-Li, D.; Iacobucci, M.; Ho, R.; Majeed, A.; et al. Impact of COVID-19 Pandemic on Mental Health in the General Population: A Systematic Review. J. Affect. Disord. 2020, 277, 55–64. [Google Scholar] [CrossRef] [PubMed]
- Zhang, S.X.; Wang, Y.; Rauch, A.; Wei, F. Unprecedented Disruption of Lives and Work: Health, Distress and Life Satisfaction of Working Adults in China One Month into the COVID-19 Outbreak. Psychiatry Res. 2020, 288, 112958. [Google Scholar] [CrossRef]
- Zacher, H.; Rudolph, C.W. Individual Differences and Changes in Subjective Wellbeing during the Early Stages of the COVID-19 Pandemic. Am. Psychol. 2021, 76, 50–62. [Google Scholar] [CrossRef]
- Li, S.; Wang, Y.; Xue, J.; Zhao, N.; Zhu, T. The Impact of COVID-19 Epidemic Declaration on Psychological Consequences: A Study on Active Weibo Users. Int. J. Environ. Res. Public Health 2020, 17, 2032. [Google Scholar] [CrossRef] [PubMed]
- Jahrami, H.; BaHammam, A.S.; Bragazzi, N.L.; Saif, Z.; Faris, M.; Vitiello, M.V. Sleep Problems during the COVID-19 Pandemic by Population: A Systematic Review and Meta-Analysis. J. Clin. Sleep Med. 2021, 17, 299–313. [Google Scholar] [CrossRef] [PubMed]
- Altena, E.; Baglioni, C.; Espie, C.A.; Ellis, J.; Gavriloff, D.; Holzinger, B.; Schlarb, A.; Frase, L.; Jernelöv, S.; Riemann, D. Dealing with Sleep Problems during Home Confinement Due to the COVID-19 Outbreak: Practical Recommendations from a Task Force of the European CBT-I Academy. J. Sleep Res. 2020, 29, e13052. [Google Scholar] [CrossRef]
- Jiang, Z.; Zhu, P.; Wang, L.; Hu, Y.; Pang, M.; Ma, S.; Tang, X. Psychological Distress and Sleep Quality of COVID-19 Patients in Wuhan, a Lockdown City as the Epicenter of COVID-19. J. Psychiatr. Res. 2021, 136, 595–602. [Google Scholar] [CrossRef]
- Pang, J.C.Y.; Chan, E.L.S.; Lau, H.M.C.; Reeves, K.K.L.; Chung, T.H.Y.; Hui, H.W.L.; Leung, A.H.L.; Fu, A.C.L. The Impacts of Physical Activity on Psychological and Behavioral Problems, and Changes in Physical Activity, Sleep and Quality of Life during the COVID-19 Pandemic in Preschoolers, Children, and Adolescents: A Systematic Review and Meta-Analysis. Front. Pediatr. 2023, 11, 1015943. [Google Scholar] [CrossRef] [PubMed]
- Shaik, L.; Boike, S.; Ramar, K.; Subramanian, S.; Surani, S. COVID-19 and Sleep Disturbances: A Literature Review of Clinical Evidence. Medicina 2023, 59, 818. [Google Scholar] [CrossRef] [PubMed]
- Maugeri, G.; Castrogiovanni, P.; Battaglia, G.; Pippi, R.; D’Agata, V.; Palma, A.; Rosa, M.; Musumeci, G. The Impact of Physical Activity on Psychological Health during Covid-19 Pandemic in Italy. Heliyon 2020, 6, e04315. [Google Scholar] [CrossRef] [PubMed]
- Mason, M.R.; Hudgins, J.H.; Campbell, M.S.; Biddle, M.J.; Ickes, M.J.; Dugan, A.; Bollinger, L.M. Changes in Physical Activity during the Initial Stages of the COVID-19 Pandemic. J. Sports Sci. 2022, 40, 116–124. [Google Scholar] [CrossRef] [PubMed]
- Ettman, C.K.; Abdalla, S.M.; Cohen, G.H.; Sampson, L.; Vivier, P.M.; Galea, S. Prevalence of Depression Symptoms in US Adults Before and During the COVID-19 Pandemic. JAMA Netw. Open 2020, 3, e2019686. [Google Scholar] [CrossRef]
- Orgilés, M.; Morales, A.; Delvecchio, E.; Mazzeschi, C.; Espada, J.P. Immediate Psychological Effects of the COVID-19 Quarantine in Youth From Italy and Spain. Front. Psychol. 2020, 11, 579038. [Google Scholar] [CrossRef]
- Prati, G.; Mancini, A.D. Happiness before and during the COVID-19 Pandemic in Italy: A Population-Based Longitudinal Study. Int. J. Disaster Risk Reduct. 2023, 91, 103711. [Google Scholar] [CrossRef] [PubMed]
- Bimonte, S.; Bosco, L.; Stabile, A. In Virus Veritas Lockdown and Happiness Under COVID-19. Soc. Indic. Res. 2022, 164, 823–842. [Google Scholar] [CrossRef] [PubMed]
- Satici, B.; Göçet Tekin, E.; Deniz, M.; Satici, S.A. Adaptation of the Fear of COVID-19 Scale: Its Association with Psychological Distress and Life Satisfaction in Turkey. Int. J. Ment. Health Addict. 2021, 19, 1980–1988. [Google Scholar] [CrossRef] [PubMed]
- Delhey, J.; Hess, S.; Boehnke, K.; Deutsch, F.; Eichhorn, J.; Kühnen, U.; Welzel, C. Life Satisfaction During the COVID-19 Pandemic: The Role of Human, Economic, Social, and Psychological Capital. J. Happiness Stud. 2023, 24, 2201–2222. [Google Scholar] [CrossRef]
- Author Search-Web of Science Core Collection. Available online: https://www.webofscience.com/wos/author/search (accessed on 18 October 2023).
- Dominko, M.; Verbič, M. The Economics of Subjective Well-Being: A Bibliometric Analysis. J. Happiness Stud. 2019, 20, 1973–1994. [Google Scholar] [CrossRef]
- Angner, E. Is It Possible to Measure Happiness?: The Argument from Measurability. Eur. J. Philos. Sci. 2013, 3, 221–240. [Google Scholar] [CrossRef]
- Ng, Y.-K. Happiness—Concept, Measurement and Promotion; Springer Nature: Singapore, 2022; ISBN 978-981-334-971-1. [Google Scholar]
- Das, K.V.; Jones-Harrell, C.; Fan, Y.; Ramaswami, A.; Orlove, B.; Botchwey, N. Understanding Subjective Well-Being: Perspectives from Psychology and Public Health. Public Health Rev. 2020, 41, 25. [Google Scholar] [CrossRef] [PubMed]
- Lang, J. The Most Influential Factors in Determining the Happiness of Nations. Major Themes Econ. 2012, 14, 33–54. [Google Scholar]
- Thinley, J.Y.; Hartz-Karp, J. National Progress, Sustainability and Higher Goals: The Case of Bhutan’s Gross National Happiness. Sustain. Earth 2019, 2, 11. [Google Scholar] [CrossRef]
- Ejaz, H.; Zeeshan, H.M.; Ahmad, F.; Bukhari, S.N.A.; Anwar, N.; Alanazi, A.; Sadiq, A.; Junaid, K.; Atif, M.; Abosalif, K.O.A.; et al. Bibliometric Analysis of Publications on the Omicron Variant from 2020 to 2022 in the Scopus Database Using R and VOSviewer. Int. J. Environ. Res. Public Health 2022, 19, 12407. [Google Scholar] [CrossRef]
- Donthu, N.; Kumar, S.; Mukherjee, D.; Pandey, N.; Lim, W.M. How to Conduct a Bibliometric Analysis: An Overview and Guidelines. J. Bus. Res. 2021, 133, 285–296. [Google Scholar] [CrossRef]
- Marín-Rodríguez, N.J.; González-Ruiz, J.D.; Valencia-Arias, A. Incorporating Green Bonds into Portfolio Investments: Recent Trends and Further Research. Sustainability 2023, 15, 14897. [Google Scholar] [CrossRef]
- Anaç, M.; Gumusburun Ayalp, G.; Erdayandi, K. Prefabricated Construction Risks: A Holistic Exploration through Advanced Bibliometric Tool and Content Analysis. Sustainability 2023, 15, 11916. [Google Scholar] [CrossRef]
- AlRyalat, S.A.S.; Malkawi, L.W.; Momani, S.M. Comparing Bibliometric Analysis Using PubMed, Scopus, and Web of Science Databases. J. Vis. Exp. 2019, 152, e58494. [Google Scholar] [CrossRef] [PubMed]
- Popescu, D.; Dima, A.; Radu, E.; Dobrota, E.M.; Dumitrache, V.-M. Bibliometric Analysis of the Green Deal Policies in the Food Chain. Amfiteatru Econ. J. 2022, 24, 410. [Google Scholar] [CrossRef]
- Liu, W. The Data Source of This Study Is Web of Science Core Collection? Not Enough. Scientometrics 2019, 121, 1815–1824. [Google Scholar] [CrossRef]
- Liu, F. Retrieval Strategy and Possible Explanations for the Abnormal Growth of Research Publications: Re-Evaluating a Bibliometric Analysis of Climate Change. Scientometrics 2023, 128, 853–859. [Google Scholar] [CrossRef]
- El-Krab, R.; Kalichman, S.; Govindasamy, D.; Banas, E.; Kalichman, M.; Mathews, C. Subjective Well-Being and COVID-19 Prevention Practices among People Living with HIV in Cape Town, South Africa. Glob. Public Health 2022, 17, 1–12. [Google Scholar] [CrossRef]
- Randall, K.; Ford, T.G.; Kwon, K.-A.; Sisson, S.S.; Bice, M.R.; Dinkel, D.; Tsotsoros, J. Physical Activity, Physical Well-Being, and Psychological Well-Being: Associations with Life Satisfaction during the COVID-19 Pandemic among Early Childhood Educators. Int. J. Environ. Res. Public Health 2021, 18, 9430. [Google Scholar] [CrossRef]
- Budak, F.; Özer, Ö.; Özkan, O. Investigation of COVID-19 Risk Perception and Psychological Well-Being in Syrian Refugees. Smith Coll. Stud. Soc. Work. 2021, 91, 309–323. [Google Scholar] [CrossRef]
- İme, Y.; Ümmet, D. Adaptation of Emotional Flexibility Scale: Its Association with Subjective Well Being and Resilience During Covid-19 Pandemic. Child Indic. Res. 2022, 15, 2141–2154. [Google Scholar] [CrossRef]
- Wen, F.; Ye, H.; Zuo, B.; Han, S.; Zhu, J.; Ke, W.; He, Y. The Association between Insecurity and Subjective Well-Being among Youth during the COVID-19 Outbreak: A Moderated Mediation Model. J. Affect. Disord. 2022, 297, 486–494. [Google Scholar] [CrossRef] [PubMed]
- Engel de Abreu, P.M.J.; Neumann, S.; Wealer, C.; Abreu, N.; Coutinho Macedo, E.; Kirsch, C. Subjective Well-Being of Adolescents in Luxembourg, Germany, and Brazil During the COVID-19 Pandemic. J. Adolesc. Health 2021, 69, 211–218. [Google Scholar] [CrossRef]
- Anglim, J.; Horwood, S. Effect of the COVID-19 Pandemic and Big Five Personality on Subjective and Psychological Well-Being. Soc. Psychol. Personal. Sci. 2021, 12, 1527–1537. [Google Scholar] [CrossRef]
- Delsignore, G.; Aguilar-Latorre, A.; Oliván-Blázquez, B. Measuring Happiness in the Social Sciences: An Overview. J. Sociol. 2021, 57, 1044–1067. [Google Scholar] [CrossRef]
- Balasubramanian, S.; Cashin, P. Gross National Happiness and Macroeconomic Indicators in the Kingdom of Bhutan. IMF Work. Pap. 2019, 2019. [Google Scholar] [CrossRef]
- Stone, A.A.; Mackie, C.; Framework, P. National Research Council. Introduction. In Subjective Well-Being: Measuring Happiness, Suffering, and Other Dimensions of Experience [Internet]; National Academies Press (US): Washington, DC, USA, 2013. [Google Scholar]
- Larsen, R.J.; Diener, E.; Emmons, R.A. An Evaluation of Subjective Well-Being Measures. Soc. Indic. Res. 1985, 17, 1–17. [Google Scholar] [CrossRef]
- IPSOS. Global Happiness 2022: What Makes People Happy in the Age of COVID-19? IPSOS, Paris. 2022. Available online: www.ipsos.com/en-uk/what-makes-people-happiest-health-family-and-purpose (accessed on 9 January 2024).
- Aria, M.; Cuccurullo, C. Bibliometrix: An R-Tool for Comprehensive Science Mapping Analysis. J. Informetr. 2017, 11, 959–975. [Google Scholar] [CrossRef]
- Delcea, C.; Cotfas, L.-A. State of the Art in Grey Systems Research in Economics and Social Sciences. In Advancements of Grey Systems Theory in Economics and Social Sciences; Series on Grey System; Springer Nature: Singapore, 2023; pp. 1–44. ISBN 978-981-19993-1-4. [Google Scholar]
- Zardari, S.; Alam, S.; Al Salem, H.A.; Al Reshan, M.S.; Shaikh, A.; Malik, A.F.K.; Masood Ur Rehman, M.; Mouratidis, H. A Comprehensive Bibliometric Assessment on Software Testing (2016–2021). Electronics 2022, 11, 1984. [Google Scholar] [CrossRef]
- Marín-Rodríguez, N.J.; González-Ruiz, J.D.; Botero Botero, S. Dynamic Co-Movements among Oil Prices and Financial Assets: A Scientometric Analysis. Sustainability 2022, 14, 12796. [Google Scholar] [CrossRef]
- Delcea, C.; Javed, S.A.; Florescu, M.-S.; Ioanas, C.; Cotfas, L.-A. 35 Years of Grey System Theory in Economics and Education. Kybernetes 2023. [Google Scholar] [CrossRef]
- Madsen, D.Ø.; Berg, T.; Di Nardo, M. Bibliometric Trends in Industry 5.0 Research: An Updated Overview. ASI 2023, 6, 63. [Google Scholar] [CrossRef]
- Gorski, A.-T.; Ranf, E.-D.; Badea, D.; Halmaghi, E.-E.; Gorski, H. Education for Sustainability—Some Bibliometric Insights. Sustainability 2023, 15, 14916. [Google Scholar] [CrossRef]
- Castillo-Vergara, M.; Muñoz-Cisterna, V.; Geldes, C.; Álvarez-Marín, A.; Soto-Marquez, M. Bibliometric Analysis of Computational and Mathematical Models of Innovation and Technology in Business. Axioms 2023, 12, 631. [Google Scholar] [CrossRef]
- López-Fernández, M.C.; Serrano-Bedia, A.M.; Pérez-Pérez, M. Entrepreneurship and Family Firm Research: A Bibliometric Analysis of An Emerging Field. J. Small Bus. Manag. 2016, 54, 622–639. [Google Scholar] [CrossRef]
- Pang, N.T.P.; Kamu, A.; Guan, T.E.; Sombuling, A.; Ho, C.M.; Mohamad, N.H.; Wider, W.; Fauzi, M.A. Happiness and Satisfaction Research Pre and during the COVID-19 Pandemic: A Bibliometric Analysis of Global Scientific Literature. F1000Research 2023, 12, 658. [Google Scholar] [CrossRef]
- Aria, M.; Cuccurullo, C. A Brief Introduction to Bibliometrix. Available online: https://www.bibliometrix.org/vignettes/Introduction_to_bibliometrix.html (accessed on 22 November 2023).
- Viju, V.G.W. Application of Bradford’s Law of Scattering to the Literature of Library & Information Science: A Study of Doctoral Theses Citations Submitted to the Universities of Maharashtra, India. Libr. Philos. Pract. 2013, 15, 1–45. [Google Scholar]
- Shah, F.A.; Jawaid, S.A. The H-Index: An Indicator of Research and Publication Output. Pak. J. Med. Sci. 2023, 39, 315–316. [Google Scholar] [CrossRef] [PubMed]
- Koltun, V.; Hafner, D. The H-Index Is No Longer an Effective Correlate of Scientific Reputation. PLoS ONE 2021, 16, e0253397. [Google Scholar] [CrossRef] [PubMed]
- Memon, A.R.; Chen, S.; To, Q.G.; Vandelanotte, C. Vigorously Cited: A Bibliometric Analysis of the 100 Most Cited Sedentary Behaviour Articles. J. Act. Sedentary Sleep Behav. 2023, 2, 13. [Google Scholar] [CrossRef]
- Yu, Q.; Tan, S.; Ren, Y.; He, M.; Fu, X.; Peng, Y.; Tang, X. Bibliometric Analysis of the 100 Most-Cited Articles in the Field of Hepatology. Gastroenterol. Hepatol. 2020, 43, 349–357. [Google Scholar] [CrossRef] [PubMed]
- Yiğit, B.; Çakmak, B.Y. Discovering Psychological Well-Being: A Bibliometric Review. J. Happiness Stud. 2024, 25, 43. [Google Scholar] [CrossRef]
- Bülbül, A.E. Bibliometric Analysis of Studies on Well-Being. J. Educ. Teach. Train. 2023, 14, 223–233. [Google Scholar] [CrossRef]
- Bornmann, L.; Marx, W. Methods for the Generation of Normalized Citation Impact Scores in Bibliometrics: Which Method Best Reflects the Judgements of Experts? J. Informetr. 2015, 9, 408–418. [Google Scholar] [CrossRef]
- Magson, N.R.; Freeman, J.Y.A.; Rapee, R.M.; Richardson, C.E.; Oar, E.L.; Fardouly, J. Risk and Protective Factors for Prospective Changes in Adolescent Mental Health during the COVID-19 Pandemic. J. Youth Adolesc. 2021, 50, 44–57. [Google Scholar] [CrossRef] [PubMed]
- Casagrande, M.; Favieri, F.; Tambelli, R.; Forte, G. The Enemy Who Sealed the World: Effects Quarantine Due to the COVID-19 on Sleep Quality, Anxiety, and Psychological Distress in the Italian Population. Sleep Med. 2020, 75, 12–20. [Google Scholar] [CrossRef] [PubMed]
- Abd-Alrazaq, A.; Alhuwail, D.; Househ, M.; Hamdi, M.; Shah, Z. Top Concerns of Tweeters During the COVID-19 Pandemic: Infoveillance Study. J. Med. Internet Res. 2020, 22, e19016. [Google Scholar] [CrossRef] [PubMed]
- Che, X.; Ip, B. Social Networks in China; Chandos Publishing: Hull, UK, 2017; ISBN 978-0-08-101935-1. [Google Scholar]
- Wang, F.; Guo, J.; Yang, G. Study on Positive Psychology from 1999 to 2021: A Bibliometric Analysis. Front. Psychol. 2023, 14, 1101157. [Google Scholar] [CrossRef] [PubMed]
- Akintunde, T.Y.; Musa, T.H.; Musa, H.H.; Musa, I.H.; Chen, S.; Ibrahim, E.; Tassang, A.E.; Helmy, M.S.E.D.M. Bibliometric Analysis of Global Scientific Literature on Effects of COVID-19 Pandemic on Mental Health. Asian J. Psychiatry 2021, 63, 102753. [Google Scholar] [CrossRef]
- Maalouf, F.T.; Mdawar, B.; Meho, L.I.; Akl, E.A. Mental Health Research in Response to the COVID-19, Ebola, and H1N1 Outbreaks: A Comparative Bibliometric Analysis. J. Psychiatr. Res. 2021, 132, 198–206. [Google Scholar] [CrossRef]
- Andráško, I. Why People (Do Not) Adopt the Private Precautionary and Mitigation Measures: A Review of the Issue from the Perspective of Recent Flood Risk Research. Water 2021, 13, 140. [Google Scholar] [CrossRef]
- Jantsch, A.; Veenhoven, R. Happiness and Wealth: A Literature Review Using an Online Findings Archive. Glob. J. Hum. -Soc. Sci. 2022, 22, 25–68. [Google Scholar] [CrossRef]

| Exploration Steps | Seach Fields/Filters | Description | Query | Query Number | Count |
|---|---|---|---|---|---|
| 1 | Title | Contains happiness specific keywords * | ((((((((((((((((((((((((TI = (Happiness_measurement)) OR TI = (Subjective_well-being)) OR TI = (Life_satisfaction)) OR TI = (Happiness_assessment)) OR TI = (Well-being_measurement)) OR TI = (Quality_of_life_assessment)) OR TI = (Happiness_scale)) OR TI = (Well-being_indicators)) OR TI = (Subjective_happiness)) OR TI = (Well-being_survey)) OR TI = (Happiness_index)) OR TI = (Well-being_measurement_tools)) OR TI = (Happiness_and_life_evaluation)) OR TI = (Positive_psychology_measures)) OR TI = (Psychological_well-being)) OR TI = (Life_quality_assessment)) OR TI = (Gross_National_Happiness )) OR TI = (Happiness_and_social indicators)) OR TI = (Societal_happiness_measurement)) OR TI = (Global_happiness_report)) OR TI = (Happiness_and_public_policy)) OR TI = (Well-being_economics)) OR TI = (Happiness_research_methods)) OR TI = (Personal_happiness_assessment)) OR TI = (National_happiness_surveys) | #1 | 19,274 |
| 2 | Abstract | Contains happiness specific keywords * | ((((((((((((((((((((((((AB = (Happiness_measurement)) OR AB = (Subjective_well-being)) OR AB = (Life_satisfaction)) OR AB = (Happiness_assessment)) OR TI = (Well-being_measurement)) OR AB = (Quality_of_life_assessment)) OR AB = (Happiness_scale)) OR AB = (Well-being_indicators)) OR AB = (Subjective_happiness)) OR AB = (Well-being_survey)) OR AB = (Happiness_index)) OR AB = (Well-being_measurement_tools)) OR AB = (Happiness_and_life_evaluation)) OR AB = (Positive_psychology_measures)) OR AB = (Psychological_well-being)) OR AB = (Life_quality_assessment)) OR AB = (Gross_National_Happiness )) OR AB = (Happiness_and_social indicators)) OR AB = (Societal_happiness_measurement)) OR AB = (Global_happiness_report)) OR AB = (Happiness_and_public_policy)) OR AB = (Well-being_economics)) OR AB = (Happiness_research_methods)) OR AB = (Personal_happiness_assessment)) OR AB = (National_happiness_surveys) | #2 | 43,567 |
| 3 | Keywords | Contains happiness specific keywords * | ((((((((((((((((((((((((AK = (Happiness_measurement)) OR AK = (Subjective_well-being)) OR AK = (Life_satisfaction)) OR AK = (Happiness_assessment)) OR TI = (Well-being_measurement)) OR AK = (Quality_of_life_assessment)) OR AK = (Happiness_scale)) OR AK = (Well-being_indicators)) OR AK = (Subjective_happiness)) OR AK = (Well-being_survey)) OR AK = (Happiness_index)) OR AK = (Well-being_measurement_tools)) OR AK = (Happiness_and_life_evaluation)) OR AK = (Positive_psychology_measures)) OR AK = (Psychological_well-being)) OR AK = (Life_quality_assessment)) OR AK = (Gross_National_Happiness )) OR AK = (Happiness_and_social indicators)) OR AK = (Societal_happiness_measurement)) OR AK = (Global_happiness_report)) OR AK = (Happiness_and_public_policy)) OR AK = (Well-being_economics)) OR AK = (Happiness_research_methods)) OR AK = (Personal_happiness_assessment)) OR AK = (National_happiness_surveys) | #3 | 19,274 |
| 4 | Title/Abstract/Keywords | Contains one of the happiness specific keywords | #1 OR #2 OR #3 | #4 | 52,577 |
| 5 | Language | Limit to English | (#4) AND LA = (English) | #5 | 50,150 |
| 6 | Document Type | Limit to Article | (#5) AND DT = (Article) | #6 | 43,229 |
| 7 | COVID-19 reference | Limit to the papers considering the COVID-19 occurrence | (#6) AND (((((TI = (COVID-19)) OR TI = (coronavirus)) OR AB = (COVID-19)) OR AB = (coronavirus)) OR AK = (COVID-19)) OR AK = (coronavirus) | #7 | 2589 |
| 8 | Publication Year | Limit to 2022 | (#7) NOT PY = (2023) | #8 | 1932 |
| Analysis Steps | Explanation | Indicators Used |
|---|---|---|
| 1 | Dataset overview | Timespan, Sources, documents, average years from publication, average citations per documents, average citations per year per document, references, annual scientific production evolution, number of keywords plus, number of authors’ keywords, number of authors, authors’ appearances, authors of single-authored documents, authors of multi-authored documents, single-authored documents, documents per author, authors per document, co-authors per documents, and collaboration index |
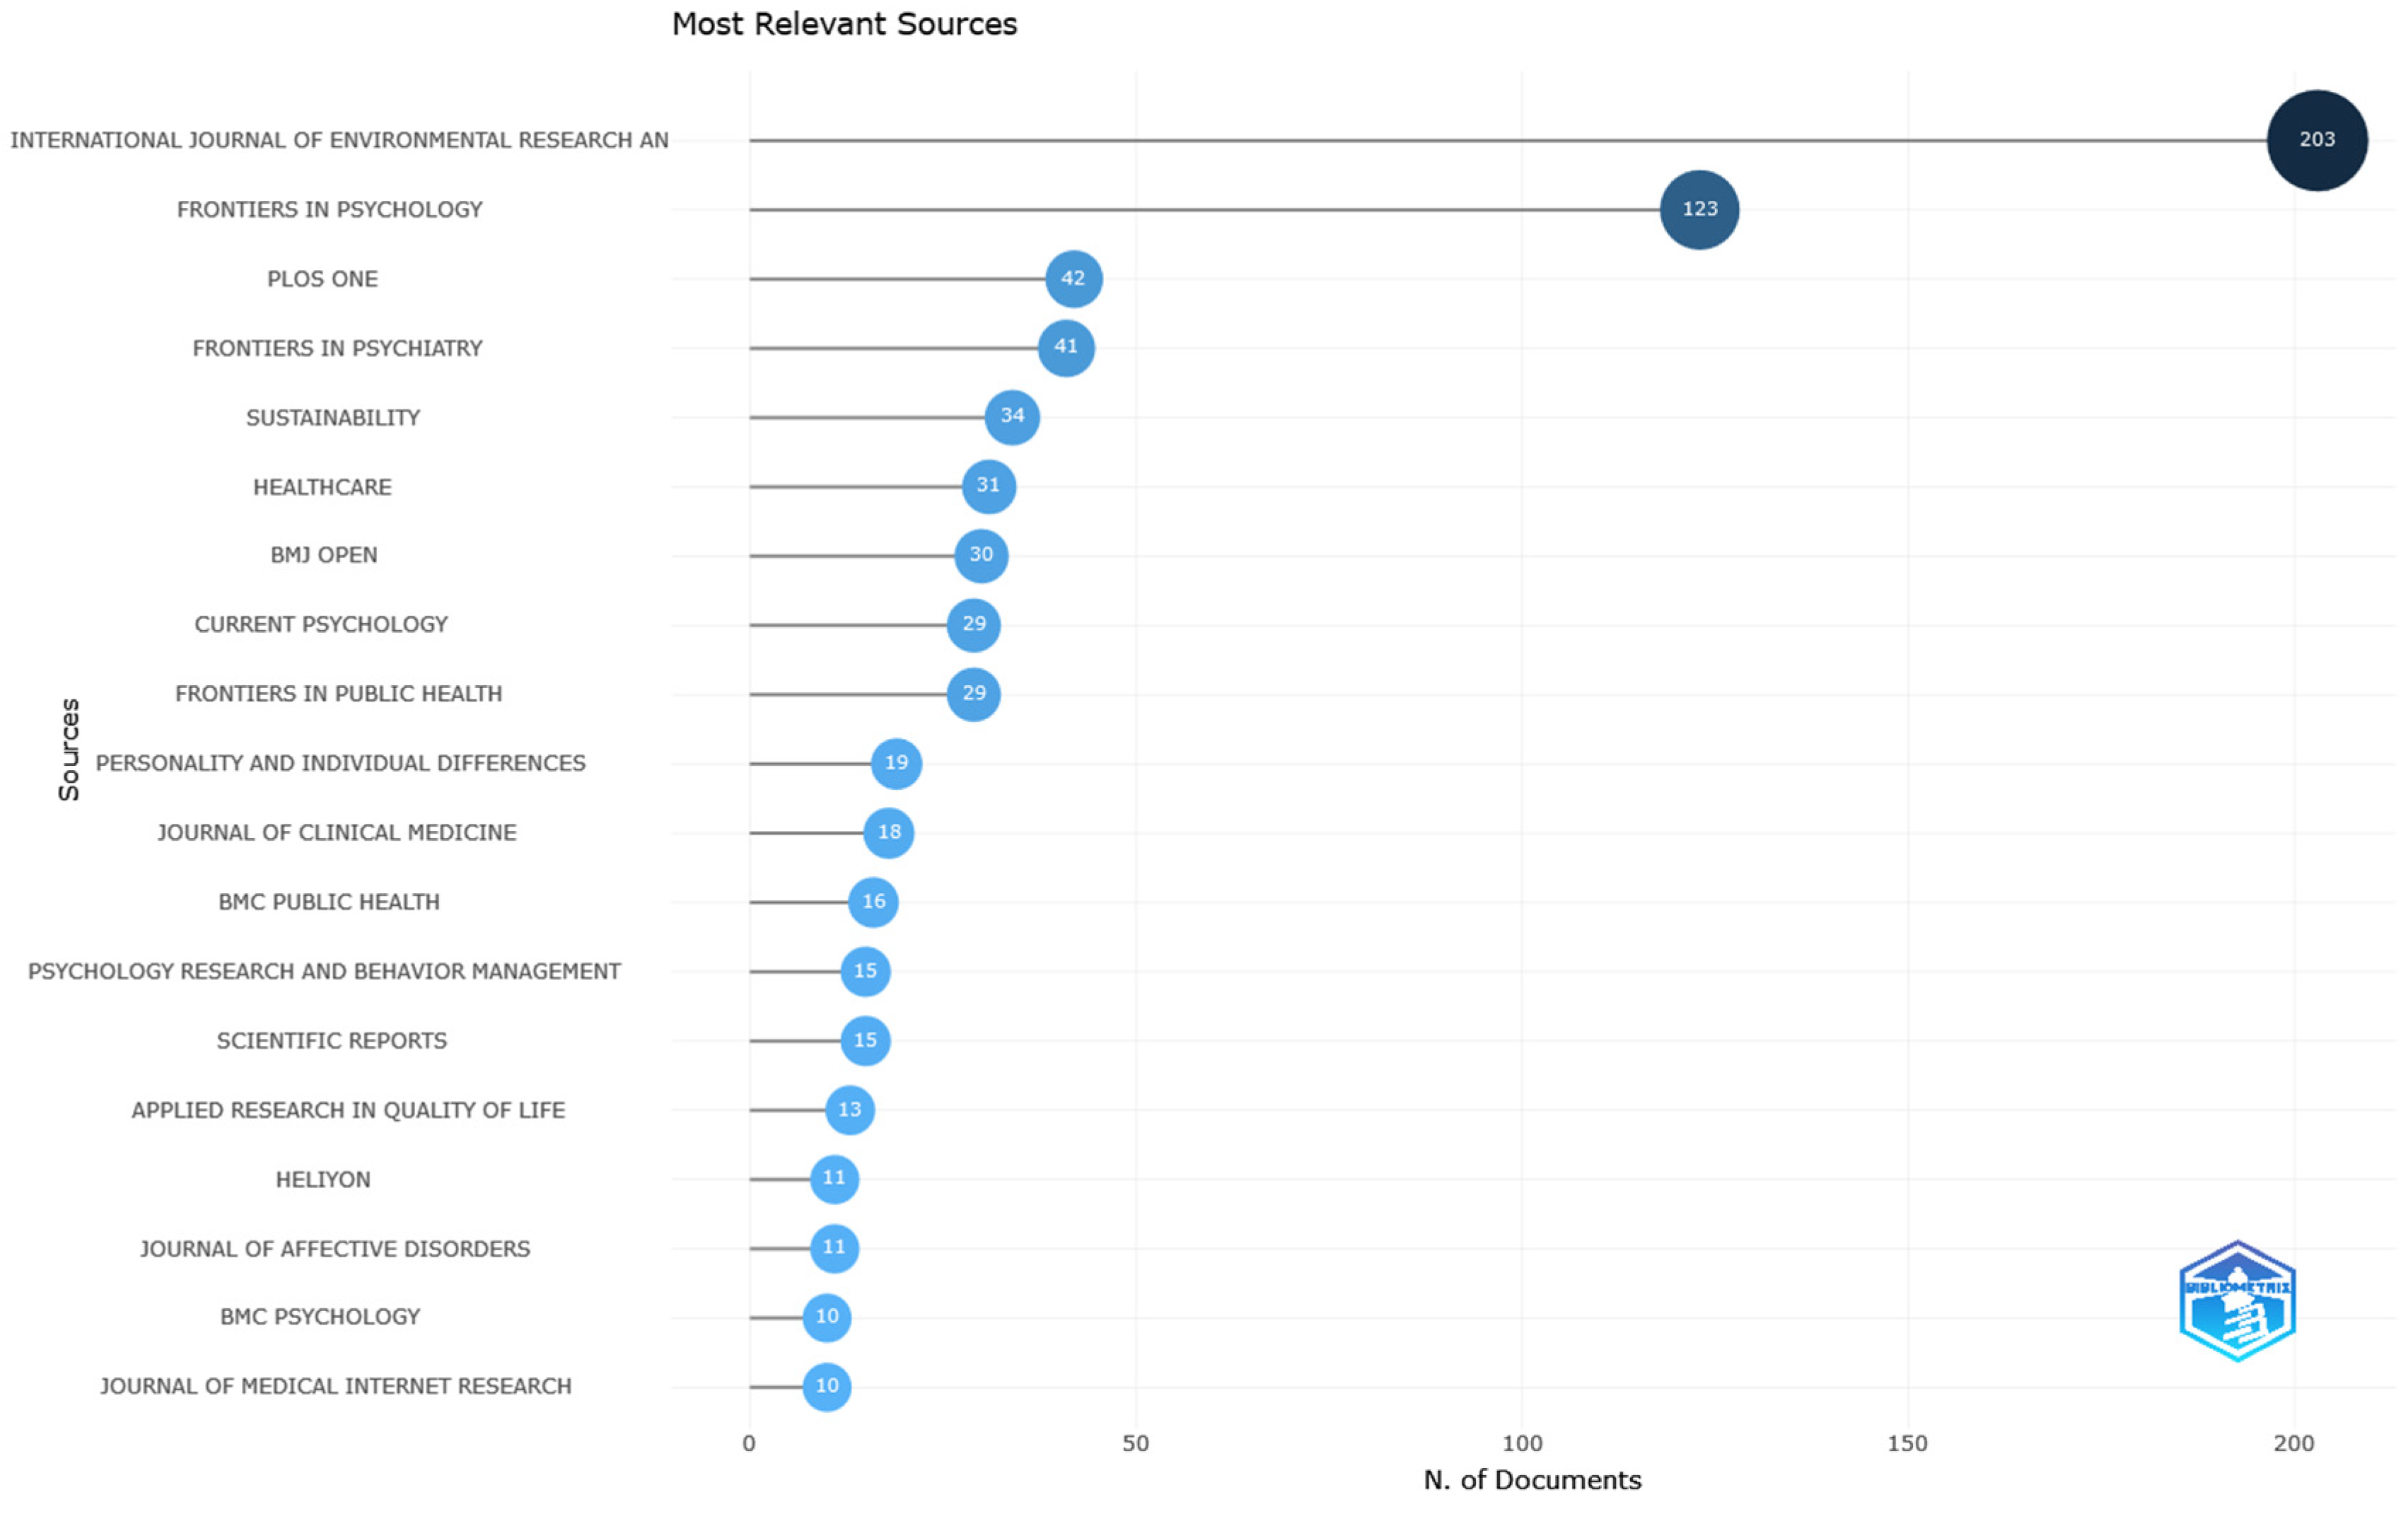
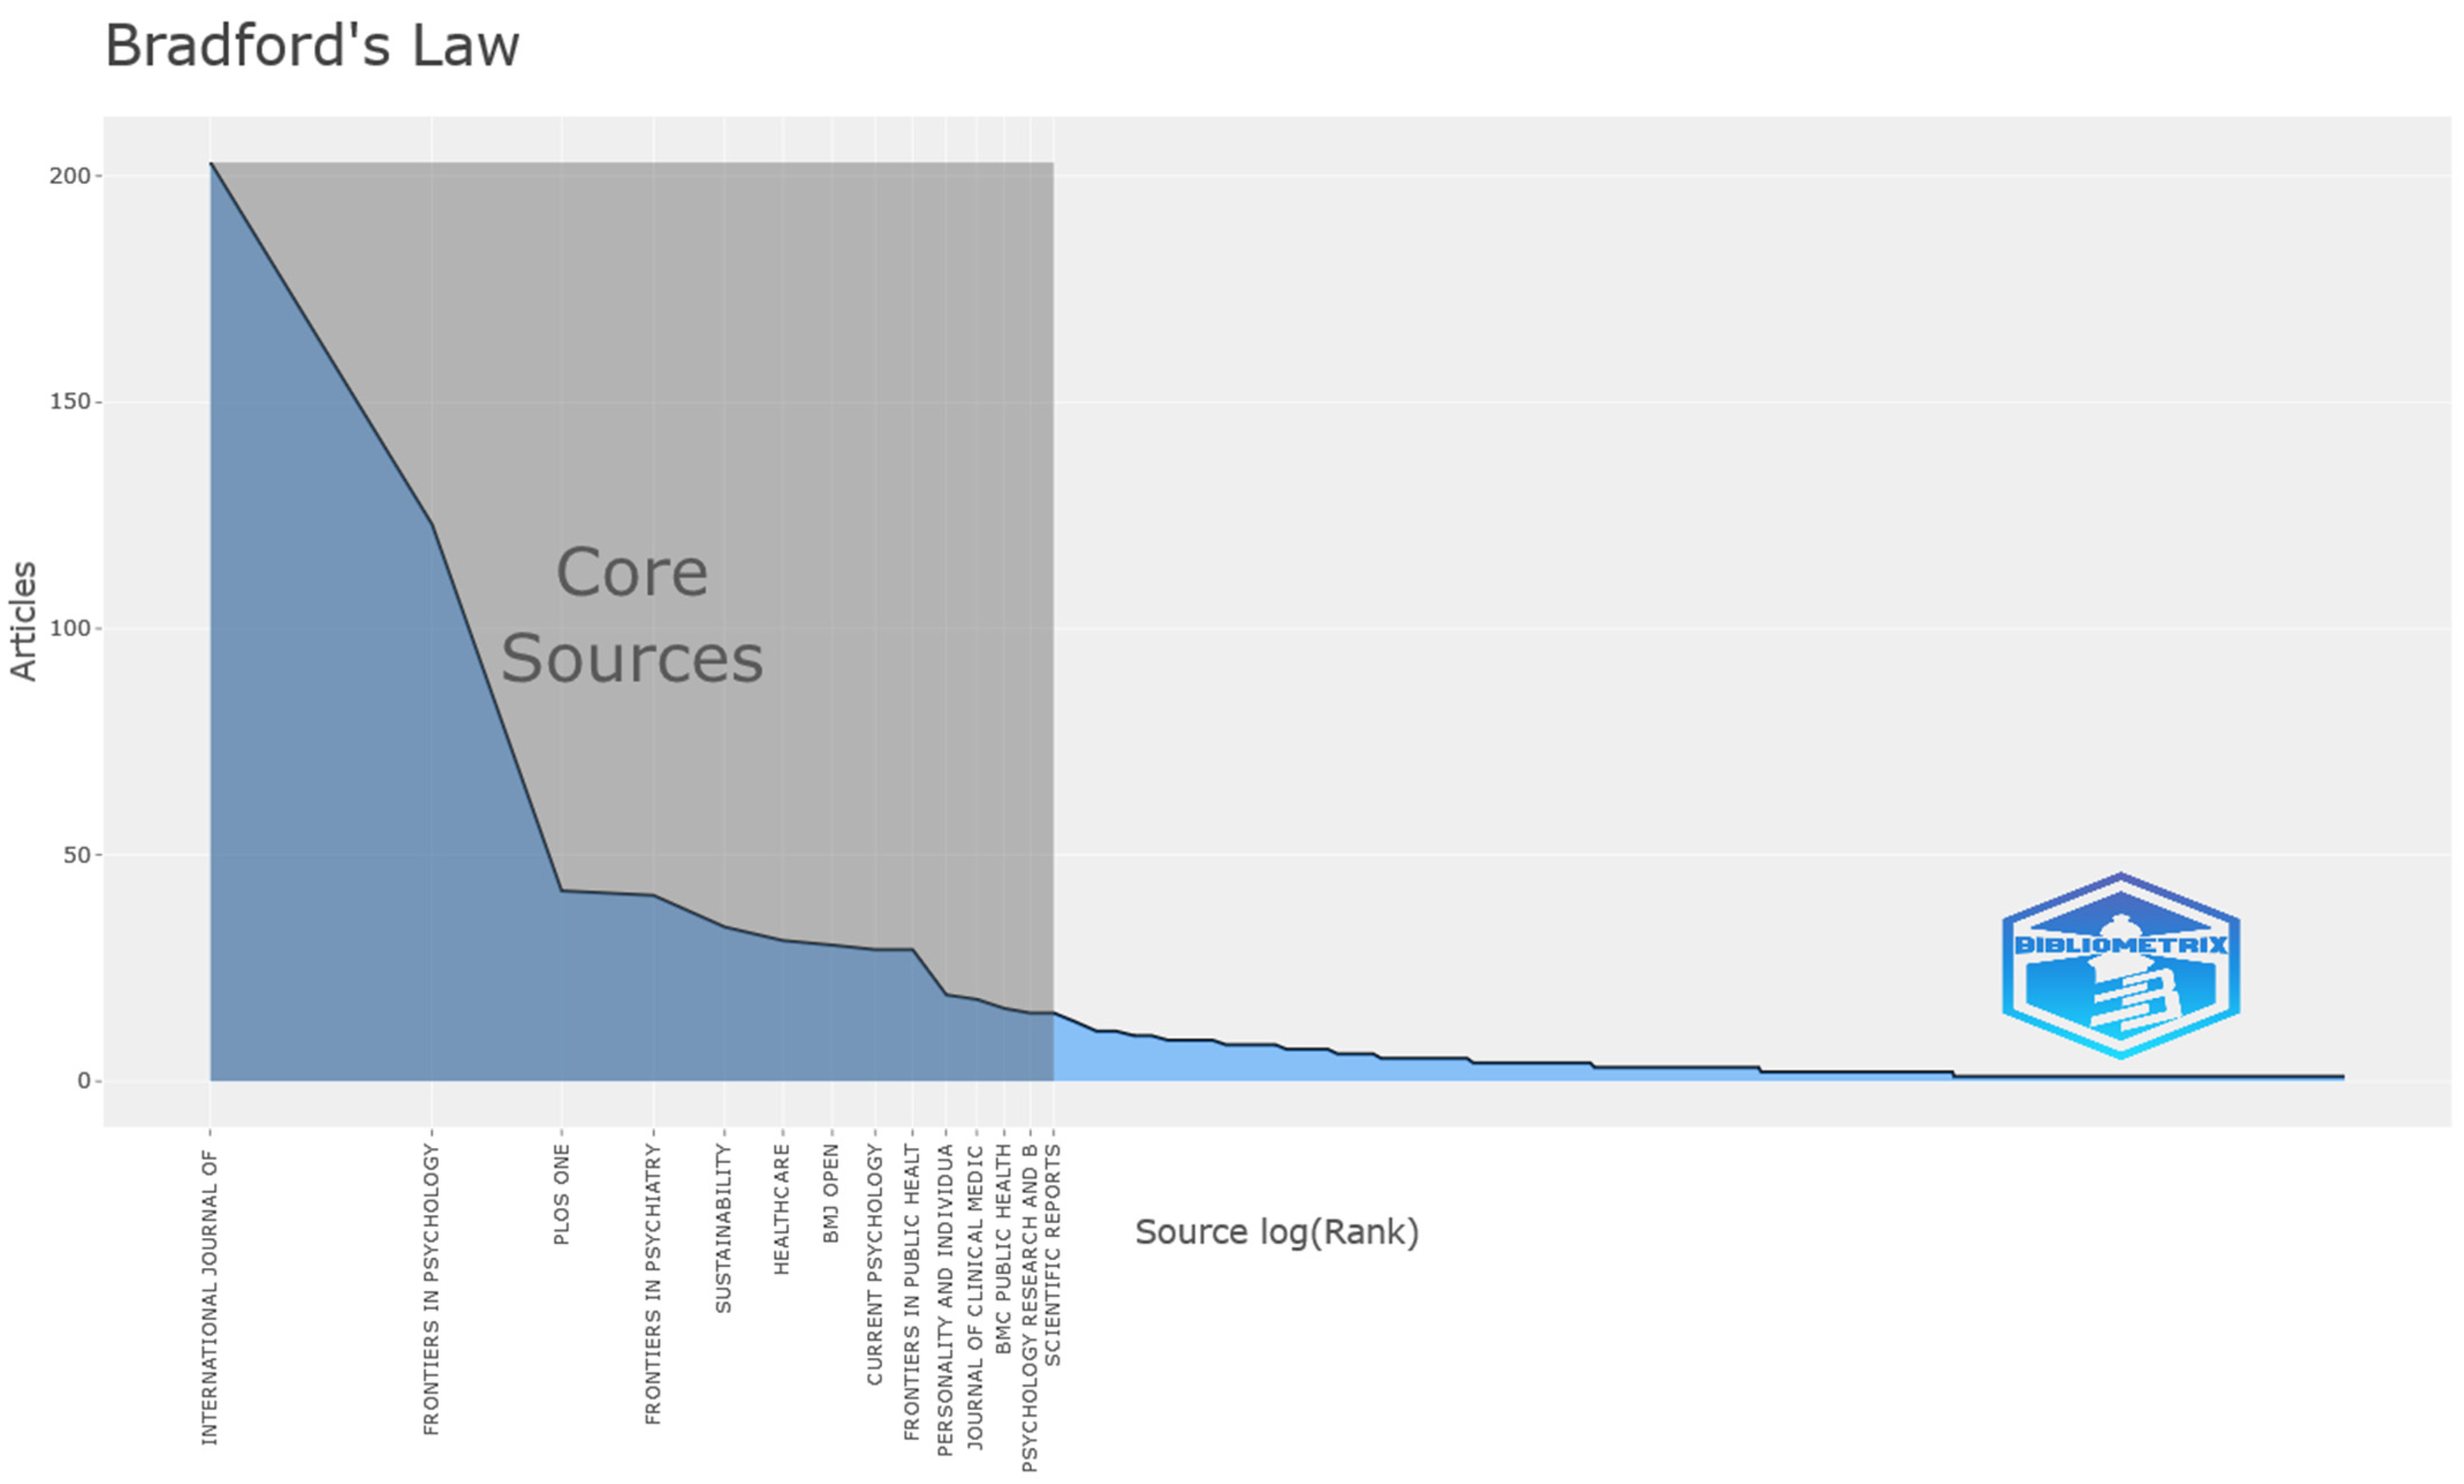
| 2 | Sources analysis | Most relevant journals based on number of published documents, most relevant journals based on H-index, source clustering based on Bradford’s law, and journal’s growth based on the number of papers |
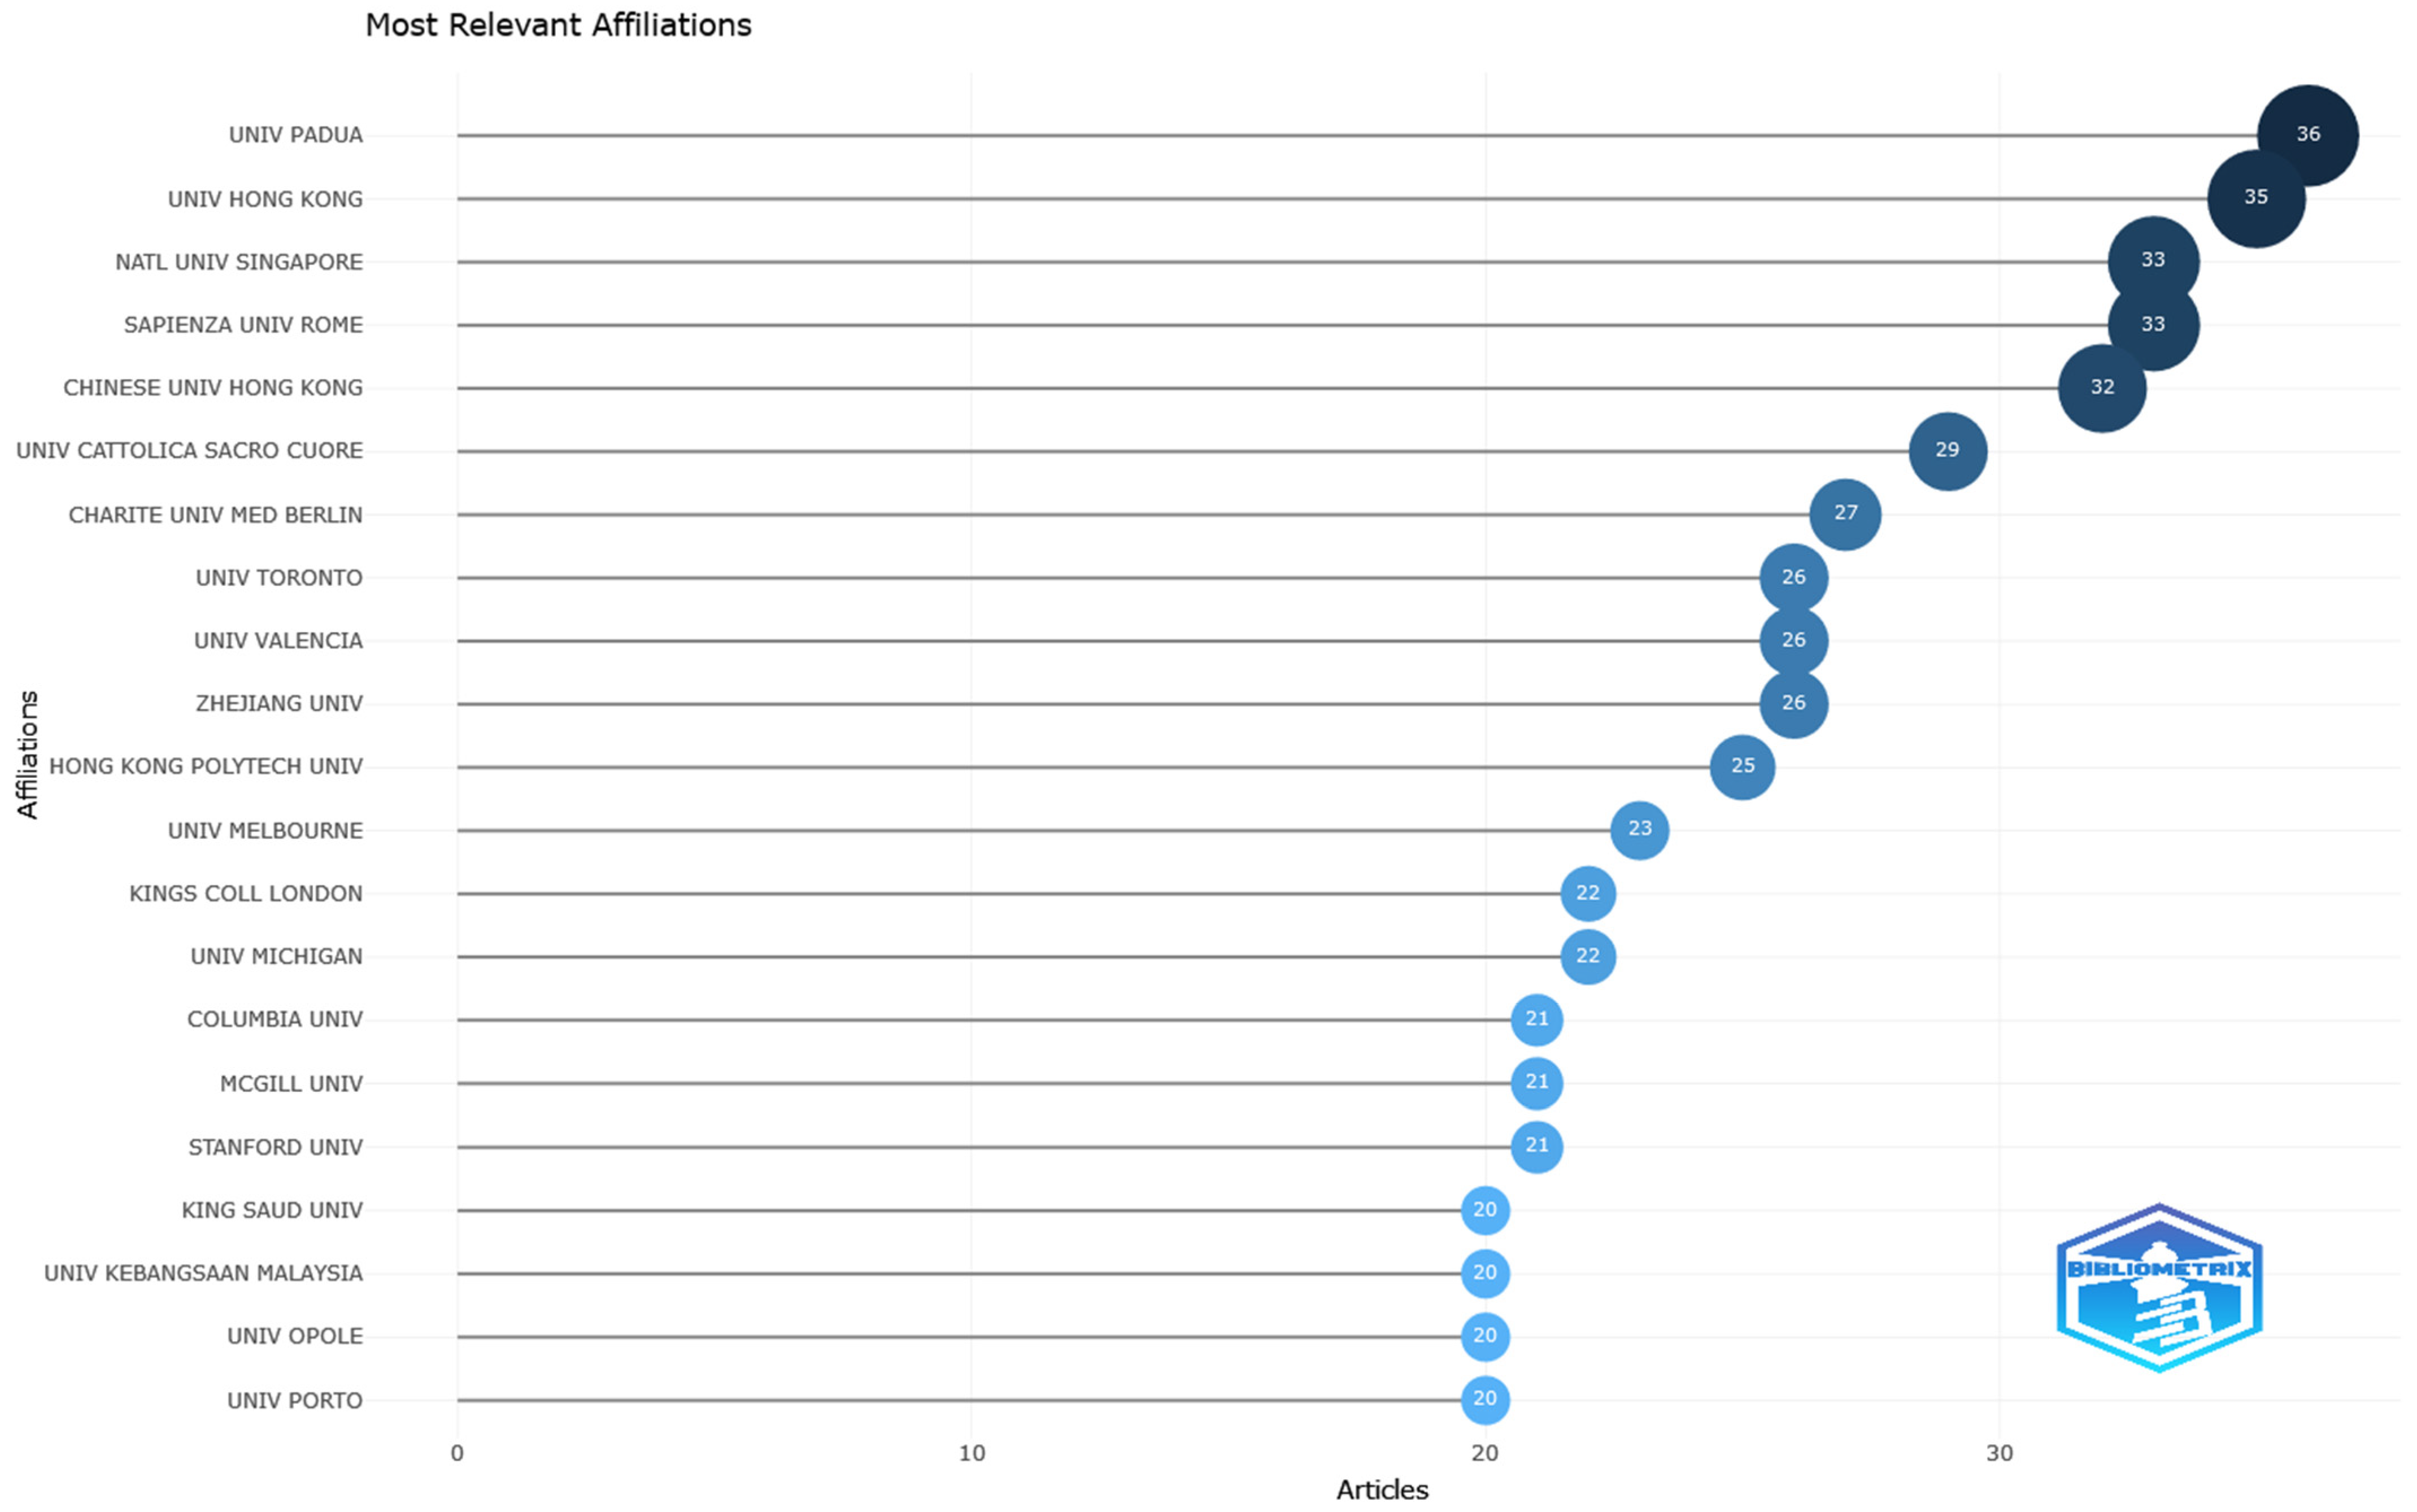
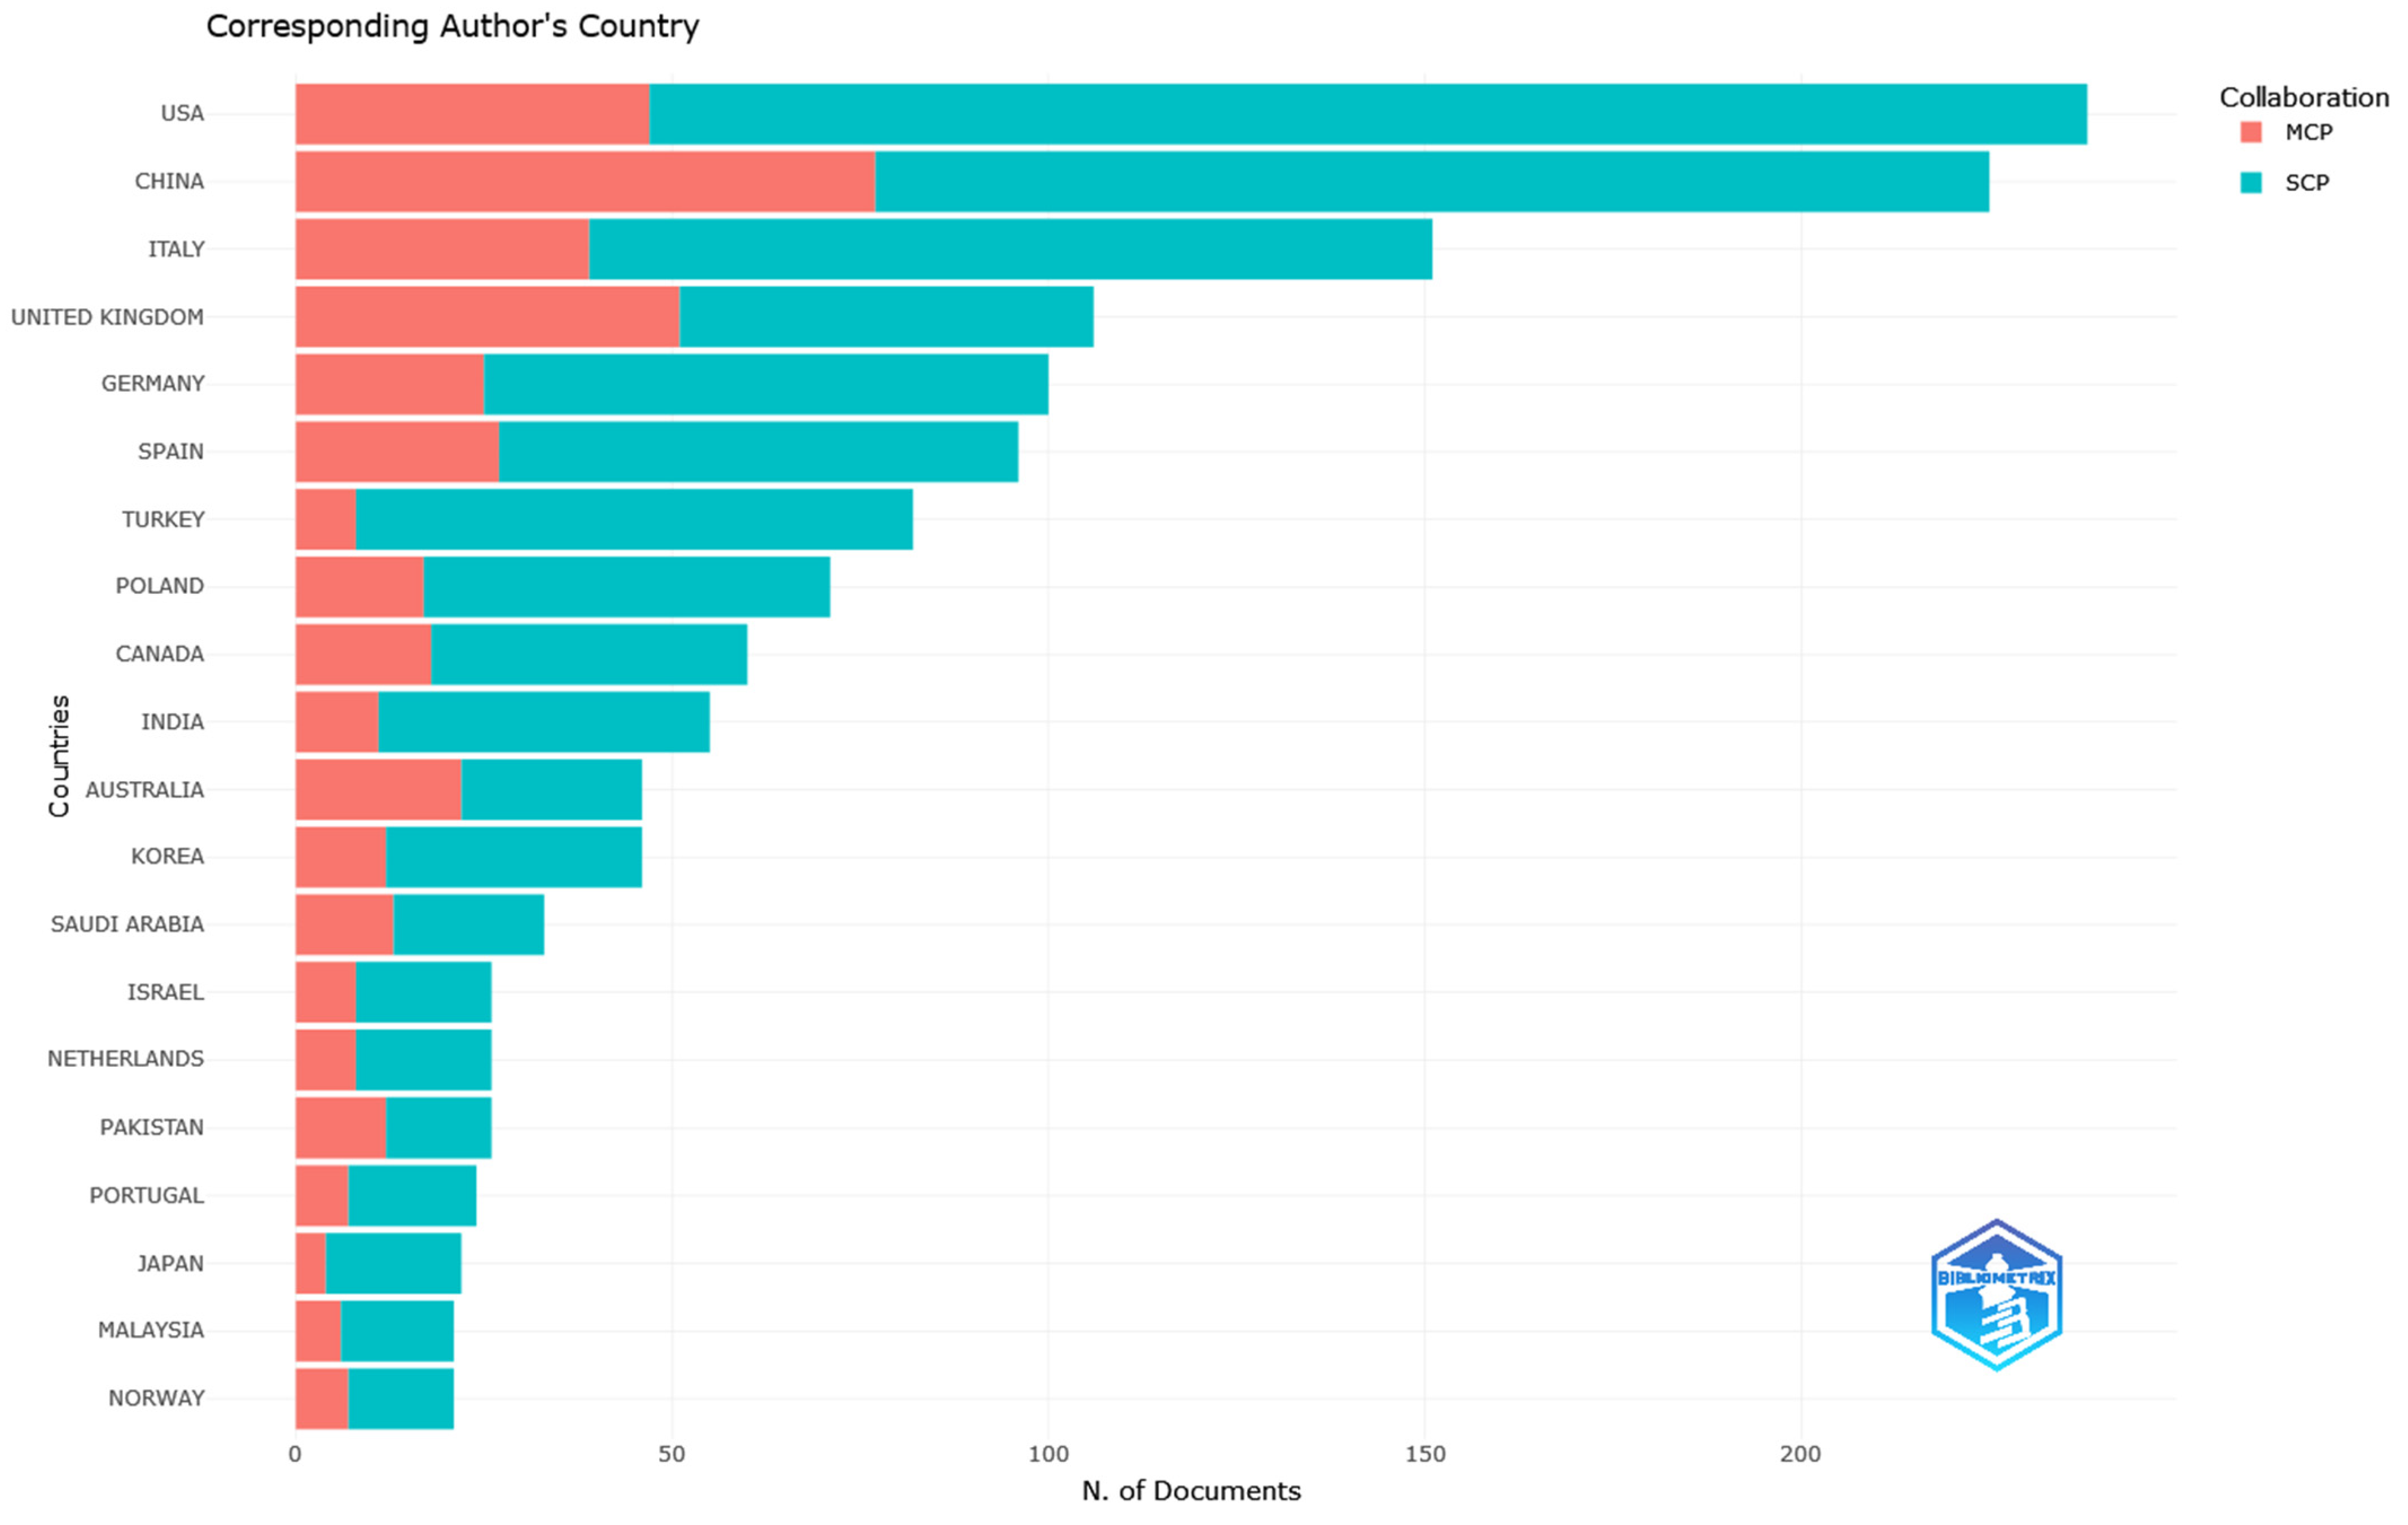
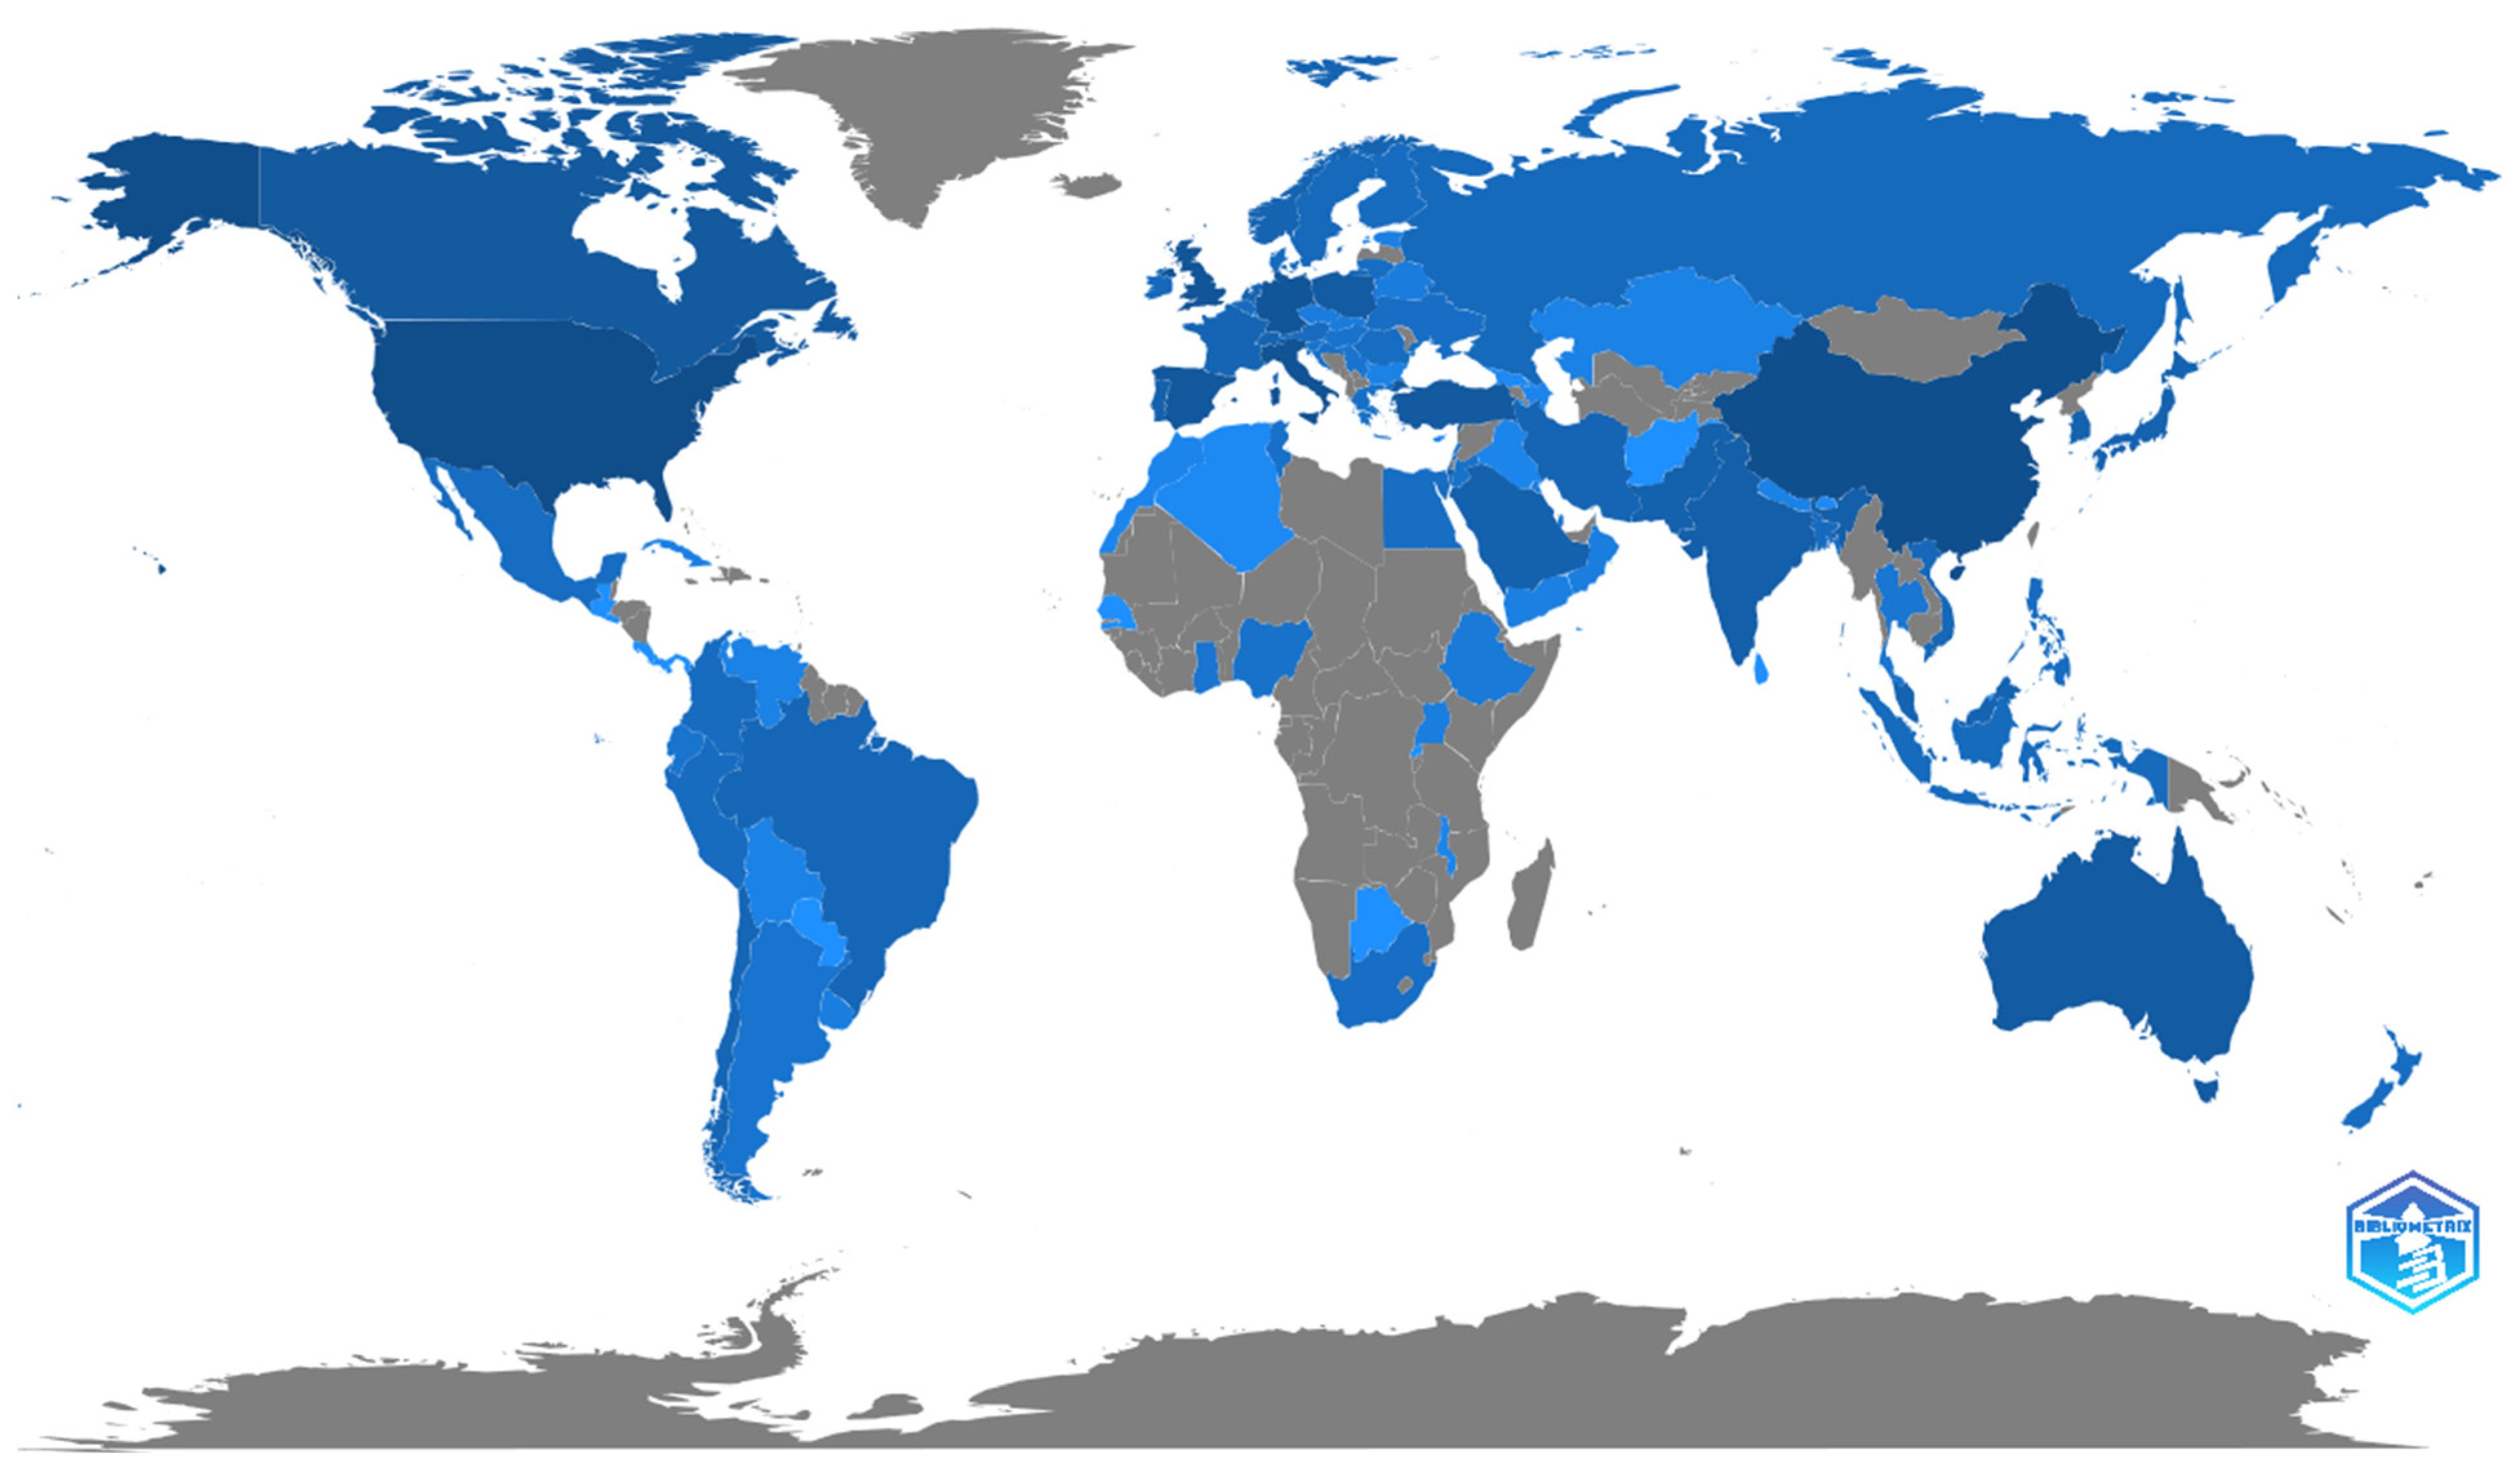
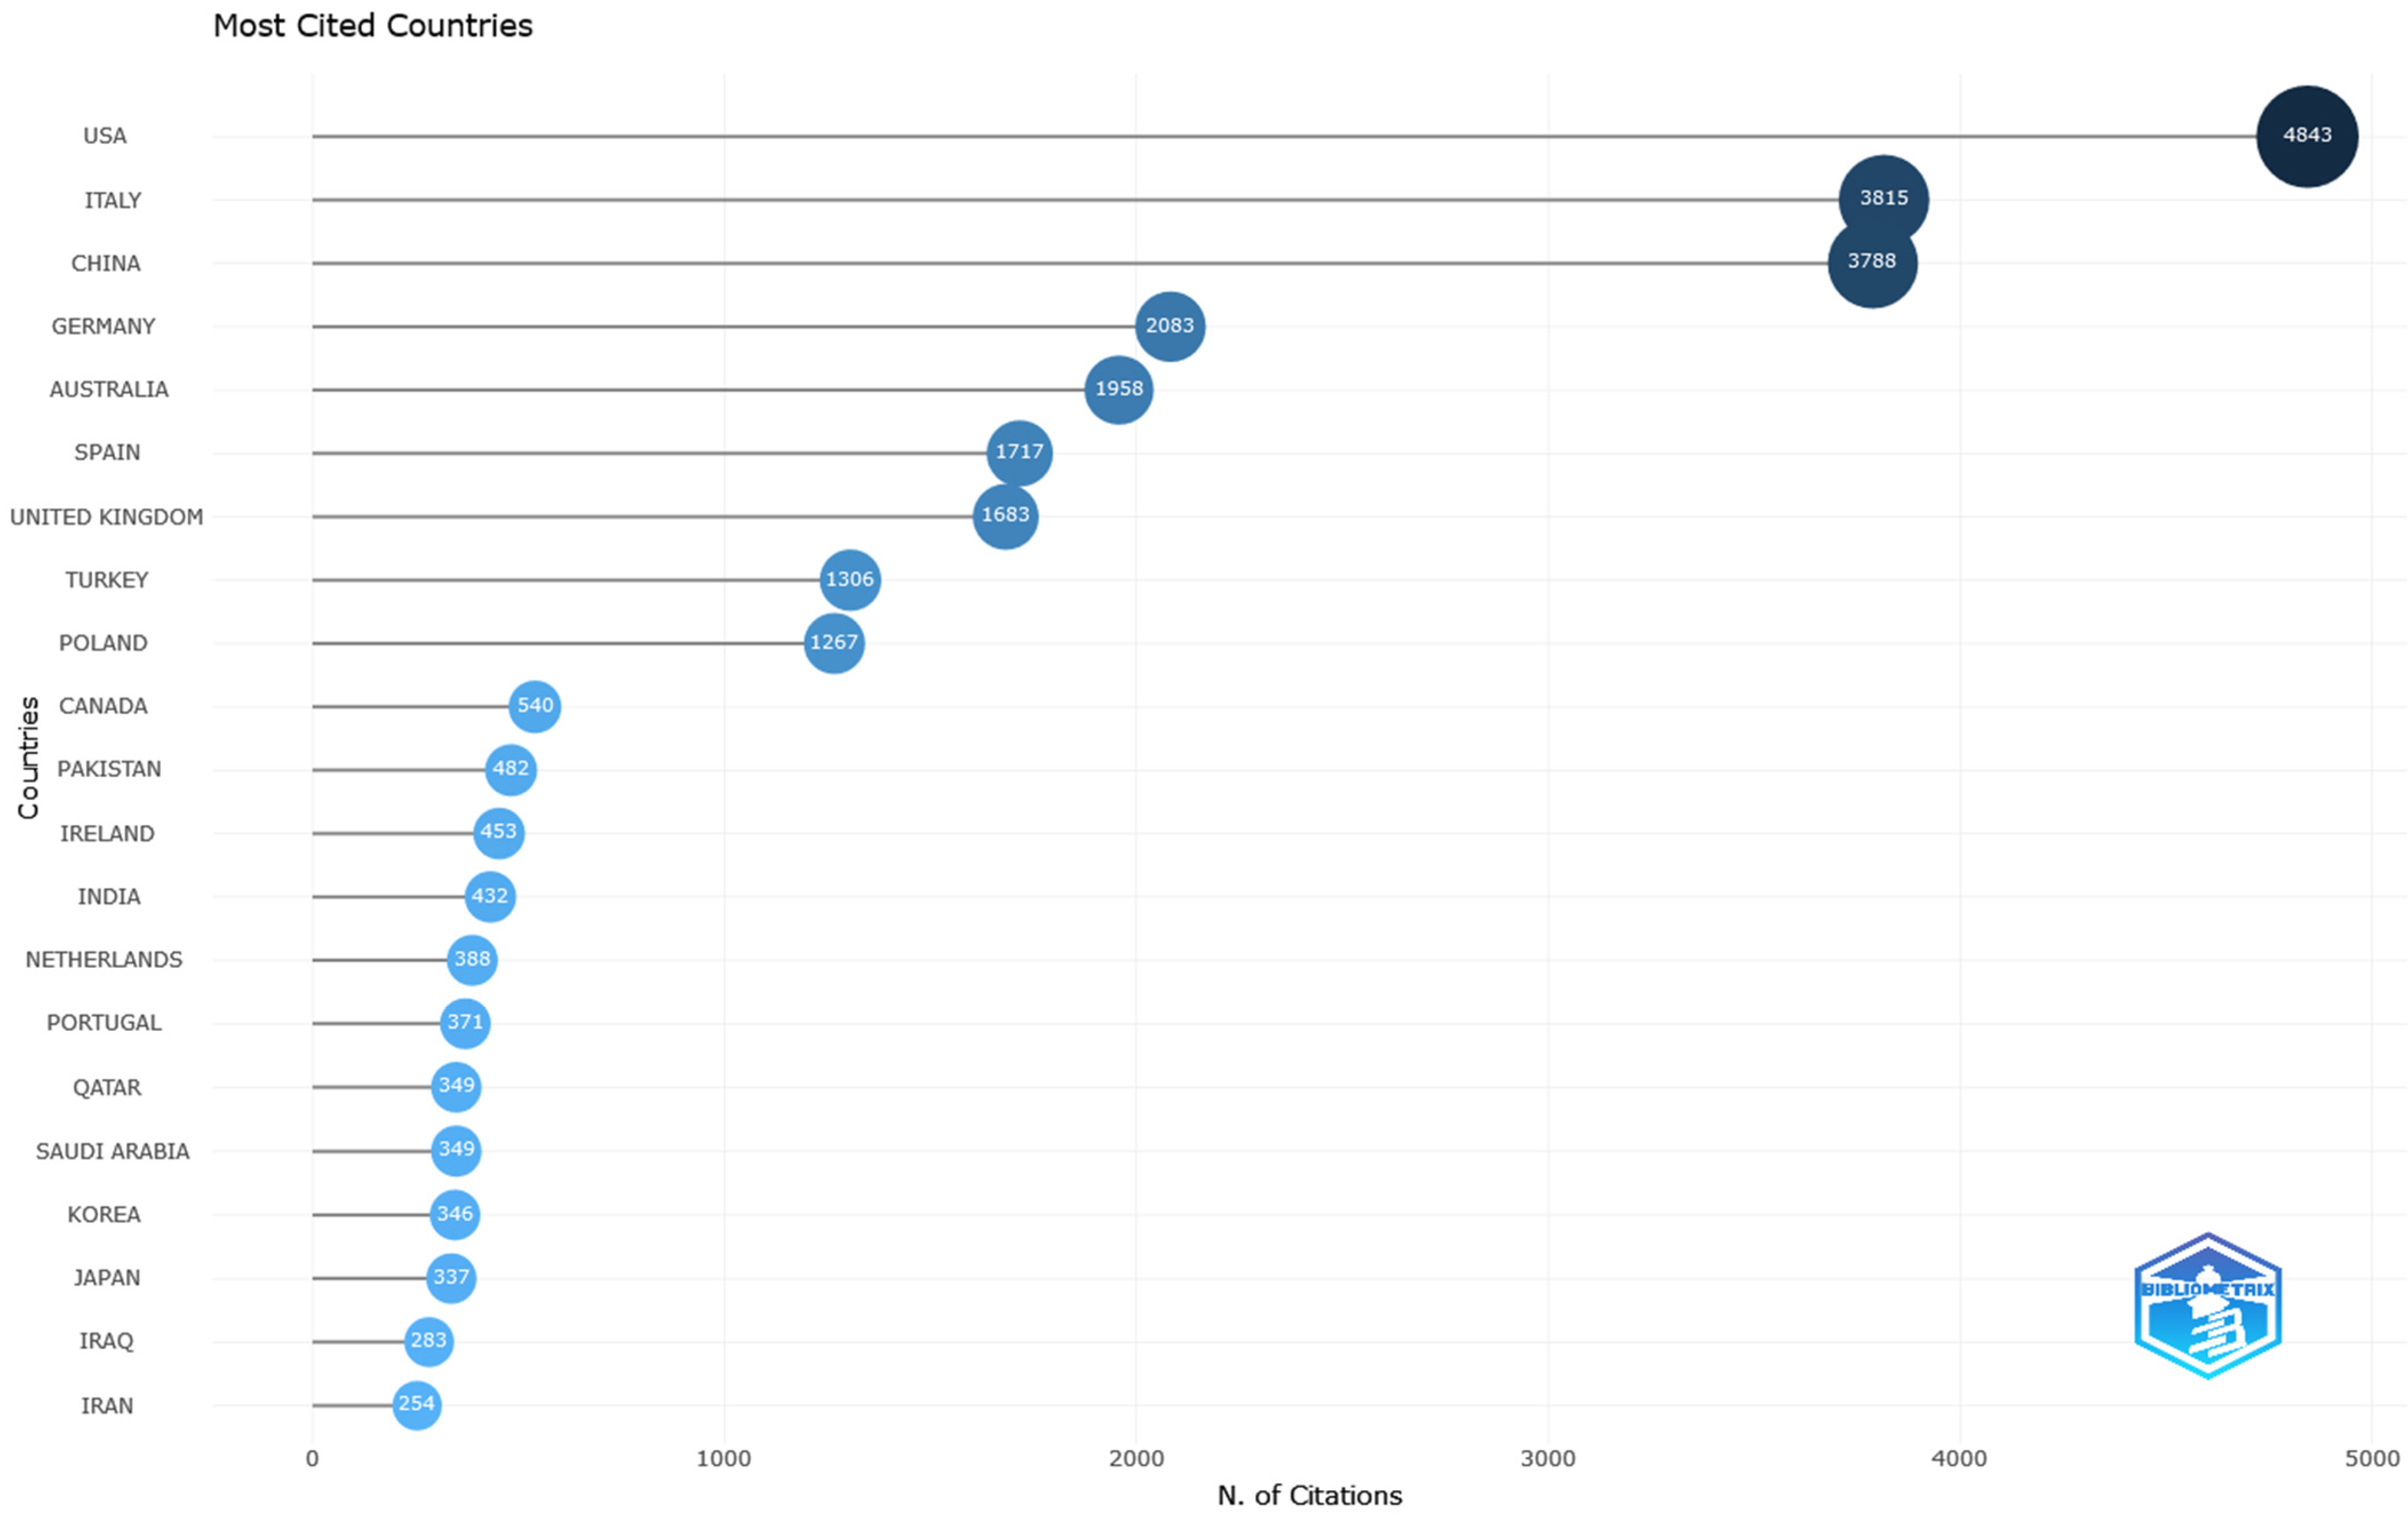
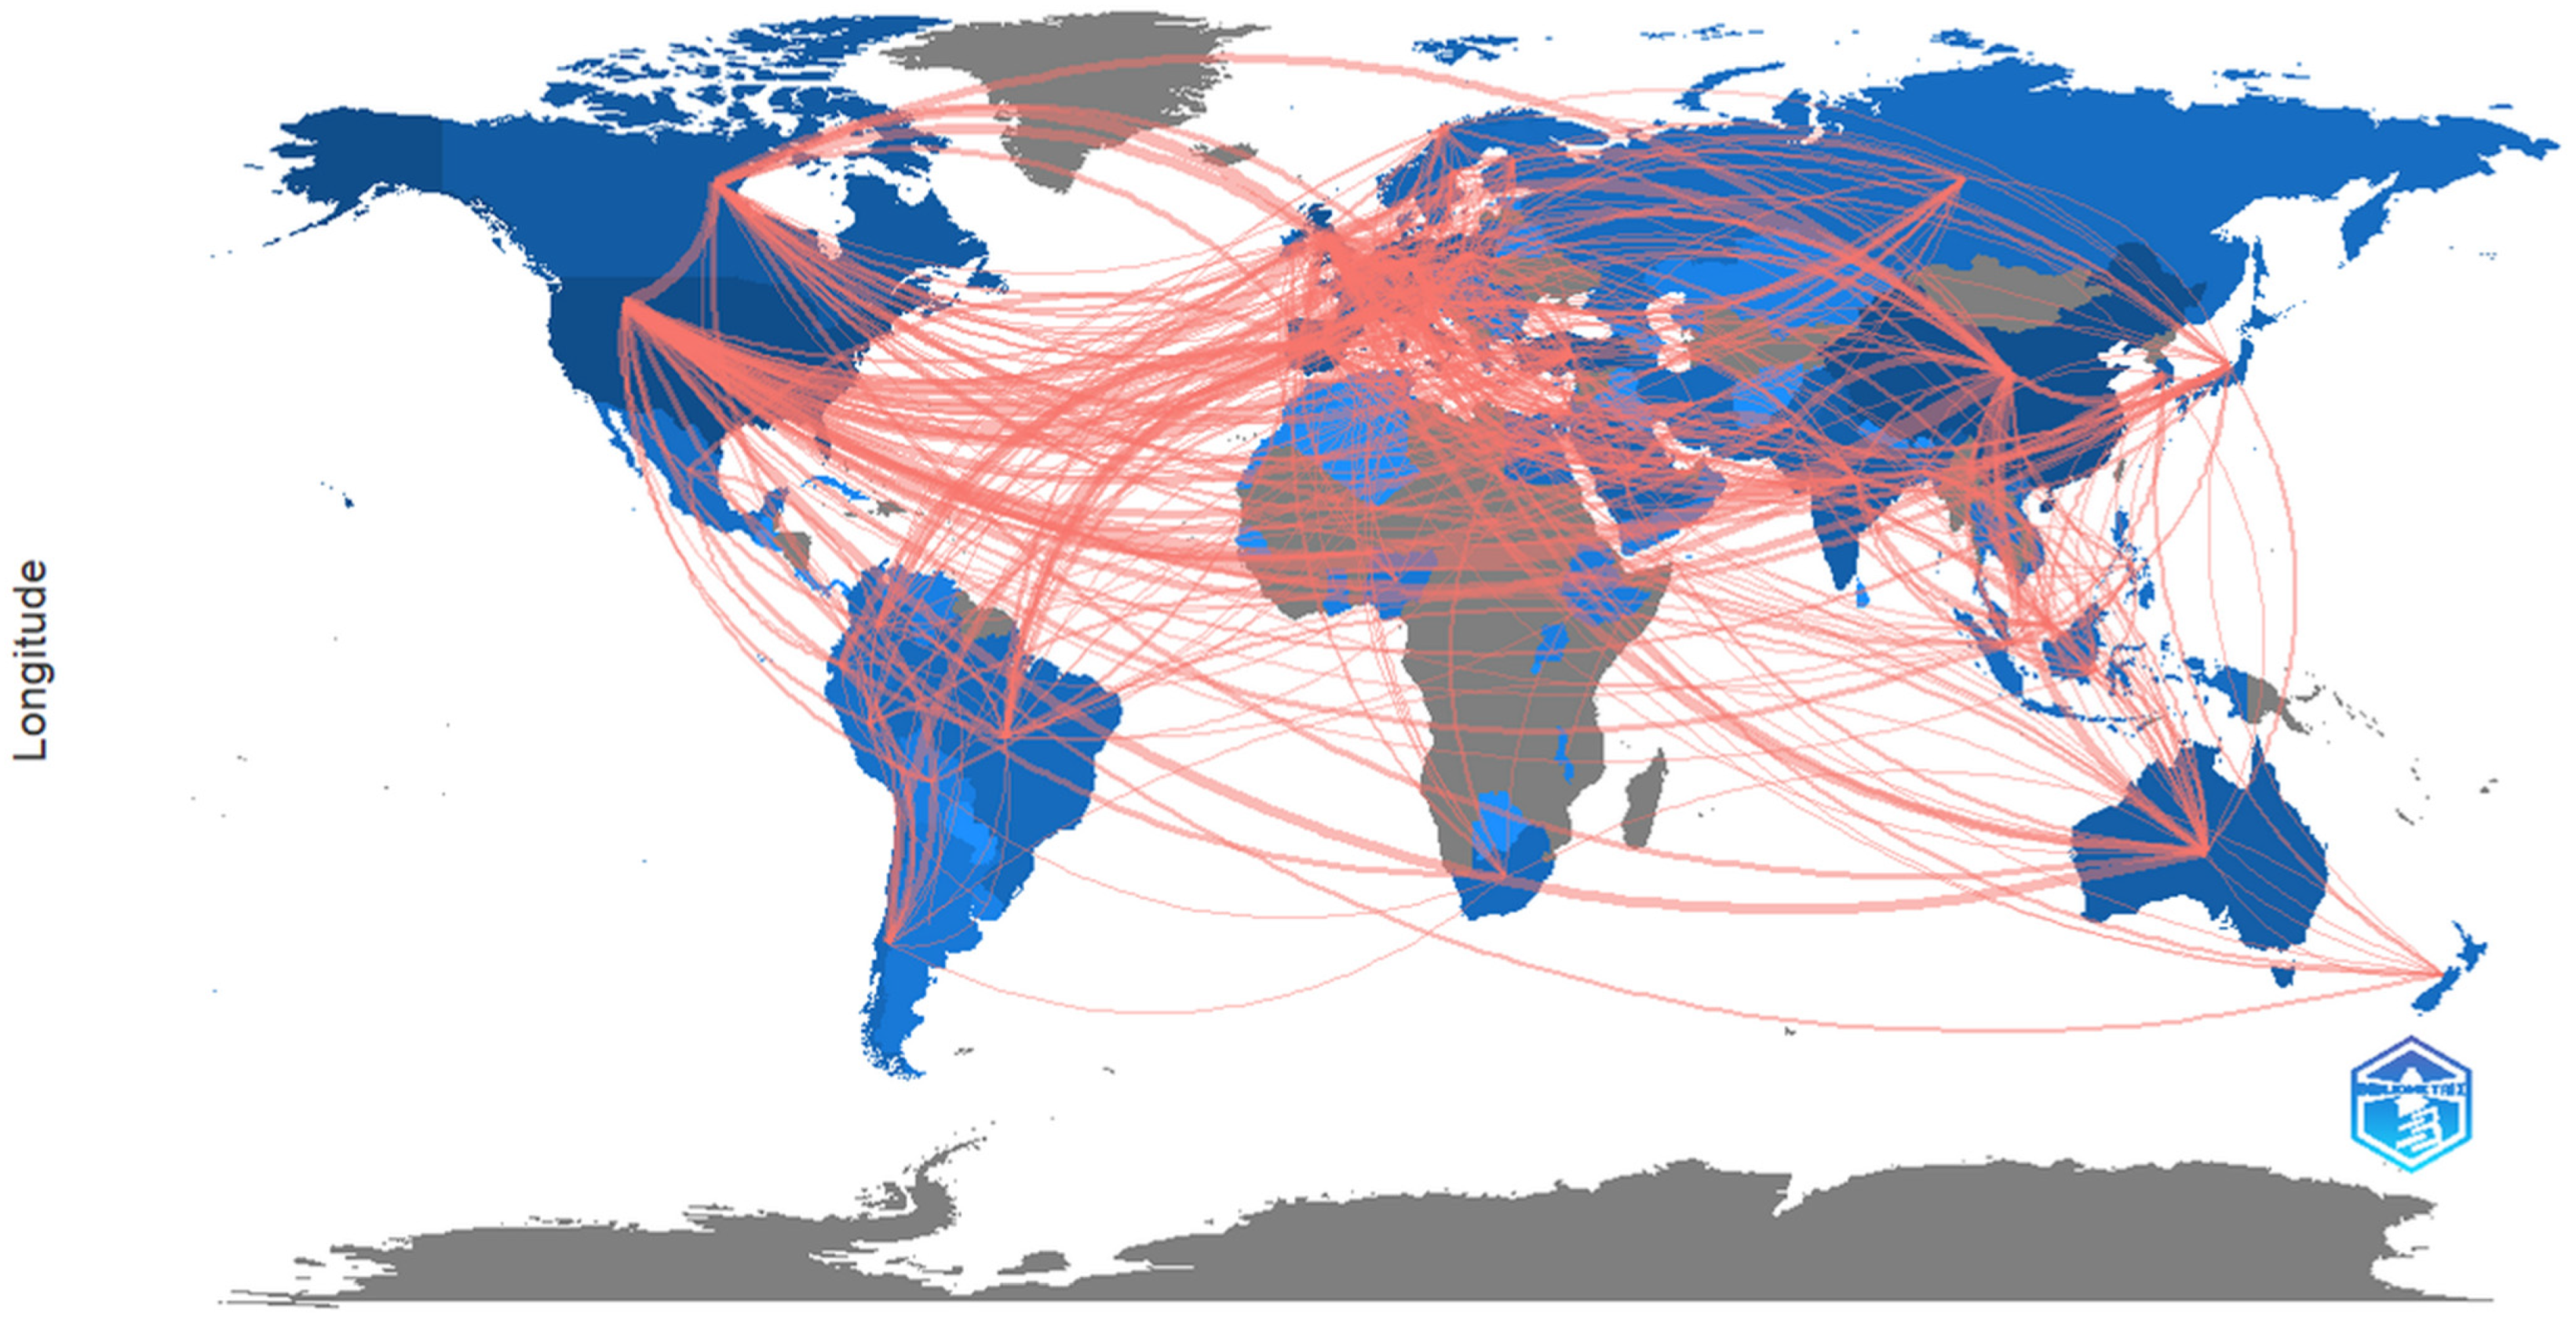
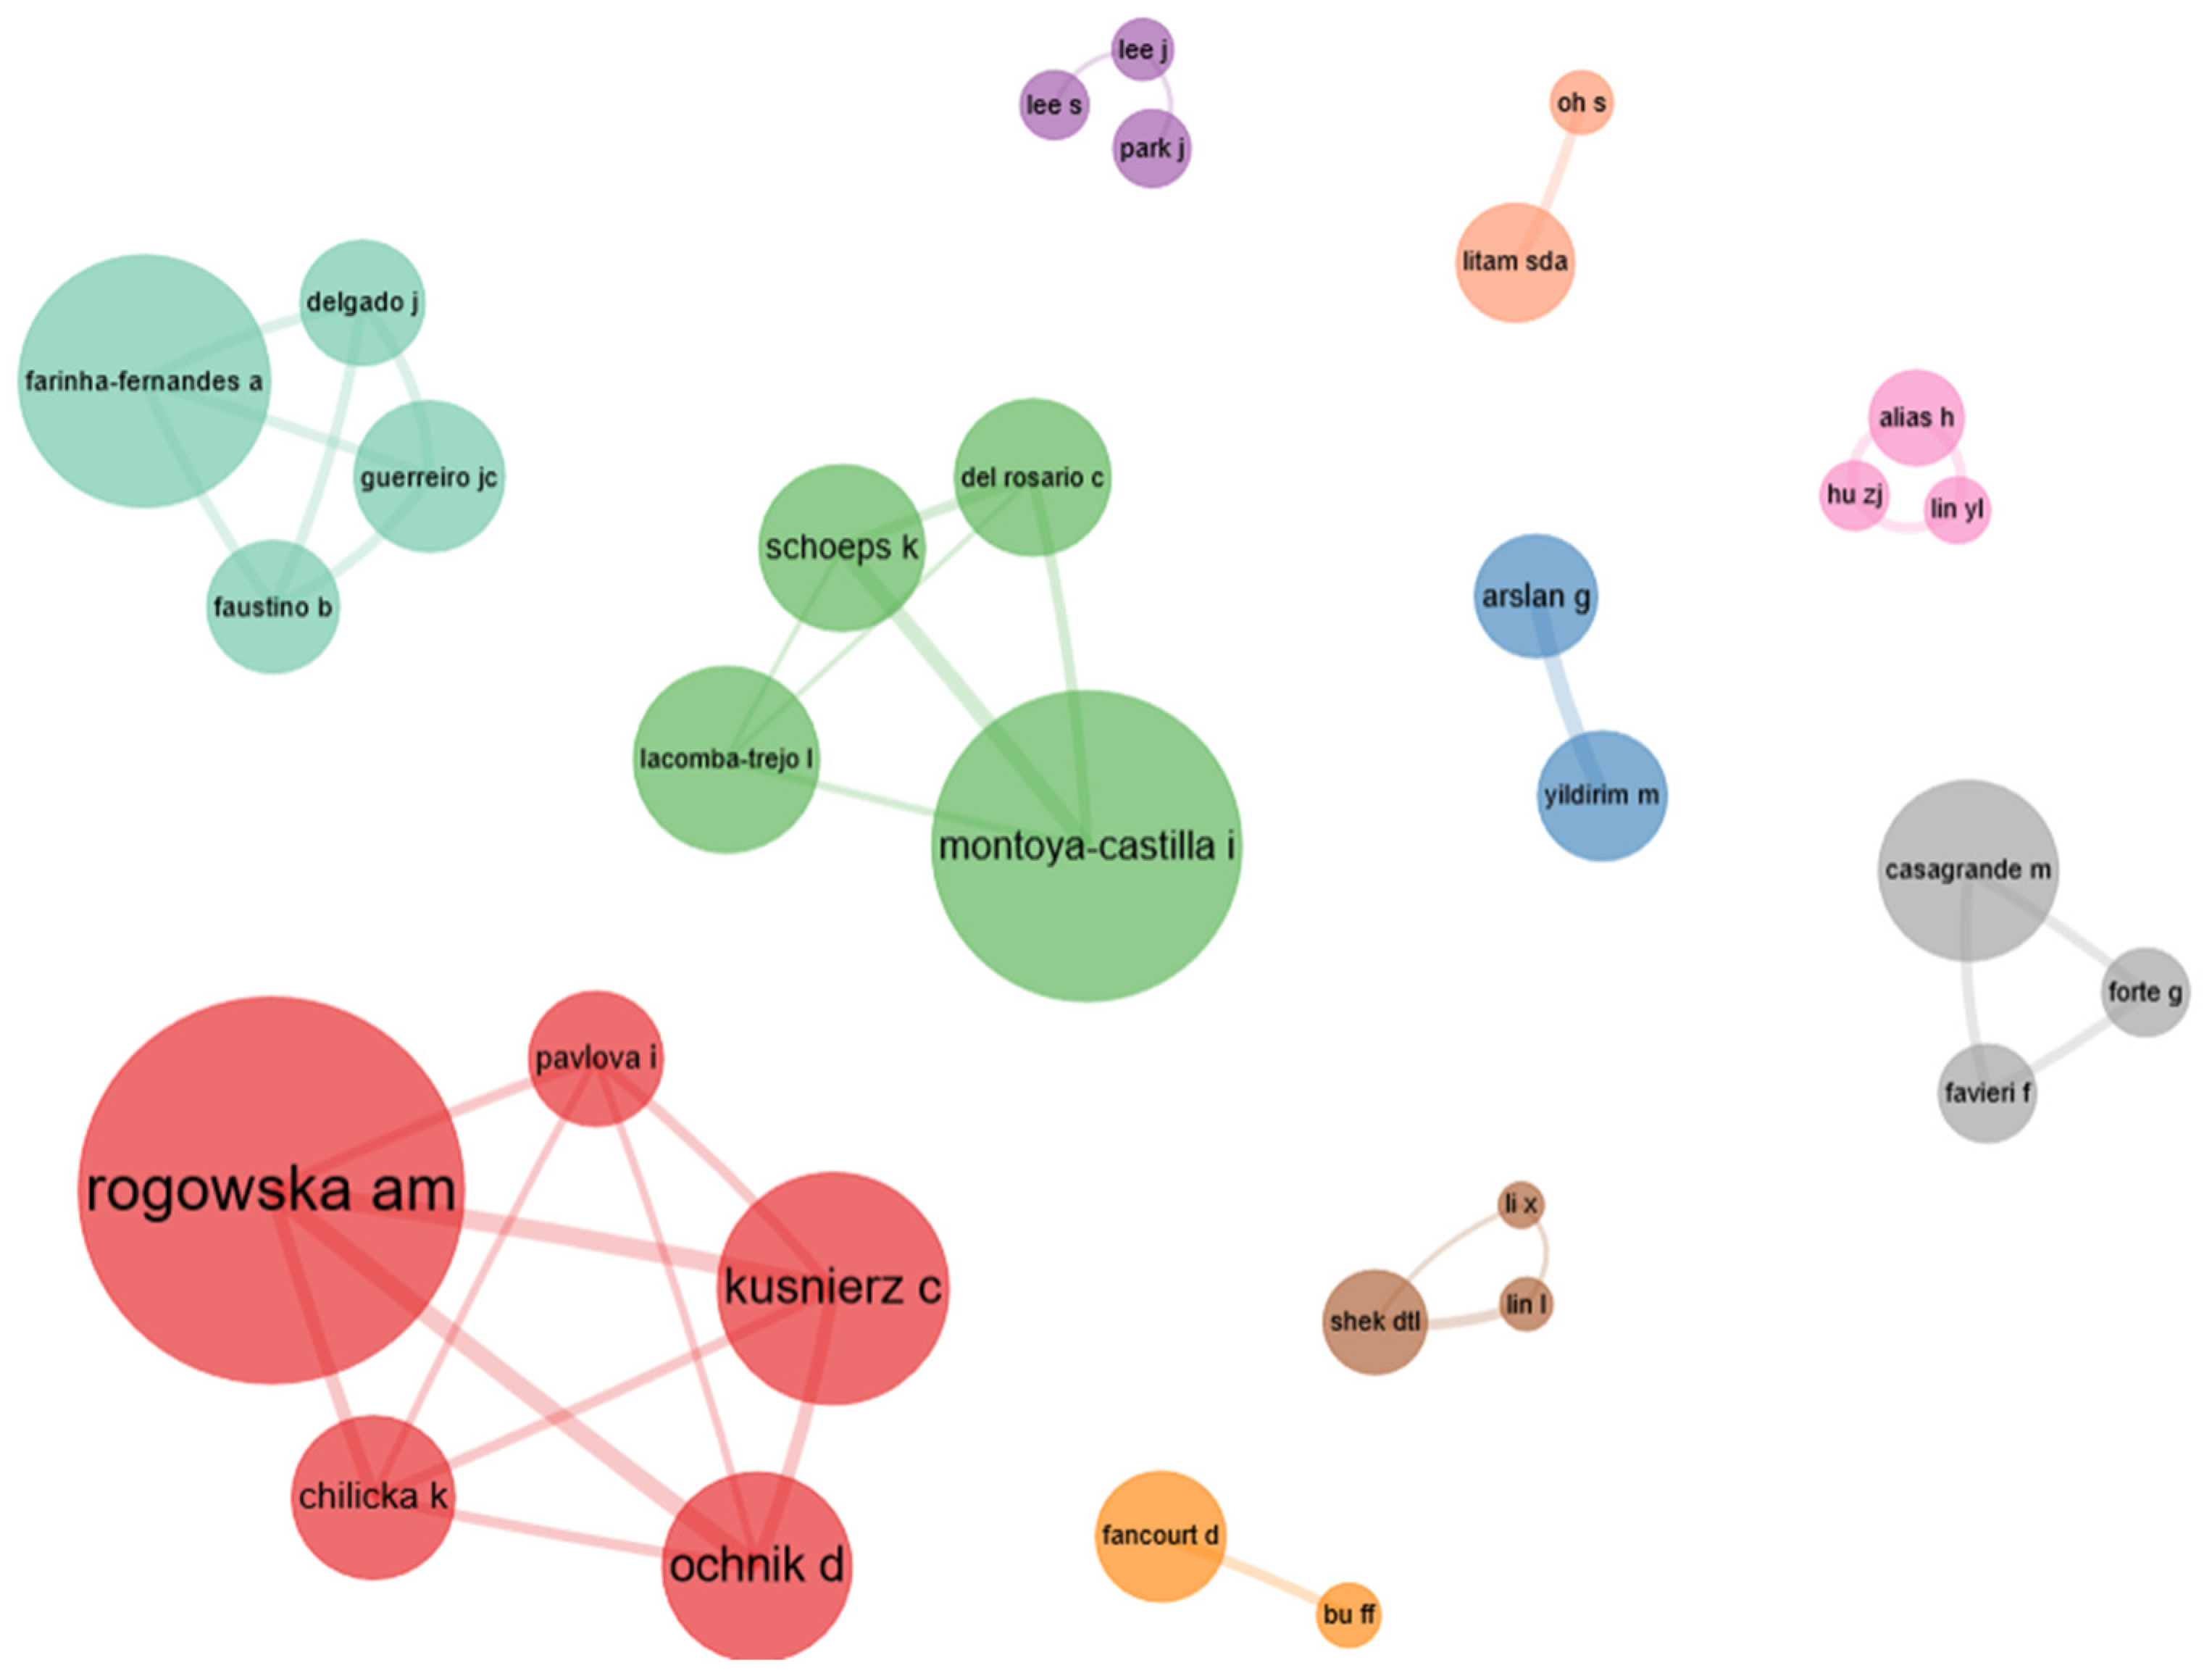
| 3 | Authors analysis | Top authors based on number of documents, authors’ production over time, most relevant affiliations, most relevant countries, scientific production based on country, top countries with the most citations, country collaboration map, and authors’ collaboration network |
| 4 | Papers analysis | Top 10 most cited papers |
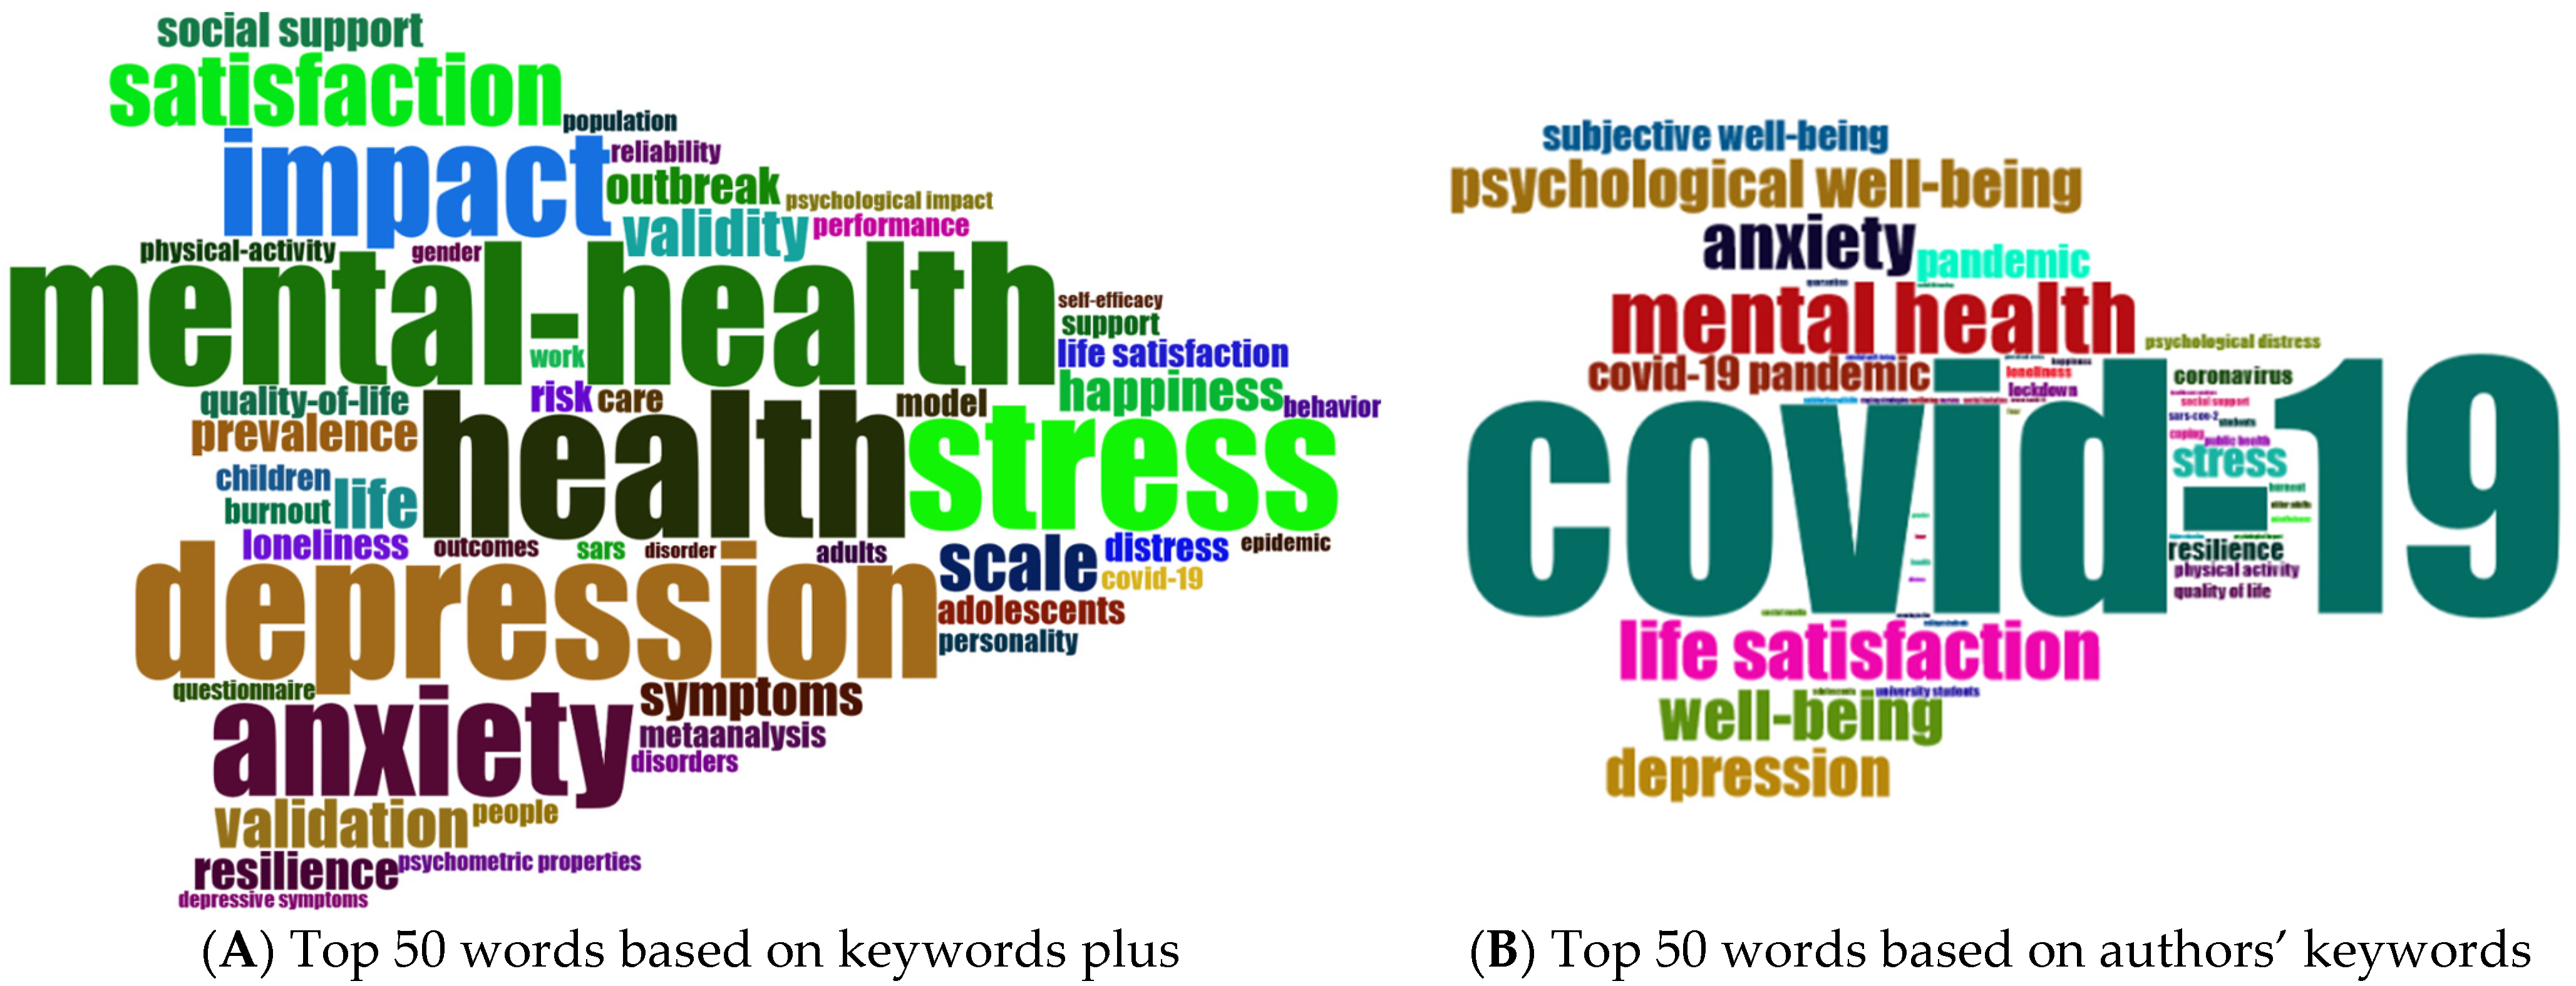
| 5 | Words analysis | Top 10 most frequent words in keywords plus, top 10 most frequent words in authors’ keywords, top 50 words based on keywords plus and authors’ keywords, top 10 most frequent bigrams in abstracts and titles, and top 10 most frequent trigrams in abstracts and titles |
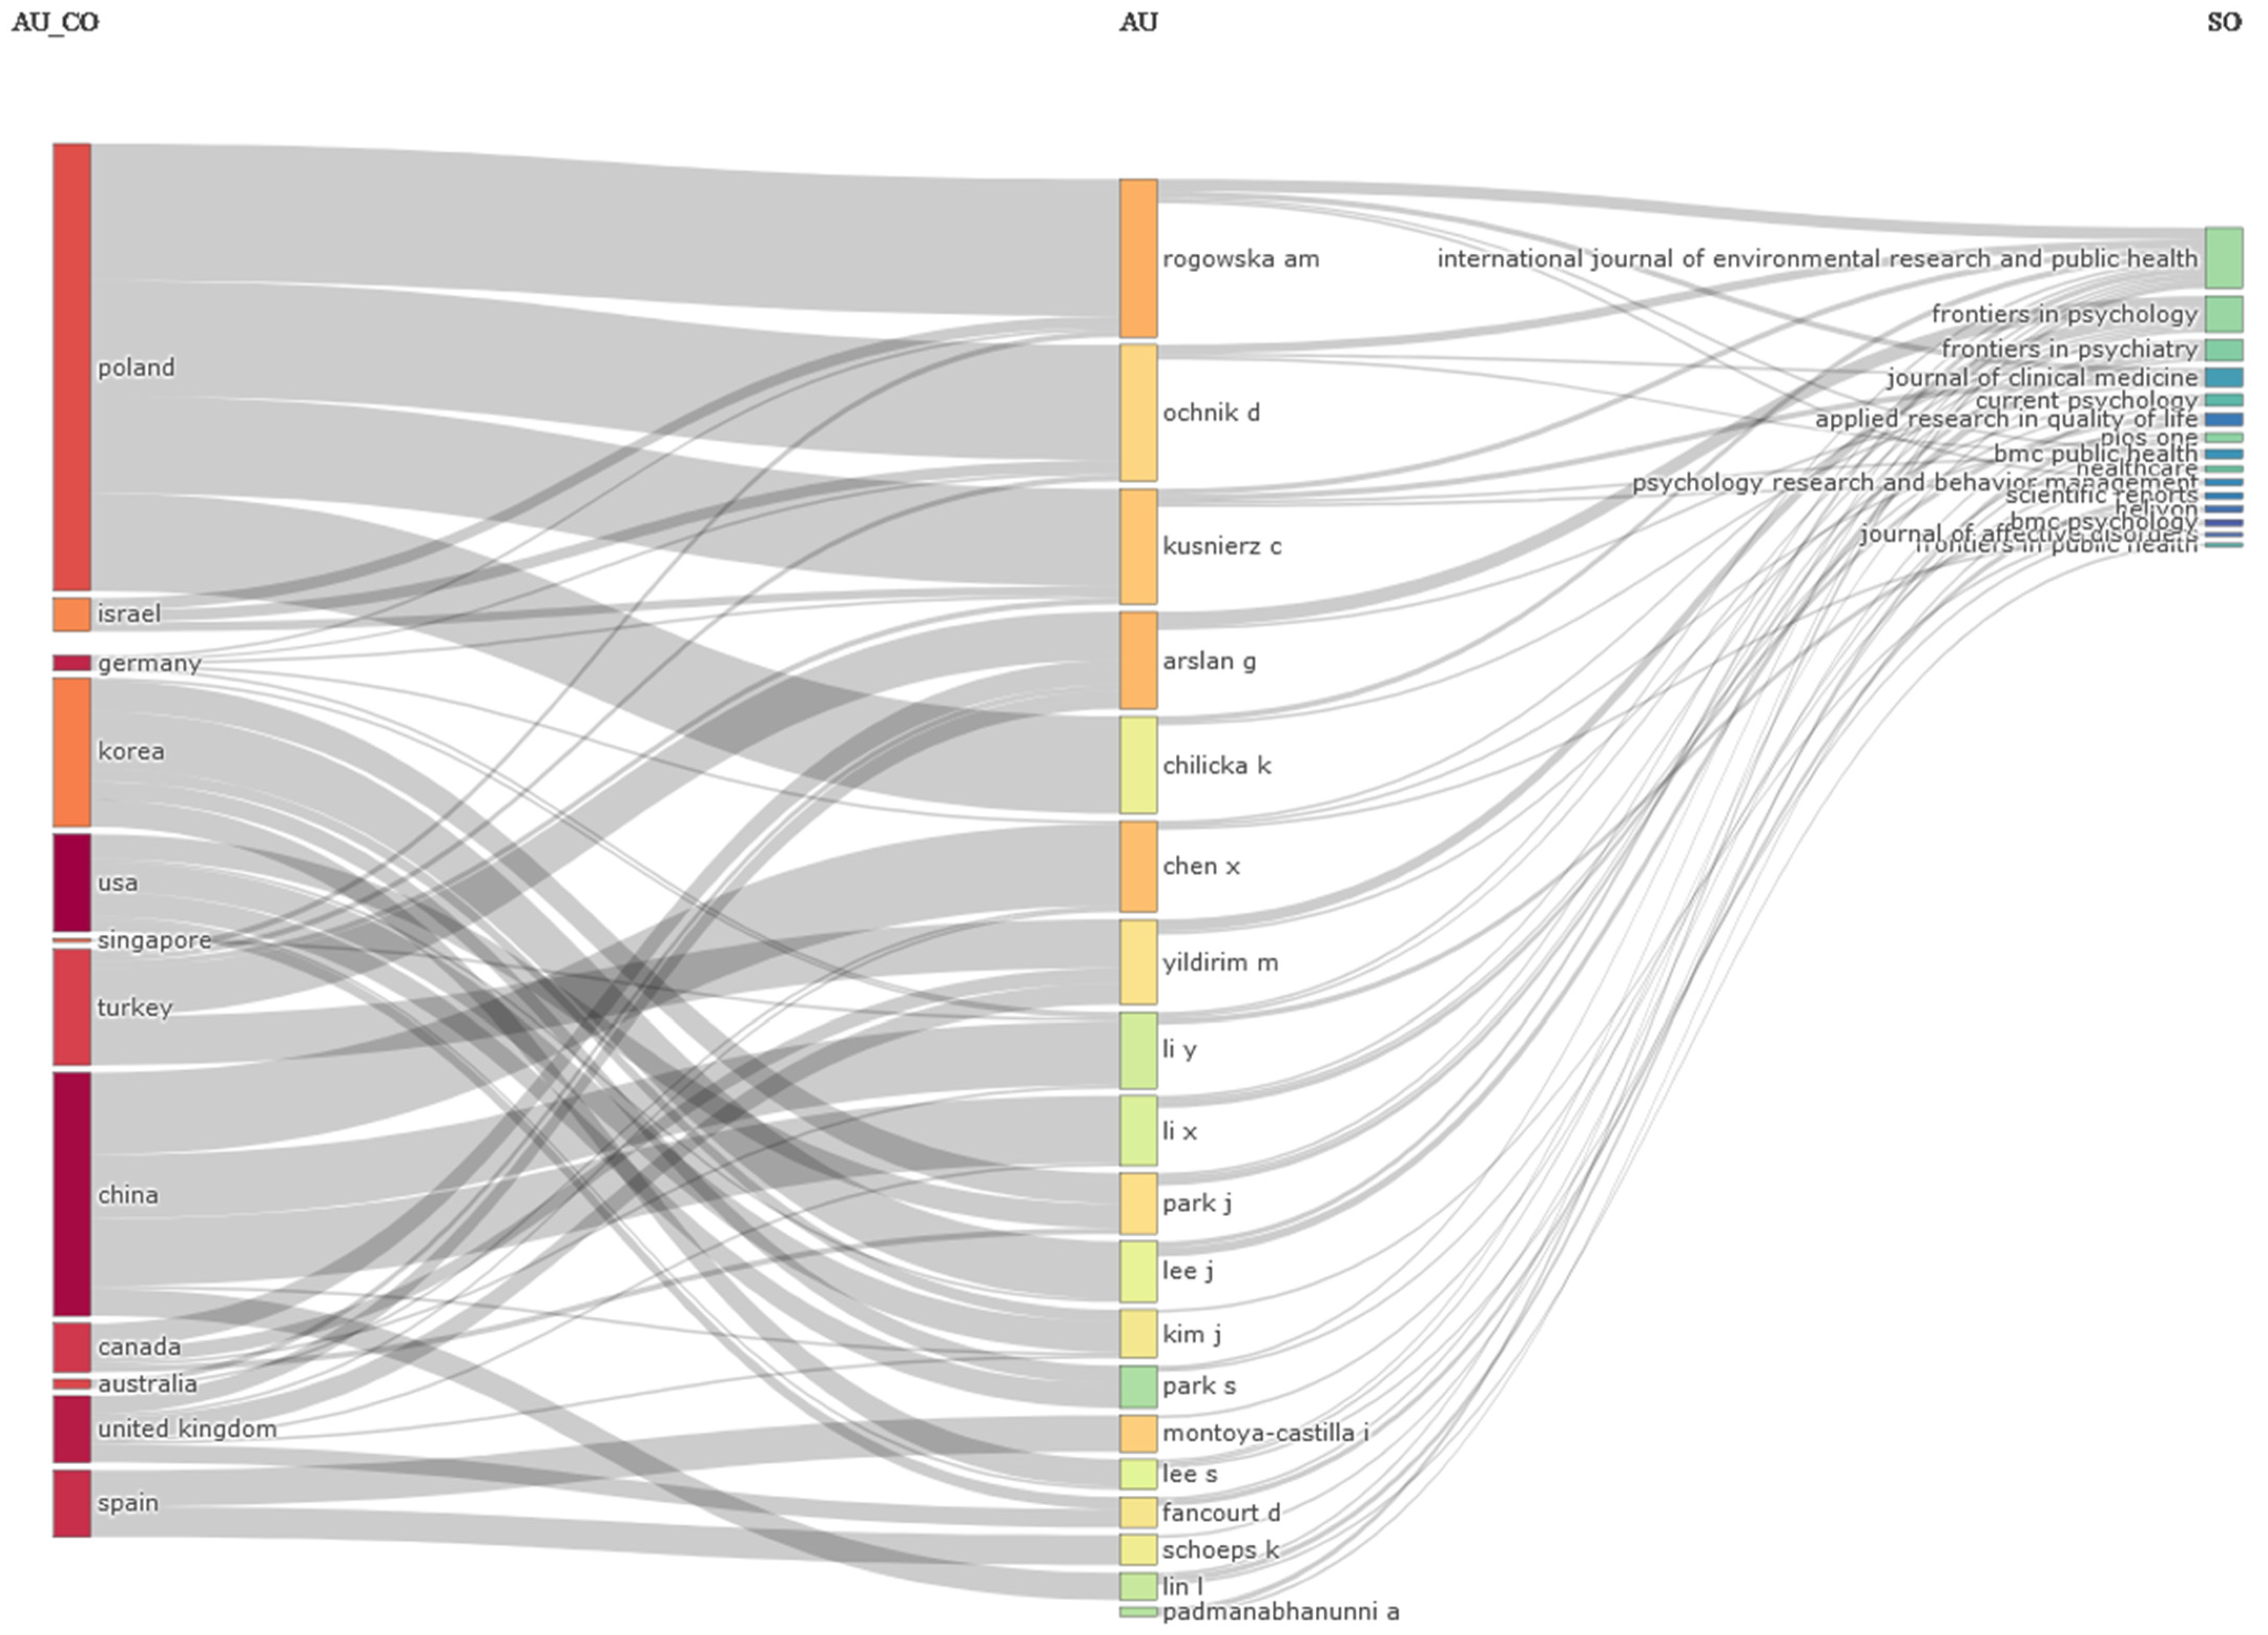
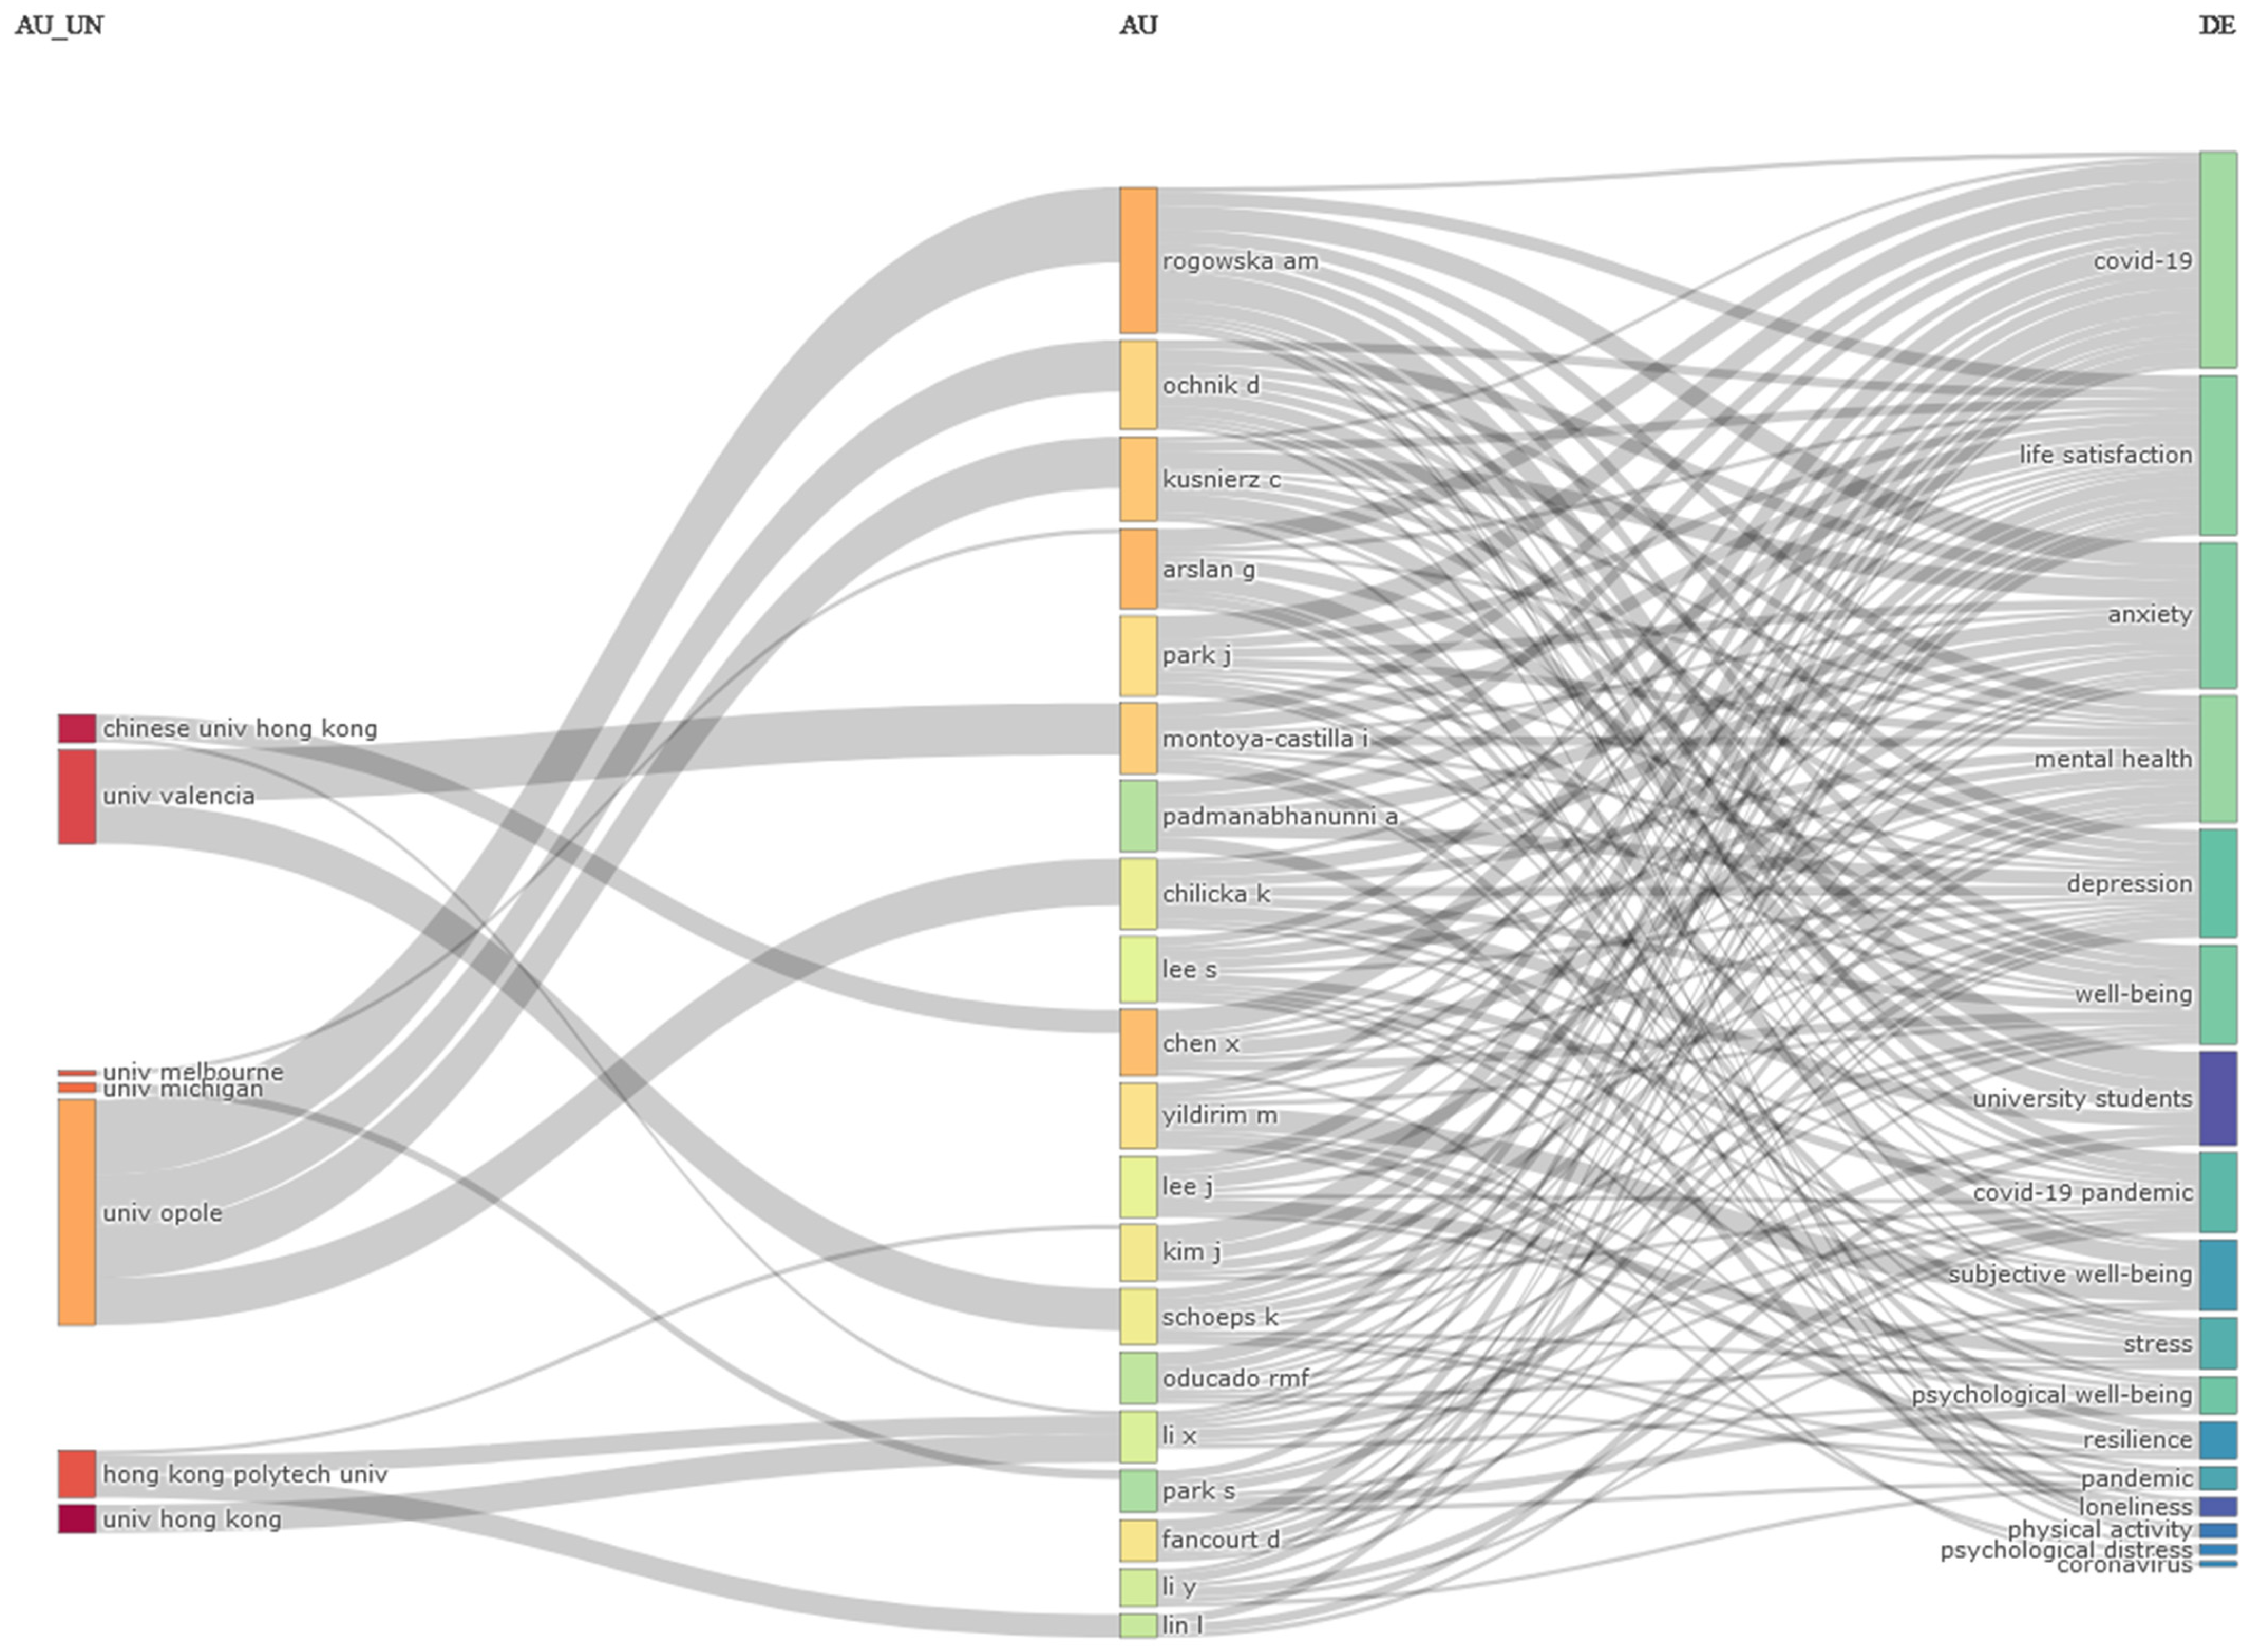
| 6 | Mixed analysis | Three-fields plots |
| Indicator | Value |
|---|---|
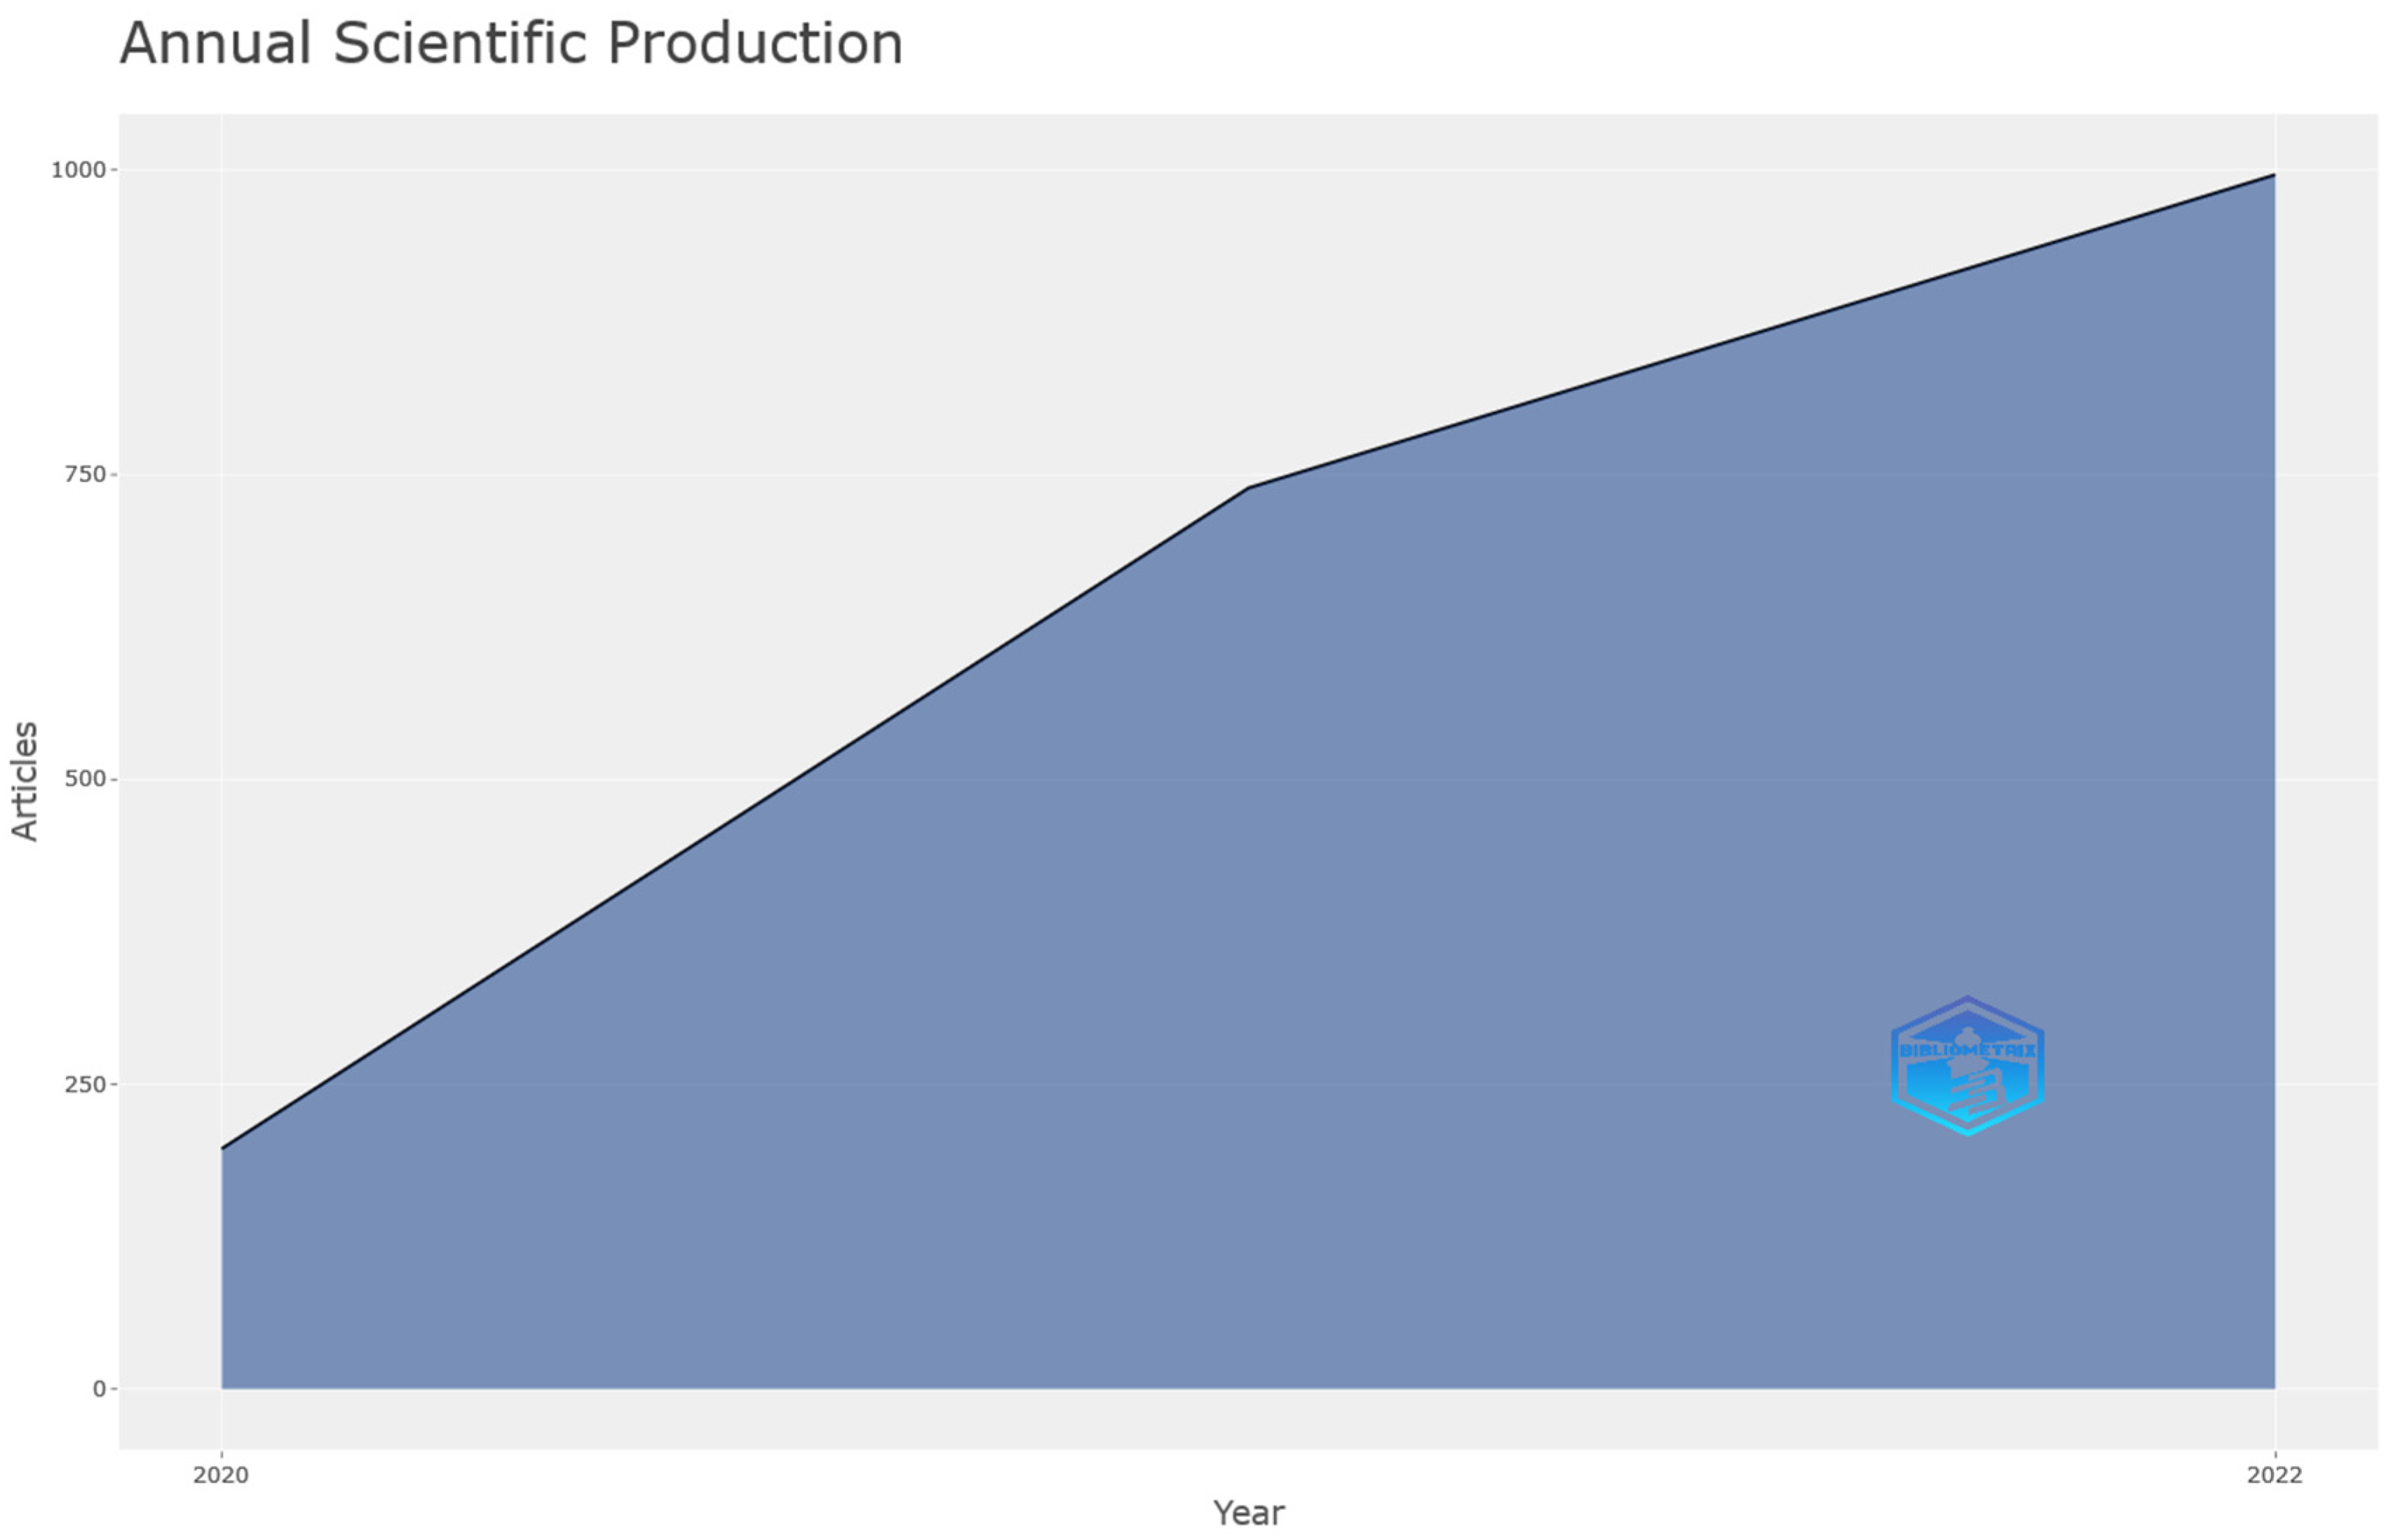
| Timespan | 2020:2022 |
| Sources | 795 |
| Documents | 1932 |
| Average years from publication | 1.59 |
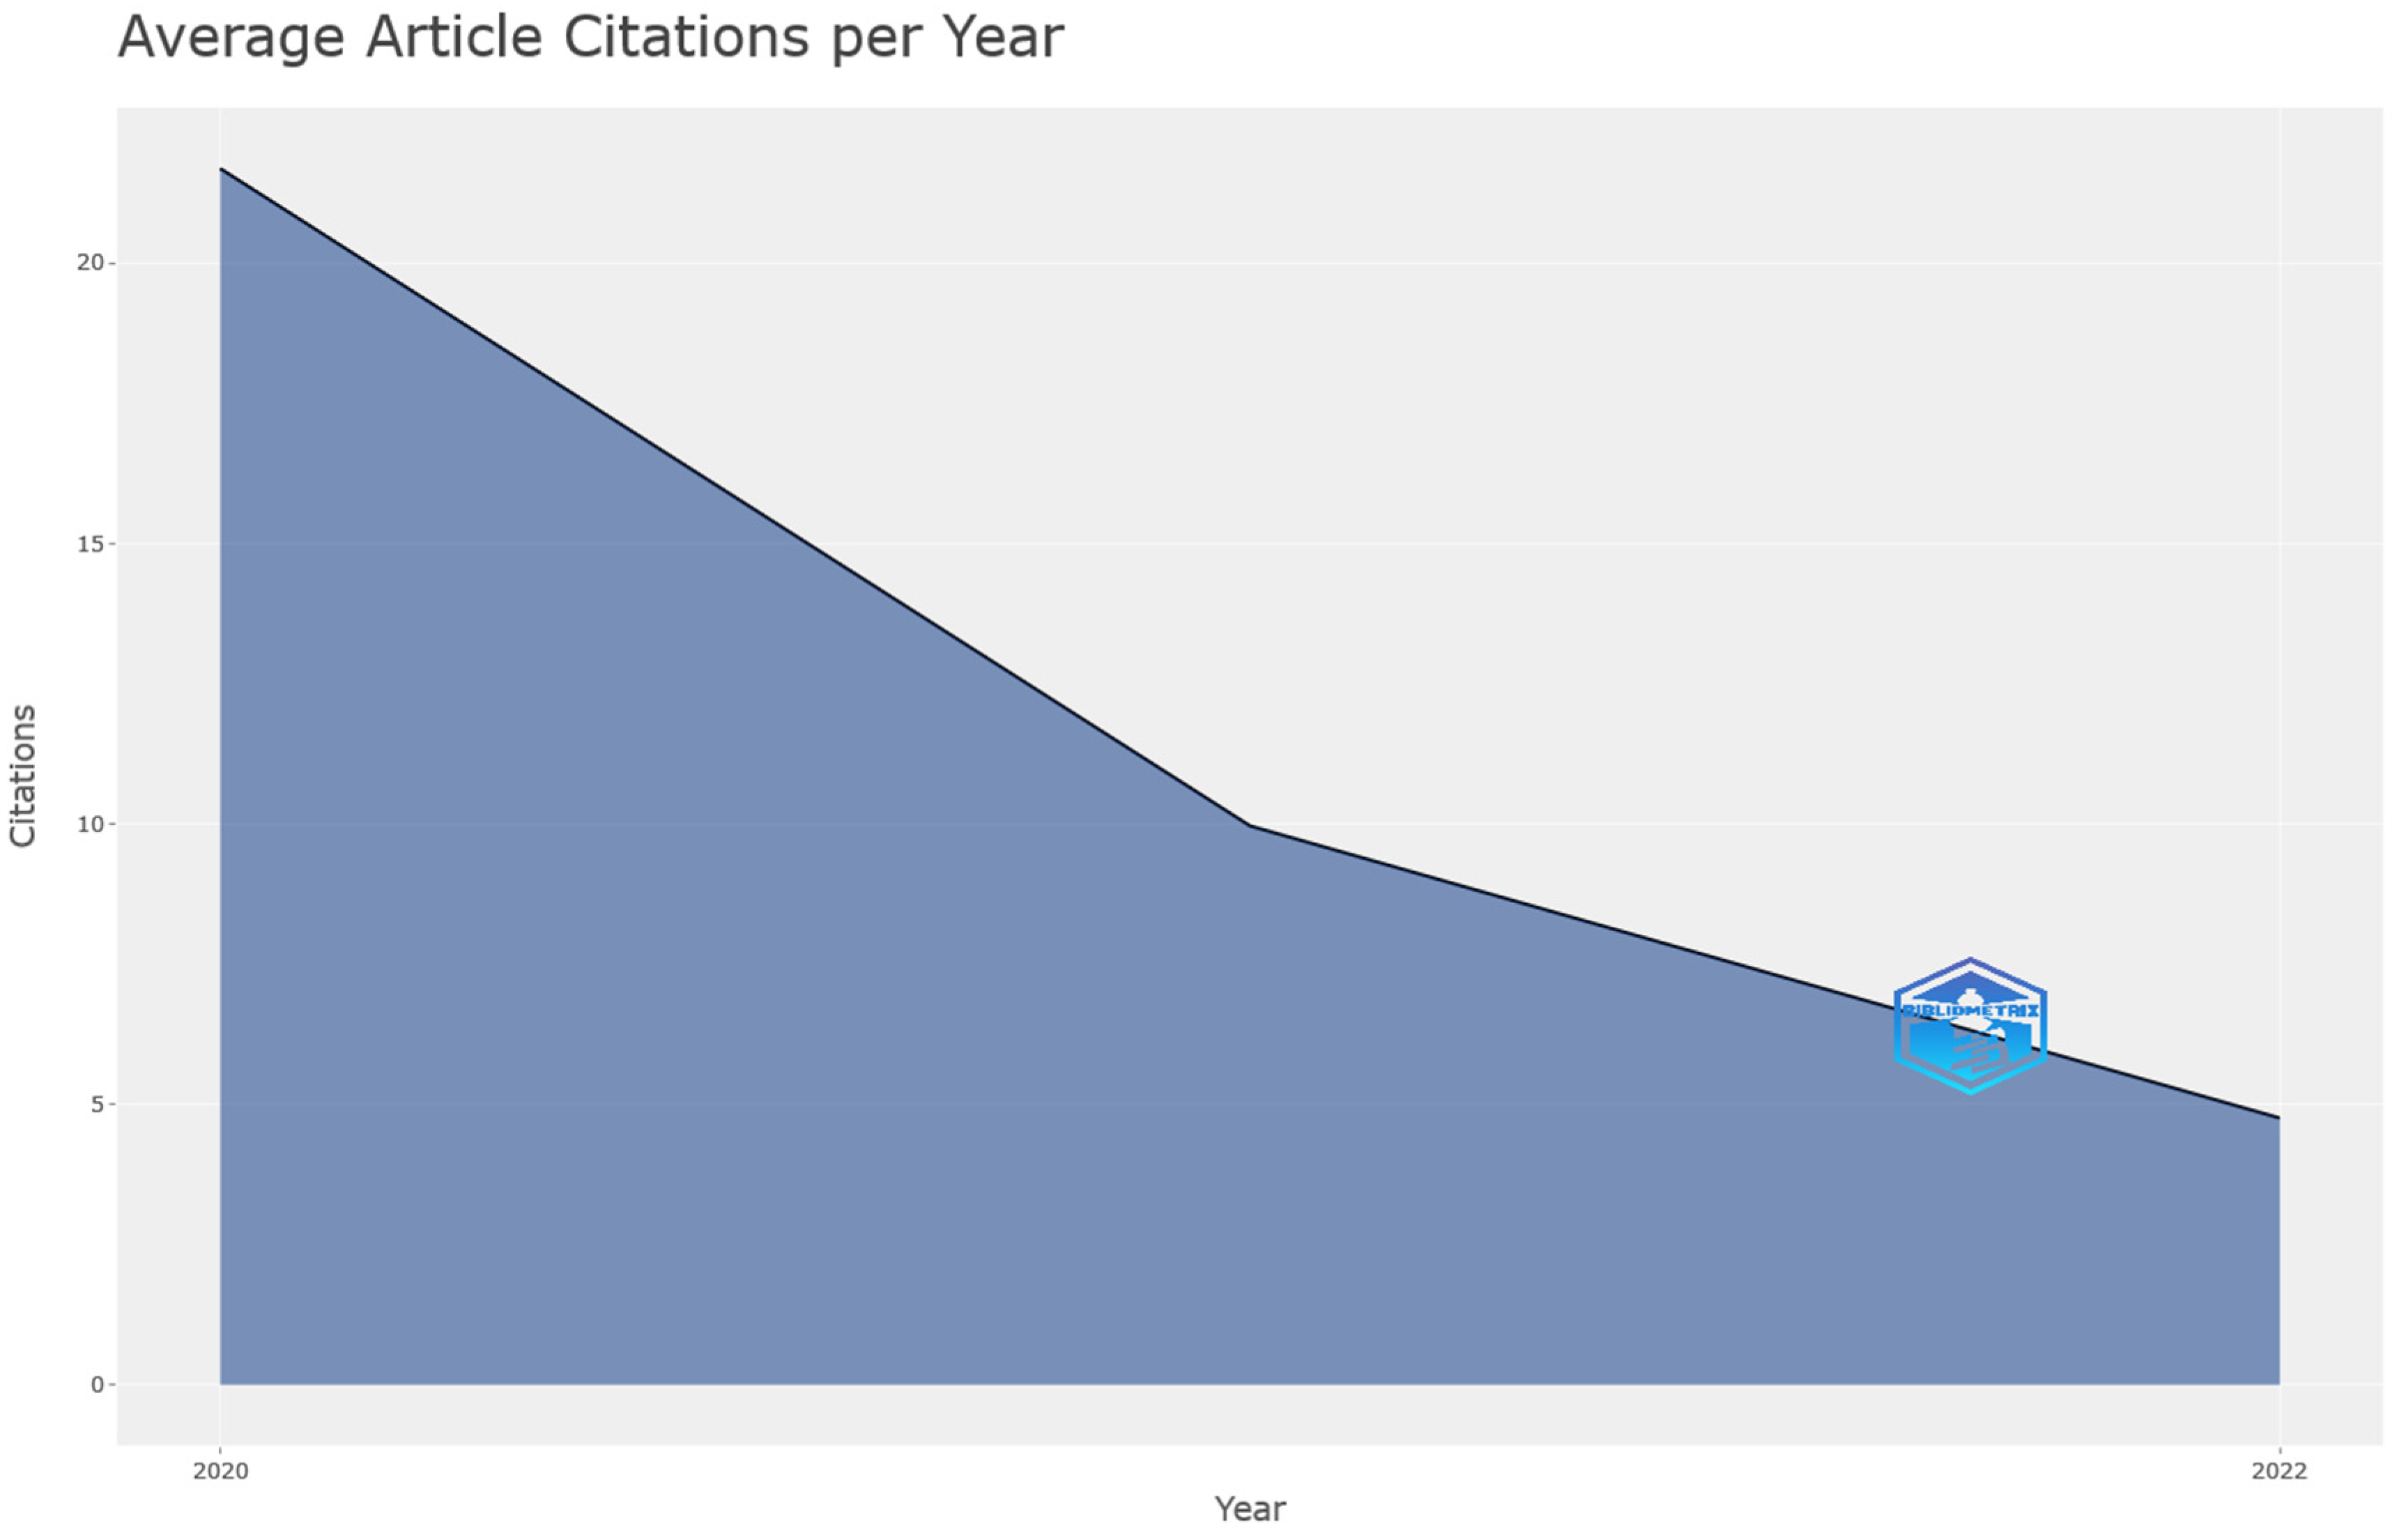
| Average citations per documents | 16.71 |
| Average citations per year per document | 5.426 |
| References | 68,307 |
| Indicator | Value |
|---|---|
| Keywords plus | 2183 |
| Author’s keywords | 3850 |
| Indicator | Value |
|---|---|
| Authors | 8982 |
| Author appearances | 10,257 |
| Authors of single-authored documents | 89 |
| Authors of multi-authored documents | 8893 |
| Indicator | Value |
|---|---|
| Single-authored documents | 95 |
| Documents per author | 0.215 |
| Authors per document | 4.65 |
| Co-authors per documents | 5.31 |
| Collaboration index | 4.84 |
| No. | Paper (First Author, Year, Journal, Reference) | Number of Authors | Region | Total Citations (TC) | Total Citations per Year (TCY) | Normalized TC (NTC) |
|---|---|---|---|---|---|---|
| 1 | Ettman Ck, 2020, Jama Network Open [40] | 6 | USA | 1122 | 280.50 | 17.24 |
| 2 | Li Sj, 2020, International Journal of Environmental Research and Public Health [32] | 5 | China, Canada | 888 | 222 | 13.65 |
| 3 | Magson Nr, 2021, Journal of Youth Adolescence [92] | 6 | Australia | 585 | 195 | 29.35 |
| 4 | Satici B, 2021, International Journal of Mental Health and Addiction [44] | 4 | Turkey | 476 | 158.67 | 23.88 |
| 5 | Maugeri G, 2020, Heliyon [38] | 8 | Italy | 460 | 115 | 7.07 |
| 6 | Casagrande M, 2020, Sleep Medicine [93] | 4 | Italy | 440 | 110 | 6.76 |
| 7 | Zhang Sx, 2020, Psychiatry Research [30] | 4 | Australia, China | 432 | 108 | 6.64 |
| 8 | Orgiles M, 2020, Frontiers in Psychology [41] | 5 | Spain, Italy | 343 | 85.75 | 5.27 |
| 9 | Zacher H, 2021, American Psychologist [31] | 2 | Germany, USA | 327 | 109 | 16.40 |
| 10 | Abd-Alrazaq A, 2020, Journal of Medical Internet Research [94] | 5 | Qatar, Kuwait | 289 | 72.25 | 4.44 |
| No. | Paper (First Author, Year, Journal, Reference) | Title | Data | Purpose | Methodology |
|---|---|---|---|---|---|
| 1 | Ettman Ck, 2020, Jama Network Open [40] | Prevalence of Depression Symptoms in US Adults Before and During the COVID-19 Pandemic | Two population-based surveys of US adults aged 18 or older | Estimating risk factors associated with depression symptoms among US adults during vs. before the COVID-19 pandemic | Statistical analysis and multivariable logistic regression |
| 2 | Li Sj, 2020, International Journal of Environmental Research and Public Health [32] | The Impact of COVID-19 Epidemic Declaration on Psychological Consequences: A Study on Active Weibo Users | Weibo posts from 17,865 active Weibo users | Exploring the impacts of COVID-19 on peoples’ mental health | Online ecological recognition—predictive models |
| 3 | Magson Nr, 2021, Journal of Youth Adolescence [92] | Risk and Protective Factors for Prospective Changes in Adolescent Mental Health during the COVID-19 Pandemic | Two online surveys applied to 248 adolescents | Investigating the impact of the COVID-19 pandemic on adolescents’ mental health | Statistical analysis |
| 4 | Satici B, 2021, International Journal of Mental Health and Addiction [44] | Adaptation of the Fear of COVID-19 Scale: Its Association with Psychological Distress and Life Satisfaction in Turkey | Online surveys | Investigate the relationships between fear of COVID-19, psychological distress, and life satisfaction | Confirmatory factor analysis, item response theory |
| 5 | Maugeri G, 2020, Heliyon [38] | The impact of physical activity on psychological health during COVID-19 pandemic in Italy | Online survey | Examining changes in the physical activity levels during self-quarantine in Italy | Statistical analysis |
| 6 | Casagrande M, 2020, Sleep Medicine [93] | The enemy who sealed the world: Effects quarantine due to the COVID-19 on sleep quality, anxiety, and psychological distress in the Italian population | Online survey | Understanding the psychological impact of the COVID-19 outbreak on sleep quality, general anxiety symptomatology, and psychological distress | Statistical analysis |
| 7 | Zhang Sx, 2020, Psychiatry Research [30] | Unprecedented disruption of lives and work: Health, distress and life satisfaction of working adults in China one month into the COVID-19 outbreak | Cross-sectional survey | Evaluating the health and wellbeing of normal adults living and working after one month of confinement to contain the COVID-19 | Statistical analysis, ordinary least squares regression |
| 8 | Orgiles M, 2020, Frontiers in Psychology [41] | Immediate Psychological Effects of the COVID-19 Quarantine in Youth from Italy and Spain | Online survey | Examining emotional impact of the quarantine on children and adolescents | Statistical analysis |
| 9 | Zacher H, 2021, American Psychologist [31] | Individual Differences and Changes in Subjective Wellbeing during the Early Stages of the COVID-19 Pandemic | Online survey | Examining changes in subjective well-being | Statistical analysis, confirmatory factor analysis, logistic regression |
| 10 | Abd-Alrazaq A, 2020, Journal of Medical Internet Research [94] | Top Concerns of Tweeters During the COVID-19 Pandemic: Infoveillance Study | 167,073 unique tweets from 160,829 unique users | Identifying the main topics posted by Twitter users related to the COVID-19 pandemic | Topic modeling technique, latent dirichlet allocation |
| Words | Occurrences |
|---|---|
| health | 322 |
| mental health | 311 |
| depression | 298 |
| stress | 287 |
| anxiety | 241 |
| impact | 233 |
| satisfaction | 159 |
| scale | 122 |
| life | 109 |
| validation | 106 |
| Words | Occurrences |
|---|---|
| COVID-19 | 1067 |
| mental health | 305 |
| life satisfaction | 246 |
| anxiety | 233 |
| well-being | 215 |
| psychological well-being | 203 |
| depression | 201 |
| COVID-19 pandemic | 146 |
| stress | 146 |
| pandemic | 139 |
| Bigrams in Abstracts | Occurrences | Bigrams in Titles | Occurrences |
|---|---|---|---|
| covid_ pandemic | 2017 | covid_ pandemic | 759 |
| psychological well_being | 1600 | psychological well_being | 233 |
| life satisfaction | 1460 | mental health | 218 |
| mental health | 1459 | life satisfaction | 194 |
| subjective well_being | 528 | subjective well_being | 122 |
| psychological distress | 452 | cross_sectional study | 81 |
| online survey | 316 | university students | 80 |
| physical activity | 292 | covid_ lockdown | 76 |
| social support | 274 | physical activity | 64 |
| social media | 247 | covid_ outbreak | 56 |
| Trigrams in Abstracts | Occurrences | Trigrams in Titles | Occurrences |
|---|---|---|---|
| coronavirus disease covid_ | 206 | health care workers | 18 |
| disease covid_ pandemic | 107 | randomized controlled trial | 17 |
| health care workers | 66 | covid_ pandemic evidence | 12 |
| mental health outcomes | 65 | moderated mediation model | 10 |
| covid_ pandemic methods | 50 | coronavirus disease covid_ | 8 |
| structural equation modeling | 49 | amid covid_ pandemic | 7 |
| world health organization | 49 | coronavirus disease pandemic | 7 |
| lower life satisfaction | 43 | covid_ pandemic lockdown | 7 |
| depression anxiety stress | 42 | cross sectional study | 7 |
| perceived social support | 41 | mental health outcomes | 7 |
Disclaimer/Publisher’s Note: The statements, opinions and data contained in all publications are solely those of the individual author(s) and contributor(s) and not of MDPI and/or the editor(s). MDPI and/or the editor(s) disclaim responsibility for any injury to people or property resulting from any ideas, methods, instructions or products referred to in the content. |
© 2024 by the authors. Licensee MDPI, Basel, Switzerland. This article is an open access article distributed under the terms and conditions of the Creative Commons Attribution (CC BY) license (https://creativecommons.org/licenses/by/4.0/).
Share and Cite
Jigani, A.-I.; Delcea, C.; Florescu, M.-S.; Cotfas, L.-A. Tracking Happiness in Times of COVID-19: A Bibliometric Exploration. Sustainability 2024, 16, 4918. https://doi.org/10.3390/su16124918
Jigani A-I, Delcea C, Florescu M-S, Cotfas L-A. Tracking Happiness in Times of COVID-19: A Bibliometric Exploration. Sustainability. 2024; 16(12):4918. https://doi.org/10.3390/su16124918
Chicago/Turabian StyleJigani, Adina-Iuliana, Camelia Delcea, Margareta-Stela Florescu, and Liviu-Adrian Cotfas. 2024. "Tracking Happiness in Times of COVID-19: A Bibliometric Exploration" Sustainability 16, no. 12: 4918. https://doi.org/10.3390/su16124918
APA StyleJigani, A.-I., Delcea, C., Florescu, M.-S., & Cotfas, L.-A. (2024). Tracking Happiness in Times of COVID-19: A Bibliometric Exploration. Sustainability, 16(12), 4918. https://doi.org/10.3390/su16124918