Article

Low-Carbon Economic Dispatch Model of Integrated Energy System Accounting for Concentrating Solar Power and Hydrogen-Doped Combustion

Hubei Key Laboratory for High-Efficiency Utilization of Solar Energy and Operation Control of Energy Storage System, Hubei University of Technology, Wuhan 430068, China
*
Author to whom correspondence should be addressed.
Sustainability 2024, 16(11), 4818; https://doi.org/10.3390/su16114818
Submission received: 2 March 2024 / Revised: 4 May 2024 / Accepted: 3 June 2024 / Published: 5 June 2024

Abstract

:
Against the background of carbon peak and carbon neutralization, in order to solve the problem of poor flexibility of integrated energy systems and wind power consumption while improving the potential of hydrogen energy emission reduction, this study proposes an integrated energy system that takes into account the coupling of concentrating solar power (CSP), hydrogen-doped combustion, and power-to-gas (P2G) conversion. Firstly, a mathematical model of a CSP-CHP unit is established by introducing a CSP power station, aiming at the defect of the “heat to power” mode in the CHP system. Secondly, the energy consumption of P2G hydrogen energy production is satisfied by surplus wind power. The utilization stage of hydrogen energy is divided into supply CHP combustion and CO2 methanation, forming a CSP-P2G-HCHP collaborative framework and establishing an IES low-carbon economic dispatch model with CSP-P2G-HCHP. At the same time, the carbon trading mechanism is introduced to constrain the carbon emissions of the system. Finally, an optimization strategy with the minimum sum of the operation and maintenance cost, the energy purchase cost, the wind curtailment cost, and the carbon emission cost as the objective function is proposed, and the CPLEX solver is used to solve and carry out multi-case analysis. The simulation results show that the carbon emissions are reduced by 6.34%, the wind curtailment cost is reduced by 52.2%, and the total cost is reduced by 1.67%. The model takes into account the carbon reduction effect and operating efficiency and effectively improves the new energy consumption capacity.

1. Introduction

In recent years, with carbon emissions caused by environmental pollution becoming increasingly serious, the “double carbon” goal has been put forward, gradually guiding China’s power industry in the direction of clean, low-carbon energy; however, rationalizing the use of renewable energy to alleviate the pressure on energy sources and the environment is an urgent problem that must be solved [1,2]. An integrated energy system (IES) is a power plant that can make different forms of energy using a variety of energy coupling methods, effectively avoiding energy abandonment or waste, promoting efficient energy conversion, and reducing system carbon emissions [3].
CSP is an emerging sustainable technology that employs heat storage and other types of circulation systems and can achieve “solar–heat–electricity” energy conversion, with the ability to operate for a long period of time and the potential to achieve carbon emission reduction [4]. The authors of [5] considered thermal energy units and CSP to jointly enable rotating standby and verified the system’s wind power consumption capability and economics, and the authors of [6] constructed an integrated energy system with electricity, heat, and gas interconnection to analyze the feasibility of employing generalized energy storage and photovoltaic and thermal energy plants for the economic optimization of operations. The study presented in [7] analyzes the cogeneration of wind power and CSP and shows that CSP containing thermal energy storage (TES) promotes wind power consumption. The study presented in [8] provides power through CSP and heat through an electric heater in conjunction with TES, thus enabling cogeneration and enhancing the CSP energy utilization. The above study takes into account the addition of CSP to the system, which enhances wind power consumption and the economy through coordinated operation with other equipment, followed by the introduction of electric heating devices to further improve the consumption capacity and increase the flexibility and energy utilization of the photovoltaic power plant; however, the system still requires the separation of heat and power and does not achieve transformation of the energy cycle, and the introduction of the electric heating device makes it more costly.
In the context of driving the “low-carbon economy” for environmental protection, mature P2G technology has gradually become a key solution for wind power consumption. The study presented in [9] proposes a low-carbon economic dispatch model that considers the coupled operation of P2G and carbon capture and storage (CCS), which reduces carbon emissions by utilizing CO2 captured by CCS as a raw material for the production of natural gas in a P2G unit. The study presented in [10] introduces a carbon capture–power-to-gas (CCS-P2G) coupling system to achieve carbon recycling in an IES, which reduces the cost of purchasing gas for the system and enhances wind power consumption. The authors of [11] introduced P2G to improve the overall flexibility of an IES, achieving a 21.36% reduction in wind abandonment. In [12], the authors considered conditional value at risk (CVR) to account for the uncertainty of wind power while using P2G to reduce wind abandonment. The abovementioned studies have not refined the model of P2G, and its low-carbon nature has not been fully explored. The authors of [13] constructed a refined mathematical model of electric-to-gas equipment containing electrolyzers (ELs) and a methanization reaction (MR) based on the operating characteristics of P2G equipment. The study presented in [14] proposes a new integrated energy system based on CSP-CHP by introducing P2G and CCS technologies, and the proposed IES exhibits excellent performance in wind power absorption and CO2 reduction. The above studies emphasize the positive role of P2G and CSP technologies in integrated energy systems for CO2 reduction. However, they do not fully consider the important role of hydrogen energy in the low-carbon energy transition.
In this study, we consider the degree to which the hydrogen utilization pathway can be improved by piping a certain ratio of hydrogen to natural gas mixed for combustion. The authors of [15] investigated the performance of a tank combustor with a natural gas-hydrogen blend and showed that the addition of 10% hydrogen resulted in a reduction in emissions but also in the power of the gas turbine. In [16], the results show that hydrogen doping increases the flame temperature in the combustion chamber of a gas turbine and reduces the flame size and emissions. The authors of [17] added hydrogen-doped combustion to an IES and evaluated its power generation and showed that the carbon emissions were only 35.08% of the carbon quota. The study presented in [18] proposed a coordinated scheduling approach for coupled gas-electric systems using hydrogen gas mixtures, and the simulations demonstrated the validity of the model in terms of low carbon generation. In [19], hydrogen was blended with natural gas at a certain volume ratio on the basis of GT, and the CO2 emissions and cost were reduced. Although the above studies emphasize the important role of P2G and CSP technologies in integrated energy systems, their potential as low-carbon solutions remains unexplored.
There are no studies that have analyzed the synergistic operation of CSP, P2G, and HCHP in order to solve the above challenges. Based on existing research, in order to further explore the scheduling potential of IESs from low-carbon and economic points of view, this study proposes a low-carbon integrated energy system that involves the joint operation of a photovoltaic thermal power plant and hydrogen-doped combustion. Its main contents are as follows:
(1)
A CSP-P2G-HCHP coupled integrated energy system based on the carbon trading mechanism is proposed. The results show that the proposed method takes into account the carbon reduction effect and operation efficiency and effectively improves the new energy consumption capacity.
(2)
The use of P2G technology to absorb excess wind power for hydrogen production and methanation effectively improves the utilization efficiency of new energy and the recycling of CO2.
(3)
Considering the hydrogen blending operation mode of cogeneration units and gas boilers, the utilization efficiency of hydrogen energy is improved, and the emission reduction potential of hydrogen energy is explored.
The rest of this paper is constructed as follows: Section 2 introduces the energy flow framework and the equipment model of the proposed IES; Section 3 presents the low-carbon economic dispatch model with the objective function of minimizing the total cost and the constraints of the corresponding equipment; Section 4 describes the arithmetic study carried out to analyze the superiority of our scheme through the operational simulation of different cases; and the conclusions drawn are summarized in Section 5.

2. Integrated Energy Dispatch Modeling of CSP with Hydrogen-Doped Combustion

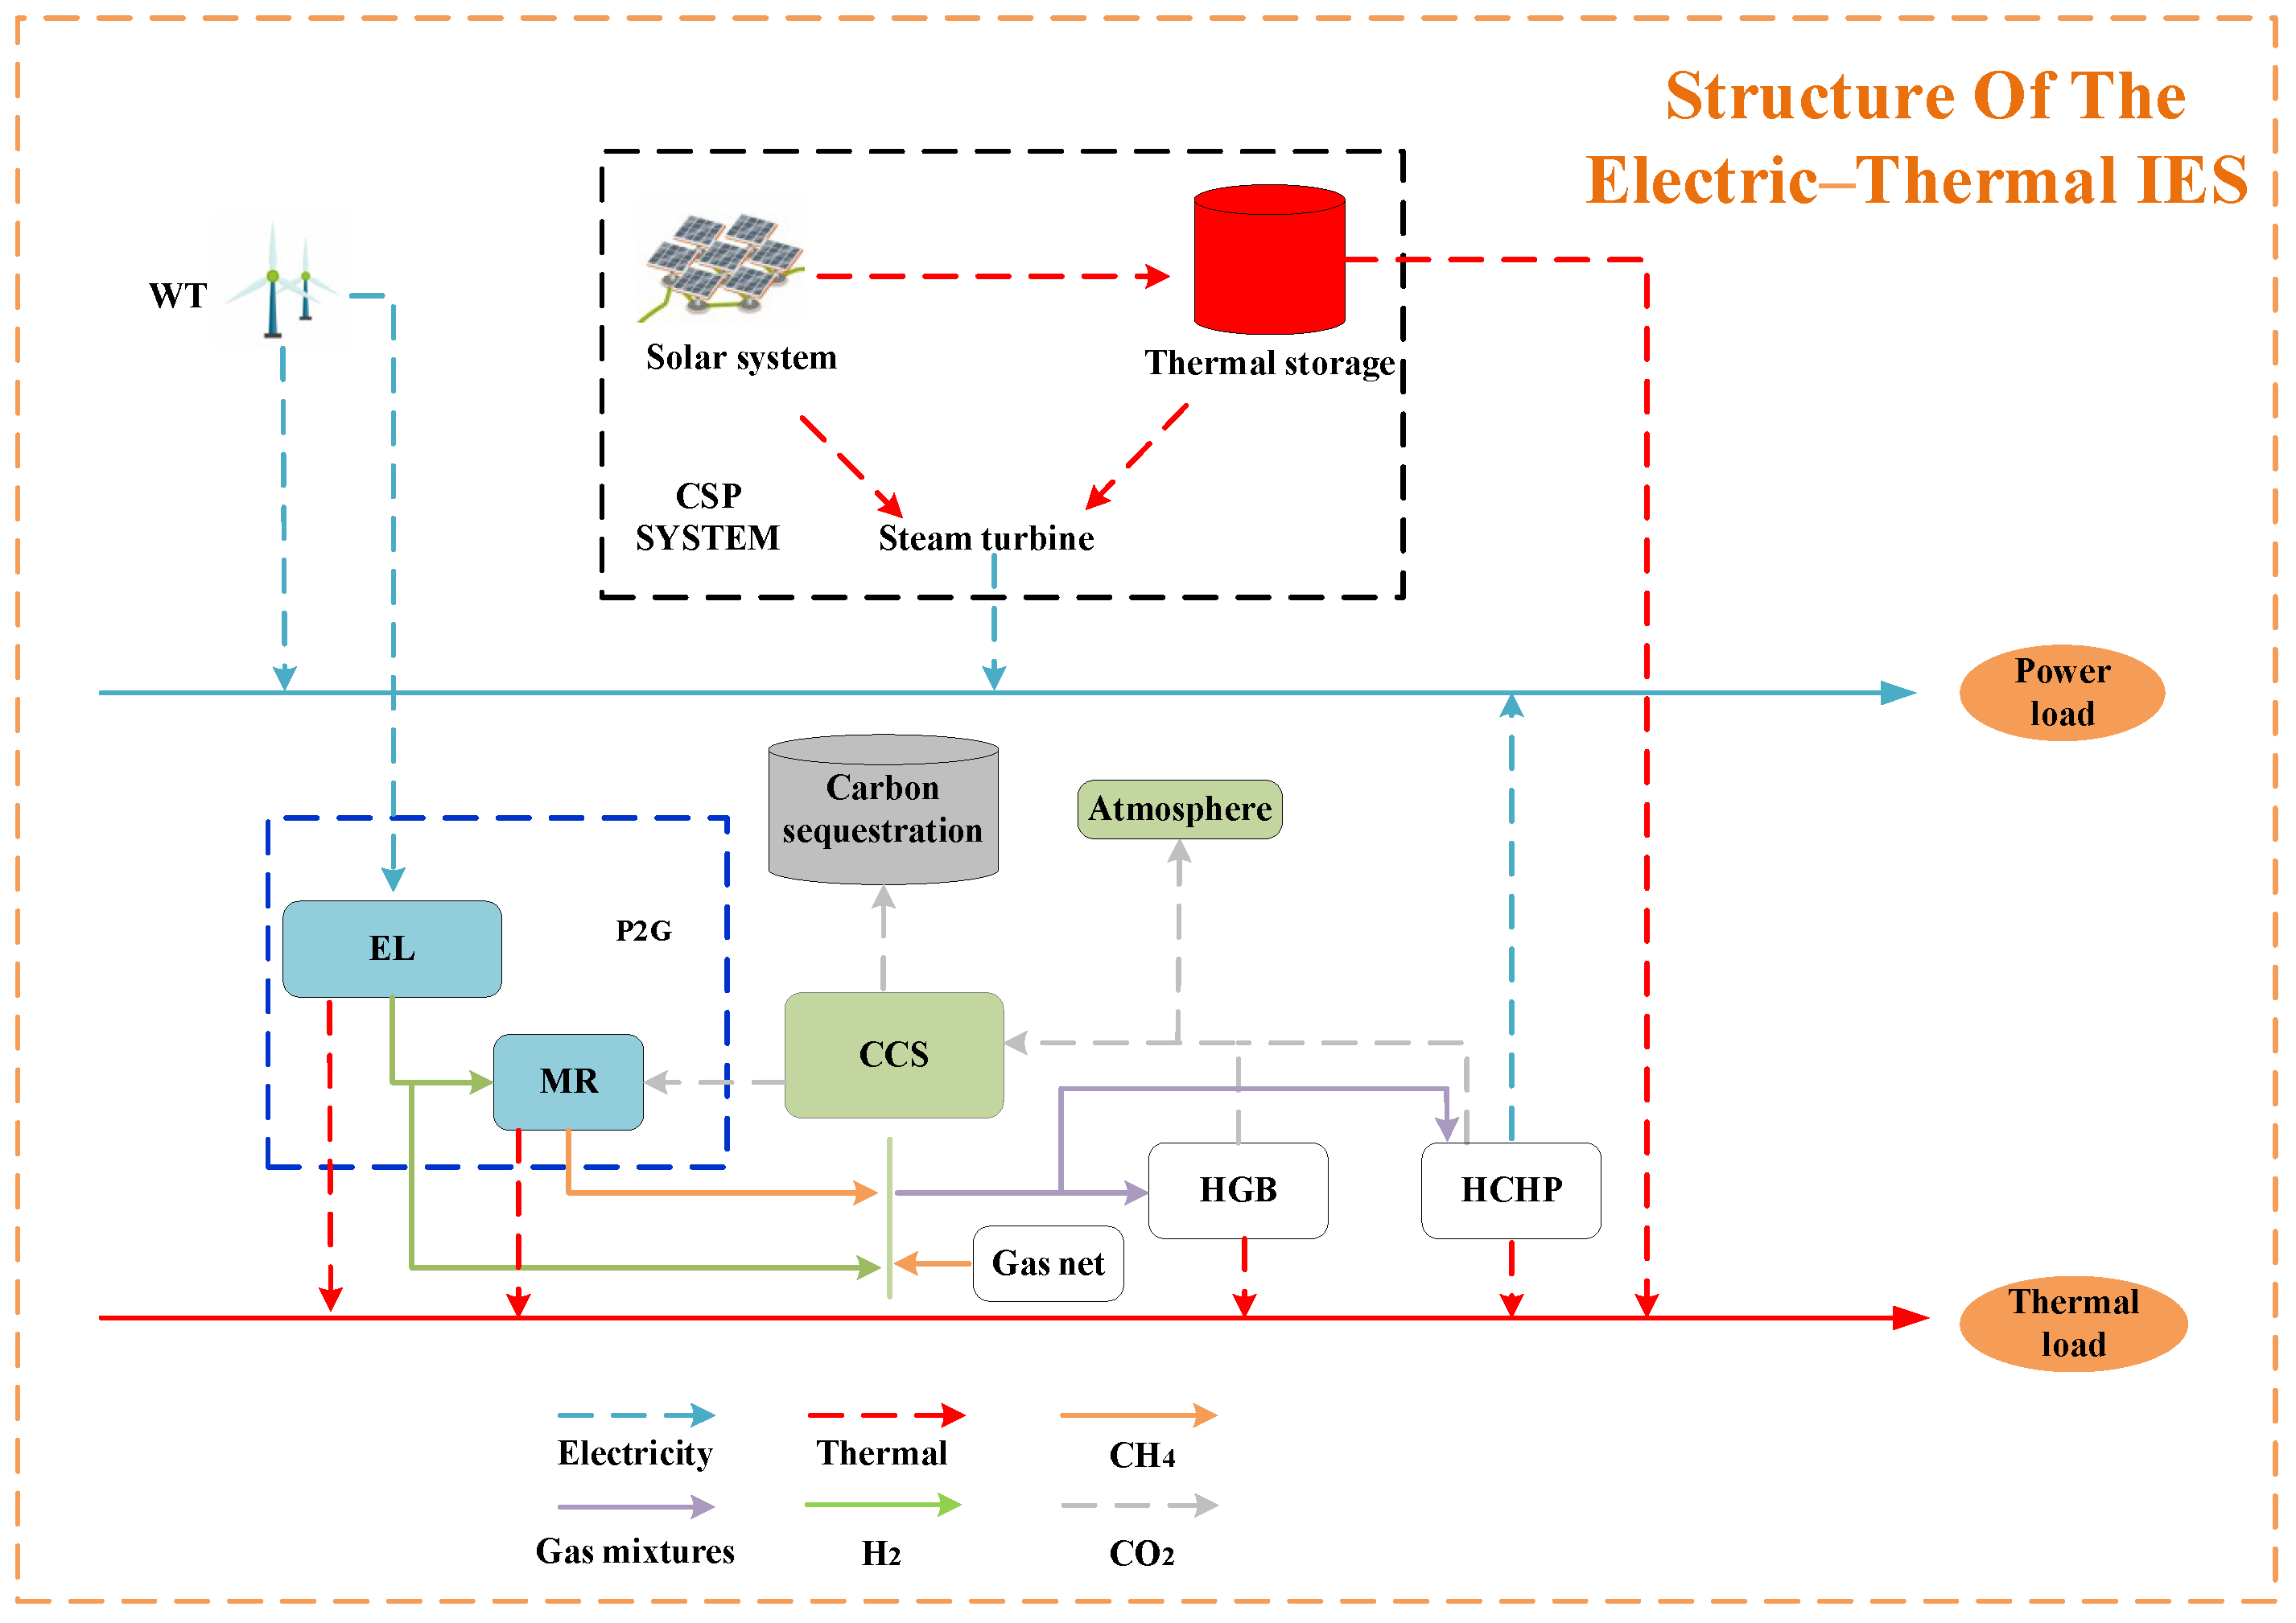
2.1. Structure of the Electric–Thermal Integrated Energy System

The structure of the electric–thermal IES is shown in Figure 1, in which the feedstock of the CHP and GB is a mixture of natural gas and hydrogen, which is different from traditional gas-fired units. The required power load is supplied by CSP, CHP, and a wind turbine (WT); the thermal load is supplied by heat generated by CHP, a GB, CSP, and P2G; the electrical power consumed by CCS is supplied by CHP; the natural gas source is obtained from the gas network and through methanization; and the electrical power consumed by P2G is residual WT power.

2.2. System Operation Strategy Analysis

In the scheduling process of the whole energy system, to maximize the power issued by the WT, it is first used to satisfy the demand for electric loads, and ELs utilize the surplus wind power to generate hydrogen through electrolysis; this is used for methanation and mixed with methane in a certain proportion in the transmission pipeline to form a mixture of gases to be supplied as raw materials for HCHP and the HGB for combustion. When there is a shortage of hydrogen, the supply of an MR is given priority, but it must be ensured that a safe proportion of natural gas is mixed with hydrogen. When hydrogen is insufficient, an MR is preferentially supplied, but a safe ratio of hydrogen doping in natural gas should be ensured. At the same time, the heat generated by the electrolysis process of ELs and by the MR is supplied to the heat load, and the HCHP and CCS equipment are bundled to form HCHP-CCS; most of the electricity generated by HCHP is used for electric loads and the rest is used for CCS, and the small amount of CO2 that cannot be captured is discharged into the atmosphere through pipelines to ensure that HCHP and the HGB maintain a low-carbon effect during the operation process. The CSP power plant converts thermal energy collected by the light field and provided by the TES into electrical energy, completing the heat-to-electricity conversion, which effectively mitigates electro-thermal coupling in conventional gas turbines to enhance the performance and stability of the system.

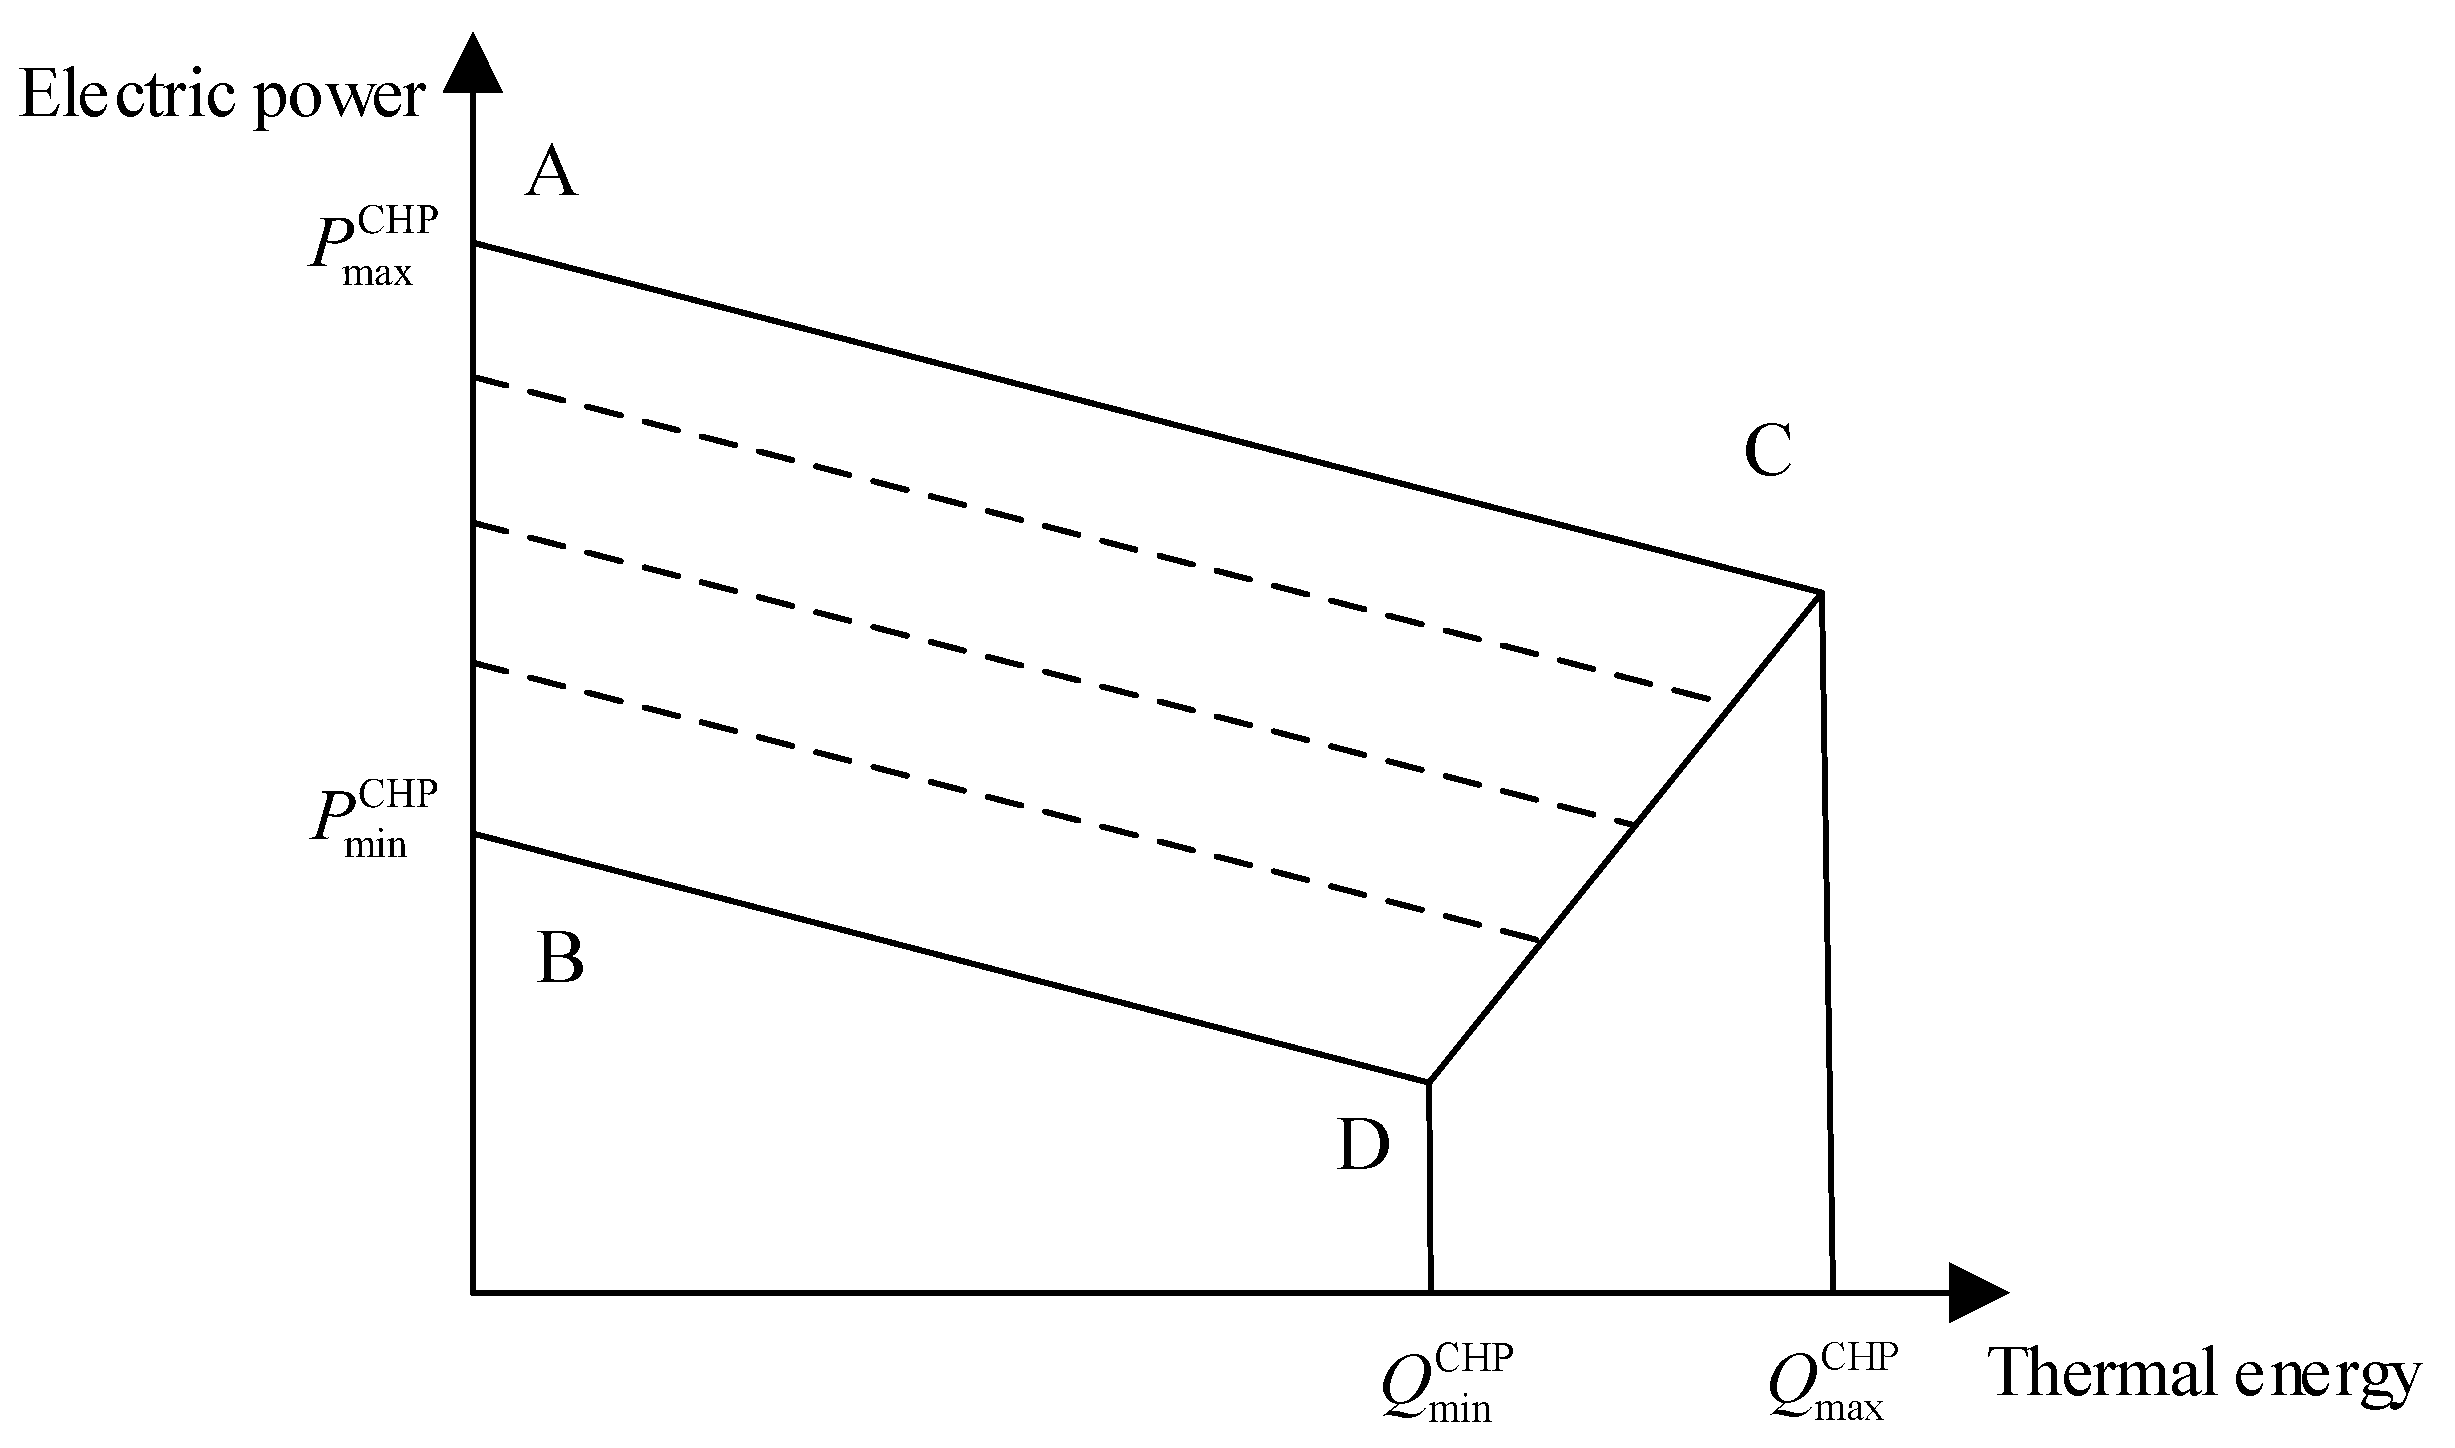
2.3. Mechanism of Joint Operation of CSP and CHP

2.3.1. Electro-Thermal Characteristics of the CHP Operating Mode

CHP comprises the coupling of an electric power system and a thermal energy system and is most common in condensate-pump thermoelectric units. In this study, a condensate-pump cogeneration unit was used as the object of study, and its electrical and thermal operating characteristics are shown in Figure 2 [20].
Usually, CHP units are in the “setting electricity by heat” operation mode, which first ensures a supply of thermal loads and then considers the demand for electric loads. The AC and BD line segments indicate the corresponding electricity and heat outputs at the maximum and minimum air intake of the CHP units, respectively; A and B indicate the maximum ( P max CHP ) and minimum power supply ( P min CHP ), respectively; and C and D indicate the maximum and minimum heat supply power, respectively. The maximum and minimum heating power are denoted by Q max CHP and Q min CHP , respectively. As shown in Figure 2, the range of adjustable electric power becomes smaller as the thermal energy increases, and the unit directly loses its ability to regulate when the unit’s thermal load reaches its maximum value.

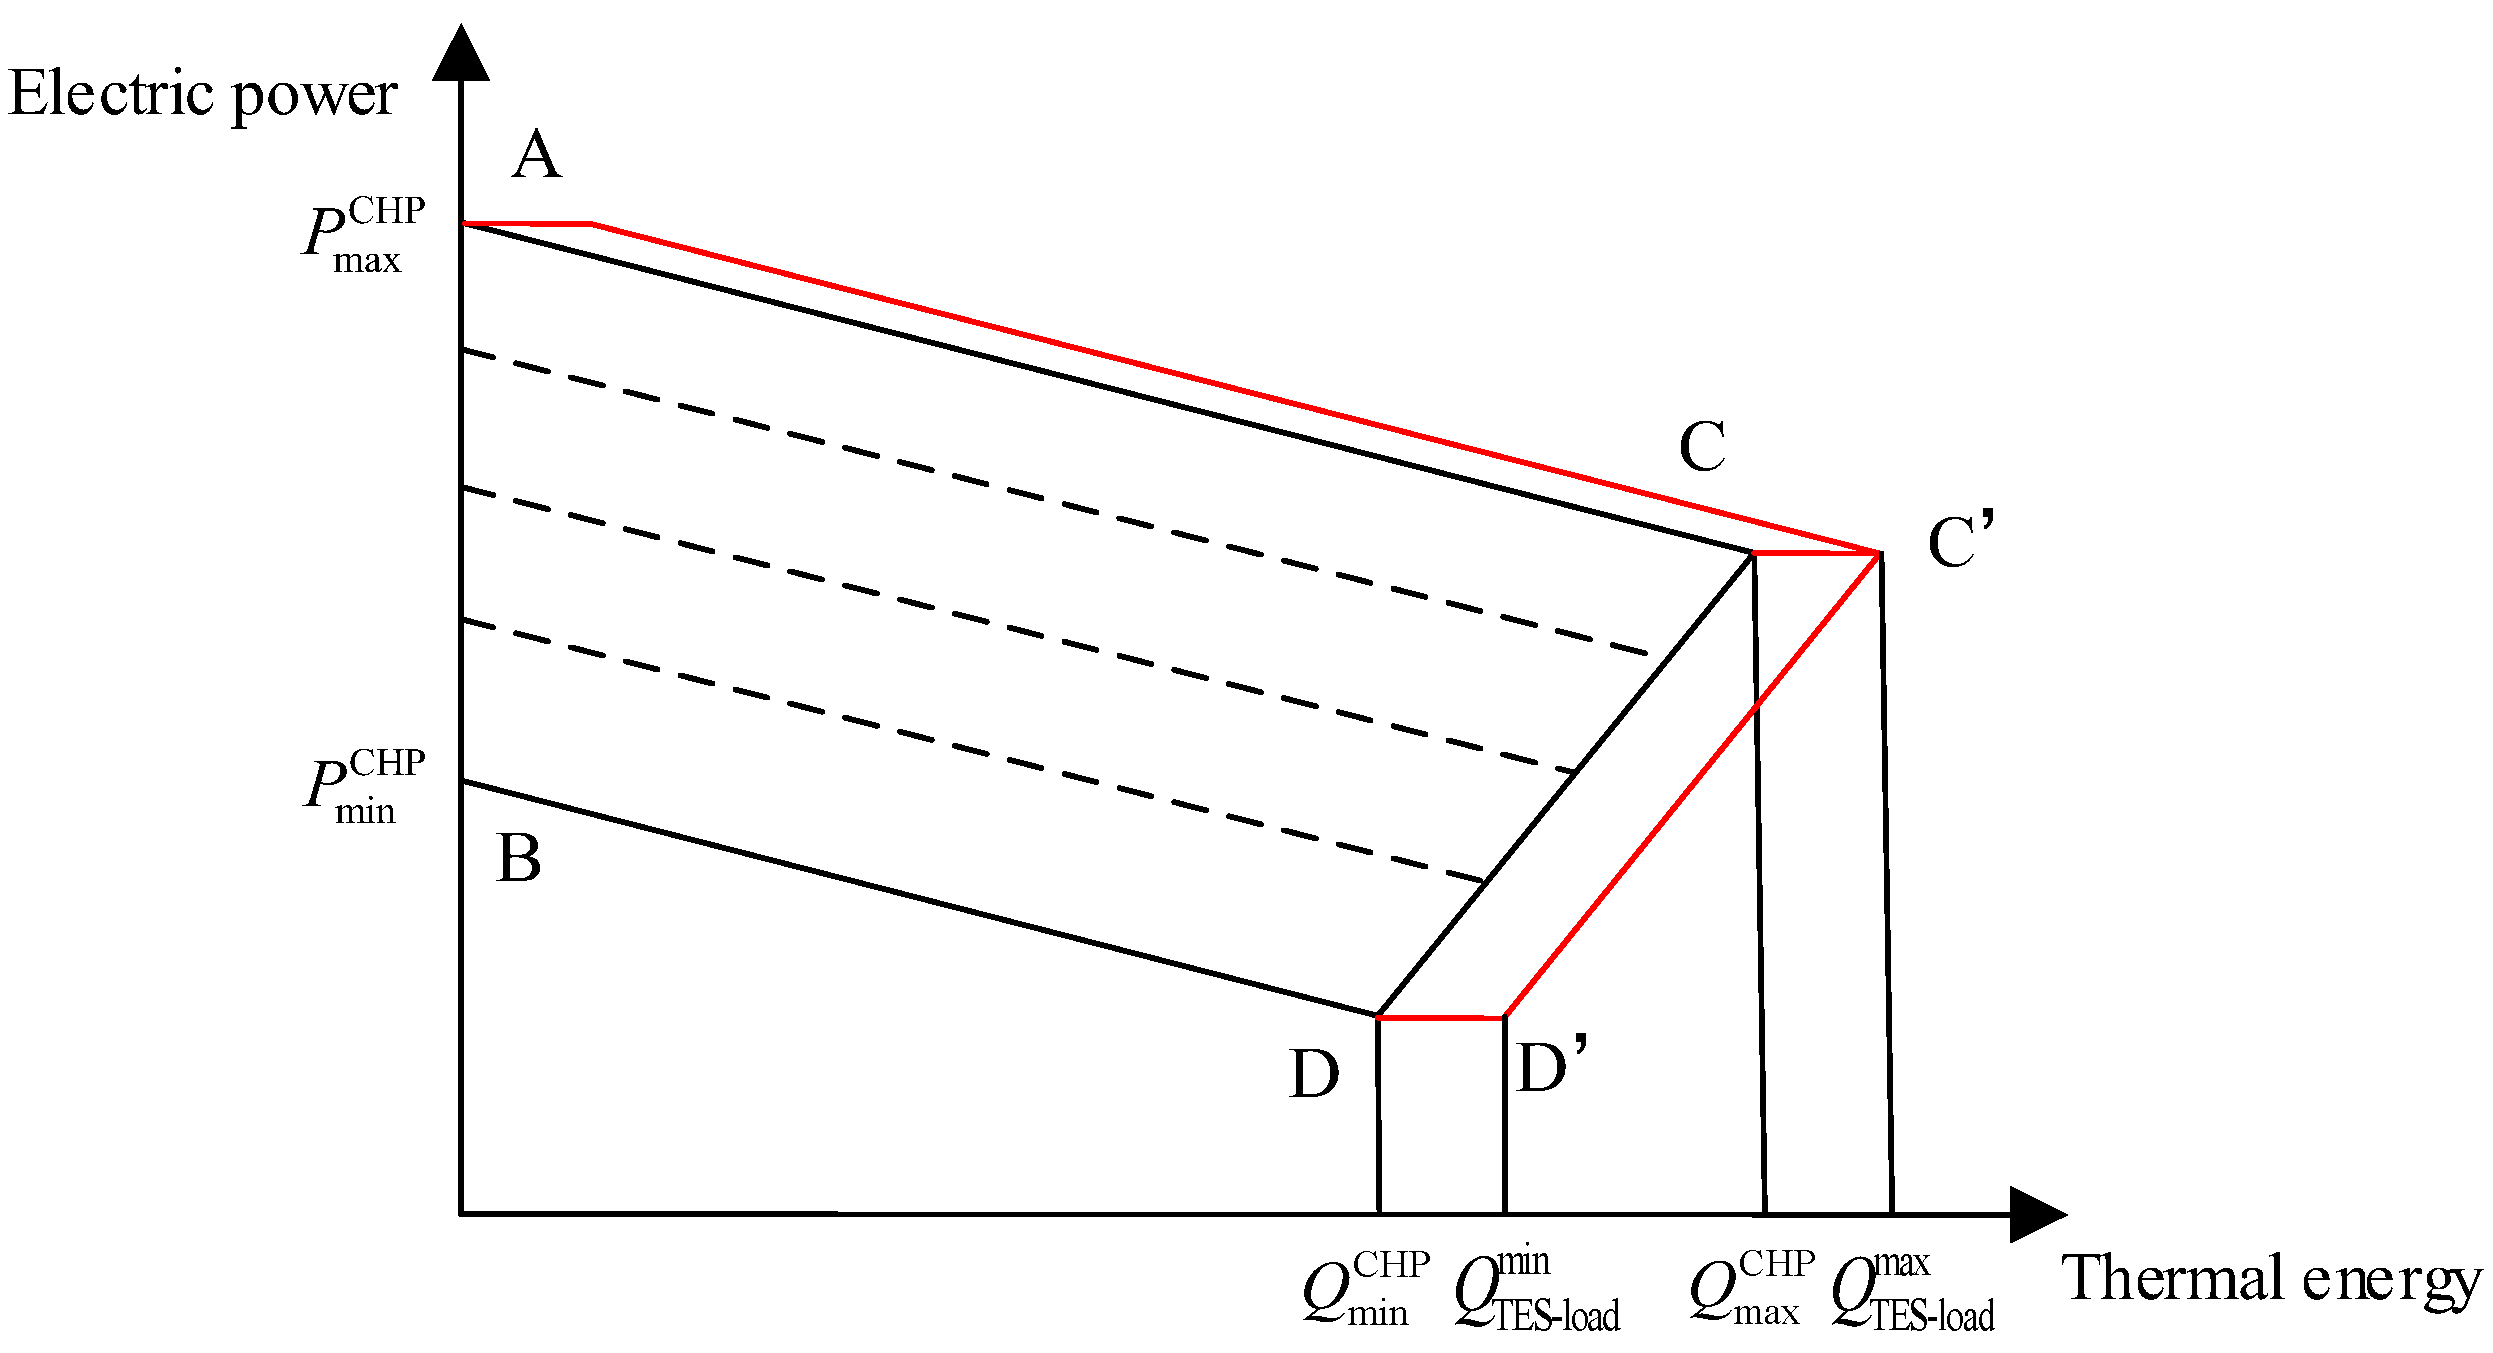
2.3.2. Joint Operation of CSP and CHP

The CSP heat storage system has the advantages of a large capacity and high efficiency, so it can be combined with CHP to form a joint CSP-CHP system for heat supply, thus reducing the impact of the “heat for electricity” operation constraints on the peak shifting capability of the CHP unit when a single CHP unit is used for heat supply. The electrical and thermal characteristics of the joint operation of CSP and CHP are shown in Figure 3.
Upon introducing CSP into the system in conjunction with CHP, assuming that the heating power supplied by CSP at moment t is Q TES-load , t , it can be determined that the thermal energy to be supplied by the CHP unit at moment t is Q load , t Q TES-load , t . That is, the heat supply from CSP reduces the amount of incremental thermal energy that the CHP needs to generate; from another perspective, this is equivalent to an upward adjustment ( Q TES-load , t ) in the amount of incremental thermal energy that the CHP is able to generate at moment t through the thermal energy compensation from CSP. In the original diagram of CHP electrical characteristics, the original AC and BD line segments are all shifted to the right by a length of Q TES-load max . This shows that the addition of CSP improves the electric heating unit in the heating range and the flexibility of the electric power regulation ability, giving more space for new energy consumption.

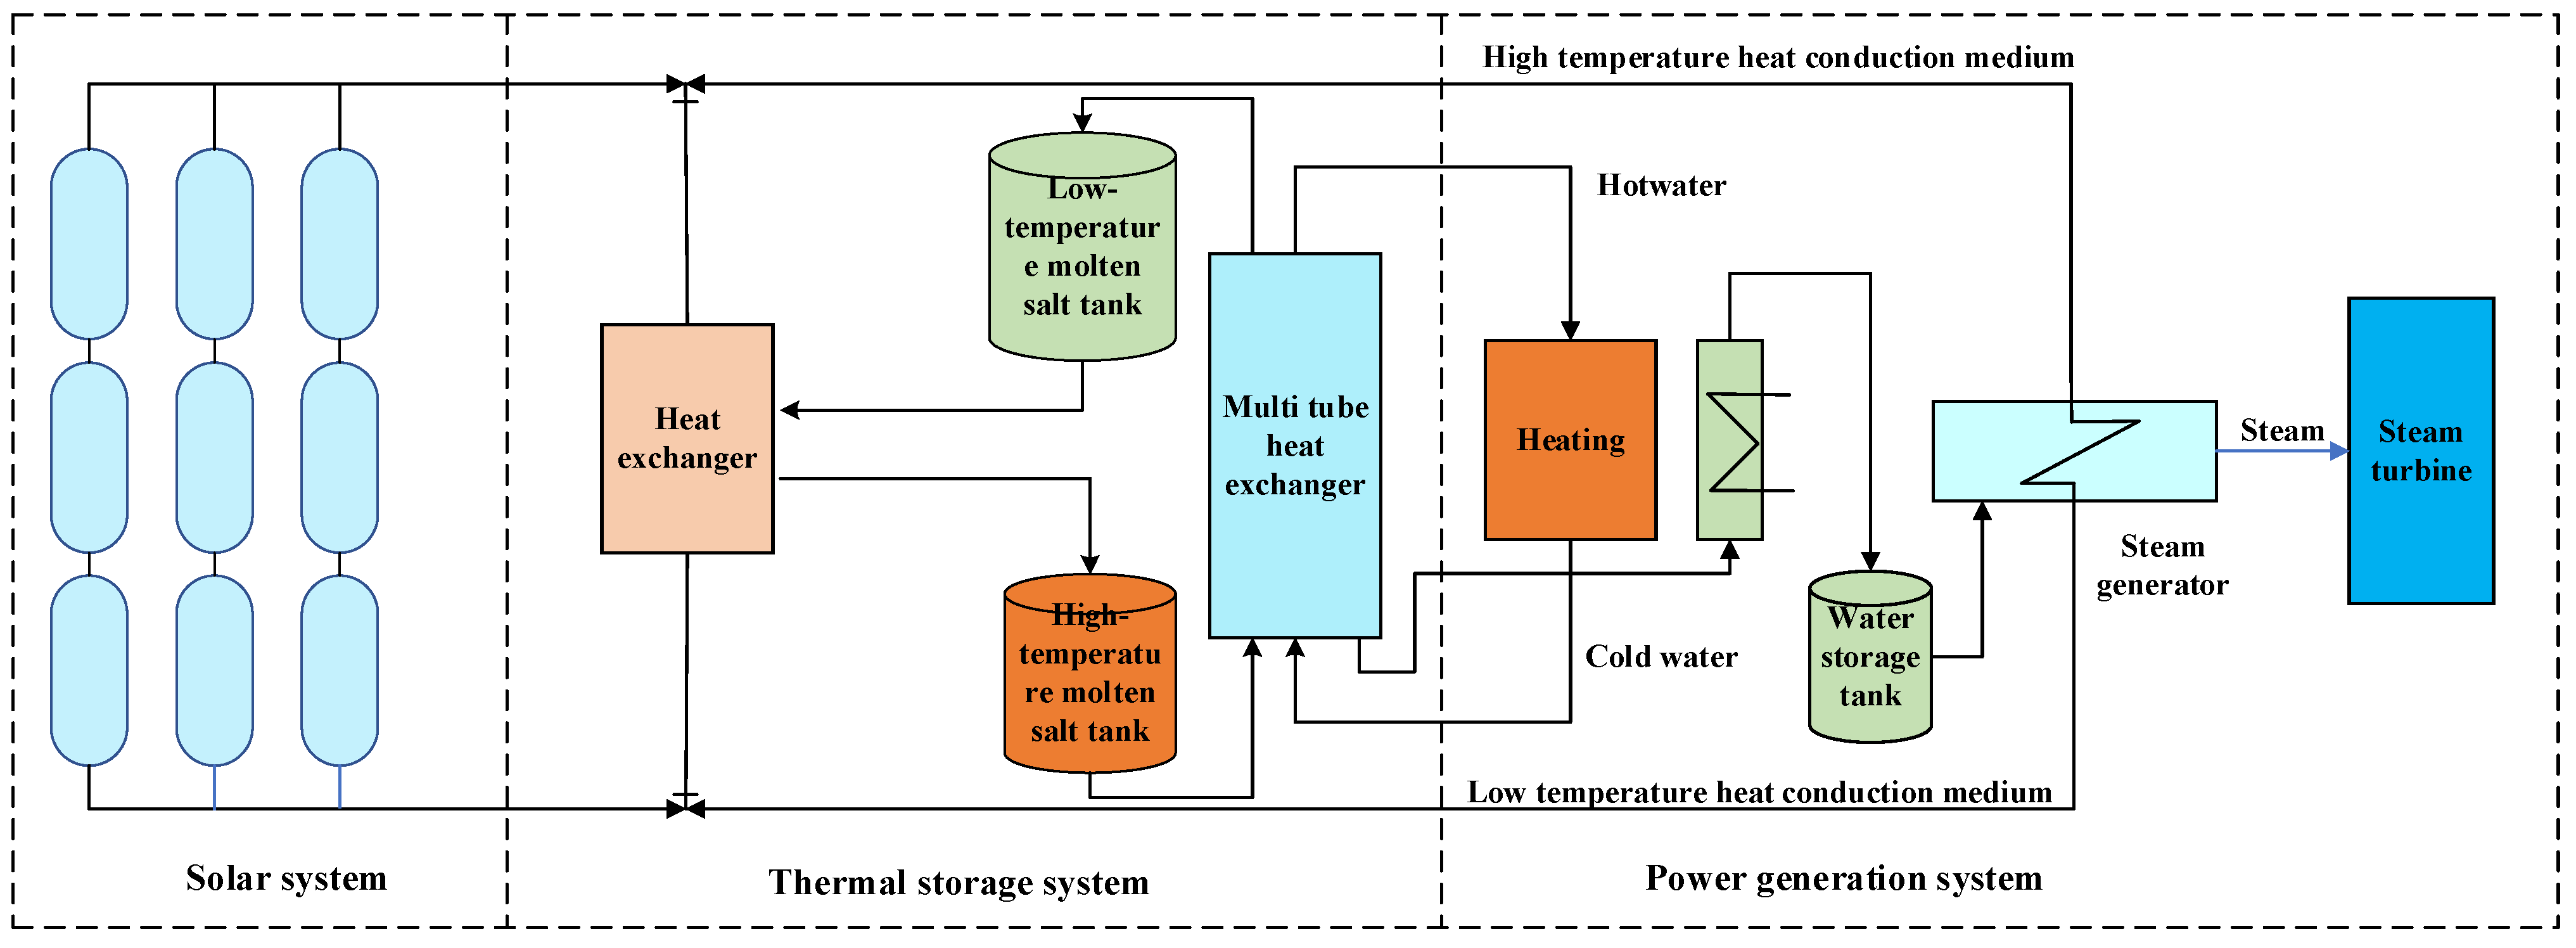
2.4. CSP Mathematical Model

At present, there are four types of CSP technology: solar parabolic dishes (SPDs), parabolic trough collectors (PTCs), solar power towers (SPTs), and linear Fresnel reflectors (LFRs). Among them, the installation rate of PTC-CSP units is the highest in the world. The advantage of PCT-CSP is that it can effectively cope with changes in cloudy weather with the help of the thermal inertia of the heat transfer medium. The temperature can be kept relatively stable in the thermal circulation system, and the power grid welcomes high-quality power output and large-scale energy storage [21]. Therefore, PTC-CSP was selected for the study.
CSP absorbs solar energy through the solar field (SF) and converts it into thermal energy, which is transmitted to a turbine or TES through an internal heat transfer conductor, and is able to adjust the same day’s output according to the load demand for scheduling. The thermal energy can be transferred from the TES to the turbine to increase the generation capacity during the peak-load period; it can be saved in the TES during low-load periods and has good energy time-shift characteristics. Figure 4 shows a schematic diagram of the energy flow of CSP.
CSP absorbs solar energy through SF and converts it into heat, some of which can be directly delivered to the turbine for power generation and some of which can be transferred to the TES for reserve energy. According to the load power, CSP can be flexibly dispatched to meet the load demand [22].
Q Sloar , t = Q CSP , e , t + Q SF-TES , t
where Q Sloar , t (kW) is the converted thermal energy absorbed by SF at time t, Q CSP , e , t is the thermal energy transferred directly by SF to the turbine for power generation at time t, and Q SF-TES , t is the thermal energy stored in the TES from the heat absorbed by SF at time t.
The generating power of CSP is mainly derived from the thermal energy stored in the SF as well as the TES, and it is calculated with the following equation:
P e , t CSP = n r-d ( Q CSP , e , t + Q TES-ST , t )
where P e , t CSP is the electric power emitted by the CSP at moment t, n r-d is the thermoelectric conversion efficiency of the CSP, and Q TES-ST , t is the thermal energy transferred to the turbine by the TES at moment t.
The TES can store heat and transfer it from the TES to the turbine through a high-temperature heat-conducting medium to generate electricity or heat during peak loads, while rich heat can be stored during low loads to improve energy utilization and reduce costs [23].
V TES , t = ( 1 n loss ) Q TES , t 1 + n + Q cha , t n Q dis , t Q cha , t = Q SF-TES , t + Q P 2 G , t Q dis , t = Q TES-load , t + Q TES-ST , t
where V TES , t (kW) is the heat in the TES at moment t; n loss is the heat loss coefficient in the TES; Q TES , t 1 is the heat in the TES at moment t − 1; n + and n are the efficiency coefficients of heat storage and heat release, respectively; Q cha , t is the heat charged to the TES at moment t; Q dis , t is the heat released by the TES at moment t; and Q TES-load , t is the thermal energy transferred to the load from the TES at moment t.

2.5. HCHP and HGB Mathematical Modeling

Hydrogen energy has the advantage of zero carbon emissions, and the combination of hydrogen and CHP has become a major trend in the development of green energy. In this study, a portion of the hydrogen produced through the electrolysis of water for hydrogen production in the first stage of P2G is fed directly into CHP and a GB; the feedstock for the combustion of CHP and GB is changed to hydrogen obtained through P2G production, natural gas obtained through methanization, and a supply of purchased gases. As a result, traditional combined heat and power and gas boilers are converted into hydrogen-doped combined heat and power (HCHP) and gas boilers (HGBs). Since only water is produced from the combustion of hydrogen, carbon emissions can be effectively reduced, promoting a low-carbon system [19].
The hydrogen of the cogeneration unit is incorporated into the natural gas by adjusting the mixing ratio of natural gas and hydrogen through the transmission pipeline. Specifically, the gas pipeline is used to transport the gas to the gas supply system of the cogeneration unit. In the gas supply system, the flow of hydrogen and natural gas is controlled by installing a mixing valve or a regulating valve, and the opening of the valve is adjusted to regulate the mixing ratio.

2.5.1. HCHP Modeling

The study presented in [24] shows that the natural gas-hydrogen doping content ratio of CHP is in the range of 10% to 20% (volume ratio) and the burner can achieve safe and stable combustion; the mathematical model of HCHP is as follows:
P t HCHP = ( Q CH 4 , t HCHP + Q H 2 , t HCHP ) k HCHP P Q t HCHP = ( Q CH 4 , t HCHP + Q H 2 , t HCHP ) k HCHP H λ t = k HCHP , t H / k HCHP , t P Y H 2 , HCHP t = Q H 2 , t HCHP R H 2 Q CH 4 , t HCHP R CH 4 + Q H 2 , t HCHP R H 2
where k HCHP , t P and k HCHP , t H are the electrical and thermal efficiencies of HCHP; P t HCHP and Q t HCHP are the electrical power and thermal energy of HCHP at time t; Q CH 4 , t HCHP and Q H 2 , t HCHP are the powers corresponding to the natural gas and hydrogen consumed by CHP at time t, respectively; λ t is the ratio of thermoelectricity; R H 2 and R CH 4 are the calorific values of hydrogen and natural gas (kJ/m³), respectively; and Y H 2 , HCHP t is the hydrogen doping ratio (volume ratio) at time t.

2.5.2. HGB Modeling

When GB uses hydrogen-doped mixed gas, the molar mass ratio of hydrogen is kept in the range of 2% to 20% [24], and the HGB mathematical model is as follows:
Q t HGB = ( Q CH 4 , t HGB + Q H 2 , t HGB ) k HGB Y H 2 , t HGB = Q H 2 , t HGB ρ H 2 M H 2 R H 2 Q CH 4 , t HGB ρ CH 4 M CH 4 R CH 4 + Q H 2 , t HGB ρ H 2 M H 2 R H 2
where k HGB is the thermal conversion efficiency of HGB; Q t HGB is the moment HGB thermal energy at moment t; Q CH 4 , t HGB and Q H 2 , t HGB are the corresponding powers of hydrogen and natural gas consumed by HGB at moment t, respectively; M H 2 and M CH 4 are the relative molecular masses of hydrogen and natural gas (g/mol); and Y H 2 , t HGB is the hydrogen doping ratio of HGB (molar mass) at moment t.

2.5.3. Electrolyzer Modeling

Currently, alkaline electrolysis (AE), proton exchange membrane (PEM) electrolysis, and high-temperature solid oxide (HTSO) electrolysis are the mainstream technologies for hydrogen production from electrolyzed water. Among these technologies, PEM electrolysis has excellent ramping capability and high flexibility, so, in this study, PEM technology was chosen as the method for electrolyzing hydrogen [18].
EL is capable of converting abundant electrical energy into hydrogen energy while generating heat [25].
V H 2 , t = η EL P EL , t L H 2 Q EL , t = ( 1 η EL ) P EL , t P EL min P EL , t P EL max
where V H 2 , t is the rate of hydrogen produced (kg/h), P EL , t is the electric power consumed by the EL at moment t, η EL is the efficiency of the EL, L H 2 is the calorific value of hydrogen in KJ/kg, and Q EL , t is the thermal energy produced at moment t.

2.5.4. MR Modeling

The MR process consumes CO2 and generates heat accordingly and is modeled as follows [26]:
E MR , t = K CO 2 MR V H 2 , t in Q MR , t = K CO 2 Q V H 2 , t in
where E MR , t is the mass of CO2 consumed by MR at time t in t(kg), K CO 2 MR = 19.8 is the consumption coefficient of CO2, V H 2 , t in is the hydrogen input at time t, Q MR , t is the heat generated by MR at time t (MWh), and K CO 2 Q = 20.6 is the thermal energy coefficient.

3. Scheduling Strategy Based on Joint Operation of CSP and Hydrogen-Doped Combustion

3.1. Objective Function

In this study, the integrated operating cost is minimized, and the integrated costs of the cogeneration operation include equipment operation and maintenance, gas purchase, wind and solar abandonment, and carbon sequestration. The comprehensive operating cost can be expressed as follows:
F min = F eg + F op + F w + F cs
where F eg , F op , F w , and F c s denote the costs (USD) of purchased energy, operation and maintenance, wind abandonment, and carbon sequestration, respectively.
(1)
Equipment operation and maintenance costs:
F op = t = 1 24 ( c CSP ( P e , t CSP + Q TES-load , t ) + c HCHP ( P t HCHP + Q t HCHP ) + c HGB Q t HGB + c wt P wt , t + c EL P EL , t )
where c csp , c chp , c wt , and c EL are the unit O&M costs of CSP, the HGB, HCHP, the WT, and the EL, respectively; P e , t CSP is the electric power output from CSP at time t; Q t HGB is the thermal energy output from HGB at time t; P EL , t is the power consumed by the EL at time t; P t HCHP and Q t HCHP are the electric power and thermal energy output from HCHP at time t, respectively; and P wt , t is the power output from the WT at time t.
(2)
Purchased energy costs:
F g = t = 1 24 c g V buy , t g
where V buy , t g is the purchased gas volume at time t(kW) and c g is the purchased gas price at time t.
(3)
Wind abandonment costs:
F w = t = 1 24 c w P wt , t curt
where P wt , t curt is the wind power lost at time t and c w is the cost of wind abandonment.
(4)
Cost of carbon emissions:
The carbon emission costs include carbon sequestration and trading, and the main emission source is the gas unit; the corresponding equation for the system’s carbon emissions is as follows [27]:
F co 2 = C f + C p C f = t = 1 24 s cs m cs , t C p = σ ( ( E z C f ) C quota ) C quota = μ t = 1 24 P t CHP
where F co 2 is the total cost of carbon emissions, C f is the cost of carbon sequestration; C p is the cost of carbon trading, s cs is the cost coefficient of carbon sequestration (USD/kg), m cs , t is the mass of CO2 sequestered at moment t (kg), σ is the cost coefficient of carbon emissions (USD/kg), C quota is the carbon allowance, and μ is the quota coefficient per unit of electricity generated by gas turbines (kg/kW-h).

3.2. Constraints

(1)
Electrical power balance constraints:
P wt , t + P e , t CSP + P t CHP = P load , t e + P EL , t
where P wt , t is the generating power of the WT at moment t and P load , t e is the electric power demanded by the load at moment t.
(2)
Thermal energy balance constraints:
Q t CHP + Q TES-load , t + Q P 2 G , t = Q load , t
where Q load , t is the thermal energy required by the thermal load at moment t and Q P 2 G , t is the heat generated by P2G at moment t.
(3)
Natural gas balance constraints:
V buy , t g + V P 2 G , t CH 4 = V HCHP , t + V HGB , t
where V P 2 G , t CH 4 is the natural gas power generated during P2G at moment t, V HCHP , t is the natural gas power consumed by HCHP at moment t, and V HGB , t is the natural gas power consumed by HGB at moment t (kWh).
(4)
Hydrogen equilibrium constraints:
V P 2 G , t c , H 2 = V H 2 , t CHP + V P 2 G , t h , H 2
where V P 2 G , t c , H 2 is the hydrogen produced by P2G at moment t, V H 2 , t CHP is the hydrogen consumed by the gas unit at moment t, and V P 2 G , t h , H 2 is the hydrogen consumed by P2G when generating methane at moment t (kWh).
(5)
WT output constraints:
P wt , t pre = P wt , t + P wt , t curt 0 P wt , t P wt , t pre
where P wt , t pre is the predicted wind power output at moment t and P wt , t curt is the lost wind power at moment t.
(6)
CSP operational constraints:
P min CSP P e , t CSP P max CSP Q TES-load , t min Q TES-load , t Q TES-load , t max P down CSP P e , t CSP P e , t 1 CSP P up CSP
where P max CSP and P min CSP are the maximum and minimum power of CSP, respectively, and P up CSP and P down CSP are the upper and lower limits of the climbing rate of CSP.
(7)
HCHP unit constraints:
P min HCHP P t HCHP P max HCHP Q min HCHP Q t HCHP Q max HCHP P down HCHP P t HCHP P t + 1 HCHP P up HCHP λ min λ t λ max
where P max HCHP and P min HCHP are the upper and lower limits of the HCHP generation output, respectively; Q max HCHP and Q min HCHP are the upper and lower limits of the HCHP heat supply, respectively; and P up HCHP and P down HCHP are the upper and lower limits of the ramping up of the HCHP unit (kW/h).
(8)
HGB unit constraints:
Q min HGB Q t HGB Q max HGB Q down HGB Q t HGB Q t 1 HGB Q up HGB
where Q max HGB and Q min HGB are the upper and lower limits of the HGB output force and Q up HGB and Q down HGB are the upper and lower limits of the HGB climbing rate.
(9)
CCS unit constraints:
V co 2 t = τ P t CCS β P min CCS P t CCS P max CCS
where V co 2 t is the CO2 captured by CCS at time t (kg); τ is the CO2 captured per unit power of CCS; P t CCS is the capture power of CCS at time t; and P max CCS and P min CCS are the maximum and minimum power of CCS, respectively.

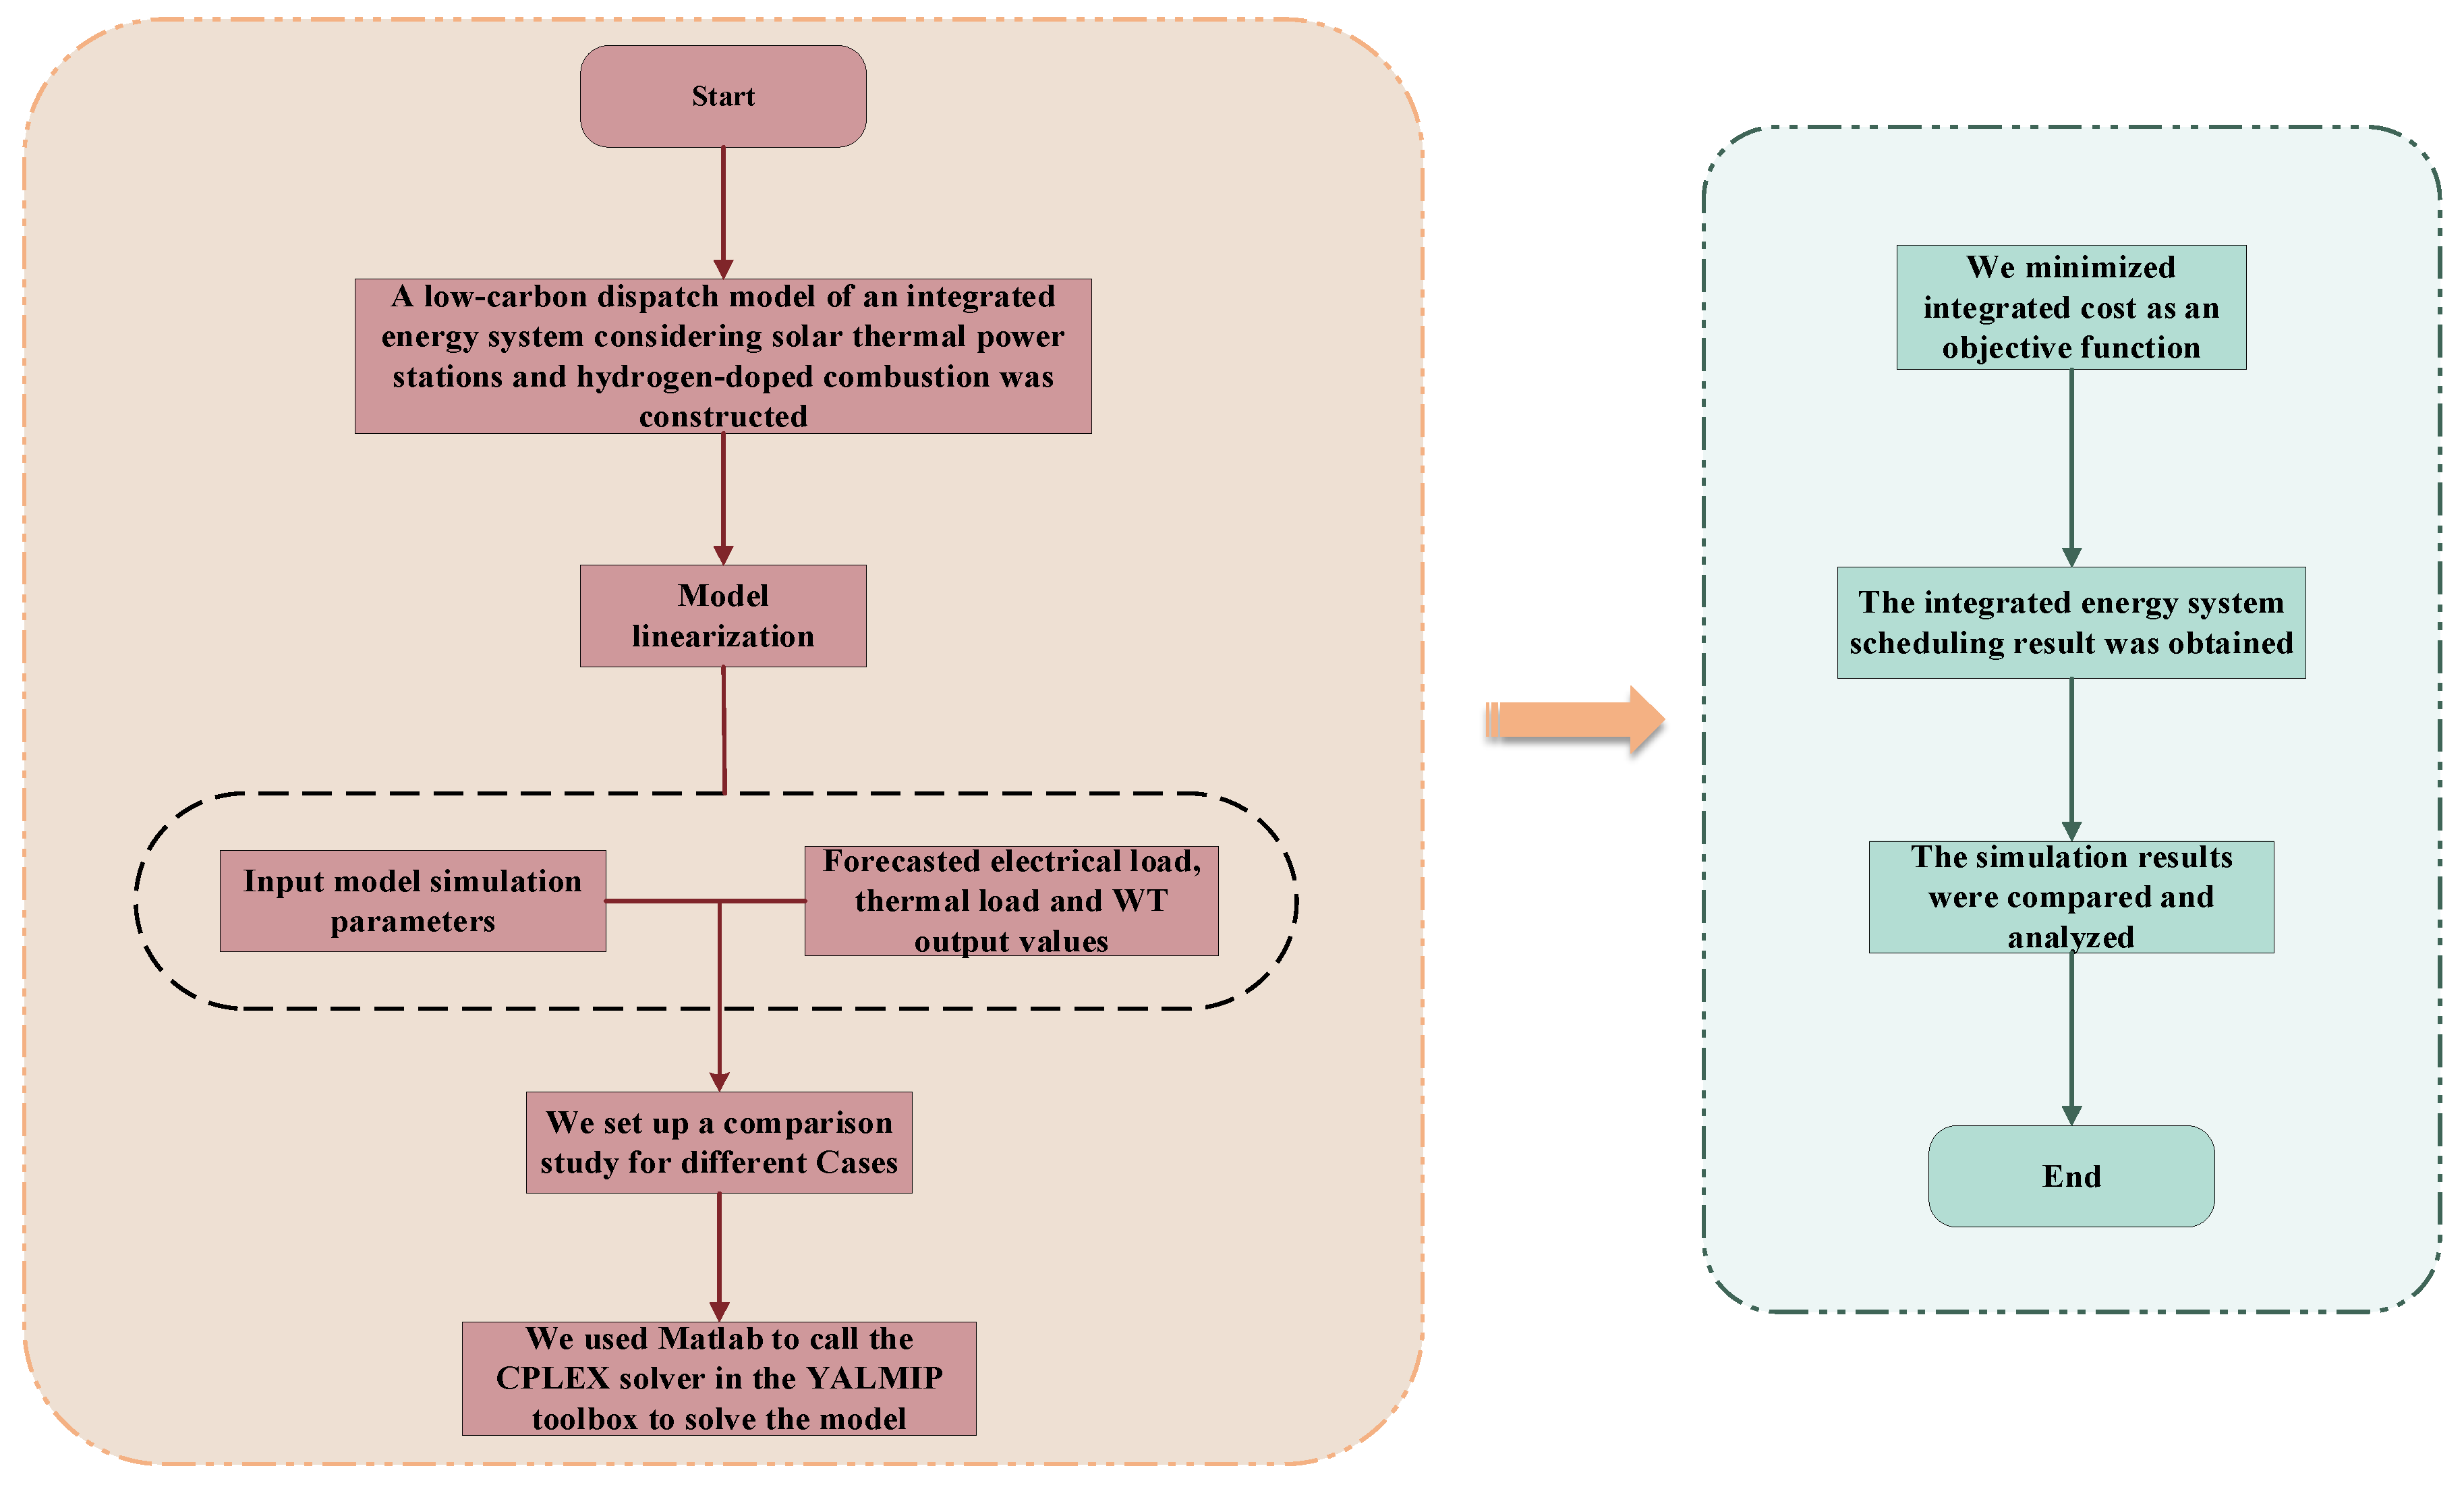
3.3. Solution Process
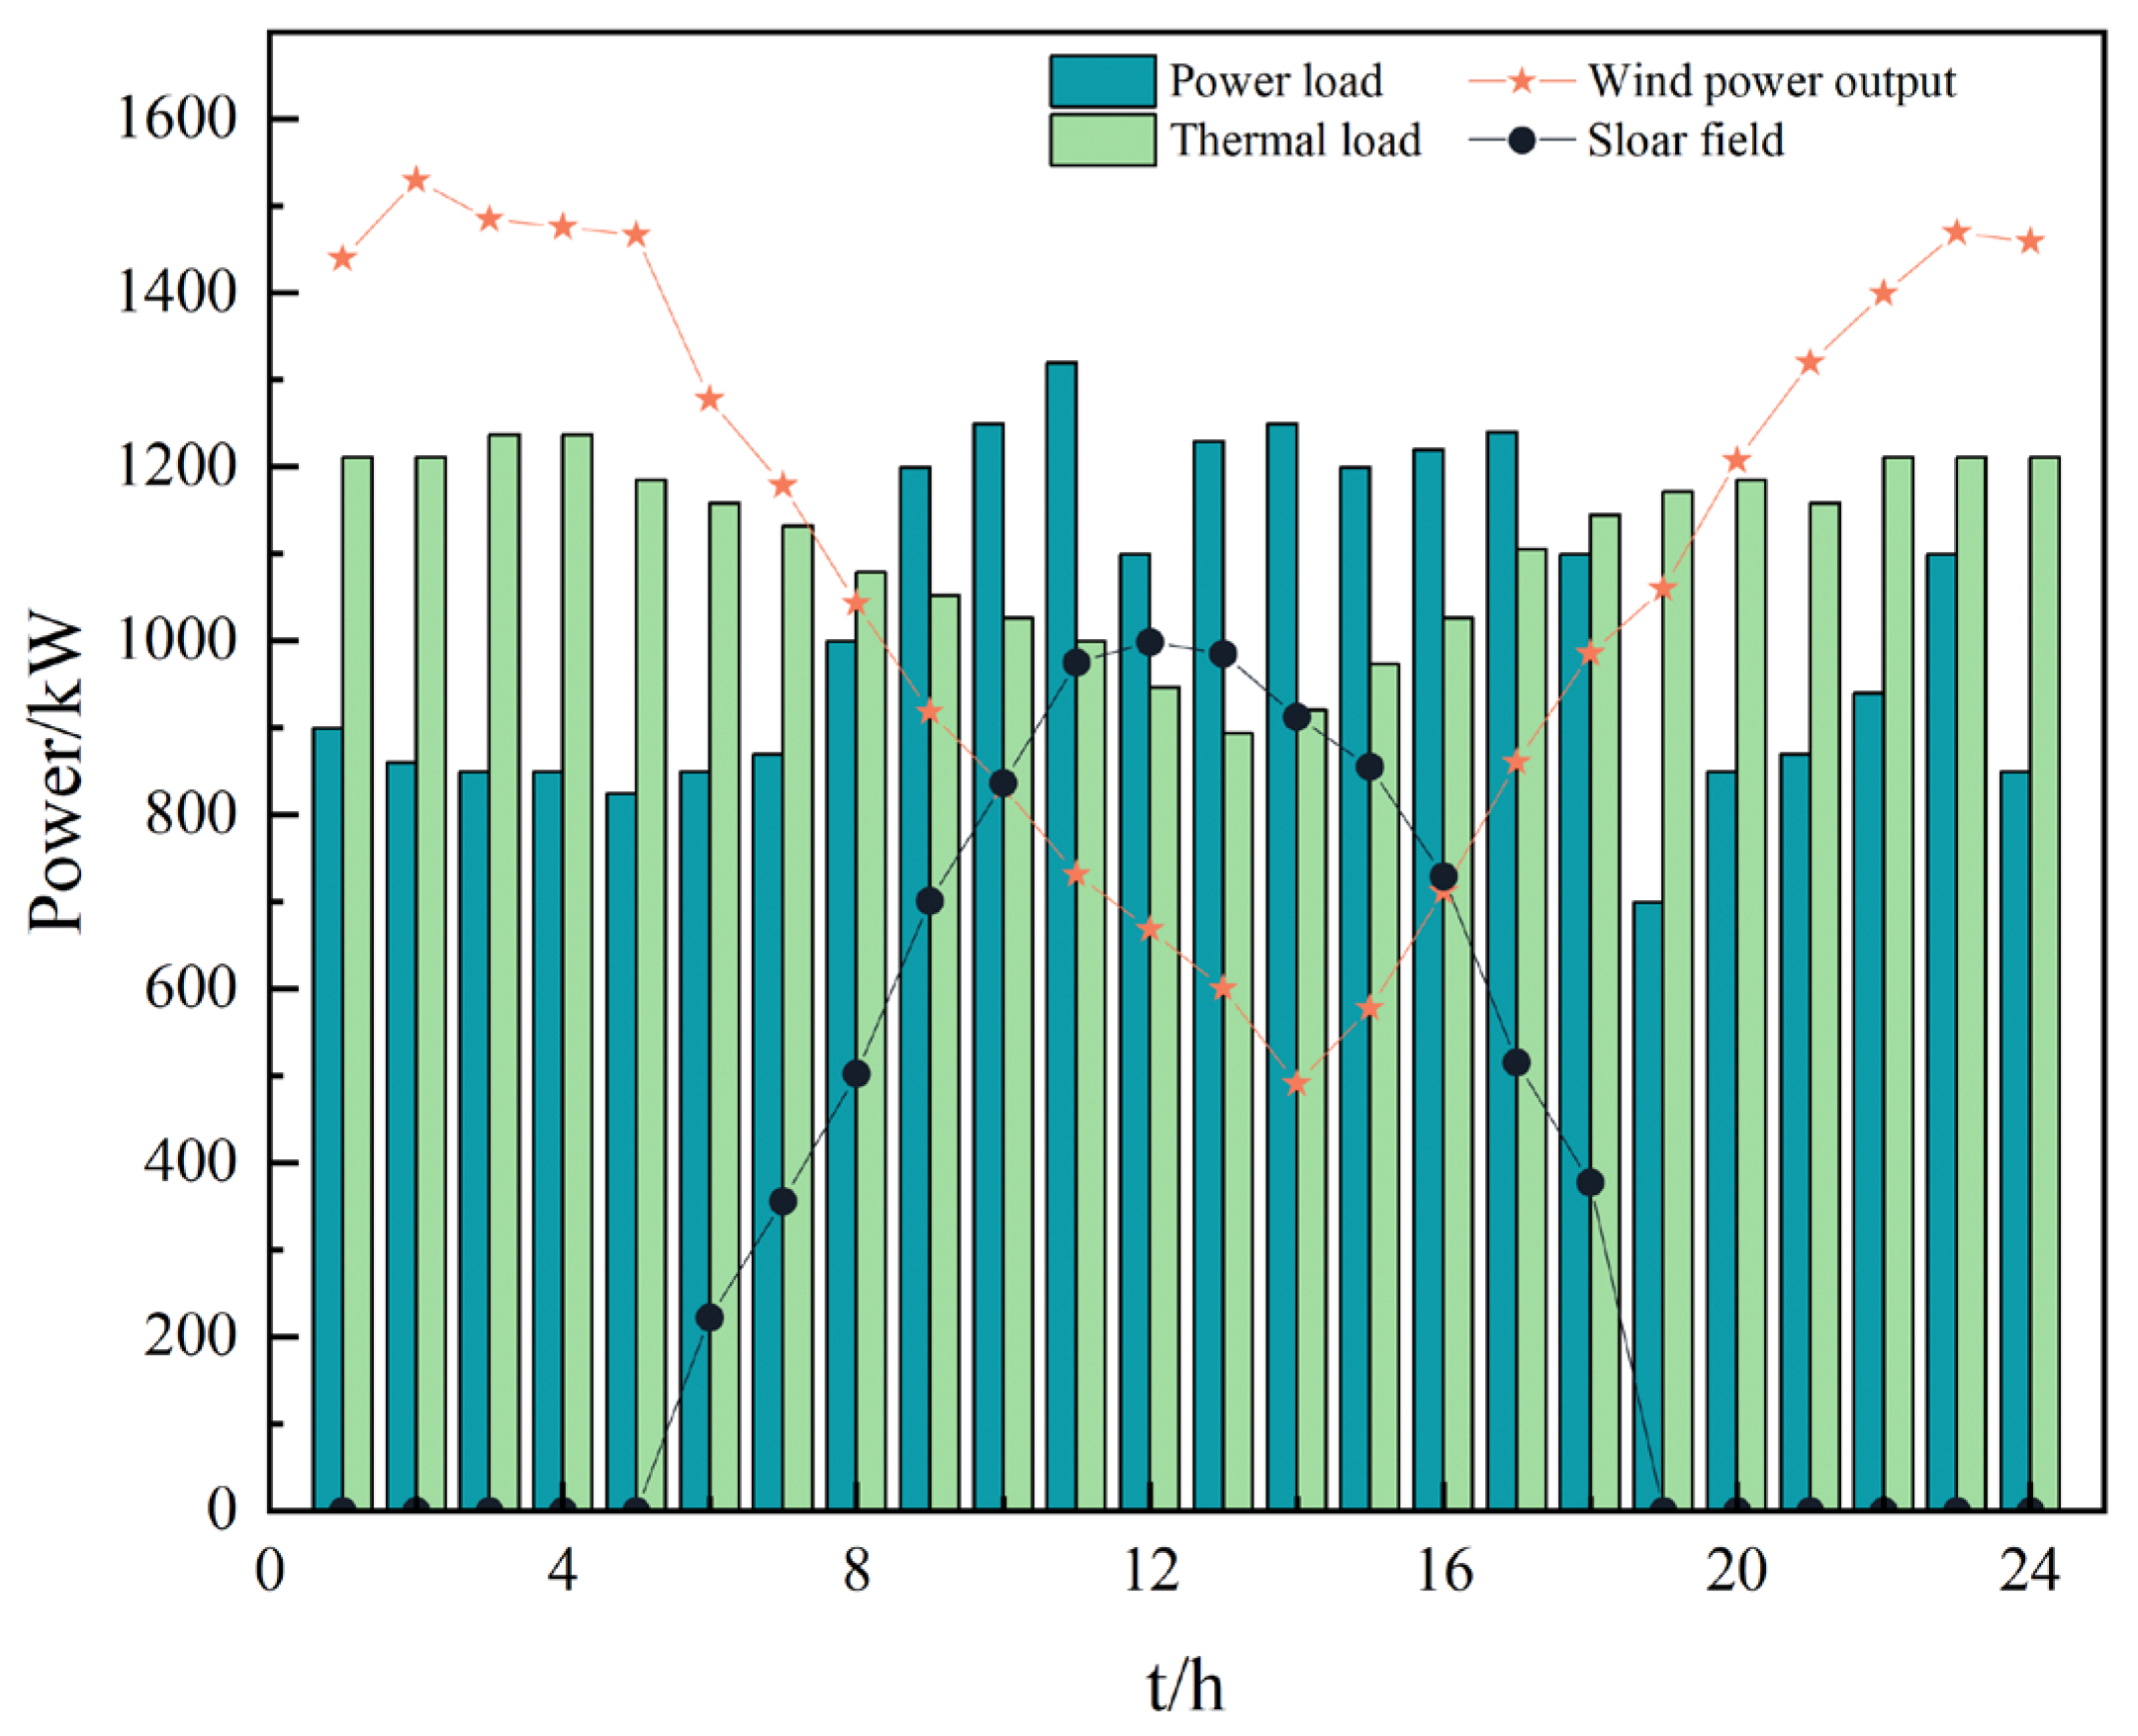
The proposed low-carbon integrated energy system dispatch model that takes into account CSP and hydrogen-doped combustion is a mixed-integer nonlinear model with nonlinear expressions for the multiplication of the variables which is transformed into a linear model using a segmental linearization method [28]. The detailed process is shown in Appendix A. It is convenient to utilize the CPLEX commercial solver in Matlab R2021b software to solve this problem. The solution flow is shown in Figure 5.

3.4. Case Setup

The IES in Figure 1 was used as the object of this study, and the arithmetic analysis was performed using data from the Tianjin city area in China. The optimization cycle of the model was 24 h per day. The curves of the electric and thermal loads, the wind power output, and the thermal energy absorbed by the SF are shown in Figure 6. The corresponding loads, the photo-thermal collection power, and the wind power output predictions for a typical day are shown in Figure 6. The parameters of each piece of equipment in the system are shown in Table 1, and the maintenance costs of each piece of equipment are shown in Table 2. The price of natural gas is taken to be 0.05 USD/kW-h [29], the carbon emission quota per unit of gas is 0.441 kg/kW-h [30], and the carbon trading price is taken to be 0.029 USD/kg [31].
In order to verify the advantages of synergistic CSP-HCHP operation under the integrated flexible operation mode, this section presents a comparative analysis of four cases, which are shown in Table 3. Among them, the HCHP unit is in the “heat-to-electricity” operation mode, i.e., it is necessary to satisfy the thermal load first, and the range of its electricity output is determined according to its heat output.

4. Results and Discussion

4.1. Cost Analysis

The scheduling costs corresponding to the four cases are shown in Table 4. Table 4 shows that Case 1 has the highest total cost, wind abandonment cost, and carbon emissions due to HCHP’s “heat to set electricity” operation mode, resulting in a large amount of electricity being generated to meet the demand for thermal loads; as a result, new energy resources, such as wind power, cannot be consumed, leading to a high degree of power abandonment. In Case 2, based on HCHP, hydrogen and natural gas are mixed and burned, and by introducing the two-stage form of P2G, excess wind power resources are consumed to reduce the amount of wind abandonment; at the same time, the output hydrogen is used to supply HCHP as a raw material and methanization is performed to produce natural gas, which reduces the cost of acquiring natural gas from the external grid and effectively reduces CO2 emissions by 10.13% and the total cost by 16.26%. In Case 3, CSP is added on the basis of Case 2 and utilizes the heat from hydrogen production and methanation in P2G. CSP can collect thermal energy through the solar field to provide energy for thermal loads, which can help CHP to adjust the output thermal energy and improve the flexibility of the output electric power; at the same time, the use of heat recovery from P2G can further improve the supply of thermal loads, greatly reducing the cost of purchased energy by 22.88% and the total cost by 25.34%. In Case 4, hydrogen-doped mixed combustion with natural gas is used based on Case 3, as modeled in this study. Compared with Case 3, the amount of wind abandonment is further reduced, and its cost is reduced by 52.2%, CO2 emissions are reduced by 6.34%, and the total cost is reduced by 1.67%. The above data illustrate that the proposed scheme has optimal costs and low carbon emissions and also improves the system’s ability to consume wind power.

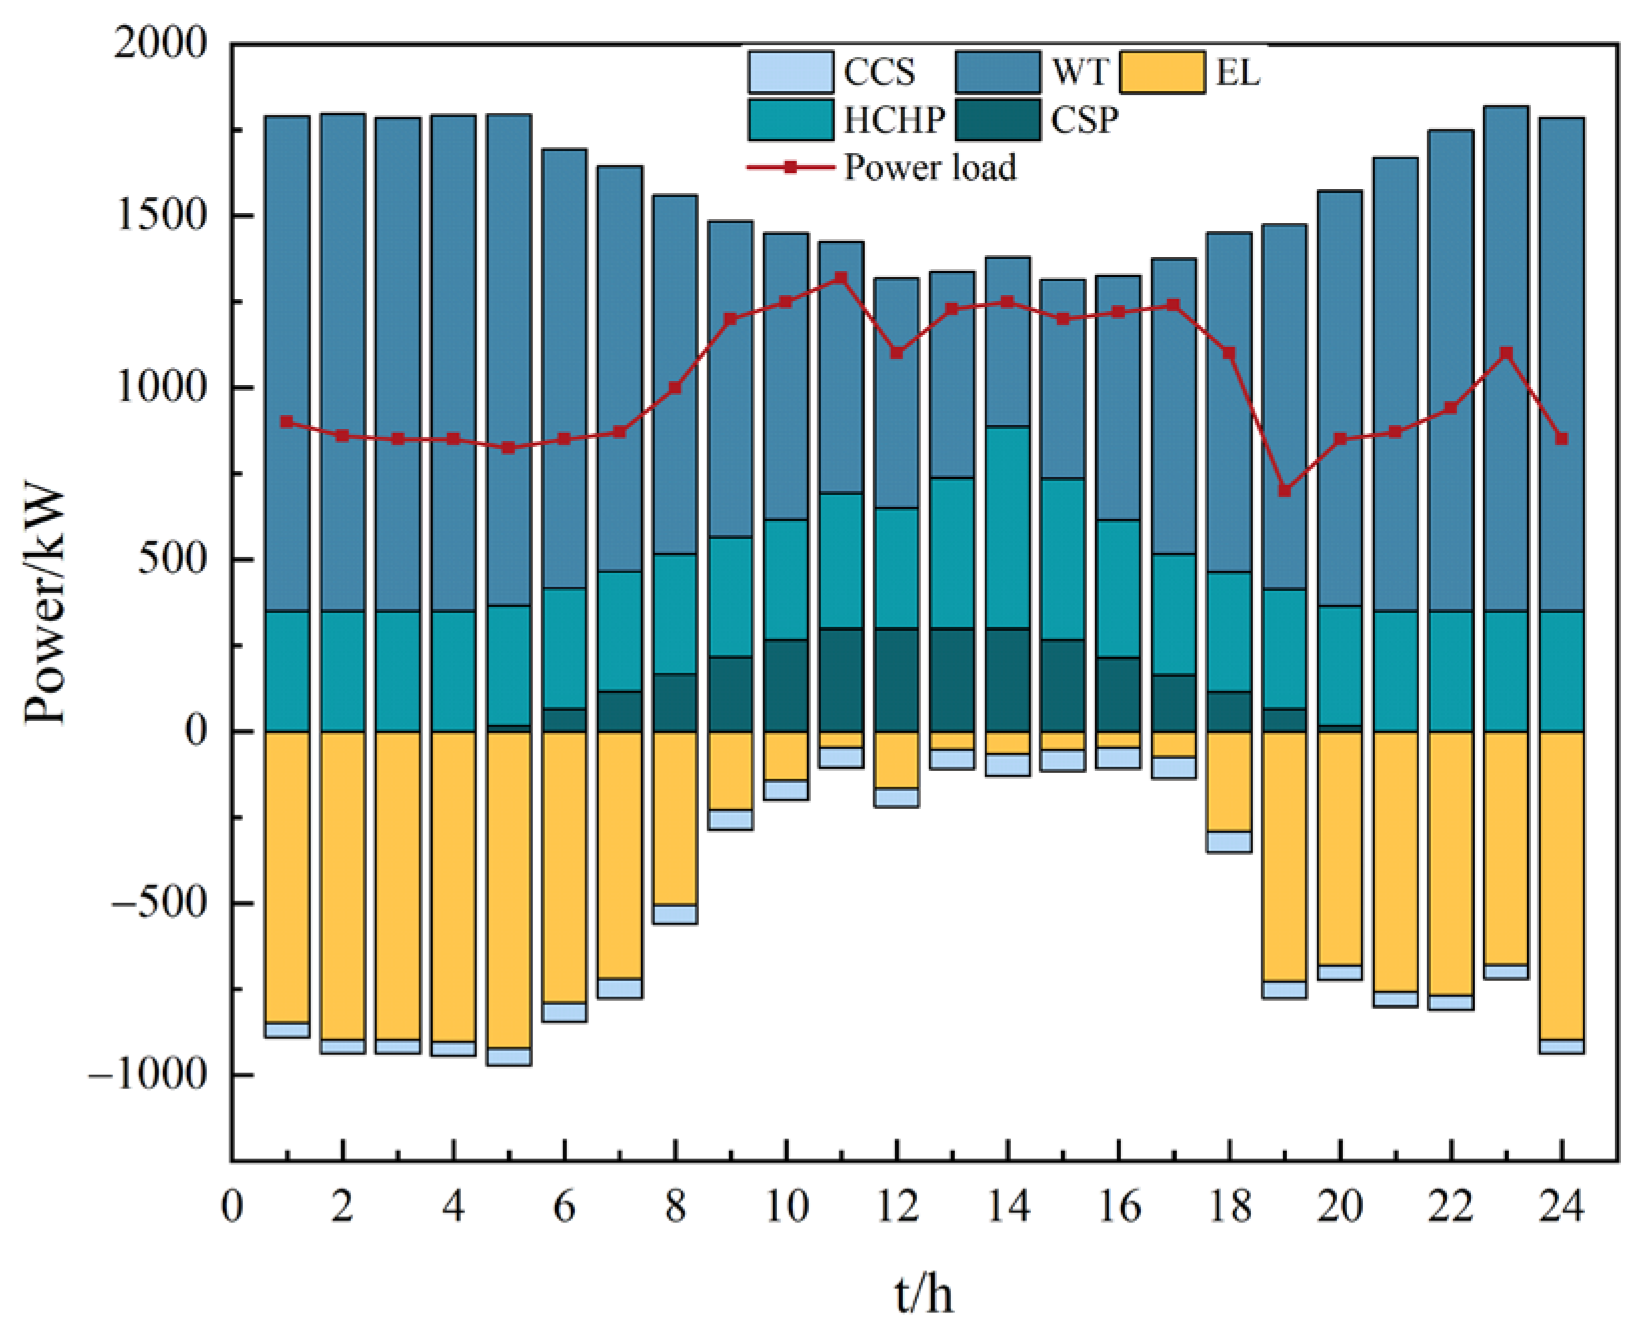
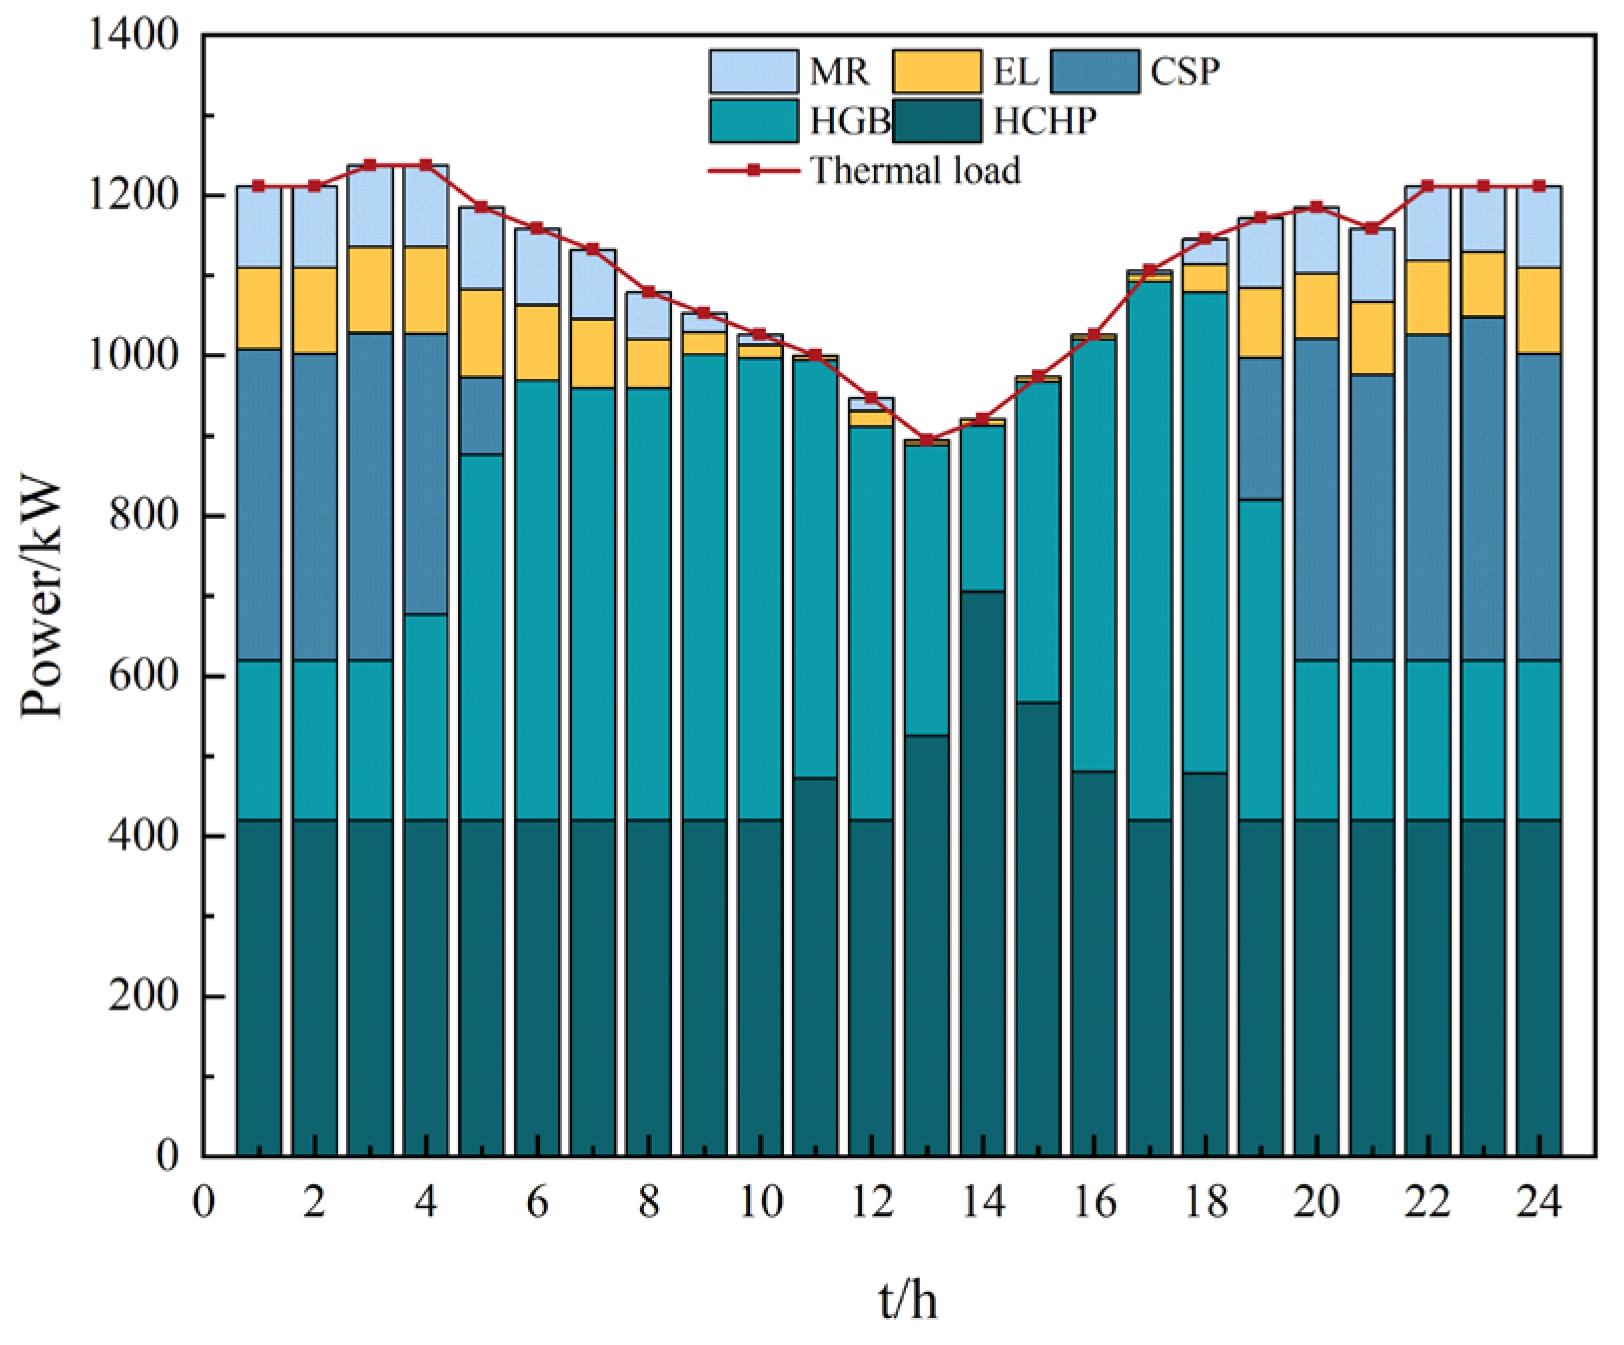
4.2. Unit Output Analysis

Figure 7 shows that in order to maximize the consumption of wind power resources, HCHP must maintain a state of minimum output magnitude. From 1:00 to 5:00, the WT output is the largest and the demand for electricity is small; during this time, P2G increases the power consumption to consume the excess electricity. From 6:00 to 11:00, due to the gradual decrease in WT output, the power supply capacity is weakened, which leads to an increase in the demand for electricity; during this time, CSP starts to collect solar energy to convert its thermal energy and generate electricity, and the output gradually increases to make up for the decrease in WT output. From 12:00 to 14:00, because the CSP power supply reaches its maximum output limit, it is unable to fulfill the power demand; during this time, HCHP starts to increase its generation capacity to make up this shortfall. From 15:00 to 17:00, the solar intensity and CSP power supply gradually decrease, the WT power increases, and the HCHP power supply also gradually decreases. From 18:00 to 24:00, because of the drop in load power demand, wind power resources are too large, and the EL increases the power consumption for wind power consumption. During the scheduling cycle, when power is abundant, it can be consumed through P2G to reduce energy loss; when power is scarce, CSP can generate power from the sun to meet the power supply demand.
Figure 8 shows that the thermal energy is mainly supplied by CSP, the HGB, and HCHP, and the heat from the EL and MR is used as an auxiliary source; the heat utilization analysis will not be repeated in the subsequent section because of the long-term operation of P2G. From 1:00 to 5:00, when the thermal load is at its peak, the CSP thermal storage system is exothermic, with the aim of avoiding a rise in the electrical power output from HCHP due to the provision of thermal loads, resulting in a reduction in the consumption of the wind resource. From 6:00 to 18:00, as the electric load rises, the thermal load troughs and the solar intensity becomes higher. The electric load can be satisfied by CSP heat–electricity conversion, and, during this time, the thermal load is reduced and mainly supplied by the HGB. From 19:00 to 24:00, the WT output increases, and in order to match and dissipate the excess wind resources, HCHP reduces the power supply output; meanwhile, due to the storage of heat during the daytime, the TES starts to carry out heating at night in order to match the HCHP output and regulate the output of electric power. In summary, the heating capacity of CSP reduces the problem of HCHP’s power supply output rising in order to increase its heating capacity, making excess wind energy unavailable for consumption; then, it utilizes the heat generated by the two-stage P2G process to assist in heating, greatly increasing HCHP’s heating capacity.
Figure 9 shows a graph of the variation in the hydrogen doping ratio of the gas unit in Case 4. The hydrogen doping ratio of both HCHP and HGB from 1:00 to 8:00 is the maximum ratio of the equipment, and, during this time, the carbon emissions of the gas unit reach the minimum. The hydrogen doping ratios from 8:00 to 18:00 are at the minimum levels allowed by the equipment; this is due to the small wind power output during this period: there is no surplus electrical energy to produce hydrogen while supplying the electrical load. There is a gradual increase in the wind power output after 18:00 and in the hydrogen doping ratio of HGB, and the hydrogen doping ratio of HCHP also starts to increase after 20:00, but since the hydrogen produced is not enough to provide HCHP and HGB for combustion, their hydrogen doping ratios are automatically matched with the corresponding ratios for combustion according to the actual situation.

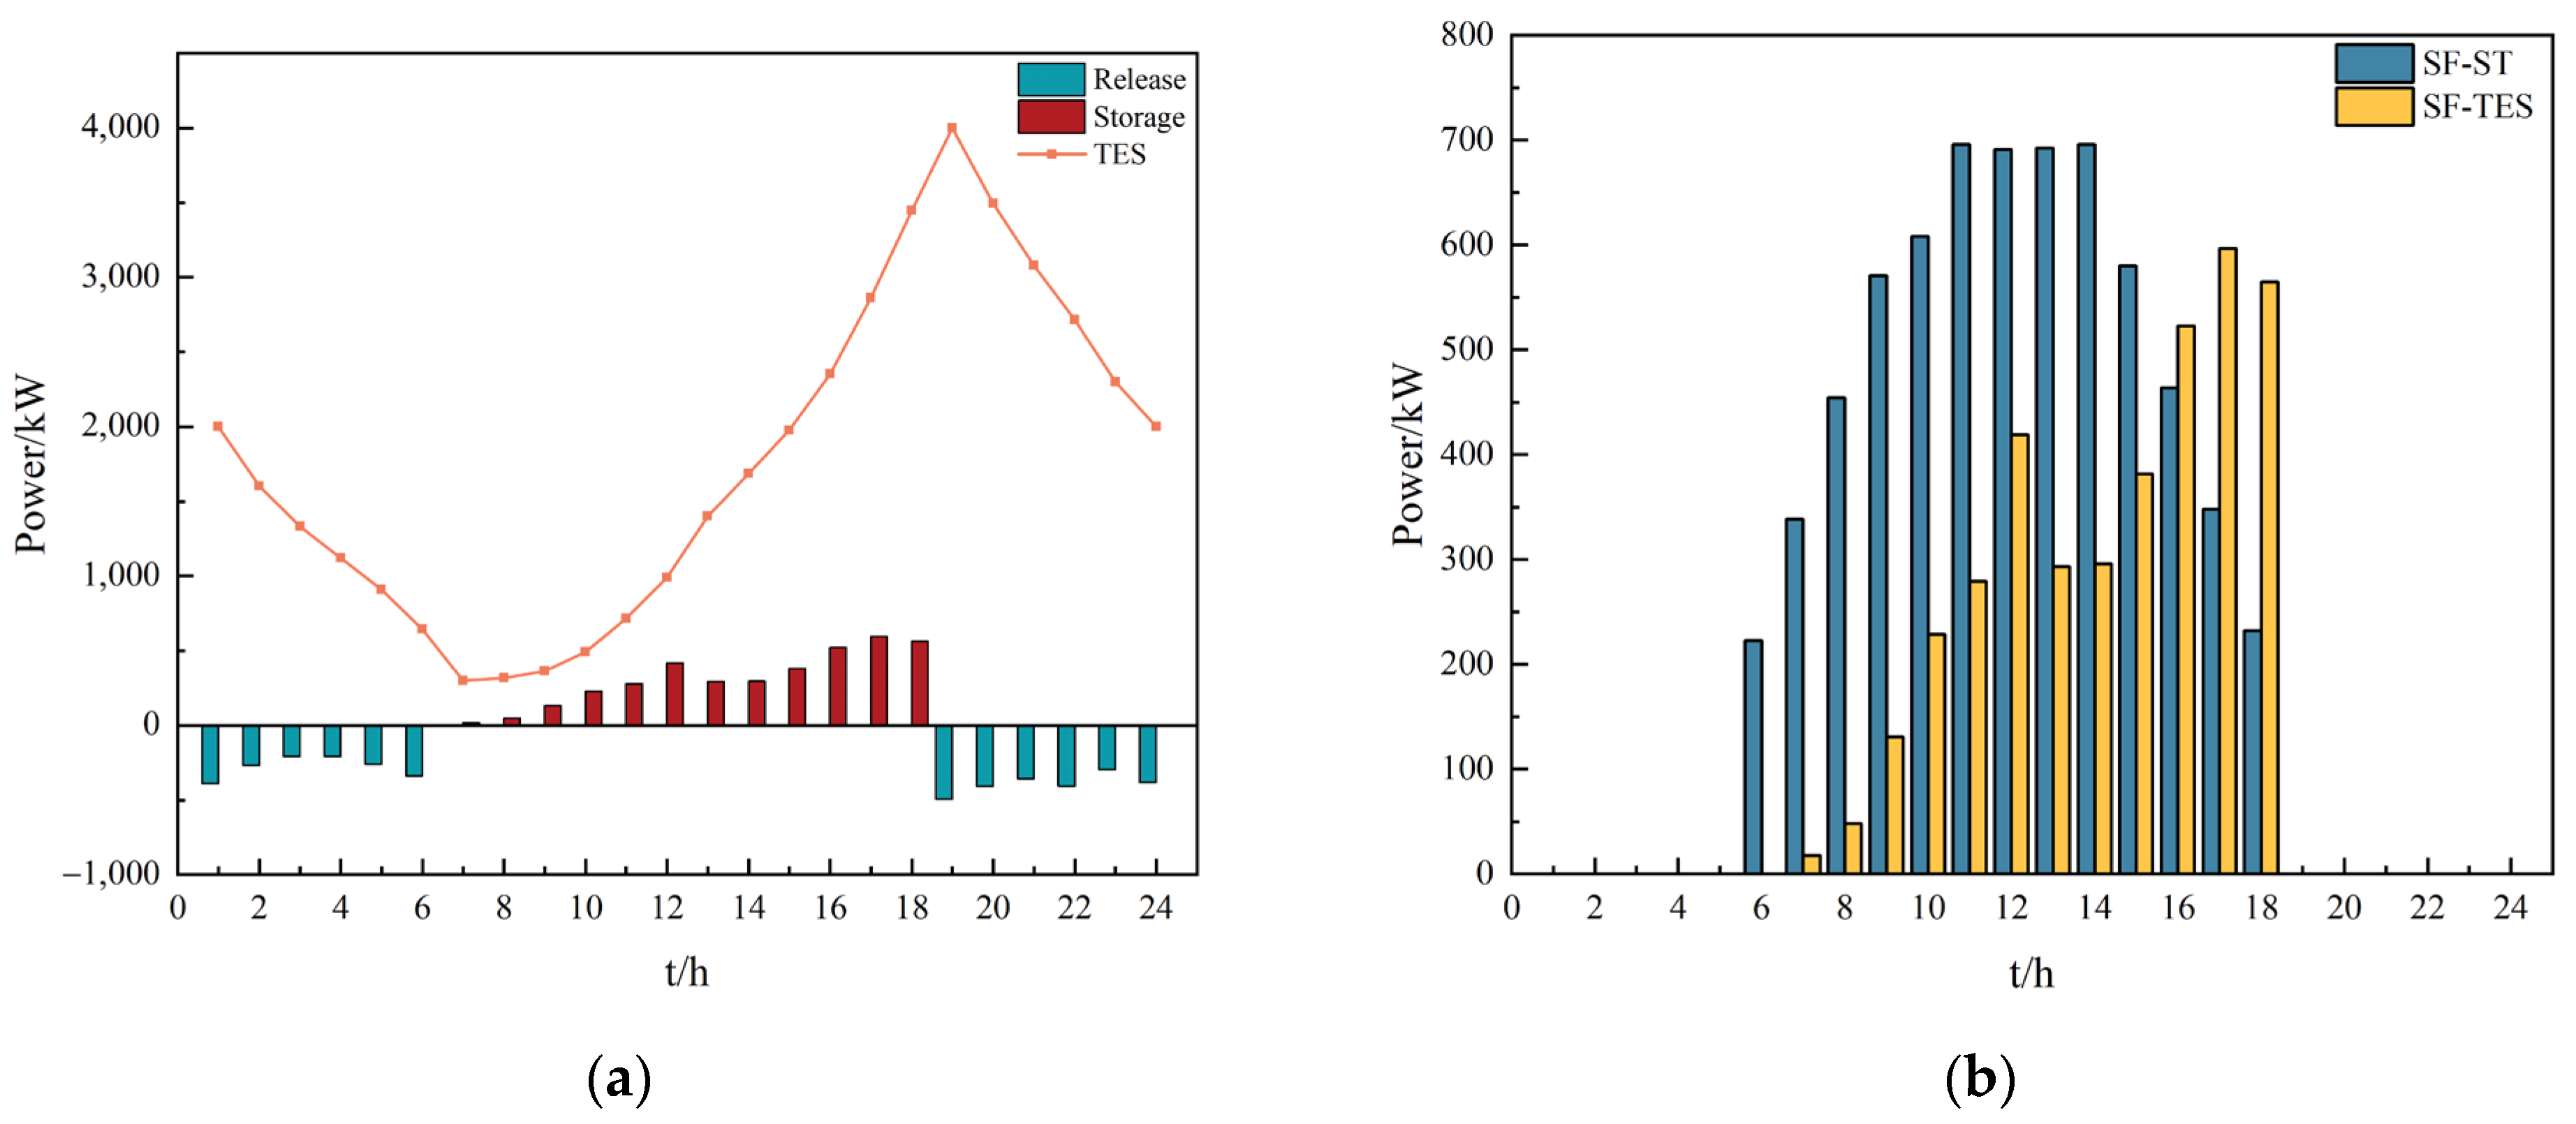
4.3. Analysis of CSP Operations

Figure 10 shows the operation of the CSP power plant, in which the thermal energy collected by CSP comes from solar illumination by the SF; most of the thermal energy is used in the TES for thermal storage, and the rest is used in CSP for power generation. From 1:00 to 5:00, due to the lack of solar resources, CSP utilizes the thermal energy already stored in the TES to provide demand for thermal loads and reduce the heating pressure of HCHP. From 6:00 to 18:00, there are sufficient solar resources, and the TES mainly utilizes the collected thermal energy for heat storage; meanwhile, the excess thermal energy is used for CSP power generation, which can effectively help the gas turbine to meet the demand for thermal load, resulting in the output of the electric power being unable to meet the demand for electric load. From 19:00 to 24:00, CSP directly utilizes the thermal energy in the TES to provide the thermal load. CSP can use the thermal energy in the TES to provide a sufficient heat source in the absence of solar energy and also ensures that CSP can maintain a continuous power supply in the case of reduced solar resources, providing the power supply system with continuity. At the same time, as a piece of new energy power generation equipment, CSP does not produce CO2 when generating electricity and heat and can reduce the output power of HCHP and HGB, which effectively reduces the cost of purchased natural gas, as well as CO2 emissions, and can achieve lower carbon emissions.

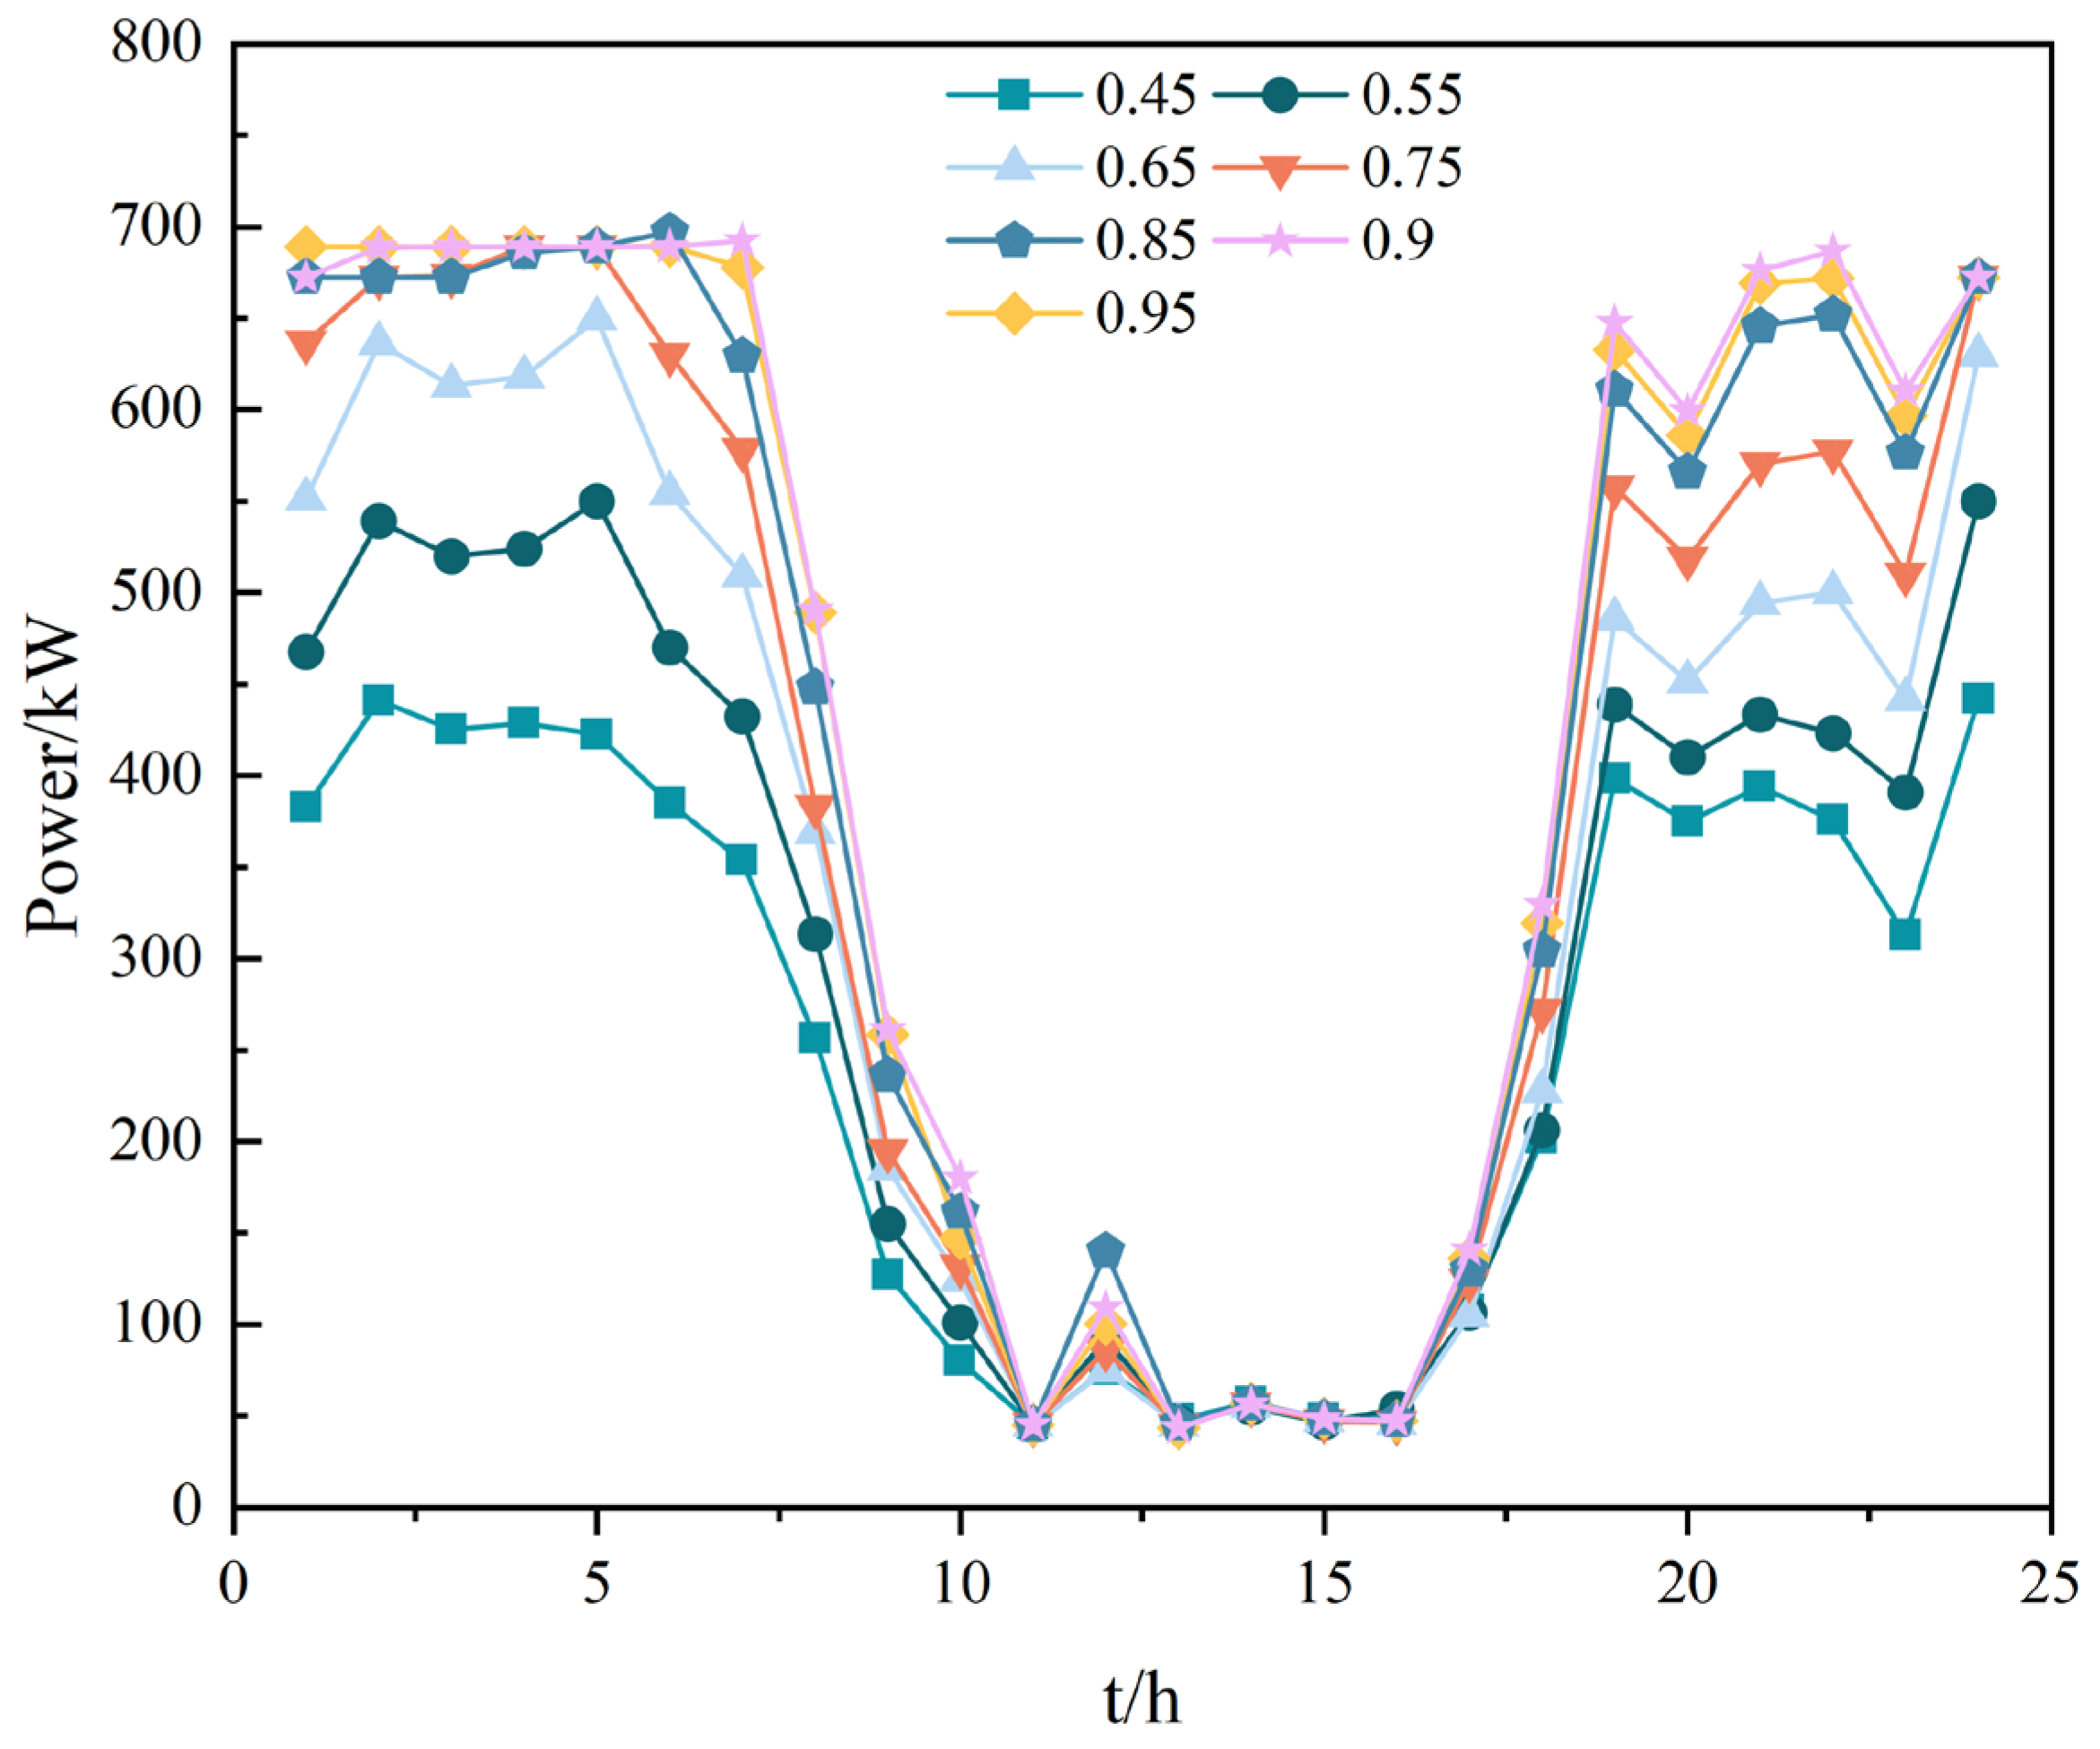
4.4. Analysis of the Impact of TES Thermal Storage Capacity on the Operational Efficiency of the System

A change in thermal storage capacity affects the economic and carbon emission reduction benefits of the system to a certain extent. Taking Case 4 as an example, this effect is analyzed, as shown in Figure 11.
An analysis of the effects of changes in thermal storage capacity on the system’s economic and carbon reduction goals was conducted using Case 4 as an example; the results are shown in Figure 11. With an increase in thermal storage capacity, the operating costs and carbon emissions gradually decrease, and when the capacity increases to a certain extent, the improvement effect of a further increase in capacity tends to be diminished. If the thermal storage capacity is further expanded, not only will it not improve efficiency, but it will also waste the excess capacity and increase the investment cost. Therefore, the appropriate capacity should be selected when combining multiple energy sources.

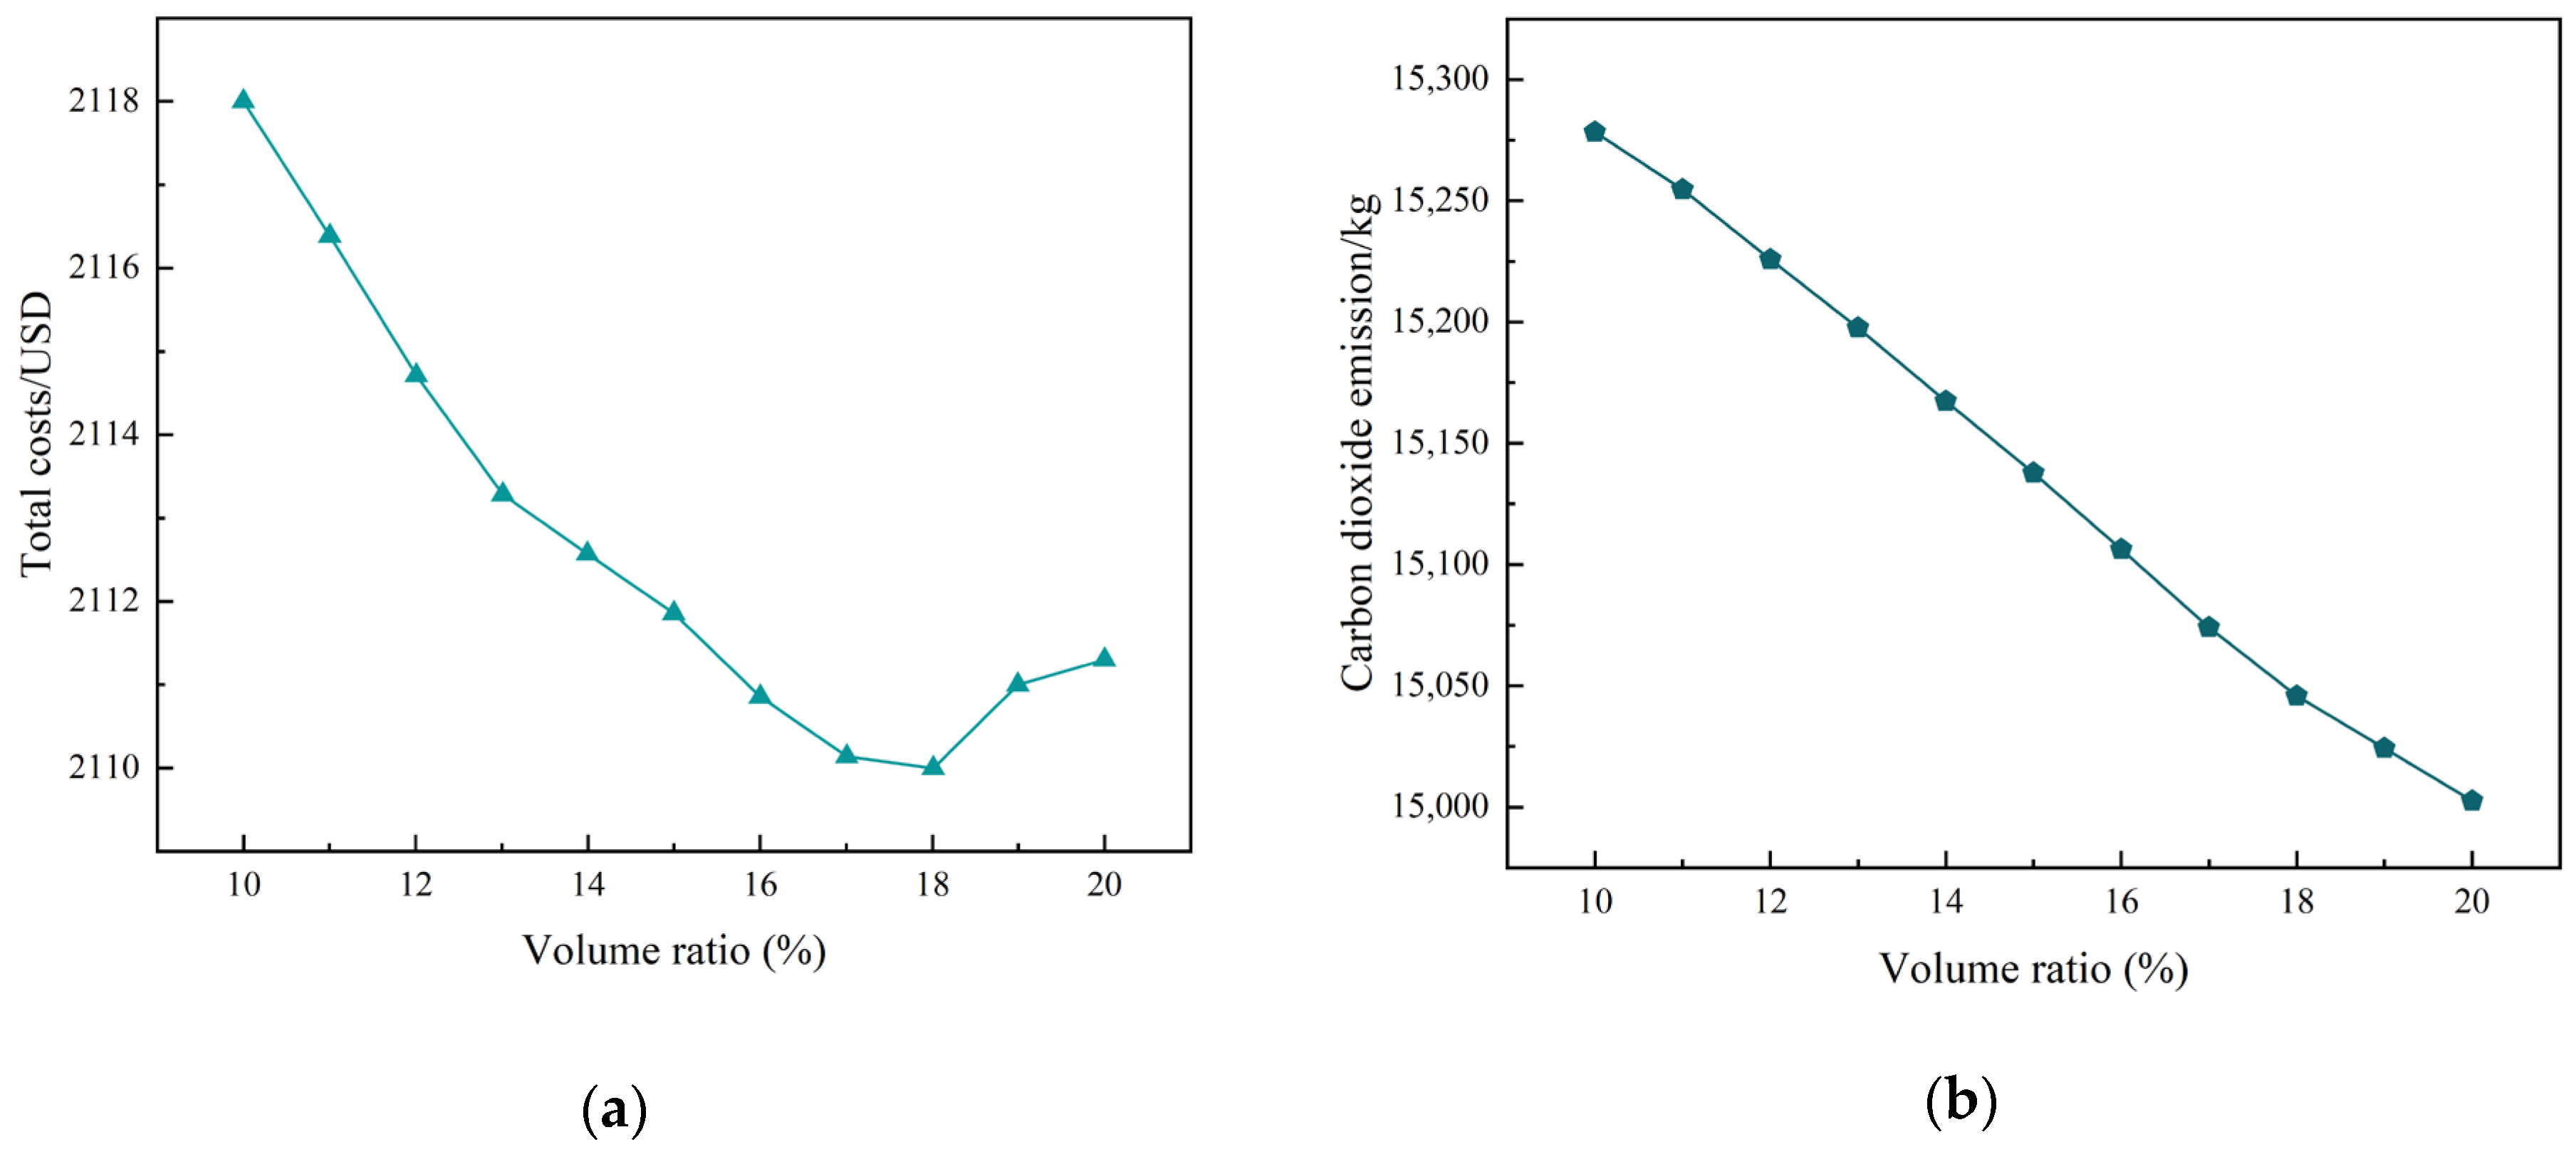
4.5. Analysis of CO2 Emissions

As shown in Figure 12, the carbon emission sources are mainly HCHP and HGB, and the carbon emissions are gradually reduced in each of the four cases, so the validity of the proposed model is verified in terms of low-carbon emission reduction. All cases are joined by CCS. Case 1 simply utilizes conventional HCHP units for power and heat supply, and for HCHP and the HGB, in order to meet the electrical and thermal load demand, gas must be purchased from the external grid, and a large amount of CO2 is generated. Case 2 improves the raw material for HCHP combustion by utilizing P2G to generate hydrogen; this is incorporated into natural gas to form a gas mixture, as hydrogen is a clean energy source and does not produce CO2 during the combustion process, thus significantly reducing carbon emissions compared to Case 1. The CSP power station is introduced in Case 3, and carbon emissions are greatly reduced because CSP utilizes the sun’s resources as an energy output and has a good ability to supply electricity and heat. CSP stores heat and generates electricity during the daytime to reduce the electrical power output of HCHP and utilizes the CSP heat storage system to supply heat at night to reduce the thermal energy output of HCHP. This effectively reduces the cost of purchasing gas from the external grid and CO2 emissions. Case 4 adds hydrogen-doped combustion to Case 3, and carbon emissions are further reduced, as seen in Figure 12, reflecting the effectiveness of its carbon reduction.

4.6. Impact Analysis of EL Hydrogen Production Efficiency

The hydrogen production efficiency of the EL has a critical impact on the system, and the hydrogen doping content of the gas unit is closely related to the amount of methanation and hydrogen doping. Taking Case 4 as an example, the structure of changes in electrolysis efficiency was analyzed, as shown in Figure 13.
Figure 13 shows that with an increase in hydrogen production efficiency, the hydrogen production yield gradually increases until the efficiency reaches 0.85, when the yield change starts to decrease. When the efficiency reaches 0.95, hydrogen production decreases instead of increasing and is lower than when the efficiency is at 0.9. Therefore, in order to maximize the economic benefits of the system, the selected range of EL efficiency should be 0.85 to 0.9.

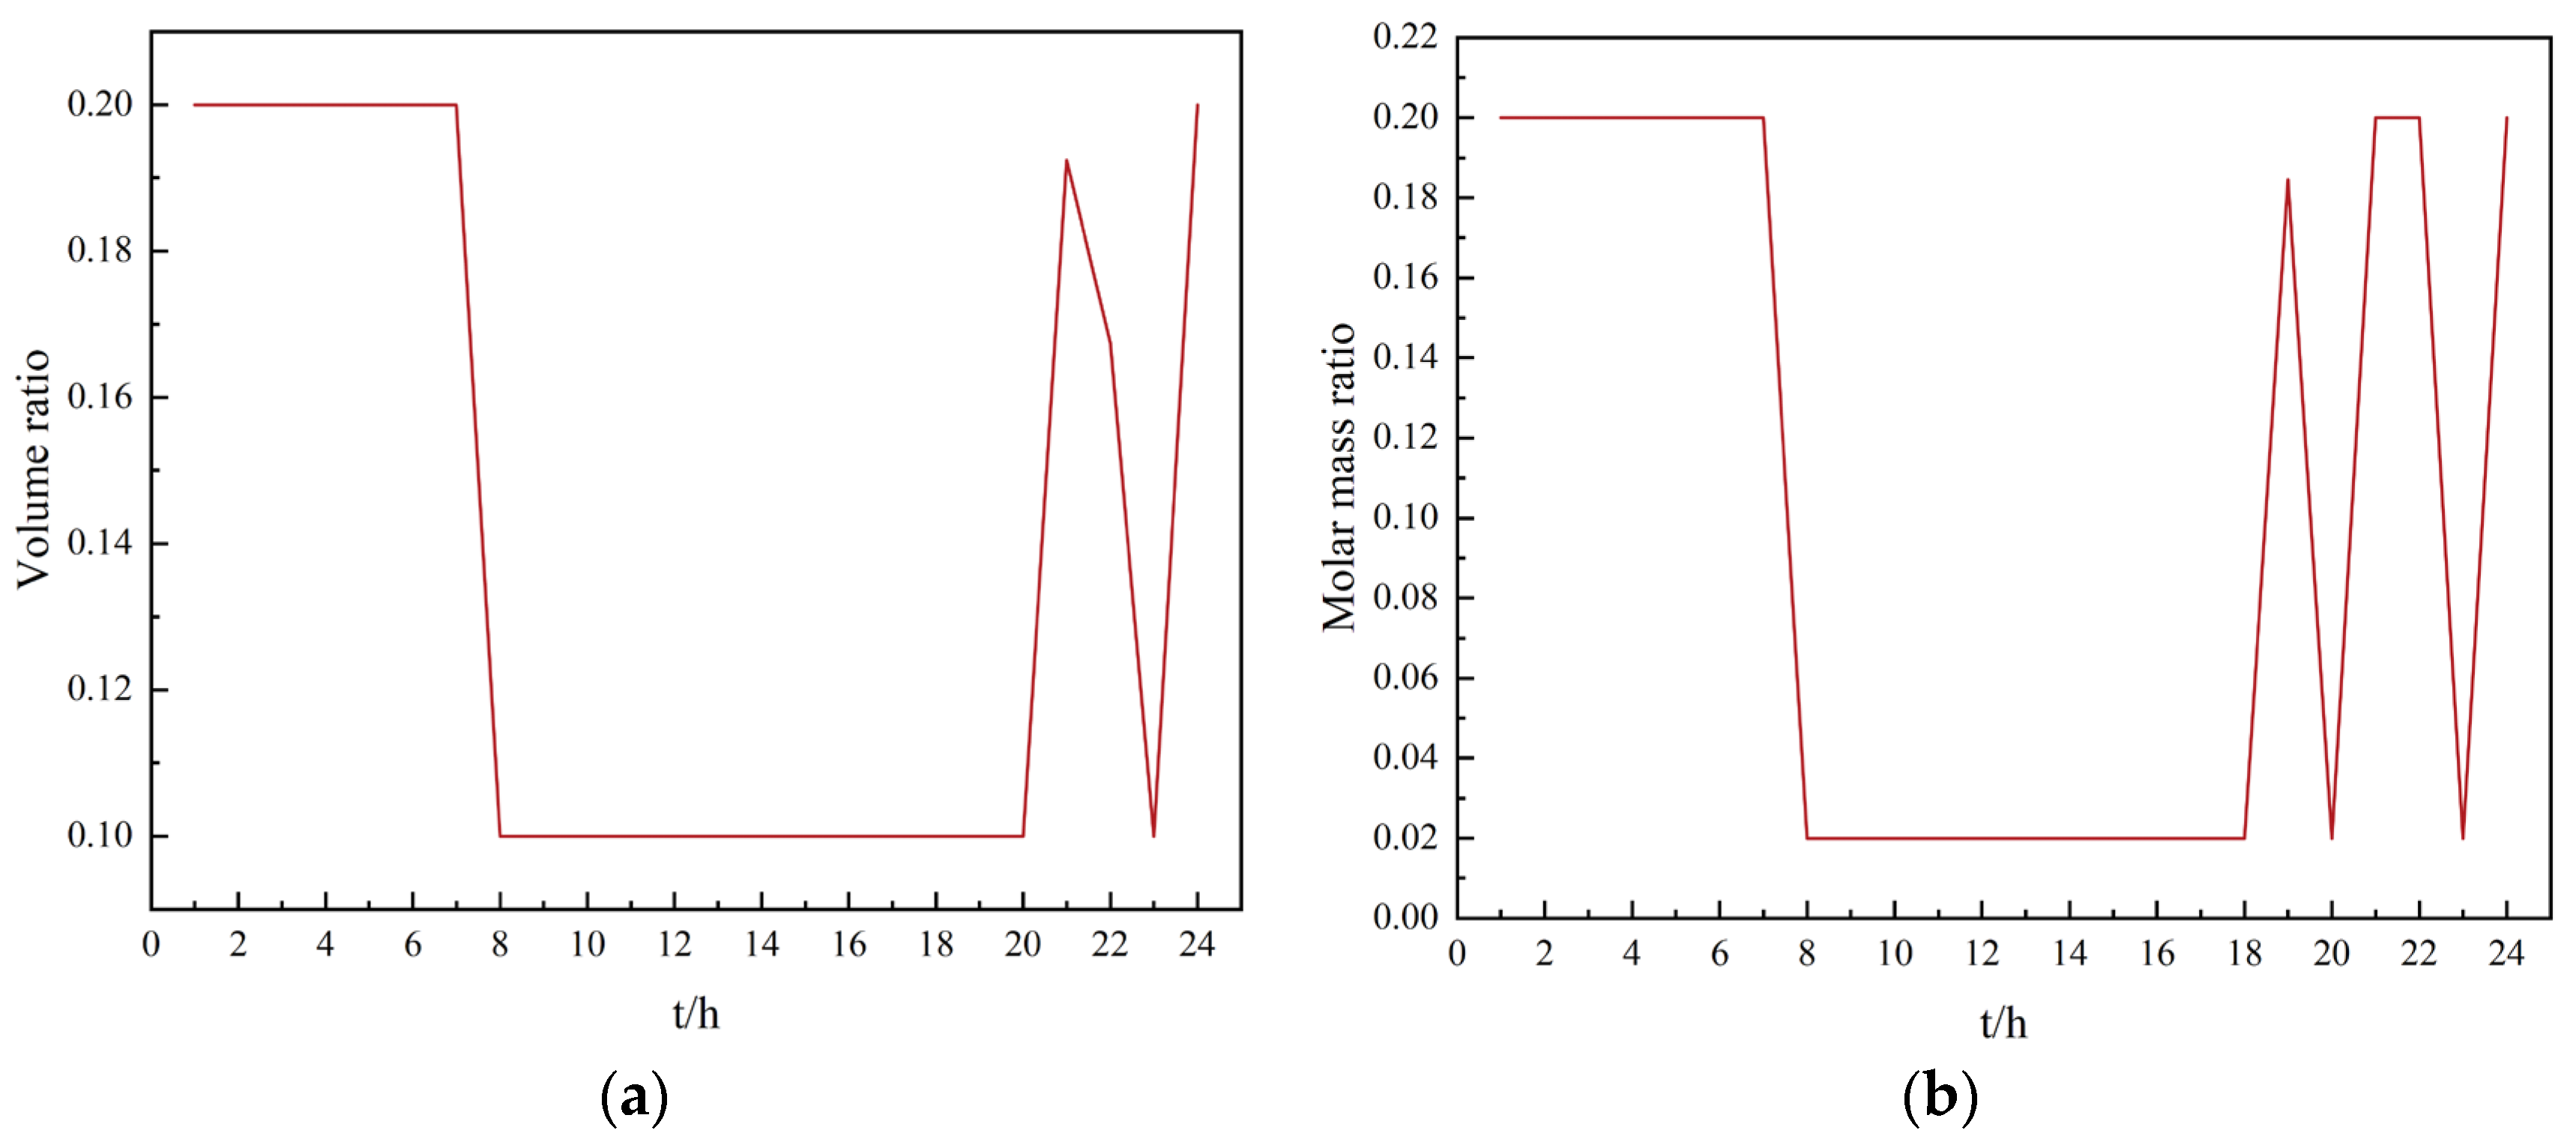
4.7. System Hydrogen Doping Analysis

In order to verify the economic and low-carbon performance of hydrogen doping in HCHP and the HGB for the system, Cases 3 and 4 were selected for analysis. According to the data in Table 4, the total cost and carbon emissions of Case 4 are lower than those of Case 3, indicating that adding hydrogen to the system for the combustion process can help the IES to reduce carbon emissions, increase carbon quotas and trading revenues, and reduce costs.
To further explore the benefits of the hydrogen doping ratio on the total cost of the system and carbon emissions, the hydrogen doping ratio of HCHP was gradually changed, with a fixed HGB doping ratio of 3%. As shown by the total cost curve in Figure 14, overall, there is a gradually decreasing trend with the hydrogen doping ratio of HCHP, but as the ratio gradually increases, the decreasing trend slows sown, leveling off between ratios of 17% and 18%; even the ratio increases instead of decreasing when the ratio reaches 19% of the total cost. This is because hydrogen doping relies on excess wind resources for hydrogen production, and when the wind is unable to provide enough power to provide an EL unit for hydrogen production, the gas-fired unit does not have enough hydrogen to participate in the combustion process. Therefore, when the hydrogen doping ratio is fixed and the remaining wind resources cannot produce enough hydrogen, the gas turbine will increase its power generation capacity and the cost of purchased energy, resulting in an increase in the total cost and a decrease in its economic value; Figure 10 shows that with an increase in the hydrogen doping ratio of HCHP, the total carbon emissions of the system exhibit a decreasing trend. To summarize, in order to avoid high system costs due to increased power generation and reduce the carbon generation of hydrogen doping in gas turbines, it is important to set an appropriate hydrogen doping ratio according to the actual situation.

5. Conclusions

In order to improve the low-carbon economic benefits of IESs, this study proposes a low-carbon economic model of an IES that takes into account CSP and hydrogen-doped combustion. Upon analyzing the model using different cases, we draw the following conclusions:
(1)
Based on the carbon trading mechanism, the introduction of CSP and hydrogen mixing into natural gas combustion reduces the carbon emission level of the system, while the carbon allowance of the system is increased, which improves the carbon trading benefits of the system. Compared with the other cases, the total system cost can be significantly reduced while improving the CO2 reduction problem.
(2)
P2G is refined into a two-stage model, and HCHP and an HGB are introduced to achieve hydrogen-doped combustion. Four simulation comparisons are set up, and even though the CSP-P2G-HCHP coupling model does not exhibit the highest wind power utilization, it has the lowest the total system cost and CO2 emissions. Therefore, CSP-P2G-HCHP coupling can further reduce the overall carbon emission level of the system and the overall total cost of the IES.
(3)
Comparing the fixed hydrogen doping ratio with the variable hydrogen doping ratio, the former does not yield many benefits and even produces results contrary to expectations when the ratio reaches a certain level. Therefore, a variable hydrogen doping ratio is used to maximize the cost and emission reduction capability of the system.
(4)
This study proposes a low-carbon and low-cost dispatch model of an integrated energy system comprising concentrating solar power and hydrogen-doped combustion. Secondly, the introduction of P2G improves the economic value and environmental impact of the system and achieves the mutual transformation of multiple energy cycles. In order to better improve the operational efficiency of the system, future research will focus on the uncertainty of wind power prediction and dynamic carbon trading.

Author Contributions

J.C.: Conceptualization, Methodology, Software, Investigation, Formal Analysis, Writing—Original Draft; J.X.: Data Curation, Writing—Original Draft, Software; B.Z.: Visualization, Investigation; Z.Z.: Resources, Supervision; Z.M.: Software, Validation; J.H.: Conceptualization, Funding Acquisition, Resources, Supervision, Writing—Review and Editing. All authors have read and agreed to the published version of the manuscript.

Funding

This research received no external funding.

Institutional Review Board Statement

Not applicable.

Informed Consent Statement

Not applicable.

Data Availability Statement

The data presented in this study will be made available on request.

Conflicts of Interest

The authors declare no conflict of interest.

Nomenclature

IESIntegrated energy system
P2GPower to gas
SFSolar field
CSPConcentrating solar power
TESThermal energy storage
CCSCarbon capture and storage
CVRConditional value at risk
ELElectrolyzer
MRMethanization reaction
CHPCombined heat and power
GBGas boiler
HCHPHydrogen-doped combined heat and power
HGBHydrogen-doped gas boiler
WTWind turbine
SPDSolar parabolic dish
PTCParabolic trough collector
SPTSolar power tower
LFRLinear Fresnel reflector
AEAlkaline electrolysis
PEMProton exchange membrane
HTSOHigh-temperature solid oxide electrolysis
ρ H 2 The density of hydrogen, kg/m3
M H 2 The molar mass of hydrogen, kg/mol
η EL The efficiency of the EL
L H 2 The calorific value of hydrogen, kJ/kg
Q Sloar , t The converted thermal energy absorbed by SF at time t, kW
Q Csp , e , t The thermal energy transferred directly by SF to the turbine for power generation at time t, kW
Q SF-TES , t The thermal energy stored in the TES from the heat absorbed by SF at time t, kW
P e , t Csp The electric power emitted by the CSP at moment t, kW
Q TES-ST , t The thermal energy transferred to the turbine by the TES at moment t, kW
V TES , t The heat in the TES at moment t, kW
n loss The heat loss coefficient in the TES
n + The efficiency coefficient of heat storage
n The efficiency coefficient of heat release
Q cha , t The heat charged to the TES at moment t, kW
Q dis , t The heat released by the TES at moment t, kW
Q TES-load , t The thermal energy transferred to the load from the TES at moment t, kW
Q P 2 G , t The heat released into the TES during the operation of the P2G equipment, kW
P t HCHP The electrical power of HCHP at time t, kW
Q CH 4 , t HCHP The natural gas power consumed by HCHP at time t, kW
Q H 2 , t HCHP The hydrogen power consumed by HCHP at time t, kW
k HCHP P The electrical efficiency of HCHP
Q t HCHP The thermal energy of HCHP at time t, kW
k HCHP H The thermal efficiency of HCHP
λ t The ratio of thermoelectricity
R H 2 The calorific value of hydrogen, kJ/m3
R CH 4 The calorific value of natural gas, kJ/m3
V H 2 , t The quality of hydrogen produced at time t, kg
P EL , t The electric power consumed by the EL at moment t
V H 2 , t in The hydrogen input at time t, kg

Appendix A

Equation (4) contains nonlinear terms with adjustable HCHP thermoelectric ratios, and Equations (4) and (5) contain nonlinear terms with adjustable hydrogen doping ratios, both of which are similar in that they are continuous variables with known upper and lower ranges multiplied by unknown ranges, and thus both of them have the same method of linearization, with an example of one of the nonlinear terms in Equation (4) being λ t = k HCHP , t H / k HCHP , t P , which is the known λ min λ t λ max . The first simple change in its form is as follows:
k HCHP , t H = λ t k HCHP P
The formula can be transformed into a linear inequality using the known λ min λ t λ max :
λ min k HCHP , t P k HCHP , t H λ max k HCHP , t P

References

  1. Huang, W.; Zhang, B.; Ge, L.; He, J.; Liao, W.; Ma, P. Day-ahead optimal scheduling strategy for electrolytic water to hydrogen production in zero-carbon parks type microgrid for optimal utilization of electrolyzer. J. Energy Storage 2023, 68, 107653. [Google Scholar] [CrossRef]
  2. Ge, L.; Zhang, B.; Huang, W.; Li, Y.; Hou, L.; Xiao, J.; Mao, Z.; Li, X. A review of hydrogen generation, storage, and applications in power system. J. Energy Storage 2024, 75, 109307. [Google Scholar] [CrossRef]
  3. Du, E.; Zhang, N.; Kang, C.; Miao, M. Reviews and prospects of the operation and planning optimization for grid integrated concentrating solar power. Proc. CSEE 2016, 36, 5765–5775. [Google Scholar]
  4. Wang, Z.; Zhang, X.; Zhang, X.; Huang, S. Low-carbon Optimal Dispatch of Integrated Energy System Considering Concentrating Solar Plant. In Proceedings of the 2022 IEEE/IAS Industrial and Commercial Power System Asia (I&CPS Asia), Shanghai, China, 8–11 July 2022; pp. 1239–1244. [Google Scholar]
  5. Cui, Y.; Jia, R.; Wu, Z. Optimal scheduling of concentrating solar power plant with thermal energy storage and wind farm considering electric-thermal conversion. Proc. CSEE 2020, 40, 6482–6494. [Google Scholar]
  6. Zhang, D.; Yun, Y.; Wang, X.; He, J.; Dong, H. Economic dispatch of integrated electricity-heat-gas energy system considering generalized energy storage and concentrating solar power plant. Autom. Electr. Power 2021, 45, 33–42. [Google Scholar]
  7. Chen, R.; Sun, H.; Guo, Q.; Li, Z.; Deng, T.; Wu, W.; Zhang, B. Reducing generation uncertainty by integrating CSP with wind power: An adaptive robust optimization-based analysis. IEEE Trans. Sustain. Energy 2015, 6, 583–594. [Google Scholar] [CrossRef]
  8. Li, X.; Gui, D.; Zhao, Z.; Li, X.; Wu, X.; Hua, Y.; Guo, P.; Zhong, H. Operation optimization of electrical-heating integrated energy system based on concentrating solar power plant hybridized with combined heat and power plant. J. Clean. Prod. 2021, 289, 125712. [Google Scholar] [CrossRef]
  9. He, L.; Lu, Z.; Zhang, J.; Geng, L.; Zhao, H.; Li, X. Low-carbon economic dispatch for electricity and natural gas systems considering carbon capture systems and power-to-gas. Appl. Energy 2018, 224, 357–370. [Google Scholar] [CrossRef]
  10. Zhang, X.; Zhang, Y. Environment-friendly and economical scheduling optimization for integrated energy system considering power-to-gas technology and carbon capture power plant. J. Clean. Prod. 2020, 276, 123348. [Google Scholar] [CrossRef]
  11. Liu, J.; Sun, W.; Yan, J. Effect of P2G on flexibility in integrated power-natural gas-heating energy systems with gas storage. Energies 2021, 14, 196. [Google Scholar] [CrossRef]
  12. Zhang, X.; Zhang, Y.; Ji, X.; Ye, P.; Li, J. Unit commitment of integrated energy system considering conditional value-at-risk and P2G. Electr. Power Syst. Res. 2023, 221, 109398. [Google Scholar] [CrossRef]
  13. Liang, Y.; Zhang, H.; Yang, C.; Li, K. Research on optimization scheduling of integrated electricity-gas system considering carbon trading and P2G operation characteristics. Electr. Power Syst. Res. 2023, 225, 109797. [Google Scholar] [CrossRef]
  14. Li, X.; Li, T.; Liu, L.; Wang, Z.; Li, X.; Huang, J.; Huang, J.; Guo, P.; Xiong, W. Operation optimization for integrated energy system based on hybrid CSP-CHP considering power-to-gas technology and carbon capture system. J. Clean. Prod. 2023, 391, 136119. [Google Scholar] [CrossRef]
  15. Meziane, S.; Bentebbiche, A. Numerical study of blended fuel natural gas-hydrogen combustion in rich/quench/lean combustor of a micro gas turbine. Int. J. Hydrogen Energy 2019, 44, 15610–15621. [Google Scholar] [CrossRef]
  16. Rajpara, P.; Shah, R.; Banerjee, J. Effect of hydrogen addition on combustion and emission characteristics of methane fuelled upward swirl can combustor. Int. J. Hydrogen Energy 2018, 43, 17505–17519. [Google Scholar] [CrossRef]
  17. Yun, Y.; Zhang, D.; Yang, S.; Li, Y.; Yan, J. Low-carbon optimal dispatch of integrated energy system considering the operation of oxy-fuel combustion coupled with power-to-gas and hydrogen-doped gas equipment. Energy 2023, 283, 129127. [Google Scholar] [CrossRef]
  18. Guo, C.; Abuduwayiti, X.; Shang, Y.; Huang, L.; Cui, C. Optimized Scheduling of Integrated Energy Systems Accounting for Hydrogen Energy Multi-Utilization Models. Sustainability 2024, 16, 1198. [Google Scholar] [CrossRef]
  19. Zhu, X.; Xue, J.; Hu, M.; Liu, Z.; Gao, X.; Huang, W. Low-carbon economy dispatching of integrated energy system with P2G-HGT coupling wind power absorption based on stepped Carbon emission trading. Energy Rep. 2023, 10, 1753–1764. [Google Scholar] [CrossRef]
  20. Roy, P.K.; Paul, C.; Sultana, S. Oppositional teaching learning based optimization approach for combined heat and power dispatch. Int. J. Electr. Power Energy Syst. 2014, 57, 392–403. [Google Scholar] [CrossRef]
  21. Islam, M.T.; Huda, N.; Abdullah, A.B.; Saidur, R. A comprehensive review of state-of-the-art concentrating solar power (CSP) technologies: Current status and research trends. Renew. Sustain. Energy Rev. 2018, 91, 987–1018. [Google Scholar] [CrossRef]
  22. Yang, H.; Zhou, M.; Wu, Z.; Zhang, M.; Liu, S.; Guo, Z.; Du, E. Exploiting the operational flexibility of a concentrated solar power plant with hydrogen production. Sol. Energy 2022, 247, 158–170. [Google Scholar] [CrossRef]
  23. Jiang, P.; Dong, J.; Huang, H. Optimal integrated demand response scheduling in regional integrated energy system with concentrating solar power. Appl. Therm. Eng. 2020, 166, 114754. [Google Scholar] [CrossRef]
  24. Cui, Y.; Liu, X.; Chen, M. Experimental study of natural gas doping full pressure of F-class heavy-duty gas turbine burner. Gas Turbine Technol. 2021, 34, 38–42. [Google Scholar]
  25. Luo, Z.; Wang, J.; Xiao, N.; Yang, L.; Zhao, W.; Geng, J.; Lu, T.; Luo, M.; Dong, C. Low Carbon Economic Dispatch Optimization of Regional Integrated Energy Systems Considering Heating Network and P2G. Energies 2022, 15, 5494. [Google Scholar] [CrossRef]
  26. Liu, J.; Sun, W.; Harrison, G. Optimal low-carbon economic environmental dispatch of hybrid electricity-natural gas energy systems considering P2G. Energies 2019, 12, 1355. [Google Scholar] [CrossRef]
  27. Yan, Q.; Ai, X.; Li, J. Low-carbon economic dispatch based on a CCPP-P2G virtual power plant considering carbon trading and green certificates. Sustainability 2021, 13, 12423. [Google Scholar] [CrossRef]
  28. Lau, J.; Dey, G.; Licht, S. Thermodynamic assessment of CO2 to carbon nanofiber transformation for carbon sequestration in a combined cycle gas or a coal power plant. Energy Convers. Manag. 2016, 122, 400–410. [Google Scholar] [CrossRef]
  29. Zheng, L.; Wen, Z.; Qiu, Z. Low-carbon optimized operation of an integrated energy system that takes into account solar thermal power plants and hydrogen storage. Electr. Meas. Instrum. 2022, 1–9. [Google Scholar]
  30. Yun, Y.; Zhang, D.; Wang, X.; Ni, P.; He, J. Low-Carbon Operational Optimization of Integrated Electricity-Heat-Gas Energy System Considering Concentrating Solar Power Plant and Oxygen-Enriched Combustion Capture Technology. Trans. China Electrotech. Soc. 2023, 24, 6709–6726. [Google Scholar]
  31. Chen, D.; Liu, F.; Liu, S. Optimization of virtual power plant scheduling coupling with P2G-CCS and doped with gas hydrogen based on stepped carbon trading. Power Syst. Technol. 2022, 46, 2042–2054. [Google Scholar]
Figure 1. The structure of the electric–thermal IES.
Sustainability 16 04818 g001
Figure 2. CHP electrothermal characteristics.
Sustainability 16 04818 g002
Figure 3. Electrical and thermal characteristics of joint operation of CSP and CHP.
Sustainability 16 04818 g003
Figure 4. CSP’s operational structure.
Sustainability 16 04818 g004
Figure 5. Model solution process.
Sustainability 16 04818 g005
Figure 6. Forecasting of electric and thermal loads, solar field thermal energy, and wind power.
Sustainability 16 04818 g006
Figure 7. Optimized electrical power balance.
Sustainability 16 04818 g007
Figure 8. Optimized thermal energy balance.
Sustainability 16 04818 g008
Figure 9. Hydrogen blending ratios for gas units. (a) HCHP hydrogen doping ratio. (b) HGB hydrogen doping ratio.
Sustainability 16 04818 g009
Figure 10. Analysis of CSP operation. (a) TES thermal storage in exothermic state. (b) SF heat transfer situation.
Sustainability 16 04818 g010
Figure 11. Change in thermal storage capacity.
Sustainability 16 04818 g011
Figure 12. Carbon emissions in different cases.
Sustainability 16 04818 g012
Figure 13. Effect of EL hydrogen production efficiency on hydrogen yield.
Sustainability 16 04818 g013
Figure 14. Benefit analysis of hydrogen-doped combustion. (a) Total cost for different hydrogen doping cases. (b) Carbon emissions in different hydrogen doping cases.
Sustainability 16 04818 g014
Table 1. Equipment parameters.
Equipment TypeParameterValueEquipment TypeParameterValue
CSP P max CSP (kW)600CCS β (kWh/kg)0.893
P min CSP (kW)0 τ 0.9
P up CSP (kW)50P2G P EL max (kW)1000
P down CSP (kW)50 P EL min (kW)10
n r-d 0.431 η EL (%)88
HCHP P max HCHP (kW)900HGB Q max HGB (kW)600
P min HCHP (kW)200 Q min HGB (kW)200
Q max HCHP (kW)1020 k GB 0.88
Q min HCHP (kW)260//
λ 1.2–1.5//
Table 2. Equipment maintenance costs.
Equipment TypeUnit Price (USD/kW)Equipment TypeUnit Price (USD/kW)
WT0.007HGB0.014
HCHP0.013EL0.0026
CSP0.013//
Table 3. Study cases.
CaseCSPHydrogen-Doped CombustionP2GConventional CHP
1×××
2×
3×
4
Table 4. IES running costs for different cases (USD).
CategoryCase 1Case 2Case 3Case 4
Operation and maintenance costs572673.92643.51660.35
Cost of energy purchases2324.971843.681421.741384.3
Wind abandonment costs128.310.05423.311.13
Cost of carbon emissions355.86313.625.2424.46
Total cost3381.142831.252113.792080.24
Actual carbon emissions (kg)2106.31893323.2302.7
Disclaimer/Publisher’s Note: The statements, opinions and data contained in all publications are solely those of the individual author(s) and contributor(s) and not of MDPI and/or the editor(s). MDPI and/or the editor(s) disclaim responsibility for any injury to people or property resulting from any ideas, methods, instructions or products referred to in the content.

