Article

Urban Heat Island Assessment in the Northeastern State Capitals in Brazil Using Sentinel-3 SLSTR Satellite Data

by
Rodrigo Fernandes
1,*,
Antonio Ferreira
2,
Victor Nascimento
3,*,
Marcos Freitas
1 and
Jean Ometto
4
1
Postgraduate Program in Remote Sensing (PPGSR), Federal University of Rio Grande do Sul (UFRGS), Porto Alegre 91501-970, RS, Brazil
2
Institute of Marine Sciences (LABOMAR), Federal University of Ceará (UFC), Fortaleza 60165-081, CE, Brazil
3
Center for Engineering, Modeling, and Applied Social Sciences, Federal University of ABC (UFABC), Santo André 09210-580, SP, Brazil
4
National Institute for Space Research (INPE), São José dos Campos 12227-010, SP, Brazil
*
Authors to whom correspondence should be addressed.
Sustainability 2024, 16(11), 4764; https://doi.org/10.3390/su16114764
Submission received: 17 April 2024 / Revised: 23 May 2024 / Accepted: 29 May 2024 / Published: 3 June 2024
(This article belongs to the Section Air, Climate Change and Sustainability)

Abstract

:
The lack of a solid methodology defining urban and non-urban areas has hindered accurately estimating the Surface Urban Heat Island (SUHI). This study addresses this issue by using the official national urban areas limit together with a surrounding areas classification to define three different reference classes: the urban adjacent (Ua), the future urban adjacent (FUa), and the peri-urban (PUa), consequently providing a more accurate SUHI estimation on the nine northeastern Brazilian capitals. The land surface temperature was obtained in this study using the Sentinel-3 satellite data for 2019 and 2020. Subsequently, the maximum and average SUHI and the complementary indexes, specifically the Urban Thermal Field Variation Index (UTFVI) and the Thermal Discomfort Index (TDI), were calculated. The UTFVI expresses how harmful the eco-environmental spaces are, with a very strong SUHI for three capitals. In addition, the TDI, with values between 24.6–28.8 °C, expresses the population’s thermal comfort, with six capitals showing a very hot TDI. These findings highlight the need for strategies to mitigate the effects of the SUHI and ensure the population’s thermal comfort. Therefore, this study provides a better SUHI understanding and comparison for the Brazilian northeastern region, which has diverse areas, populations, and demographic variations.

1. Introduction

Solar radiation keeps planet Earth warm and is essential for maintaining life as we know it. It assists in evaporation, transpiration, and photosynthesis. As a result, radiation is considered the main meteorological element. Its study for remote sensing extends to the effects of energy balance, the greenhouse effect, global climate change, and urban heat islands (UHIs). The latter is one of the most studied urban climate effects [1,2,3].
While warming from the greenhouse effect occurs naturally, the global temperature has recently increased [4]. In contrast, urban heat islands arise mainly due to anthropogenic issues [5]. Therefore, changes in urban structure over the years, influenced by population migration from rural to urban areas, have contributed to exceeding the carrying capacity of the natural space, generating considerable negative environmental impacts. The most common problems are associated with using building materials that absorb more radiation than in less urbanized rural areas, which causes the phenomenon known as Urban Heat Island [6].
Several factors can contribute to UHI formation, such as a city’s impermeability, dark building components, geometrically unfavorable buildings for proper air circulation, man-made heat and pollution sources, and low wind speeds [7,8,9].
In addition, UHI is defined as the difference between the air temperature within the urban area and its surroundings [10]. These high-temperature effects are direct consequences of changes in the surface energy balance. They are reinforced by the impact of climate change, which affects people’s psychological and physiological well-being, as well as daily mood and financial behaviors [11]. Furthermore, inhabitants of major tropical and semiarid cities often experience the UHI phenomenon more frequently and intensely, as cities in the tropics are already naturally warmer [12].
However, there are three types of UHI: the Canopy-Layer Urban Heat Island (CLUHI), the Urban Boundary Layer (UBL), and the Surface Urban Heat Island (SUHI) [13]. In this study, we focus on the SUHI.
Traditionally, SUHI is based on land surface temperature (LST) data obtained by remote sensing, usually validated by meteorological station data. However, despite stations not being as affected on cloudy days, the limited and uneven distribution of these stations can result in the absence of representative temperature data for the study region [14]. Therefore, the use of orbital images has become widespread with advancements in satellite development, increasing spatial, spectral, and temporal resolution [15]. These images have been essential in evaluating environmental impacts and are a powerful tool for monitoring changes in urban areas. One way to monitor the urban climate is through thermal infrared bands. Once a portion of solar radiation is absorbed and emitted by the urban surface, satellite sensors operating in the thermal infrared range can capture this spectral response and, with appropriate corrections, can estimate the LST at a large scale in cloud-free conditions. This can be used to detect the SUHI properly [16,17].
Numerous studies have been conducted on detecting SUHIs using different approaches, such as varying spatial, temporal, and spectral scales or testing the most appropriate satellite sensor [18,19,20,21,22]. However, most of these studies focus only on a single location, where the definition of urban and rural areas is tailored for each case, making comparisons between localities in different parts of the world difficult. However, there is not only one methodology to define a non-urban area. Therefore, properly identifying urban and non-urban is essential for SUHI estimation since the wrong classification can lead to UHI underestimation or overestimation values. Hence, classifying non-urban and urban areas remains challenging for remote sensing science.
This study aims to analyze SUHI values for all capital cities in northeastern Brazil using the Urban Thermal Field Variation (UTFVI) and the Thermal Discomfort Index (TDI) obtained using the Sentinel-3 satellite—Sea and Land Surface Temperature Radiometer (SLSTR) sensor, for the years 2019 and 2020. The main novelty of this study is that it applies this methodology to the northeast Brazilian region, which is a semiarid region. In addition, the study’s importance is related to Sustainable Development Goal (SDG) 11, which aims to achieve more inclusive, safe, and resilient human settlements [23].

2. Study Area

The study area is the northeastern (NE) Brazilian capitals, Fortaleza, Maceió, Salvador, São Luís, João Pessoa, Recife, Teresina, Natal, and Aracaju, located in the Bahia (BA), Maranhão (MA), Paraiba (PB), Pernambuco (PE), Piauí (PI), Rio Grande do Norte (RN), and Sergipe (SE) states, respectively (Figure 1).
These capitals were chosen because they have diverse area sizes, populations, and demographic densities [24] (Table 1). For example, Salvador has the largest population, but Fortaleza has the highest demographic density. Further, Teresina is the only one not on the coast. In addition, the Brazilian Northeast has few studies on the subject. Furthermore, an analysis such as this study for cities affected by the semiarid climate would be fundamental to mitigate the SUHI phenomena.

3. Materials and Methods

A flowchart of the methodology steps taken in this study is shown in (Figure 2).

3.1. Remote Sensing Data

This study used remote sensing data from the Sentinel-3A satellite of the European Space Agency (ESA) obtained from November 2019 to November 2020 for each northeastern Brazilian capital (Table 2). The SUHI was analyzed with the LST product generated from the SLSTR sensor, with 1 km of spatial resolution in the thermal band, presenting a Polar/Heliosynchronous orbit, altitude of 815 km, an inclination of 98.6°, and a revisit period of 27 days. The LST data were acquired by obtaining cutouts of the study regions, followed by appropriate georeferencing for each. The data already came with atmospheric and geometric corrections. In addition, nighttime thermal infrared images were utilized because the SUHI effects are typically more pronounced during this period. This is due to the absorption and storage of solar radiation by impervious surfaces and buildings during the day, which is gradually released in heat form at night [25].

3.2. Meteorological Data
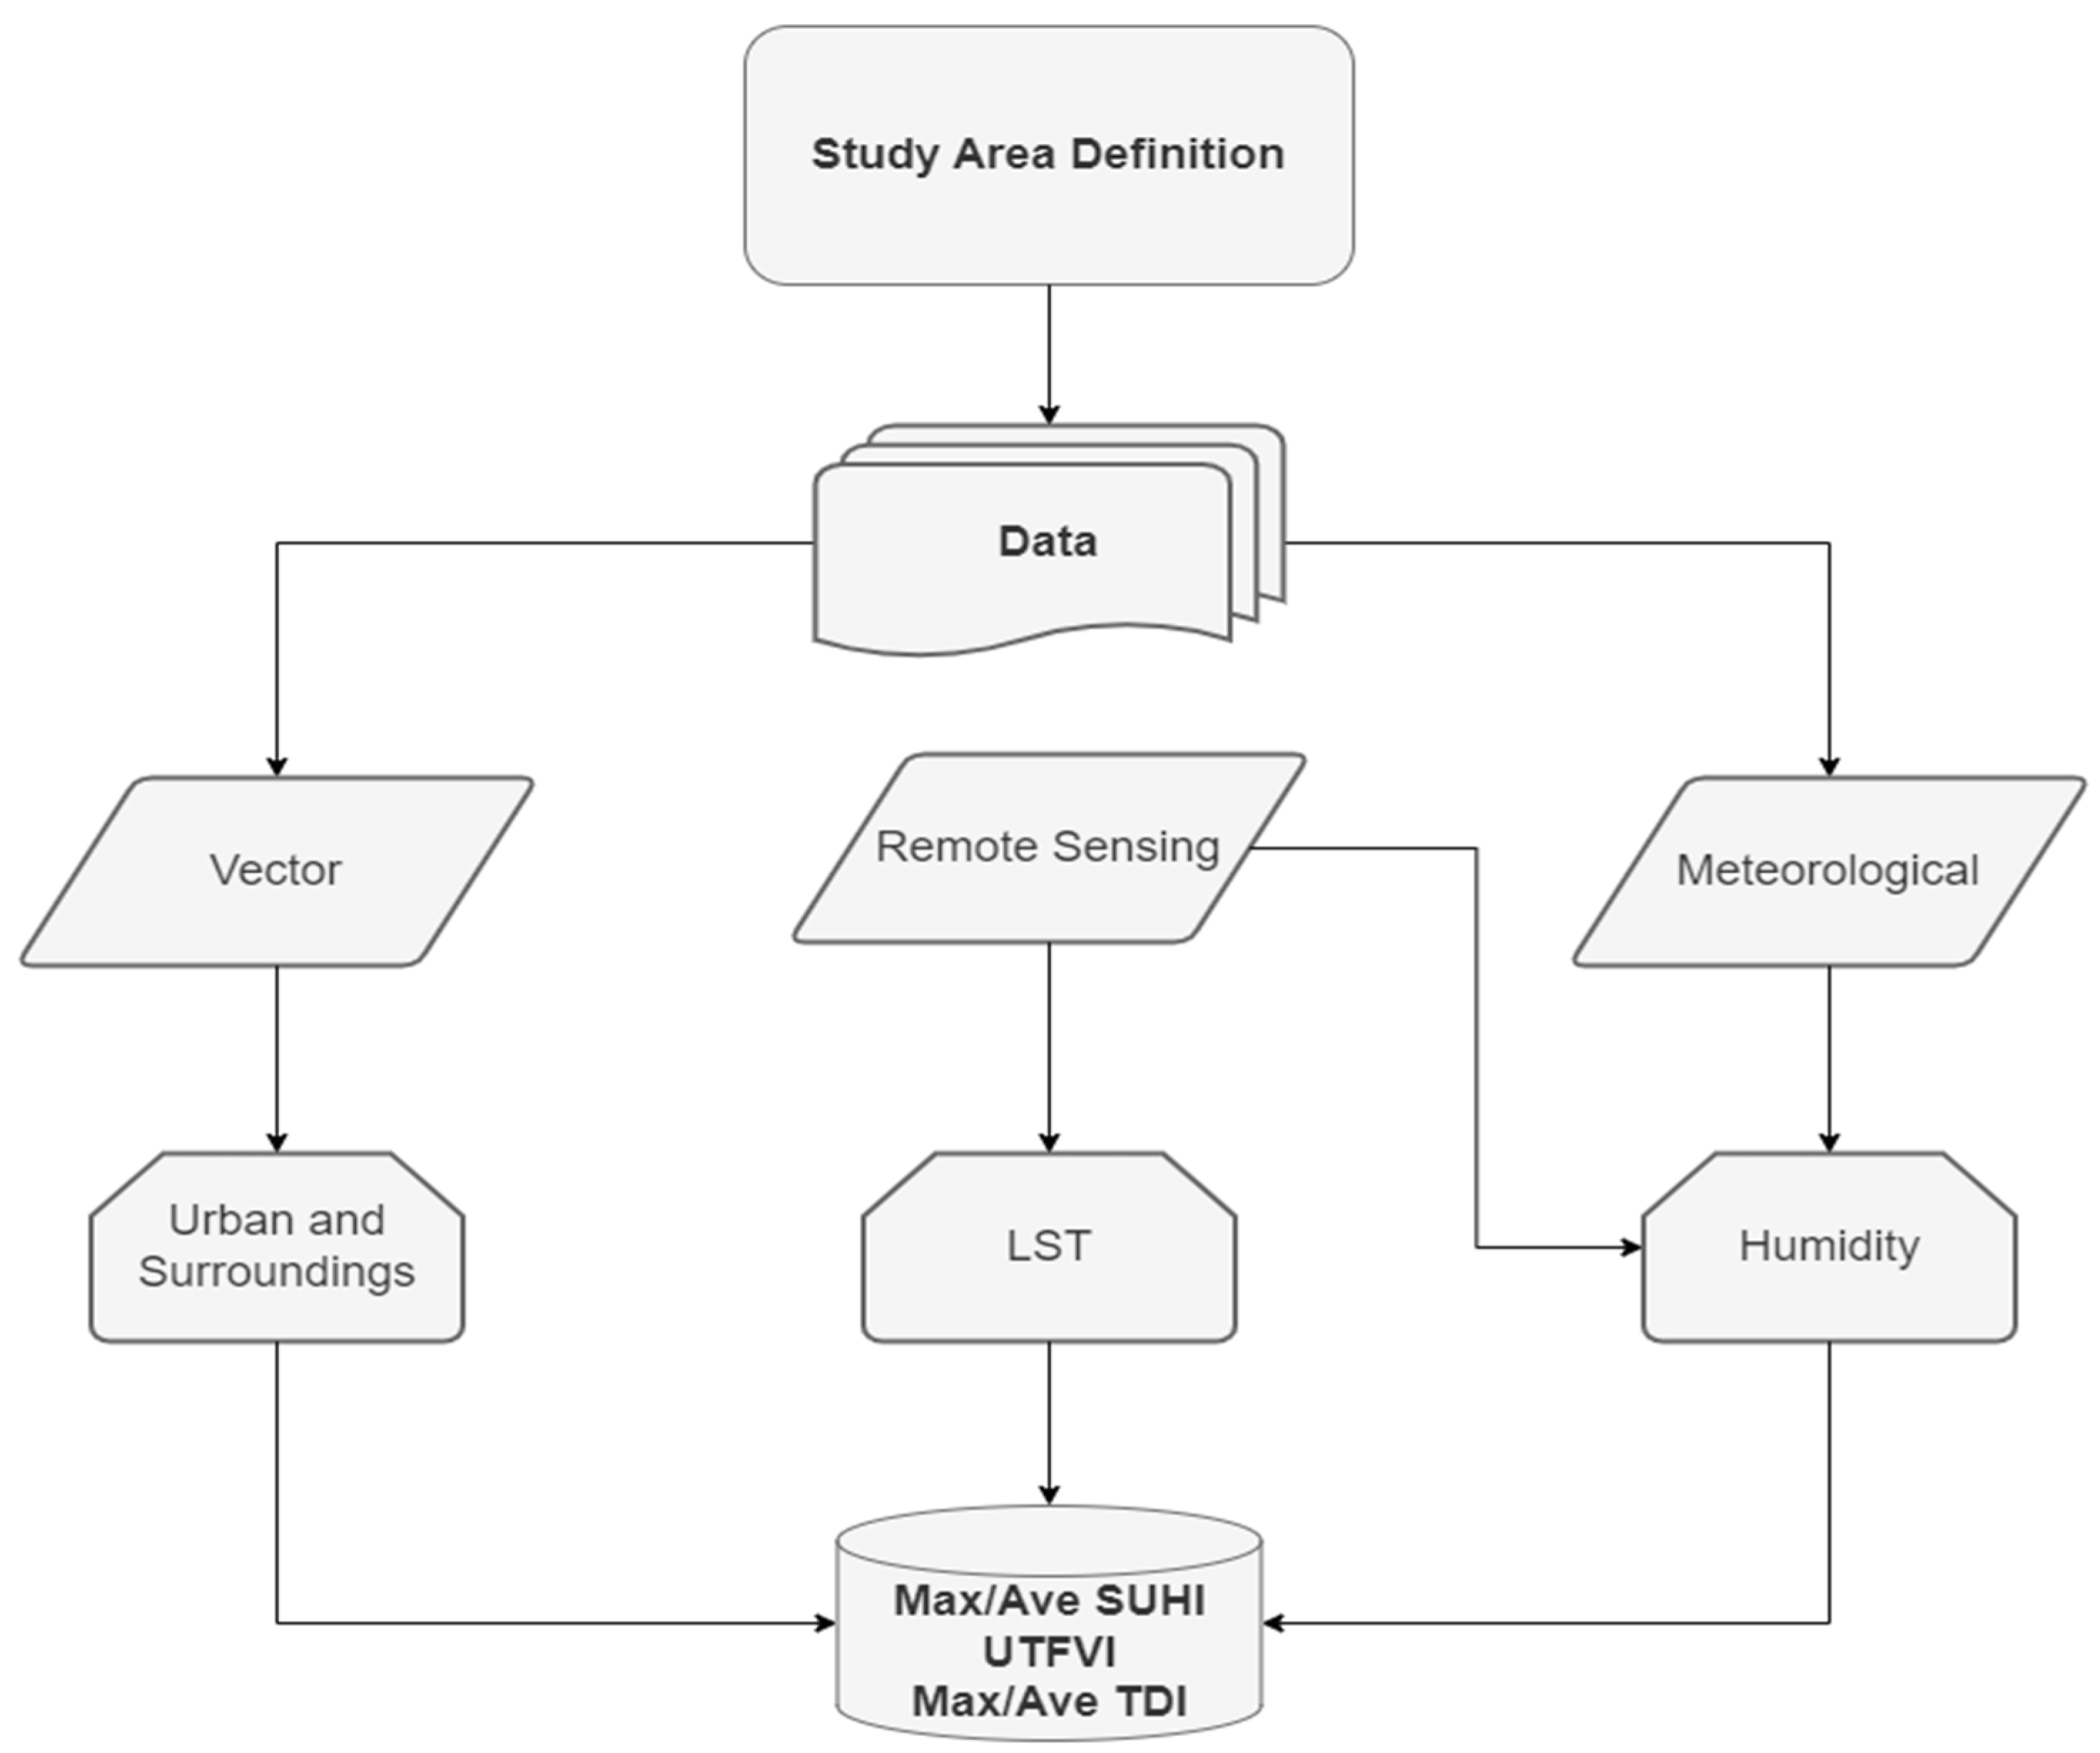
Relative humidity data used in this study were extracted from meteorological stations in each capital of the study area on the same day and time as the images in (Table 2). These data were obtained from the National Institute of Meteorology (INMET) at (https://bdmep.inmet.gov.br/, accessed on 12 February 2023) for all the Brazilian northeast capitals to calculate the Thermal Discomfort Indexes (TDI).

3.3. Methodology

3.3.1. Surface Urban Heat Island and Its Surroundings Estimation

The nighttime Land Surface Temperature (LST) data were retrieved from Sentinel-3 satellite images and were used according to [26]:
Maximum SUHI = (Maximum Urban LST − Average Surrounding LST)
Average SUHI = (Average Urban LST − Average Surrounding LST)
where the Maximum Urban LST is the hottest pixel in the urban area, and the Average Urban LST and the Average Surrounding LST are the average temperatures of all the pixels in the urban area and its surroundings, respectively.
The Sentinel Application Platform (SNAP) software, version 8, provided by ESA for processing images from the Sentinel series satellites, was used to analyze the statistical parameters of the images used in this study.

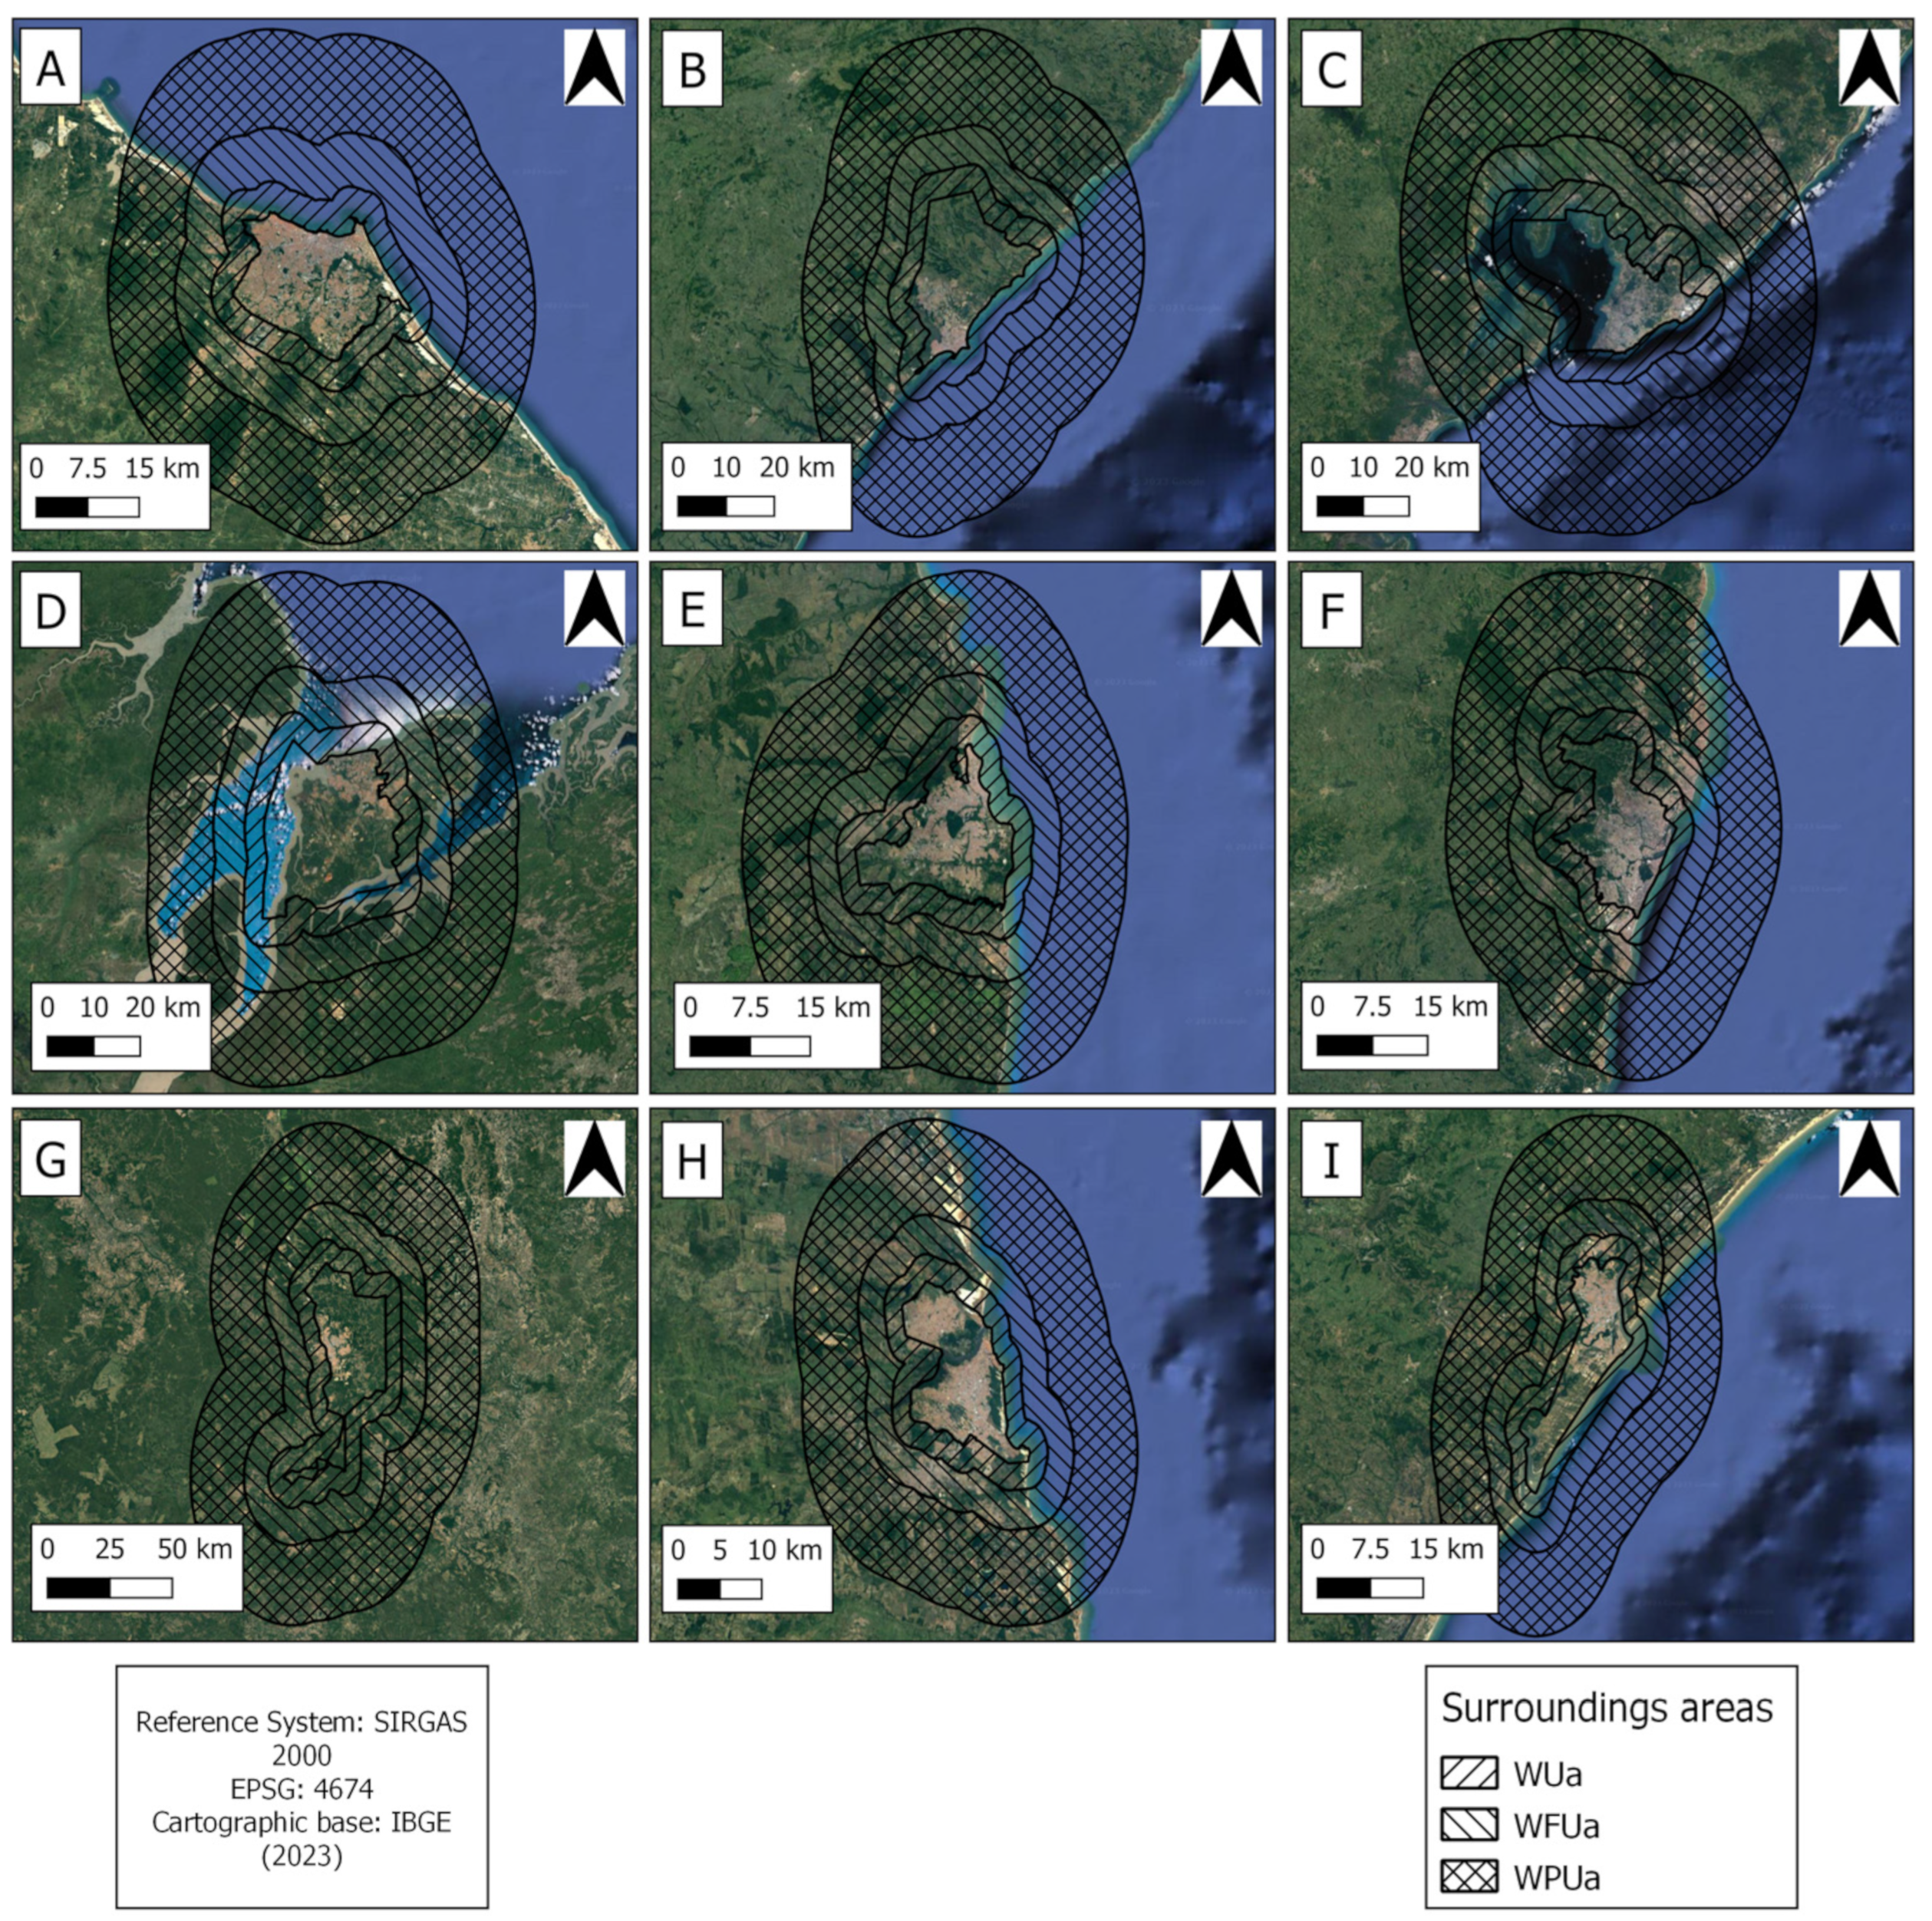
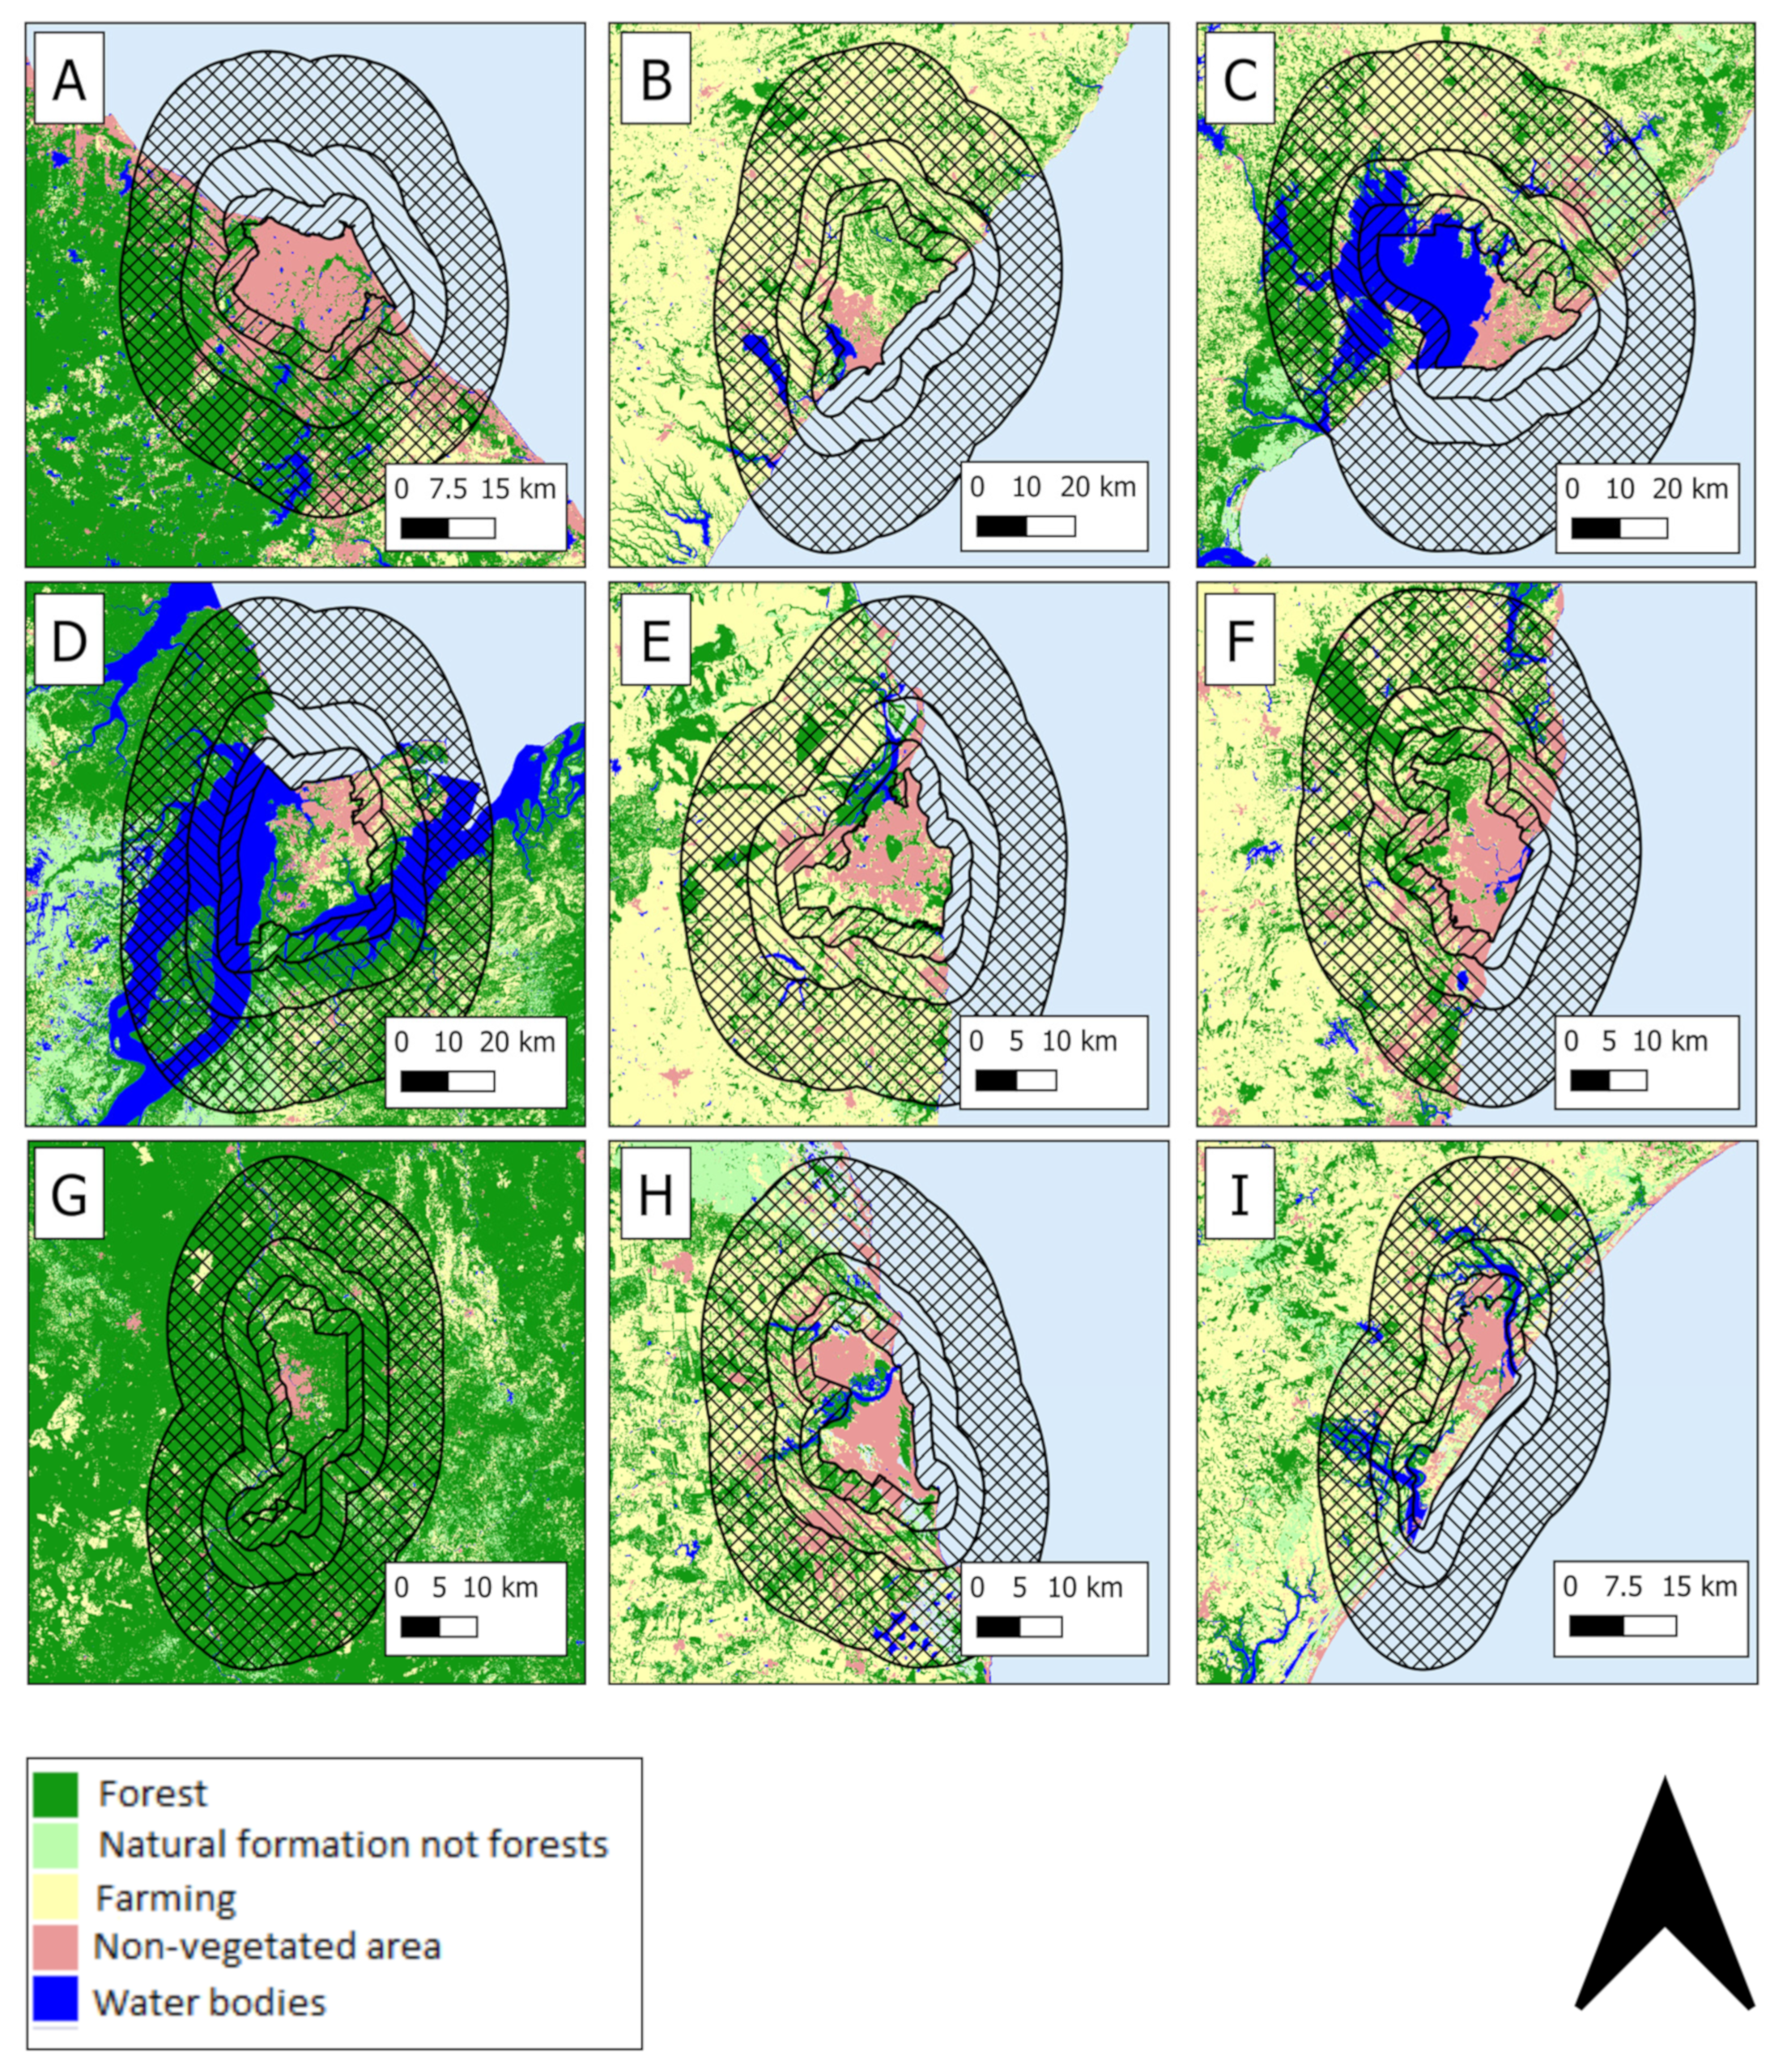
3.3.2. Urban and Surroundings Areas Selection

According to [26], calculating the maximum and average SUHI is complicated because urban and non-urban areas are difficult to discriminate. In addition, there is no consensus in the scientific literature on how to differentiate this area. Therefore, the author proposes to identify urban areas using a land cover map with an explicit representation of the urban agglomeration provided by the European Space Agency [27]. However, the official urban areas boundaries for state capitals from the Brazilian Institute of Geography and Statistics (IBGE), available at (https://www.ibge.gov.br/geociencias/downloadsgeociencias.html, accessed on 12 February 2023), were used in this study.
Afterwards, the surrounding areas were classified into three different reference classes: the urban adjacent (Ua), the future urban adjacent (FUa), and the peri-urban (PUa). In addition, “A” represents the urban area, and AWUa is the sum of the areas of A and Ua. Furthermore, the widths of these surroundings, WUa, WFUa, and WPUa, respectively, were calculated as follows according to [26]:
WUa = 0.25 A1/2
WFUa = 0.25 AWUa1/2
WPUa = 1.5 A1/2 − WFUa − WUa
The representation of the adjacent areas to the urban was generated by the Michael Minn Quantum GIS (MMQGIS) [28] “create buffers” tool of the QGIS software version 3.16.1 (Gary Sherman, Anchorage, AK, USA). Figure 3 depicts the adjacent areas represented as buffers for the cities, and Table 3 presents the values of the areas for each adjacent region of the cities.

3.3.3. UTFVI and TDI Indexes

In addition, to complement the SUHI analysis, additional indexes were considered, such as the UTFVI, which is widely used for ecological thermal assessment of city environments due to its relationship with LST. It considers the thermal effects of different subareas [14].
The equation below describes the UTFVI calculation, according to [29,30]:
UTFVI = 1 − (Tmean/Ts)
where Ts is the LST in Kelvin, obtained from Sentinel-3 satellite data, of a given pixel in the urban area (A), and Tmean is the LST mean of the whole study area in Kelvin.
The maximum and average SUHI describe the temperature effect over the entire study area, while the UTFVI assesses each pixel impact located only inside the urban area. The index is divided into six levels (Table 4) based on the SUHI occurrence phenomenon related to the urban environment ecological evaluation [31,32].
Additionally, it is well known that the SUHI affects people’s health, so the TDI measures the human body’s reaction to a combination of heat and humidity. According to [33], this index allows the estimation of people’s thermal comfort concerning the environment in which they live.
The TDI is described as (Equation (7)) accordingly proposed by [34]:
TDI = LST − (0.55 − 0.055 RH) (LST − 14.5)
where LST is the land surface temperature at a given pixel of A, which should be presented in degrees Celsius, and RH is the relative humidity in percentage. According to [35], the TDI is divided into ten categories, as shown in Table 5.

4. Results and Discussion

The SUHI maximum and average values, as well as UTFVI and TDI, should be interpreted as daily and time-specific for all data analyzed. Some vulnerability points were noticed in the capitals studied, including high-temperature values in urban areas, worrisome ecological index results, and harmful thermal sensations for humans. Identifying these vulnerabilities is even more critical in achieving Sustainable Development Goal (SGD) 11, especially in a warming world, where the global temperature increase trend is linear at 0.18 K per decade [36]. According to the most recent Intergovernmental Panel on Climate Change (IPCC) report, the world has already warmed 1.1 °C and is likely to exceed 1.5 °C by the 2030s [4].

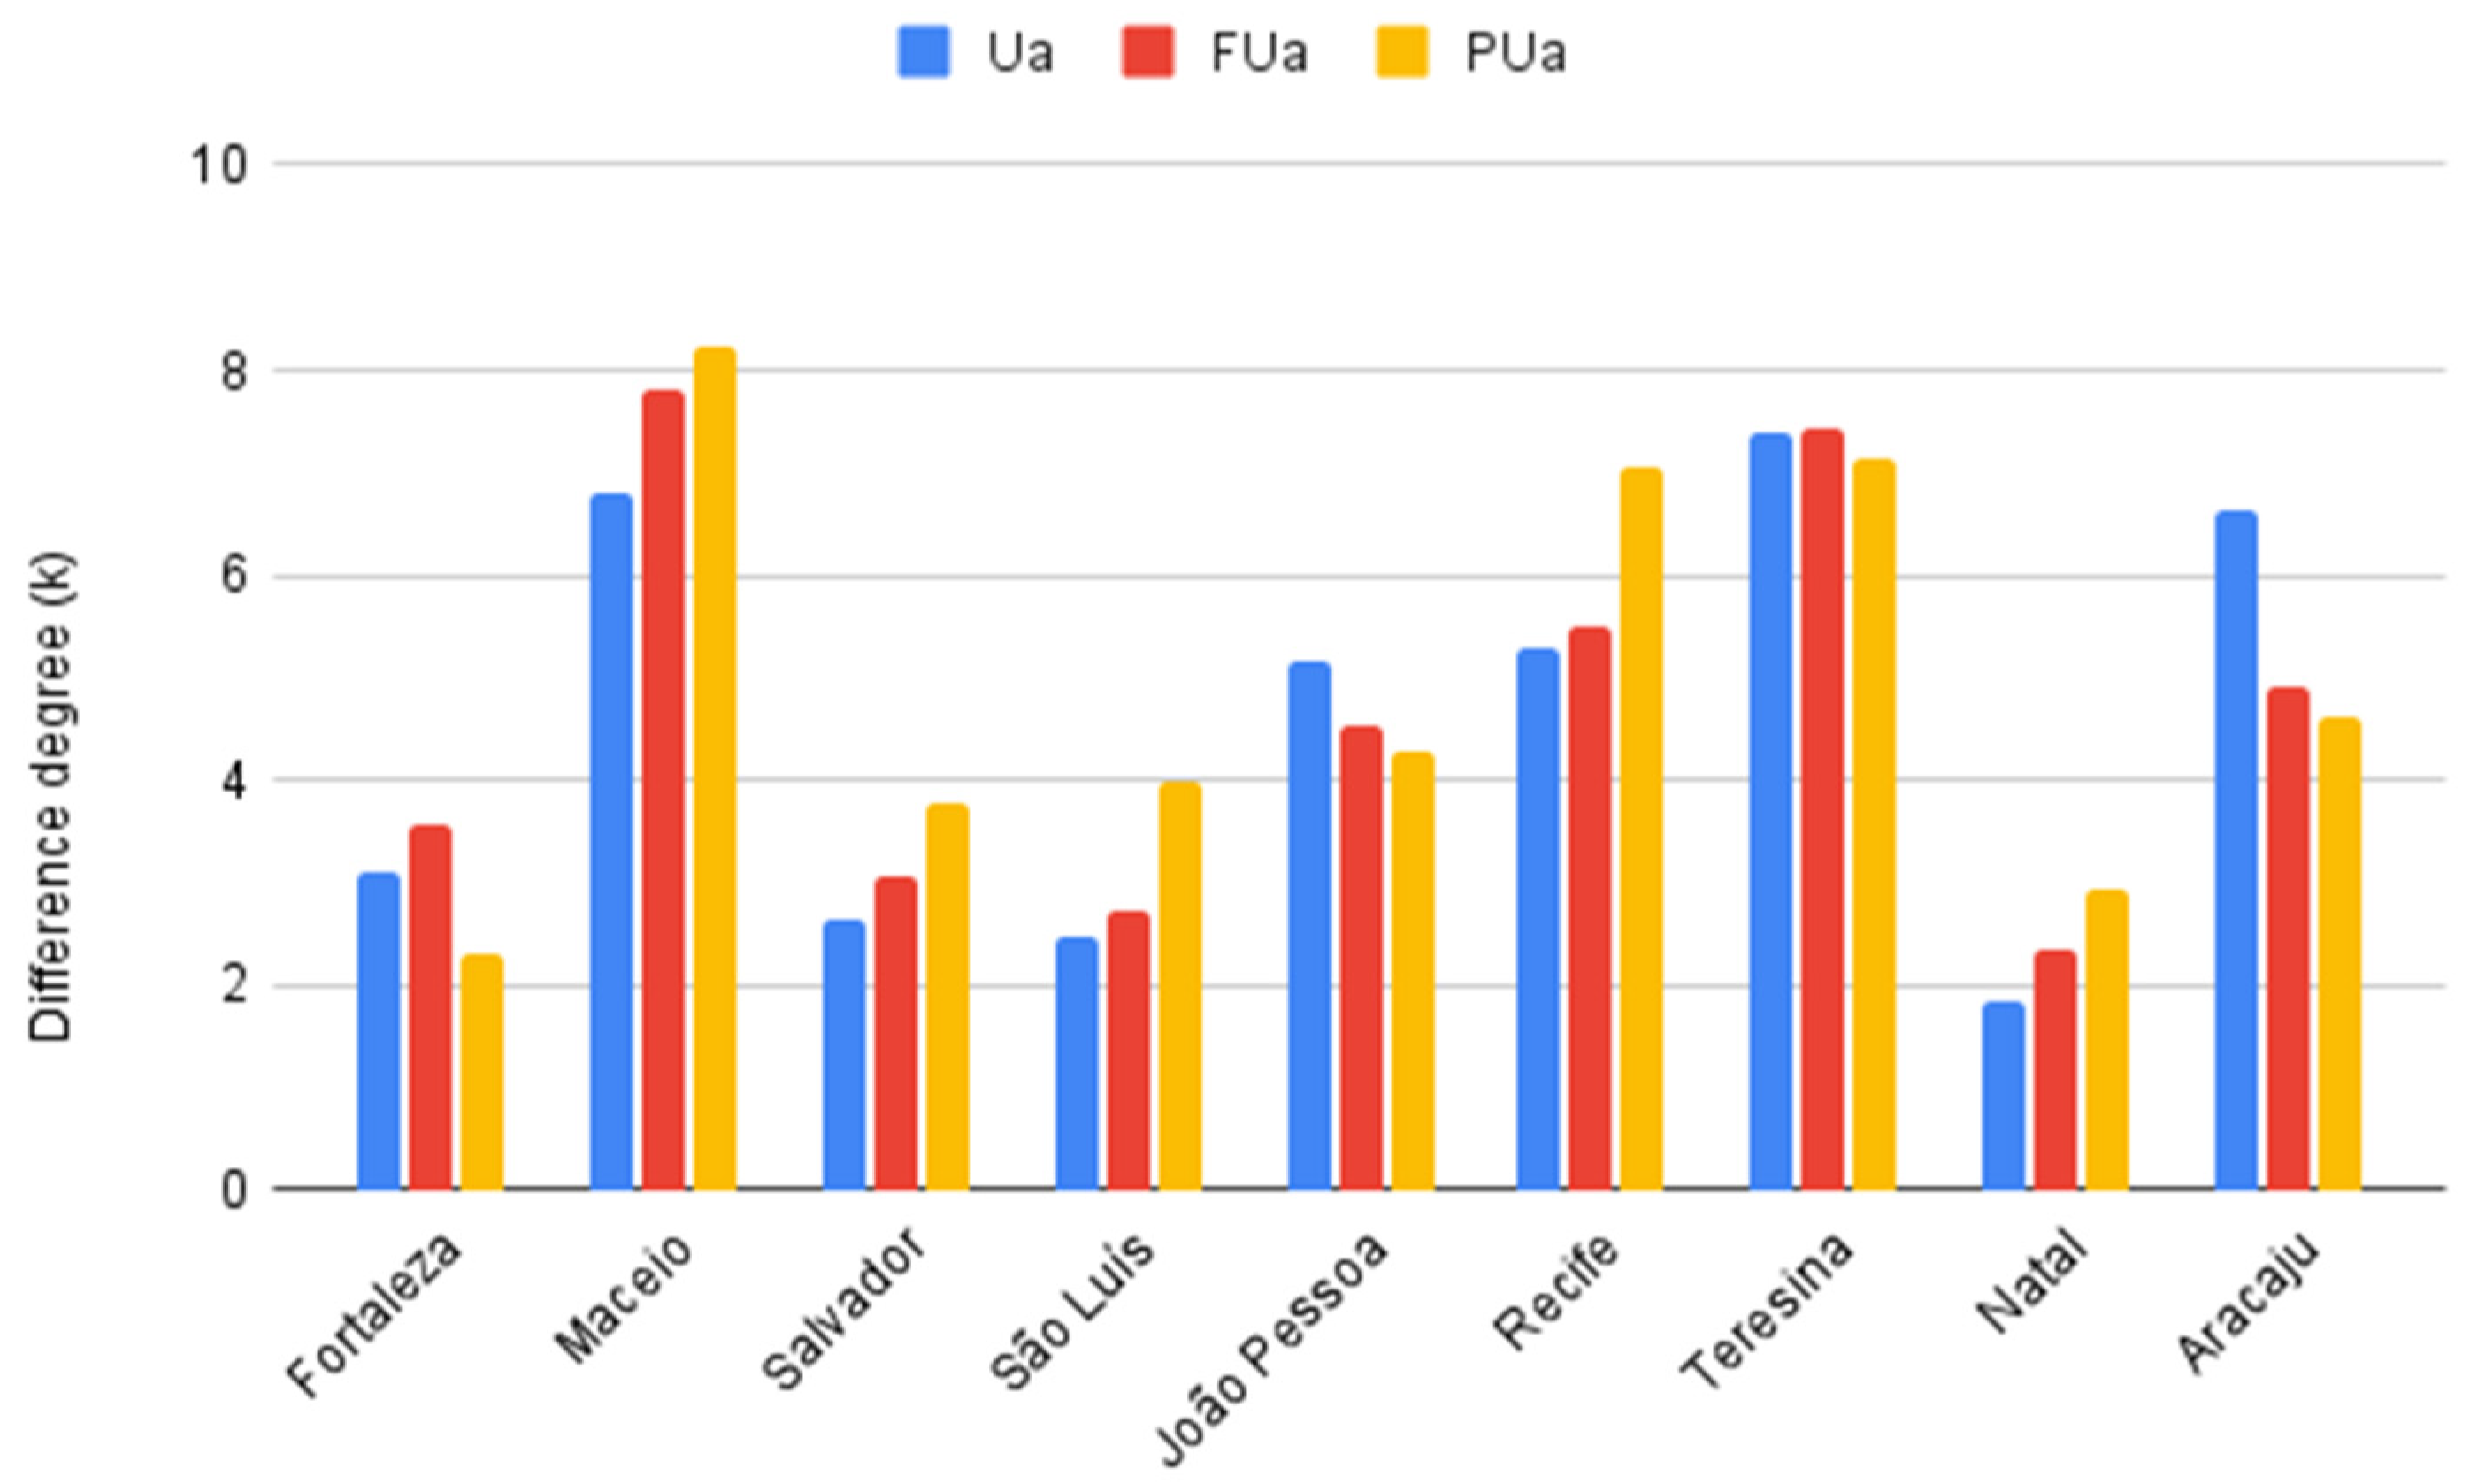
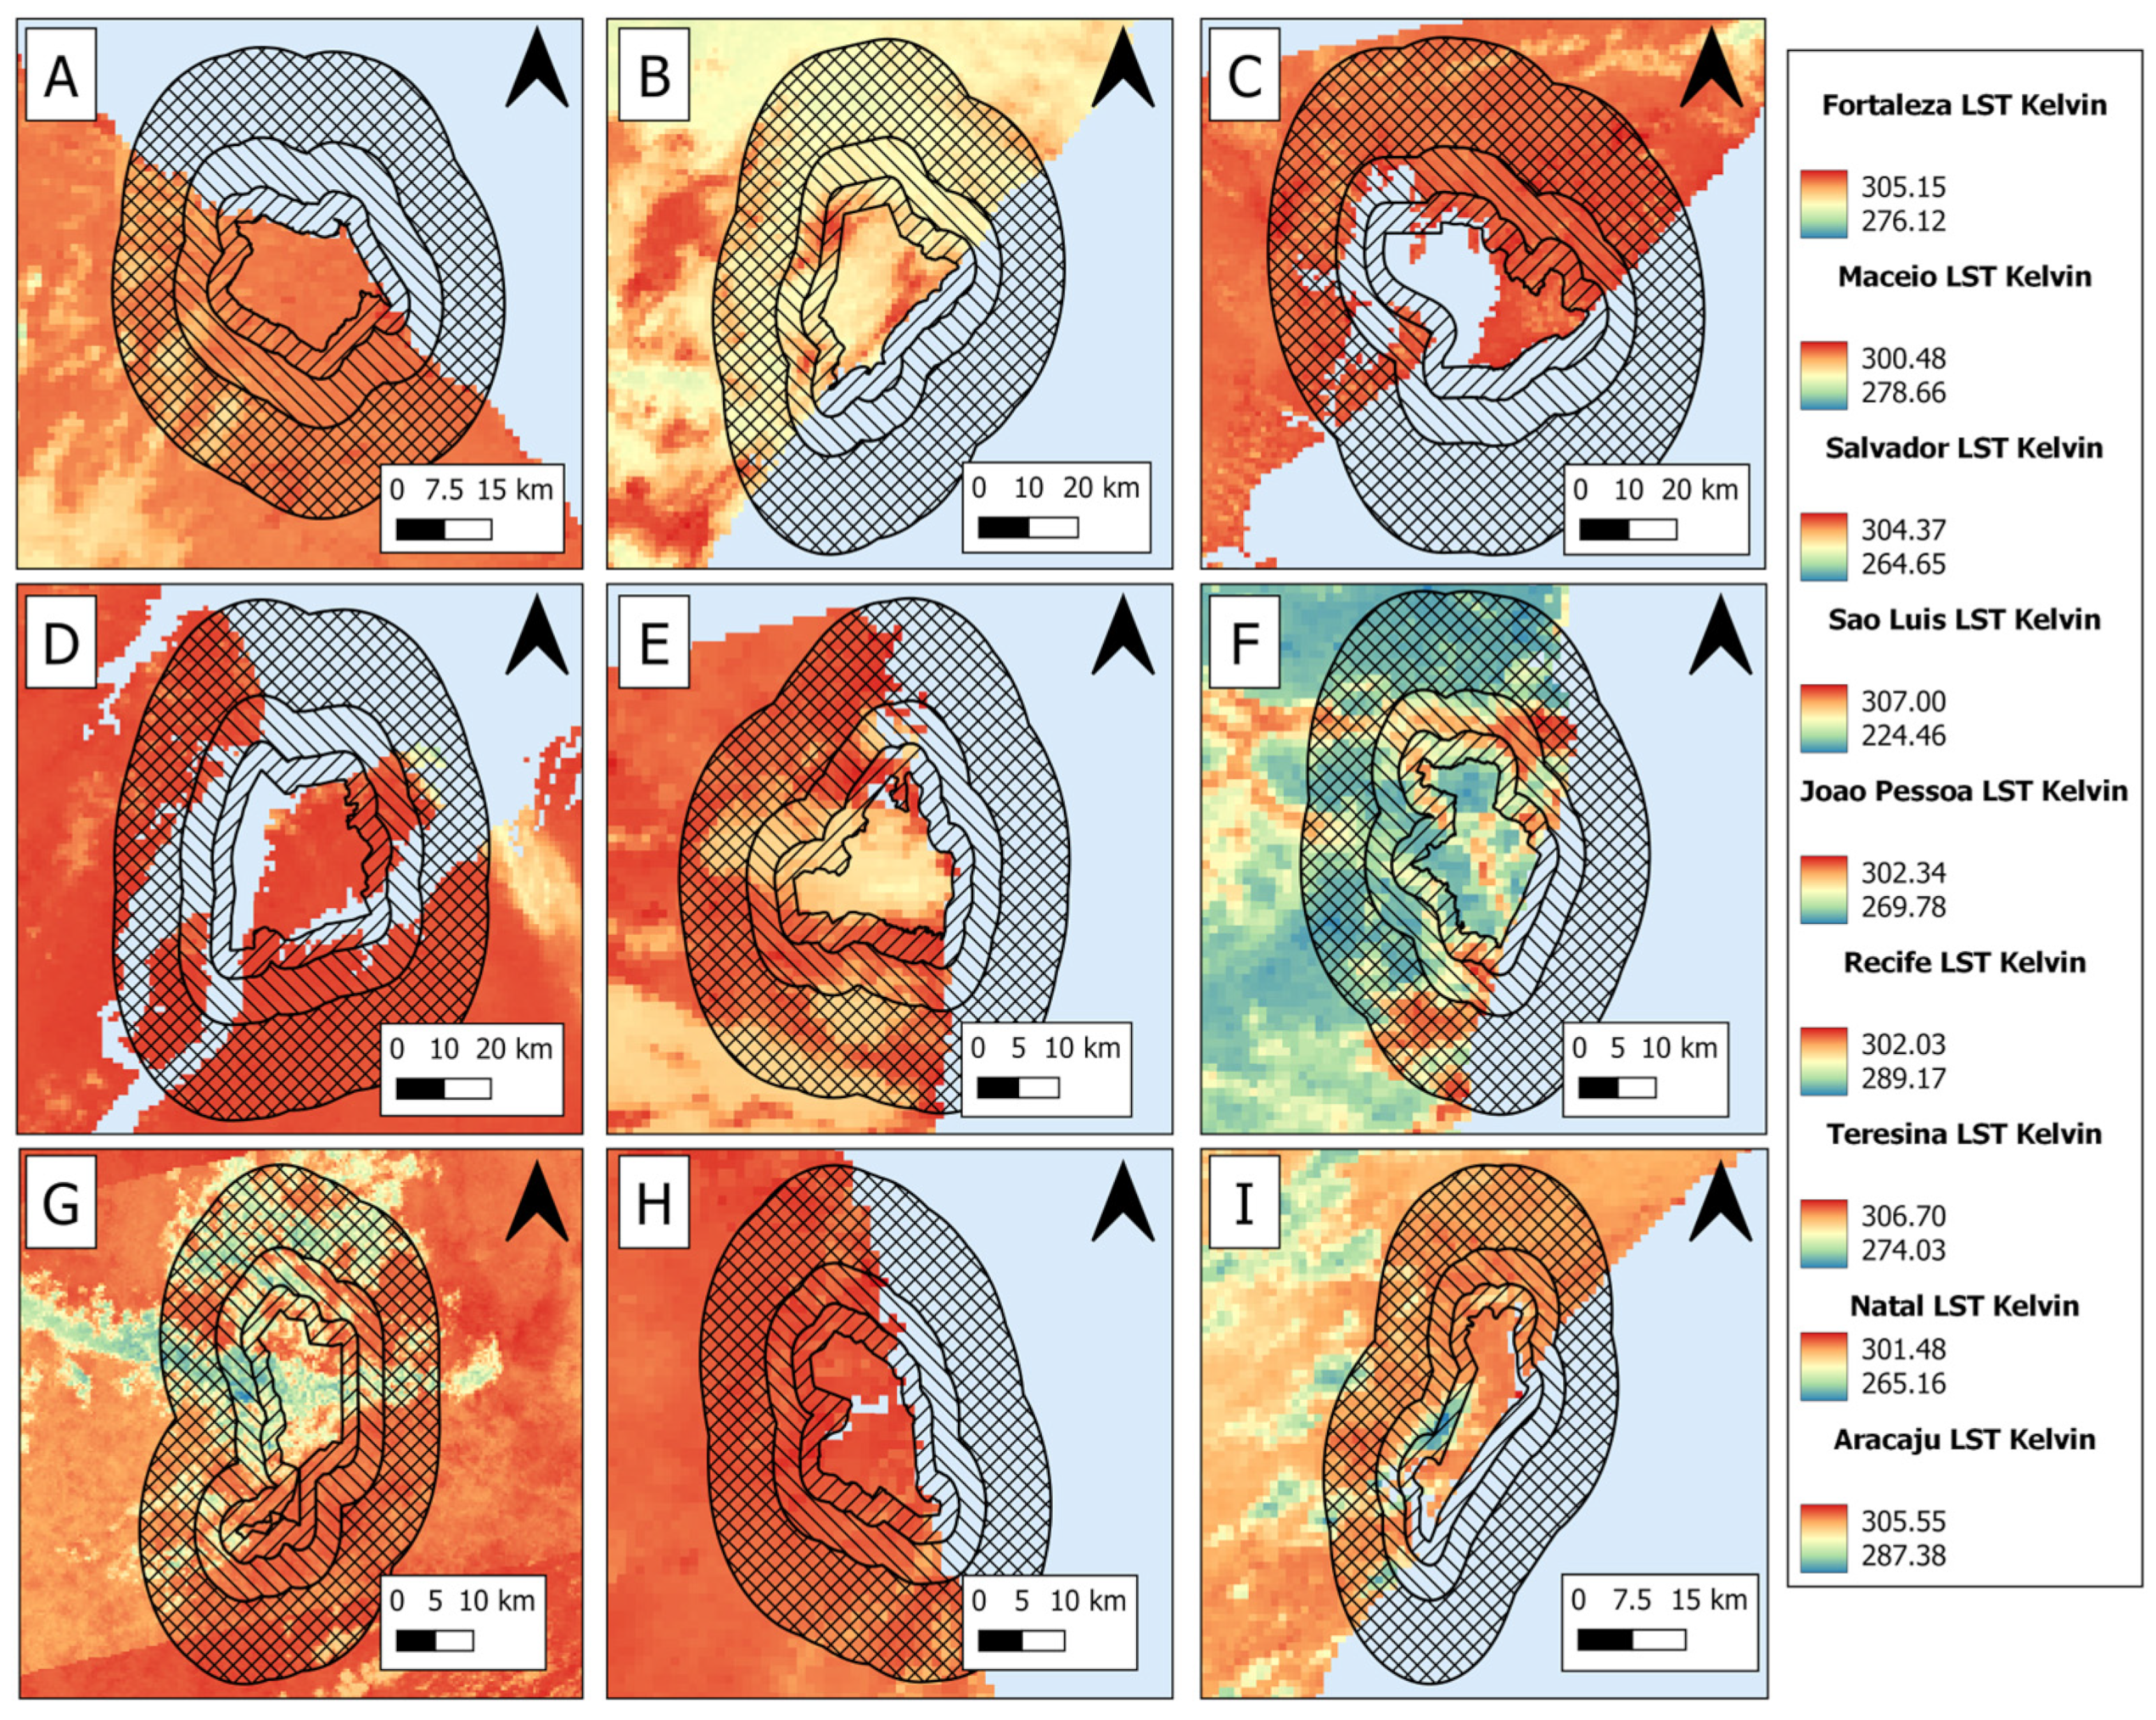
4.1. Surface Urban Heat Island

Maximum and Average Urban Heat Island

The maximum and average SUHI values for all the northeastern Brazilian capitals are represented in Figure 4 and Figure 5, respectively, considering the urban adjacent (Ua), the future urban adjacent (FUa), and the peri-urban (PUa).
As proximity to the capital increased, an increasing trend in the maximum SUHI values was observed in Maceió, Salvador, São Luis, Recife, and Natal. In contrast, decreasing trend values were found in Fortaleza, João Pessoa, Teresina, and Aracaju as the distance from the capital increased (Figure 4).
In addition to the maximum SUHI values, the same analysis was made with the average SUHI values (Figure 5). For instance, Fortaleza began to exhibit higher temperatures in its areas closer to the urban center, reaching around 27 °C. However, Maceió, Salvador, São Luís, and Natal showed the expected pattern where the urban areas have higher temperatures. In contrast, Recife maintained its lower value in Ua, but the FUa obtained a higher value concerning Ua and PUa, resulting in a colder zone. Conversely, for Teresina, the FUa value was lower, indicating a warmer spot, while João Pessoa and Aracaju exhibited their warmest zones in their areas farther from the respective urban regions.
Therefore, it is clear that areas with vegetation and water bodies attenuate the accumulated heat. In contrast, areas with exposed soil and certain construction materials tend to increase the temperature [22,37,38,39,40,41,42], so the hypotheses were developed to explain the results obtained in the northeastern capitals. In addition, Land Use Land Cover (LULC) images from MapBiomas [43] were used to get the percentages of each class present in each adjacent area (Table A1 and Figure 6). In addition, Figure 7 shows the LST for the capital cities.
Analyzing the Fortaleza maximum SUHI, it was observed that the furthest region of the urban area (PUa) had a value of 2.3, which could be attributed to a high temperature. This can be explained by the fact that the hottest pixel in this area had a very high temperature, reaching 30.9 °C. Despite the urban area class in this region representing only 10% of the PUa (Table A1), the pixel under consideration is located within Aquiraz. The class of interest is present in this well-developed and paved region (Figure 6A and Figure 7A), which may explain the high value found. However, in compensation, in the average SUHI, the pixel temperatures in the city’s urban area have the highest values, corresponding to a 0.13-degree difference, explaining the high temperature near urban areas.
The areas adjacent to Maceió are heavily vegetated, covering more than 30% of the Ua, FUa, and PUa (Table A1). Furthermore, the westernmost portion has many water bodies, covering 5% of the PUa area. In addition, this region has a low urban coverage of only 7%, with a total of 56% coverage containing an agriculture and pasture mosaic, which may explain the high temperature in urban areas compared to the furthest places. This is evident in the maximum and average SUHI calculations, which showed a 6.7- and 0.8-degree difference, respectively (Table A2).
Similar to Maceió, Salvador has a water body to the west of the city and numerous vegetated areas in its suburban regions, with 48% of the water class coverage in the Ua and 27% and 11% in the respective FUa and PUa areas (Table A1). Additionally, there are a few neighboring towns in the suburban areas. The average SUHI showed that the Salvador urban area had a higher temperature than its surroundings, with a value of 2.6 in the maximum SUHI in Ua (Table A2), and showed the highest urban area percentage among the three areas, with 15%, and the lowest vegetation coverage, with only 13% of its area covered. However, FUa had very similar values, which may be explained by the presence of a city nearby, which could contribute to the temperature increase.
In the São Luís maximum SUHI analysis, Ua is lower among the three reference areas, with a value of 2.4 (Table A2). Therefore, the urban regions exhibit higher temperatures than their surrounding areas, which is also reflected in the average SUHI, which has a 0.46 value. It is worth noting that the areas surrounding the city are vegetated and water bodies are present. In fact, in all three regions, vegetation is predominant, with percentages of 51%, 69%, and 62% for the Ua, FUa, and PUa areas, respectively (Table A1).
Based on the maximum and average SUHI analysis of João Pessoa, it is possibly evident that the PUa temperatures were higher compared to the other regions, with values of 4.2 and −4.9 (Table A2), respectively, relative to the urban area. These results may have occurred because PUa has a significant exposed soil presence, attributed to agriculture and pasture (Table A1). Additionally, there are housing developments located in PUa, which may contribute to the high temperatures. For the milder temperatures in the city, the region is well-wooded in some locations, particularly when we consider its center (Figure 6E and Figure 7E), where the botanical garden is located, as shown in Figure 3E. This is a five km2 area with remaining Atlantic Forest vegetation [44].
In Recife, the maximum and average SUHI obtained were lower for Ua, with 5.2 and −2.0 (Table A2), respectively, compared to the other reference regions. However, SUHI in the PUa is still lower than FUa, resulting in higher temperature values in PUa compared to FUa. Specifically, the Ua area has 41% of urbanized land cover, while the PUa area only has 9% (Table A1). However, the PUa area has 57% coverage of farming, where the exposed soil in this region used for these practices can contribute to the observed temperature increase.
The SUHI values in Teresina were very close in all areas, all around 7 (Table A2). This magnitude may have occurred because the urban area and its surrounding areas present similar characteristics to those near the urban core, such as exposed soil in the surroundings. Furthermore, it is the only northeastern capital far from the most direct influence of the Atlantic Ocean, as shown in Figure 6G. However, the hottest areas were near the PUa. In fact, vegetation occurs near the city and in the closest adjacent regions, and a water body is present. Although this is losing its space to urban constructions, it represents 2% of the coverage in each adjoining area (Table A1). A similar case of very close Ua, FUa, and PUa values has occurred in Athens, Shanghai, Calcutta, and Dammam [26], presenting similar conditions as Teresina, with similar surroundings to the urban area.
In Natal, the Ua values were lower for the maximum and average SUHI values, with 1.8 and 0 (Table A2), respectively, which indicates that the city’s urban area is hotter than its surroundings despite plenty of vegetation in the adjacent regions. In fact, the first two adjacent areas have 35% and 36% vegetation coverage, respectively, while PUa has 40% (Table A1). However, despite several water bodies, the city is surrounded by buildings and constructions, and few green areas exist. In comparison, in 71 cities [26], 68 showed similar results to Natal, with their maximum and average SUHI, in both cases, having high-temperature values near the urban area compared to adjacent regions.
Last, in Aracaju, PUa presented the lowest SUHI values for both maximum and average, with 4.6 and 0.4, respectively, especially in the average analysis (Table A2). Additionally, the city has some vegetated areas and riverbanks with riparian forests. Its immediate surroundings also have these elements, which could explain the occurrence of lower temperatures compared to PUa. Furthermore, PUa is predominantly covered by farming, reaching 69% (Table A1).

4.2. Thermal Indexes

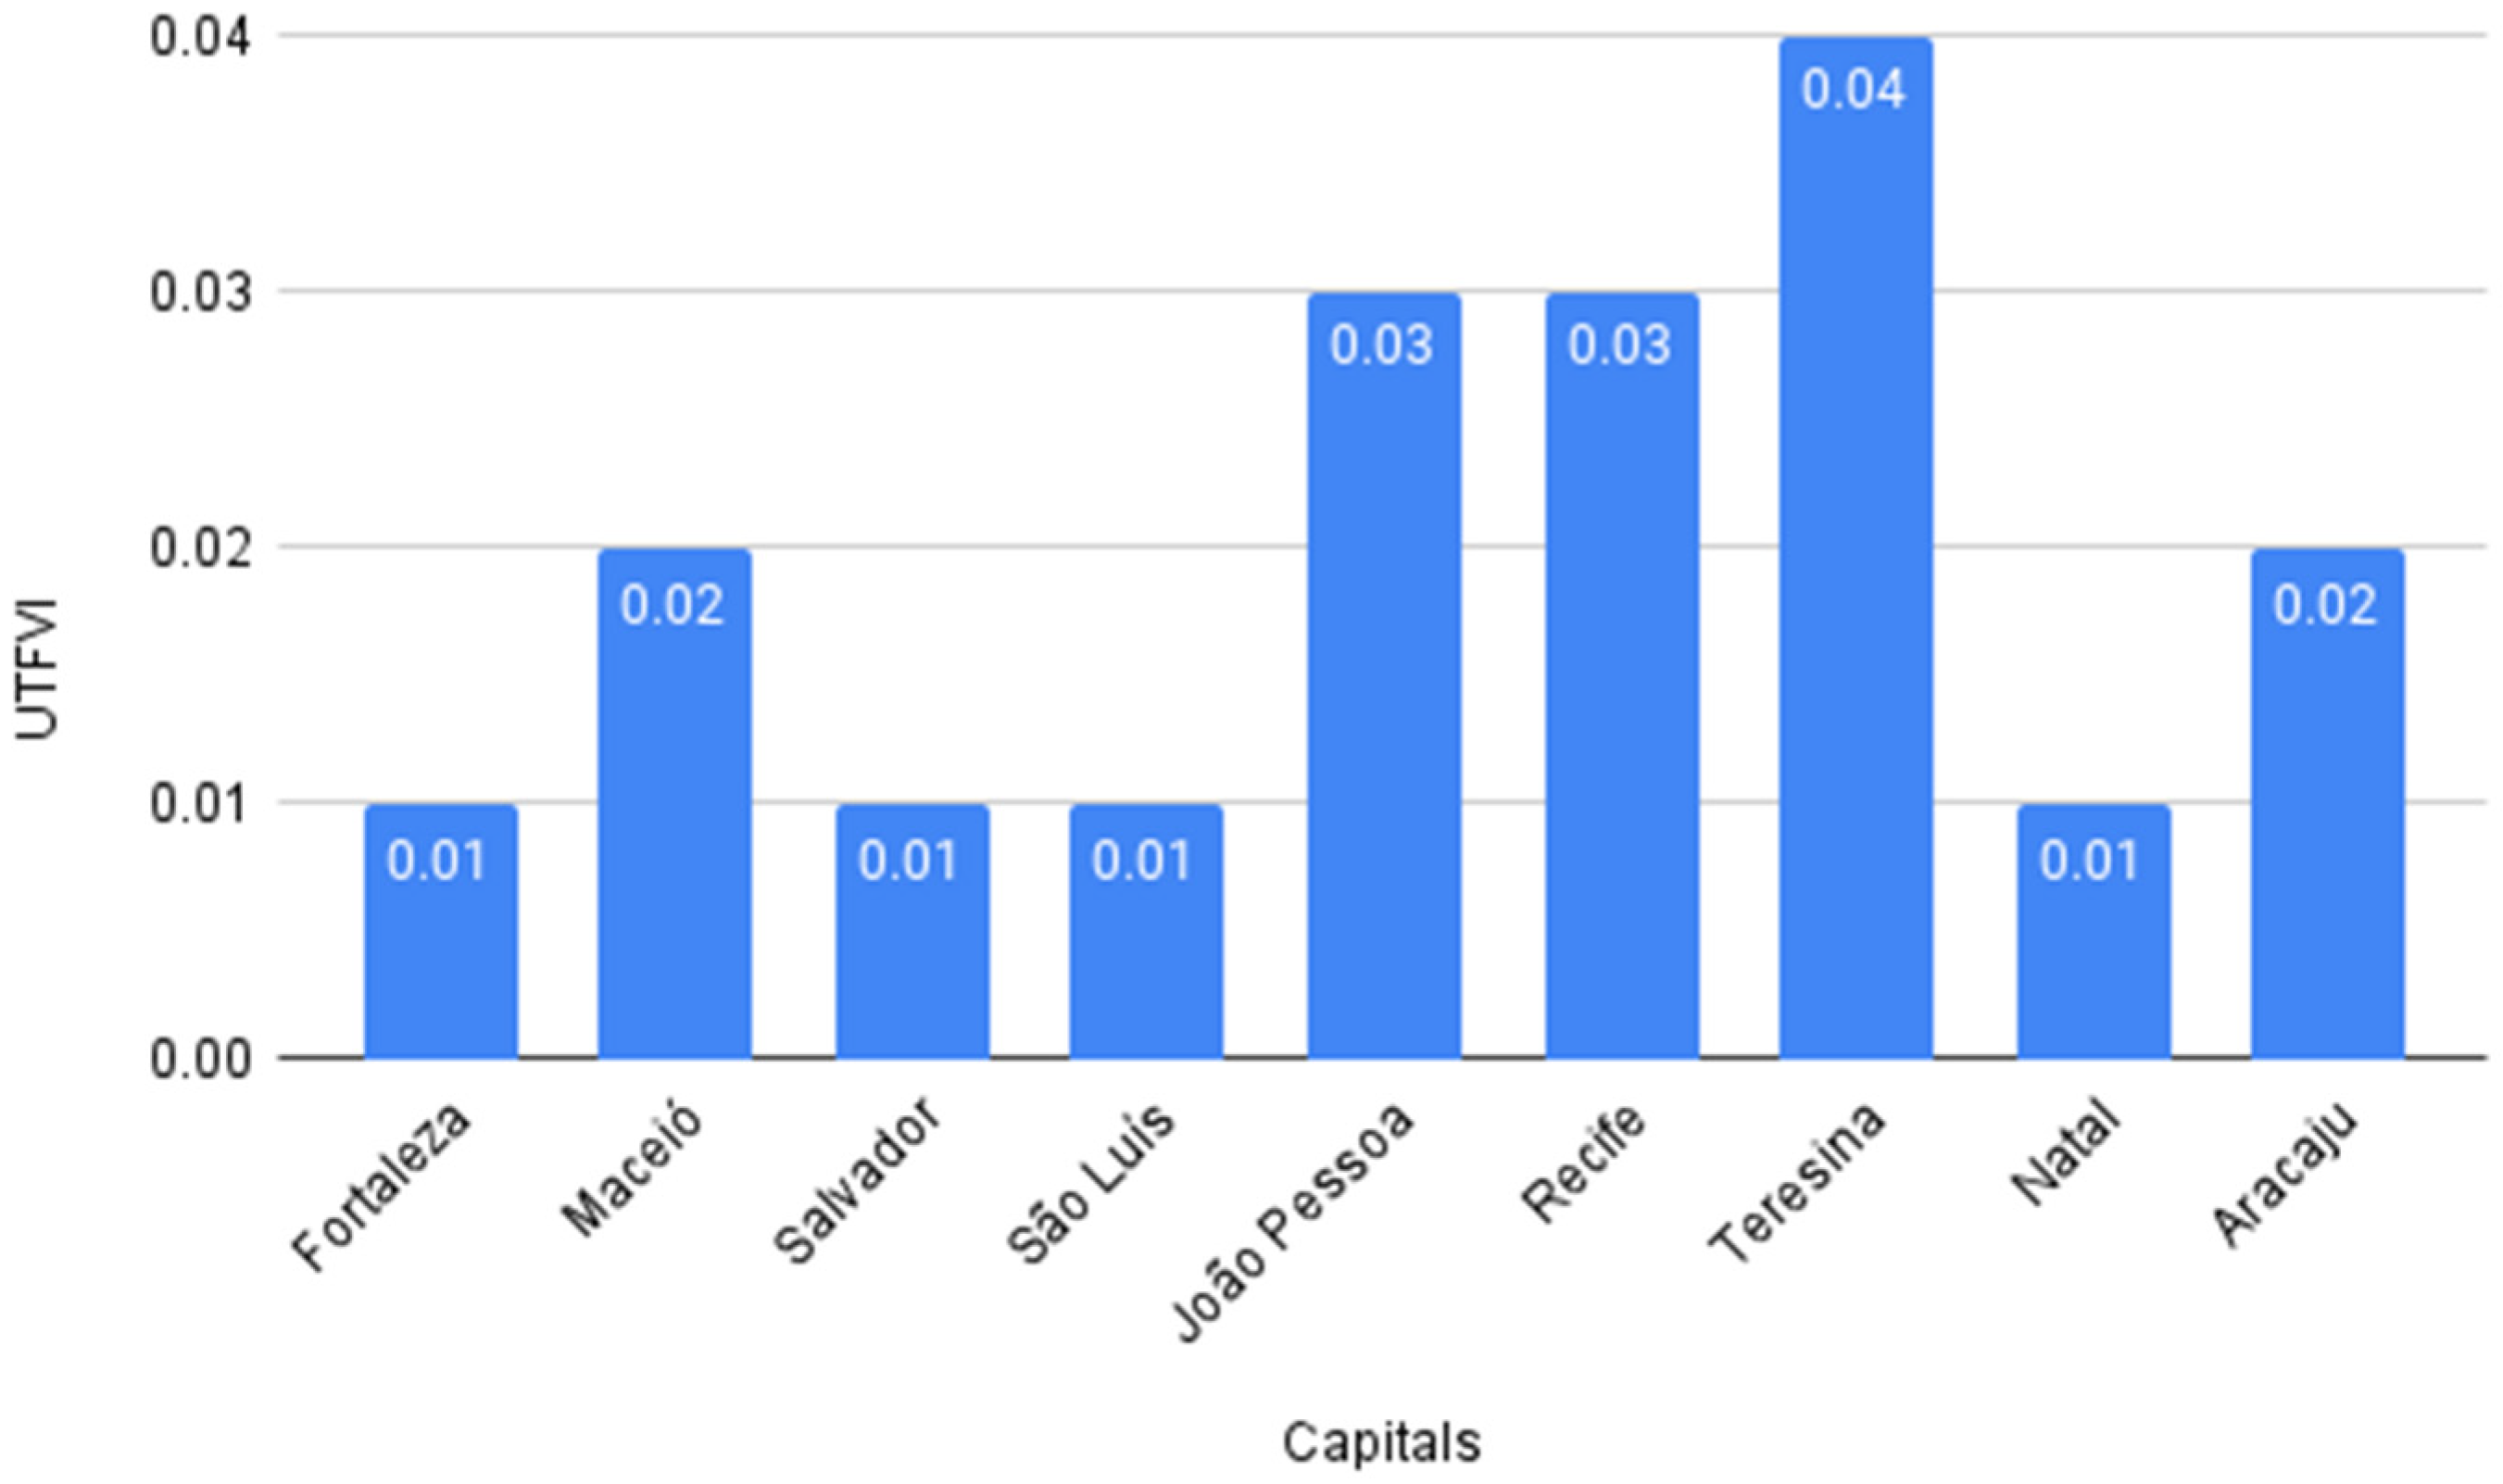
4.2.1. Urban Thermal Field Variation Index

The UTFVI values were the highest for João Pessoa, Recife, and Teresina (Figure 8). These values were above 0.020, presenting the strongest heat island, and their ecological indexes were considered the worst, according to Table 4. Moreover, Maceió and Aracaju presented a strong phenomenon, while the remaining capitals showed medium to strong SUHI. However, it is worth noting that these results are for the regions of the city with the hottest pixels in each urban area, indicating that they have an average, strong, and/or very strong urban heat island phenomenon in that specific region of the analyzed city area, and therefore also have a normal, poor, and/or bad eco-environment.

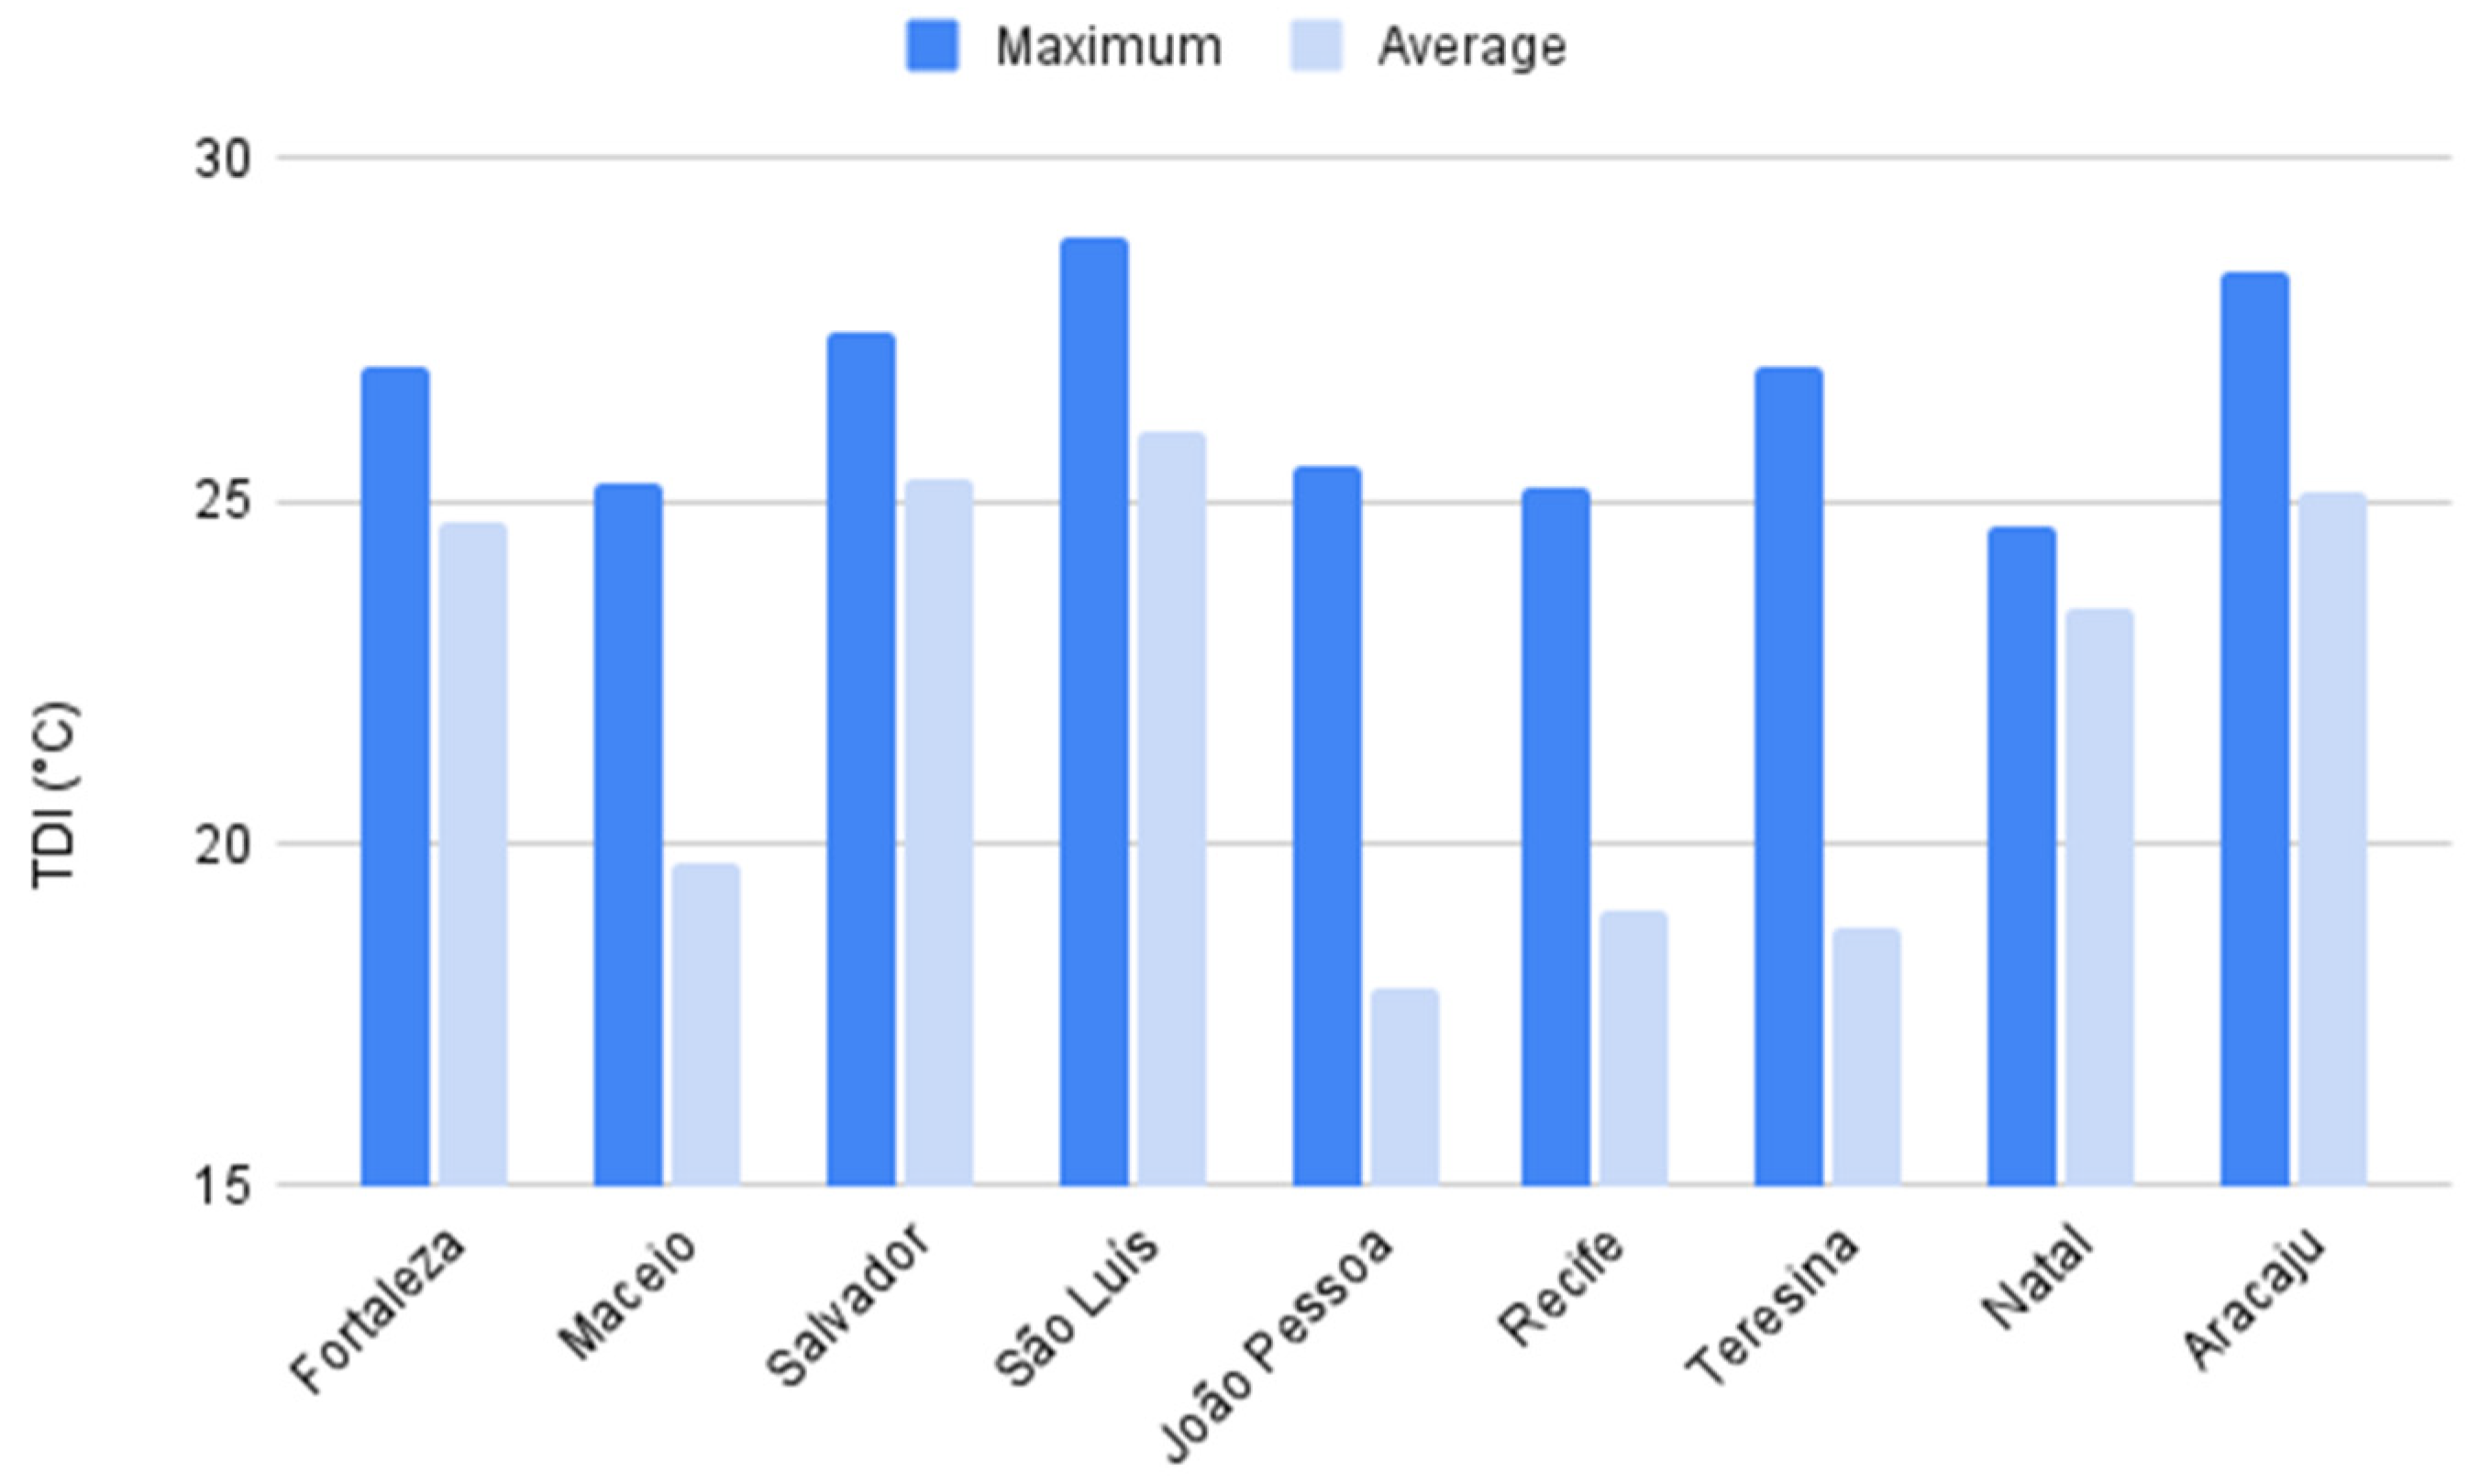
4.2.2. Thermal Discomfort Index

The maximum and average Thermal Discomfort Index (TDI) is presented in (Figure 9), indicating the influence of people’s perception of the temperature around them.
Regarding TDI, the hottest pixels in the urban areas of Fortaleza, Salvador, São Luís, João Pessoa, Teresina, and Aracaju were classified as very hot for thermal discomfort. The remaining capitals obtained a hot classification.
These values show that for the hottest areas in all the capitals, the thermal comfort levels are above 20 °C, which is considered above what is comfortable for the population, as shown in (Table 5). Furthermore, when the temperature exceeds 21 °C, less than 50% of the population feels discomfort [45]. Moreover, discomfort is understood as sensations of heat and cold and uncomfortable feelings of unease [46].
The average TDI for the urban area’s average pixels showed the classification very hot was only for São Luís. In contrast, the classification hot was found for Salvador, Aracaju, Fortaleza, and Natal, and the classification comfortable was found for Maceió, Recife, Teresina, and João Pessoa.
These results demonstrate that the average pixels in the urban areas of most capitals, five, present thermal comfort above 20 °C, beyond what is comfortable for the population and representing the maximum thermal discomfort.

5. Conclusions/Concluding Remarks

Obtaining land surface temperature from remote sensing enables us to estimate the SUHI phenomena and its influence in adjacent areas. However, it is essential to carefully select the urban surroundings to detect and assess temperature differences accurately. Taking this into account, we calculate the SUHI effects for Fortaleza, Maceió, Salvador, São Luís, João Pessoa, Recife, Teresina, Natal, and Aracaju capitals in the northeastern region of Brazil.
In this study, national data from IBGE were used to obtain the urban area and estimate its surroundings, such as the urban adjacent (Ua), the future urban adjacent (FUa), and the peri-urban (PUa), based on calculations that depend solely on the original urban area. The maximum and average SUHI values were calculated for each reference area in the urban zone. For Natal, the maximum and average SUHI values were found to be similar to 68 other cities around the world. At the same time, the SUHI values for Maceió, Salvador, and São Luís were also similar to Natal’s. Notably, the maximum and average SUHI values were very close in Teresina.
Based on the remote sensing data, most capital cities showed higher SUHI values than their surroundings. This inference considers factors such as the lack of vegetated areas, water bodies covered or surrounded by the urban environment, exposed soil, and materials that retain a lot of heat and energy from the sun. These factors contribute to the increase in urban areas and their surroundings, which are observed in the study areas, elucidating, for example, the percentage of coverage for the farthest zone from Natal, with 40% of vegetation cover. In contrast, areas closer to the city have less vegetation cover.
The Urban Thermal Field Variation Index (UTFVI) and the Thermal Discomfort Index (TDI) provide insights into each study area. The UTFVI reveals that the capital cities show very poor ecological indexes for the hottest regions of the urban areas. Moreover, the Thermal Discomfort Index indicates that the population generally experiences thermally uncomfortable conditions.
This study contributes to SDG 11 achievement, which aims to make cities and human settlements inclusive, safe, resilient, and sustainable. The methodology used in this study can also aid urban managers in making informed decisions to better manage the urban environment, especially in northeastern Brazilian capitals with varying areas, populations, demographic density, and semiarid climates. Furthermore, this study could be replicated in other cities worldwide using global remote sensing data. However, obtaining local meteorological data can be challenging in some cities.

Author Contributions

Conceptualization, R.F. and A.F.; methodology, R.F. and A.F.; software, R.F.; validation, A.F., V.N. and M.F.; formal analysis, R.F.; investigation, R.F., A.F. and V.N.; resources, R.F.; data curation, R.F.; writing—original draft preparation, R.F.; writing—review and editing, A.F. and V.N.; visualization, R.F.; supervision, A.F. and V.N.; project administration, R.F.; funding acquisition, M.F. and J.O. All authors have read and agreed to the published version of the manuscript.

Funding

This research was funded by Coordenação de Aperfeiçoamento de Pessoal Nível Superior (CAPES), R.F. scholarship number (88887.645454/2021-00).

Institutional Review Board Statement

Not applicable.

Informed Consent Statement

Not applicable.

Data Availability Statement

The data presented in this study are available on request from the corresponding author.

Acknowledgments

The authors thank the Federal University of Ceará (UFC), the Federal University of Rio Grande do Sul (UFRGS), and the Federal University of ABC (UFABC) for the support provided during this research.

Conflicts of Interest

The authors declare no conflicts of interest.

Appendix A

Below are the percentages of MapBiomas level 1 (Table A1) for each adjacent region of the analyzed cities.
Table A1. Percentage of MapBiomas classes for the surrounding areas of each city.
SalvadorMaceioFortalezaClasses
PUaFUaUaPUaFUaUaPUaFUaUa
522113313031634734Forest
060101010201010101Non-Forest
234123566056221307Farming
081015070707103656Urban
112748050105040302Water
100100100100100100100100100Total
RecifeJoão PessoaSão LuísClasses
PUaFUaUaPUaFUaUaPUaFUaUa
323333191729626951Forest
00000030202100505Non-Forest
574025756940201007Farming
092541021023020724Urban
020201010206060913Water
100100100100100100100100100Total
AracajuNatalTeresinaClasses
PUaFUaUaPUaFUaUaPUaFUaUa
172520403635838992Forest
060505120913060402Non-Forest
695133382818090504Farming
040821082426010201Urban
041121020308010001Water
100100100100100100100100100Total

Appendix B

A summary of the main results obtained for the capital cities assessed in this study is presented in Table A2. The average urban area LST is presented in Celsius. In addition, the Ua, FUa, and PUa values for each city’s maximum and average UTFVI are highlighted. The indexes are represented by their maximum values, and finally, the date is the day of the image obtained by the Sentinel-3 satellite.
Table A2. Summary table with the main results for all northeastern Brazilian capitals.
DateTDIUFTVISUHI
PUa
SUHI
FUa
SUHI
Ua
LSTCity
AveMaxAveMaxAveMaxAveMax
14 November 2024.7126.990.011.352.310.673.570.133.128.39Fortaleza
25 February 2019.7225.240.022.288.251.867.830.826.7921.13Maceió
28 February 2025.3427.50.011.253.770.553.070.142.6628.18Salvador
29 December 2026.0528.890.011.064−0.232.71−0.462.4827.71São Luís
28 January 2017.925.520.03−4.924.28−4.654.55−4.055.1519.62João Pessoa
28 January 2019.0525.230.03−0.267.051.85.51−2.035.2820.89Recife
27 November 1918.7926.940.04−3.657.14−3.367.43−3.47.3921.26Teresina
25 February 2023.4124.610.011.152.940.542.330.061.8525.82Natal
28 February 2025.1628.370.020.464.610.774.922.56.6529.25Aracaju

References

  1. Oliveira, A.; Lopes Oliveira, A.; Lopes, A.; Niza, S.; Soares, A. An Urban Energy Balance-Guided Machine Learning Approach for Synthetic Nocturnal Surface Urban Heat Island Prediction: A Heatwave Event in Naples. Sci. Total Environ. 2022, 805, 150130. [Google Scholar] [CrossRef] [PubMed]
  2. Bechtel, B.; Demuzere, M.; Mills, G.; Zhan, W.; Sismanidis, P.; Small, C.; Voogt, J. SUHI Analysis Using Local Climate Zones—A Comparison of 50 Cities. Urban Clim. 2019, 28, 100451. [Google Scholar] [CrossRef]
  3. Marin, F.; Assad, E.; Pilau, F. Clima e Ambiente, 1st ed.; Embrapa Informática Agropecuária: Campinas, Brazil, 2008; Volume 1, pp. 17–19. [Google Scholar]
  4. IPCC. IPCC Sixth Assessment Report. Available online: https://www.ipcc.ch/assessment-report/ar6/ (accessed on 15 March 2023).
  5. Yang, J.; Wang, Y.; Xiu, C.; Xiao, X.; Xia, J.; Jin, C. Optimizing Local Climate Zones to Mitigate Urban Heat Island Effect in Human Settlements. J. Clean. Prod. 2020, 275, 123767. [Google Scholar] [CrossRef]
  6. Franco, F.M.; Nogueira, M.C.; Rosseti, K.A.; Nogueira, J.S. Clima Urbano: Um Estudo de Caso para Clima Tropical Continental. CLIMEP 2010, 5, 81–99. [Google Scholar]
  7. Gartland, L. Ilhas de Calor: Como Mitigar Zonas de Calor em Áreas Urbanas, 1st ed.; Oficina de Textos: São Paulo, Brazil, 2011; Volume 1, p. 8. [Google Scholar]
  8. Del Serrone, G.; Peluso, P.; Moretti, L. Evaluation of Microclimate Benefits Due to Cool Pavements and Green Infraestrutures on Urban Heat Islands. Atmosphere 2022, 13, 1586. [Google Scholar] [CrossRef]
  9. Guimarães, J.T.F.; Sahoo, P.K.; e Souza-Filho, P.W.M.; da Silva, M.S.; Rodrigues, T.M.; da Silva, E.F.; Reis, L.S.; de Figueiredo, M.M.J.C.; Lopes, K.d.S.; Moraes, A.M.; et al. Landscape and Climate Changes in Southeastern Amazonia from Quaternary Records of Upland Lakes. Atmosphere 2023, 14, 621. [Google Scholar] [CrossRef]
  10. Budhiraja, B.; Gawuc, L.; Agrawal, G. Seasonality of Surface Urban Heat Island in Delhi City Region Measured by Local Climate Zones and Conventional Indicators. IEEE J. Sel. Top. Appl. Earth Obs. Remote Sens. 2019, 12, 5223–5232. [Google Scholar] [CrossRef]
  11. Quan, J. Multi-Temporal Effects of Urban Forms and Functions on Urban Heat Islands Based on Local Climate Zone Classification. Int. J. Environ. Res. Public Health 2019, 16, 2140. [Google Scholar] [CrossRef] [PubMed]
  12. Kanga, S.; Meraj, G.; Johnson, B.A.; Singh, S.J.; Pv, M.N.; Farooq, M.; Kumar, P.; Marazi, A.; Sahu, N. Understanding the Linkage between Urban Growth and Land Surface Temperature—A Case Study of Bangalore City, India. Remote Sens. 2022, 14, 4241. [Google Scholar] [CrossRef]
  13. Fernandes, R.; Nascimento, V.; Freitas, M.; Ometto, J. Local Climate Zones to Identify Surface Urban Heat Islands: A Systematic Review. Remote Sens. 2023, 15, 884. [Google Scholar] [CrossRef]
  14. Liu, L.; Zhang, Y. Urban Heat Island Analysis Using the Landsat TM Data and ASTER Data: A Case Study in Hong Kong. Remote Sens. 2011, 3, 1535–1552. [Google Scholar] [CrossRef]
  15. Trindade, P.; Michele, P.; Saldanha, D.L.; Filho, W.P. Utilização do infravermerlho termal na análise espaço temporal da temperatura de superfície e ilhas de calor urbanas. Rev. Bras. Cart. 2017, 69, 837–855. [Google Scholar]
  16. Santos, T.O.d. Identificação de Ilhas de Calor em Recife-PE por Meio de Sensoriamento Remote e Dados Meteorológicos de Superfície. Master’s Thesis, Universidade Federal de Pernambuco, Recife, Brazil, 2011. [Google Scholar]
  17. Shi, L.; Ling, F.; Foody, G.M.; Yang, Z.; Liu, X.; Du, Y. Seasonal SUHI Analysis Using Local Climate Zone Classification: A Case Study of Wuhan, China. Int. J. Environ. Res. Public Health 2021, 18, 7242. [Google Scholar] [CrossRef] [PubMed]
  18. Nassar, A.K.; Blackburn, G.A.; Whyatt, J.D. Dynamics and Controls of Urban Heat Sink and Island Phenomena in a Desert City: Development of a Local Climate Zone Scheme Using Remotely-Sensed Inputs. Int. J. Appl. Earth Obs. Geoinf. 2016, 51, 76–90. [Google Scholar] [CrossRef]
  19. Costanzini, S.; Despini, F.; Beltrami, L.; Fabbi, S.; Muscio, A.; Teggi, S. Identification of SUHI in Urban Areas by Remote Sensing Data and Mitigation Hypothesis through Solar Reflective Materials. Atmosphere 2021, 13, 70. [Google Scholar] [CrossRef]
  20. Chen, C.; Bagan, H.; Xie, X.; La, Y.; Yamagata, Y. Combination of Sentinel-2 and PALSAR-2 for Local Climate Zone Classification: A Case Study of Nanchang, China. Remote Sens. 2021, 13, 1902. [Google Scholar] [CrossRef]
  21. Chang, Y.; Xiao, J.; Li, X.; Middel, A.; Zhang, Y.; Gu, Z.; Wu, Y.; He, S. Exploring Diurnal Thermal Variations in Urban Local Climate Zones with ECOSTRESS Land Surface Temperature Data. Remote Sens. Environ. 2021, 263, 112544. [Google Scholar] [CrossRef]
  22. Li, X.; Stringer, L.C.; Dallimer, M. The Role of Blue Green Infrastructure in the Urban Thermal Environment across Seasons and Local Climate Zones in East Africa. Sustain. Cities Soc. 2022, 80, 103798. [Google Scholar] [CrossRef]
  23. Goal 11. Sustainable Cities and Communities. Available online: https://www.undp.org/sustainable-development-goals/sustainable-cities-and-communities (accessed on 15 March 2023).
  24. IBGE. Cidades e Estados. Available online: https://www.ibge.gov.br/ (accessed on 12 February 2023).
  25. Badaro-Saliba, N.; Adjizian-Gerard, J.; Zaarour, R.; Najjar, G. LCZ Scheme for Assessing Urban Heat Island Intensity in a Complex Urban Area (Beirut, Lebanon). Urban Clim. 2021, 37, 100846. [Google Scholar] [CrossRef]
  26. Sobrino, J.A.; Irakulis, I.A. Methodology for Comparing the Surface Urban Heat Island in Selected Urban Agglomerations Around the World from Sentinel-3 SLSTR Data. Remote Sens. 2020, 12, 2052. [Google Scholar] [CrossRef]
  27. ESA. Climate Change Initiative Land Cover. Available online: https://maps.elie.ucl.ac.be/CCI/viewer/ (accessed on 12 February 2023).
  28. Minn, M. MMQGIS. Available online: https://michaelminn.com/linux/mmqgis/ (accessed on 12 February 2023).
  29. Singh, P.; Kikon, N.; Verma, P. Impact of land use change and urbanization on urban heat island in Lucknow city, Central India. A remote sensing bases estimate. Sustain. Cities Soc. 2017, 32, 100–114. [Google Scholar] [CrossRef]
  30. García, D.H.; Díaz, J.A. Space–time analysis of the Earth’s surface temperature, surface urban heat island and urban hotspot: Relationships with variation of the thermal field in Andalusia (Spain). Urban Ecosyst. 2023, 26, 525–546. [Google Scholar] [CrossRef]
  31. Sharma, R.; Pradhan, L.; Kumari, M.; Bhattacharya, P. Assessing Urban Heat Islands and Thermal Comfort in Noida City Using Geospatial Technology. Urban Clim. 2021, 35, 100751. [Google Scholar] [CrossRef]
  32. Naim, M.; Huda, N.; Kafy, A. Assessment of Urban Thermal Field Variance Index and Defining the Relationship between Land Cover and Surface Temperature in Chattogram City: A Remote Sensing and Statistical Approach. Environ. Chall. 2021, 4, 100107. [Google Scholar] [CrossRef]
  33. Magagnin, R.C.; Silva, A.N.; Souza, L.; Ramos, R. PLURIS 2021-9° Congresso Luso-Brasileiro Para o Planejamento Urbano, Regional, Integrado e Sustentável-Pequenas Cidades, Grandes Desafios, Múltiplas Oportunidades Pluris 2021; Universidade Estadual Paulista “Júlio de Mesquita Filho”: São Paulo, Brazil, 2021. [Google Scholar]
  34. Giles, B.D.; Balafoutis, C.; Maheras, P. Too Hot for Comfort: The Heatwaves in Greece in 1987 and 1988. Int. J. Biometeorol. 1990, 34, 98–104. [Google Scholar] [CrossRef] [PubMed]
  35. Thom, E.C. The Discomfort Index. Weatherwise 1959, 12, 57–61. [Google Scholar] [CrossRef]
  36. Sobrino, J.A.; Julien, Y.; García-Monteiro, S. Surface Temperature of the Planet Earth from Satellite Data. Remote Sens. 2020, 12, 218. [Google Scholar] [CrossRef]
  37. Kafy, A.; Khan, M.H.H.; Islam, A.; Sarker, H.S. Prediction of Future Land Surface Temperature and Its Impact on Climate Change: A Remote Sensing Based Approach In Chattogram City. In Proceedings of the 1st International Student Research Conference–2020, Dhaka, Bangladesh, 1 April 2020. [Google Scholar]
  38. Dewan, A.; Kiselev, G.; Botje, D. Diurnal and Seasonal Trends and Associated Determinants of Surface Urban Heat Islands in Large Bangladesh Cities. Appl. Geogr. 2021, 135, 102533. [Google Scholar] [CrossRef]
  39. Dimitrov, S.; Popov, A.; Iliev, M. An Application of the LCZ Approach in Surface Urban Heat Island Mapping in Sofia, Bulgaria. Atmosphere 2021, 12, 1370. [Google Scholar] [CrossRef]
  40. Hu, J.; Yang, Y.; Pan, X.; Zhu, Q.; Zhan, W.; Wang, Y.; Ma, W.; Su, W. Analysis of the Spatial and Temporal Variations of Land Surface Temperature Based on Local Climate Zones: A Case Study in Nanjing, China. IEEE J. Sel. Top. Appl. Earth Obs. Remote Sens. 2019, 12, 4213–4223. [Google Scholar] [CrossRef]
  41. Cai, Z.; Tang, Y.; Zhan, Q. A Cooled City? Comparing Human Activity Changes on the Impact of Urban Thermal Environment before and after City-Wide Lockdown. Build. Environ. 2021, 195, 107729. [Google Scholar] [CrossRef] [PubMed]
  42. Purio, M.A.; Yoshitake, T.; Cho, M. Assessment of Intra-Urban Heat Island in a Densely Populated City Using Remote Sensing: A Case Study for Manila City. Remote Sens. 2022, 14, 5573. [Google Scholar] [CrossRef]
  43. MAPBIOMAS. Coleções Mapbiomas. Available online: https://mapbiomas.org/colecoes-mapbiomas-1?cama_set_language=pt-BR (accessed on 28 February 2023).
  44. SUDEMA. Jardim Botânico Benjamin Maranhão. Available online: https://sudema.pb.gov.br/servicos/servicos-ao-publico/jardim-botanico (accessed on 15 February 2023).
  45. Siami, L.; Ramadhani, A. Climatology of Discomfort Index for Decade in Bandar Lampung, Indonesia. KnE Soc. Sci. 2019, 3, 460–469. [Google Scholar] [CrossRef]
  46. Md Din, M.F.; Lee, Y.Y.; Ponraj, M.; Ossen, D.R.; Iwao, K.; Chelliapan, S. Thermal Comfort of Various Building Layouts with a Proposed Discomfort Index Range for Tropical Climate. J. Therm. Biol. 2014, 41, 6–15. [Google Scholar] [CrossRef] [PubMed]
Figure 1. Study area highlighting the nine capital cities of the Brazilian northeast region.
Sustainability 16 04764 g001
Figure 2. Flowchart of the methodology.
Sustainability 16 04764 g002
Figure 3. Urban and surroundings areas WUa, WFUa, and WPUa, respectively, for all the northeastern Brazilian capitals: (A) Fortaleza, (B) Maceió, (C) Salvador, (D) São Luís, (E) João Pessoa, (F) Recife, (G) Teresina, (H) Natal, and (I) Aracaju.
Sustainability 16 04764 g003
Figure 4. Maximum SUHI for Ua, FUa, and PUa.
Sustainability 16 04764 g004
Figure 5. Average SUHI for Ua, FUa, and PUa.
Sustainability 16 04764 g005
Figure 6. LULC for all the northeastern Brazilian capitals. (A) Fortaleza, (B) Maceió, (C) Salvador, (D) São Luís, (E) João Pessoa, (F) Recife, (G) Teresina, (H) Natal, and (I) Aracaju.
Sustainability 16 04764 g006
Figure 7. LST (Kelvin) of the northeastern Brazilian capitals and their surrounding areas. (A) Fortaleza, (B) Maceió, (C) Salvador, (D) São Luís, (E) João Pessoa, (F) Recife, (G) Teresina, (H) Natal, and (I) Aracaju.
Sustainability 16 04764 g007
Figure 8. UTFVI values for the northeastern Brazilian capitals.
Sustainability 16 04764 g008
Figure 9. Maximum and average TDI values for the northeastern Brazilian capitals.
Sustainability 16 04764 g009
Table 1. Brazilian northeast capitals and metropolitan region characteristics.
CapitalsArea (km2)Estimated PopulationDemographic
Density
(hab/km2)
Metropolitan Region
(Cities)
Metropolitan Estimated Population
Fortaleza-CE312.3532686.6128601.204133903.945
Maceió-AL509.3201025.3602013.194131194.596
Salvador-BA693.4532886.6984162.788133573.973
São Luís-MA583.0631108.9751901.981131458.836
João Pessoa-PB210.044817,5113892.094121304.266
Recife-PE218.8431653.4617555.467143690.000
Teresina-PI1391.293868.075623.934151249.000
Natal-RN167.401890.4805319.443151647.414
Aracaju-SE182.163664.9083650.0724961.120
Table 2. Day and time of Sentinel-3 image acquisition for the northeastern state capitals.
Hour (GMT)DataCapital(Lat/Lon)
00:2114 November 2020Fortaleza-CE−3.815701/−38.537792
23:0025 February 2020Maceió-AL−9.551111/−35.770277
23:2228 February 2020Salvador-BA−13.005515/−38.50576
00:5529 December 2020São Luís-MA−2.526666/−44.213611
23:2628 January 2020João Pessoa-PB−7.165409/−34.815627
23:2628 January 2020Recife-PE−8.05928/−34.959239
23:3327 November 2019Teresina-PI−5.034722/−42.801388
23:0025 February 2020Natal-RN−5.837222/−35.208055
23:2228 February 2020Aracaju-SE−10.952413/−37.05433
Table 3. Adjacent urban areas for all the northeastern Brazilian capitals in km2.
CapitalWPUaWFUaWUaTotal
Fortaleza-CE21338033623298
Maceió-AL35369945575087
Salvador-BA481914388207077
São Luís-MA428914407116440
João Pessoa-PB14894302482167
Recife-PE15154412602216
Teresina-PI10,9573772207616,805
Natal-RN11953391961730
Aracaju-SE13454132261984
Table 4. Threshold values of UTFVI and ecological evaluation index.
Ecological Evaluation IndexSUHI PhenomenonUTFVI
ExcellentNone<0
GoodWeak0–0.005
NormalMeddle0.005–0.010
BadStrong0.010–0.015
WorseStronger0.015–0.020
WorstStrongest>0.020
Table 5. TDI classification values.
Temperature (°C)TDI Categories
<−40Hyper Glacial
−39.9–−20Glacial
−19.9–−10Extremely cold
−9.9–−1.8Very Cold
−1.7–12.9Cold
13–14.9Cold
15–19.9Comfortable
20–26.4Hot
26.4–29.9Very Hot
>30Torrid
Disclaimer/Publisher’s Note: The statements, opinions and data contained in all publications are solely those of the individual author(s) and contributor(s) and not of MDPI and/or the editor(s). MDPI and/or the editor(s) disclaim responsibility for any injury to people or property resulting from any ideas, methods, instructions or products referred to in the content.

