Article

Sustainability Assessment of Urban Public Transport for SDG Using Geospatial Big Data

1
School of Geography and Tourism, Xinjiang Normal University, Urumqi 830054, China
2
Key Laboratory of Digital Earth Science, Aerospace Information Research Institute, Chinese Academy of Sciences, Beijing 100094, China
3
International Research Center of Big Data for Sustainable Development Goals, Beijing 100094, China
*
Author to whom correspondence should be addressed.
Sustainability 2024, 16(11), 4542; https://doi.org/10.3390/su16114542
Submission received: 16 April 2024 / Revised: 21 May 2024 / Accepted: 22 May 2024 / Published: 27 May 2024

Abstract

:
Rapid urbanization has resulted in various challenges, including a decline in environmental quality, traffic congestion, housing tensions, and employment difficulties. To address these issues, the United Nations introduced the “2030 Agenda for Sustainable Development”. One of the specific targets, 11.2.1, aims to tackle transportation problems. This study focuses on Guilin City, which is designated as an innovation demonstration zone for the national sustainable development agenda. The research conducted in this study examines the state of public transportation in six urban areas of Guilin City from 2015 to 2021, utilizing the United Nations Sustainable Development Goals (SDGs) indicator system, evaluation method, geospatial analysis, and entropy value method. The findings reveal that the coverage area of public transportation in the six urban areas of Guilin City expanded from 147.98 km2 in 2015 to 259.18 km2 in 2021. The percentage of the population with access to public transportation increased from 69.06% in 2015 to 71.63% in 2018 and further to 75.60% in 2021. While the accessibility of public transportation in the other four districts exceeds 90%, Lingui District and Yanshan District have lower accessibility, but it is gradually improving. The center of gravity for public transportation is also shifting towards the southwest, with Lingui District and Yanshan District experiencing gradual development. The evaluation score for sustainable development increased from 64.30 to 74.48, indicating a transition from a low sustainable development level to medium sustainable development level. Significant progress has been made in the indicators of the share of new energy buses, the rate of bus sharing, the coverage rate of bus stops, and the number of public transportation vehicles per 10,000 people. However, the indicators for the average distance between bus stops, the average speed of public transportation, and the density of public transportation routes are growing at a slower pace. The development of urban public transportation continues to improve, and the overall trend is positive. The sustainable development evaluation framework and positioning method proposed in this study serve as a reference for the sustainable development of Guilin City. Additionally, it provides insights for evaluating the sustainable development goals of public transportation in tourist cities like Guilin in China and worldwide.

1. Introduction

In 2015, the United Nations introduced the 2030 Sustainable Development agenda with the objective of providing guidance to the global community in the implementation of sustainable development. This agenda established 17 Sustainable Development Goals (SDGs) with the purpose of facilitating a scientific comprehension and precise evaluation of the sustainable development of cities worldwide in order to direct practical initiatives. The SDGs strive to offer a comprehensive collection of targets and indicators to gauge advancements in sustainable development [1,2]. The Sustainable Development Goals (SDGs) offer a comprehensive framework for attaining sustainable development on a global scale. Numerous studies have emphasized the significance of implementing the SDGs [3,4]. Tosun J et al. stated that the implementation of SDGs is crucial to address the enormous challenges faced globally and proposed a six-dimensional framework to evaluate the progress of SDGs [5]. Furthermore, Chidozie F et al. examined the threats and opportunities of SDGs and highlighted the importance of international collaboration and global governance [6]. Although SDGs provide a global consensus, there are several challenges in their implementation. Stafford-Smith M proposed strengthening the interdependence and interconnectedness of the objectives and the need to pay greater attention to the interconnection of the three areas [7]. In addition, Horn P et al. studied the implementation of SDGs in Ecuador and found that many countries differ in achieving SDGs and need more domestic policy support [8]. Rasoolimanesh S M studied the contribution of tourism to SDGs and found that tourism could make a positive contribution to the realization of SDGs [9]. Although the importance and development status of SDGs are widely recognized, many challenges remain in realizing SDGs. Collste D suggested that continuous monitoring and evaluation of performance in achieving the SDGs at all levels, including regional, national, and local, over time can particularly help countries identify important issues of their own sustainability progress and the gaps between countries so that countries can better take targeted policy actions to achieve these ambitious SDGs [10]. In addition, Kastrinos N studied the implementation of SDGs in the EU and found great policy challenges and complexity in the implementation process [11]. Su Y proposed the development mode of urban communication networks in less developed areas. Taking the data of highway, railway, and aviation passenger traffic in the Inner Mongolia Autonomous Region in 2021 as the sample, the complex network analysis method is used to analyze the structure of the traffic flow network and refine the spatial development mode [12].
There is a close relationship between public transportation and sustainable development. The construction and promotion of public transportation systems can effectively reduce urban traffic congestion, tailpipe emissions, energy consumption, and environmental pollution. This contributes to the reduction of carbon emissions and plays a positive role in environmental protection and climate change mitigation. Public transportation is more environmentally friendly than private cars because of its multiple advantages, such as higher energy efficiency, lower tailpipe emissions, and reduced occupation of road resources. Public transportation is also more inclusive, cleaner, and more affordable, making it highly beneficial. Therefore, promoting the construction of public transportation, strengthening its operation and management, and upgrading its service level are some of the most important measures to achieve sustainable development in Guilin. At the same time, the government, enterprises, and society should work together to promote the development of intelligent, green, and informatized public transportation. This will help achieve a more environmentally friendly, efficient, and convenient urban transportation system and make positive contributions to the sustainable development of Guilin City [13,14].
SDG11.2.1 (the proportion of people who can use public transport) in the sub-index of Sustainable Development Goal 11 (sustainable cities and communities) is related to public transport, which is closely related to people’s production and life and is an important carrier of public activity space. Its planning and layout are an important part of urban transportation system planning and construction [15].
This study takes the six districts in the core area of Guilin as the research area. The population proportion with convenient use of public transport, the entropy method, and sustainability indicators are used to analyze the spatial change and sustainability of public transport in 2015, 2018, and 2021 with geospatial and statistical data.

2. Literature Review
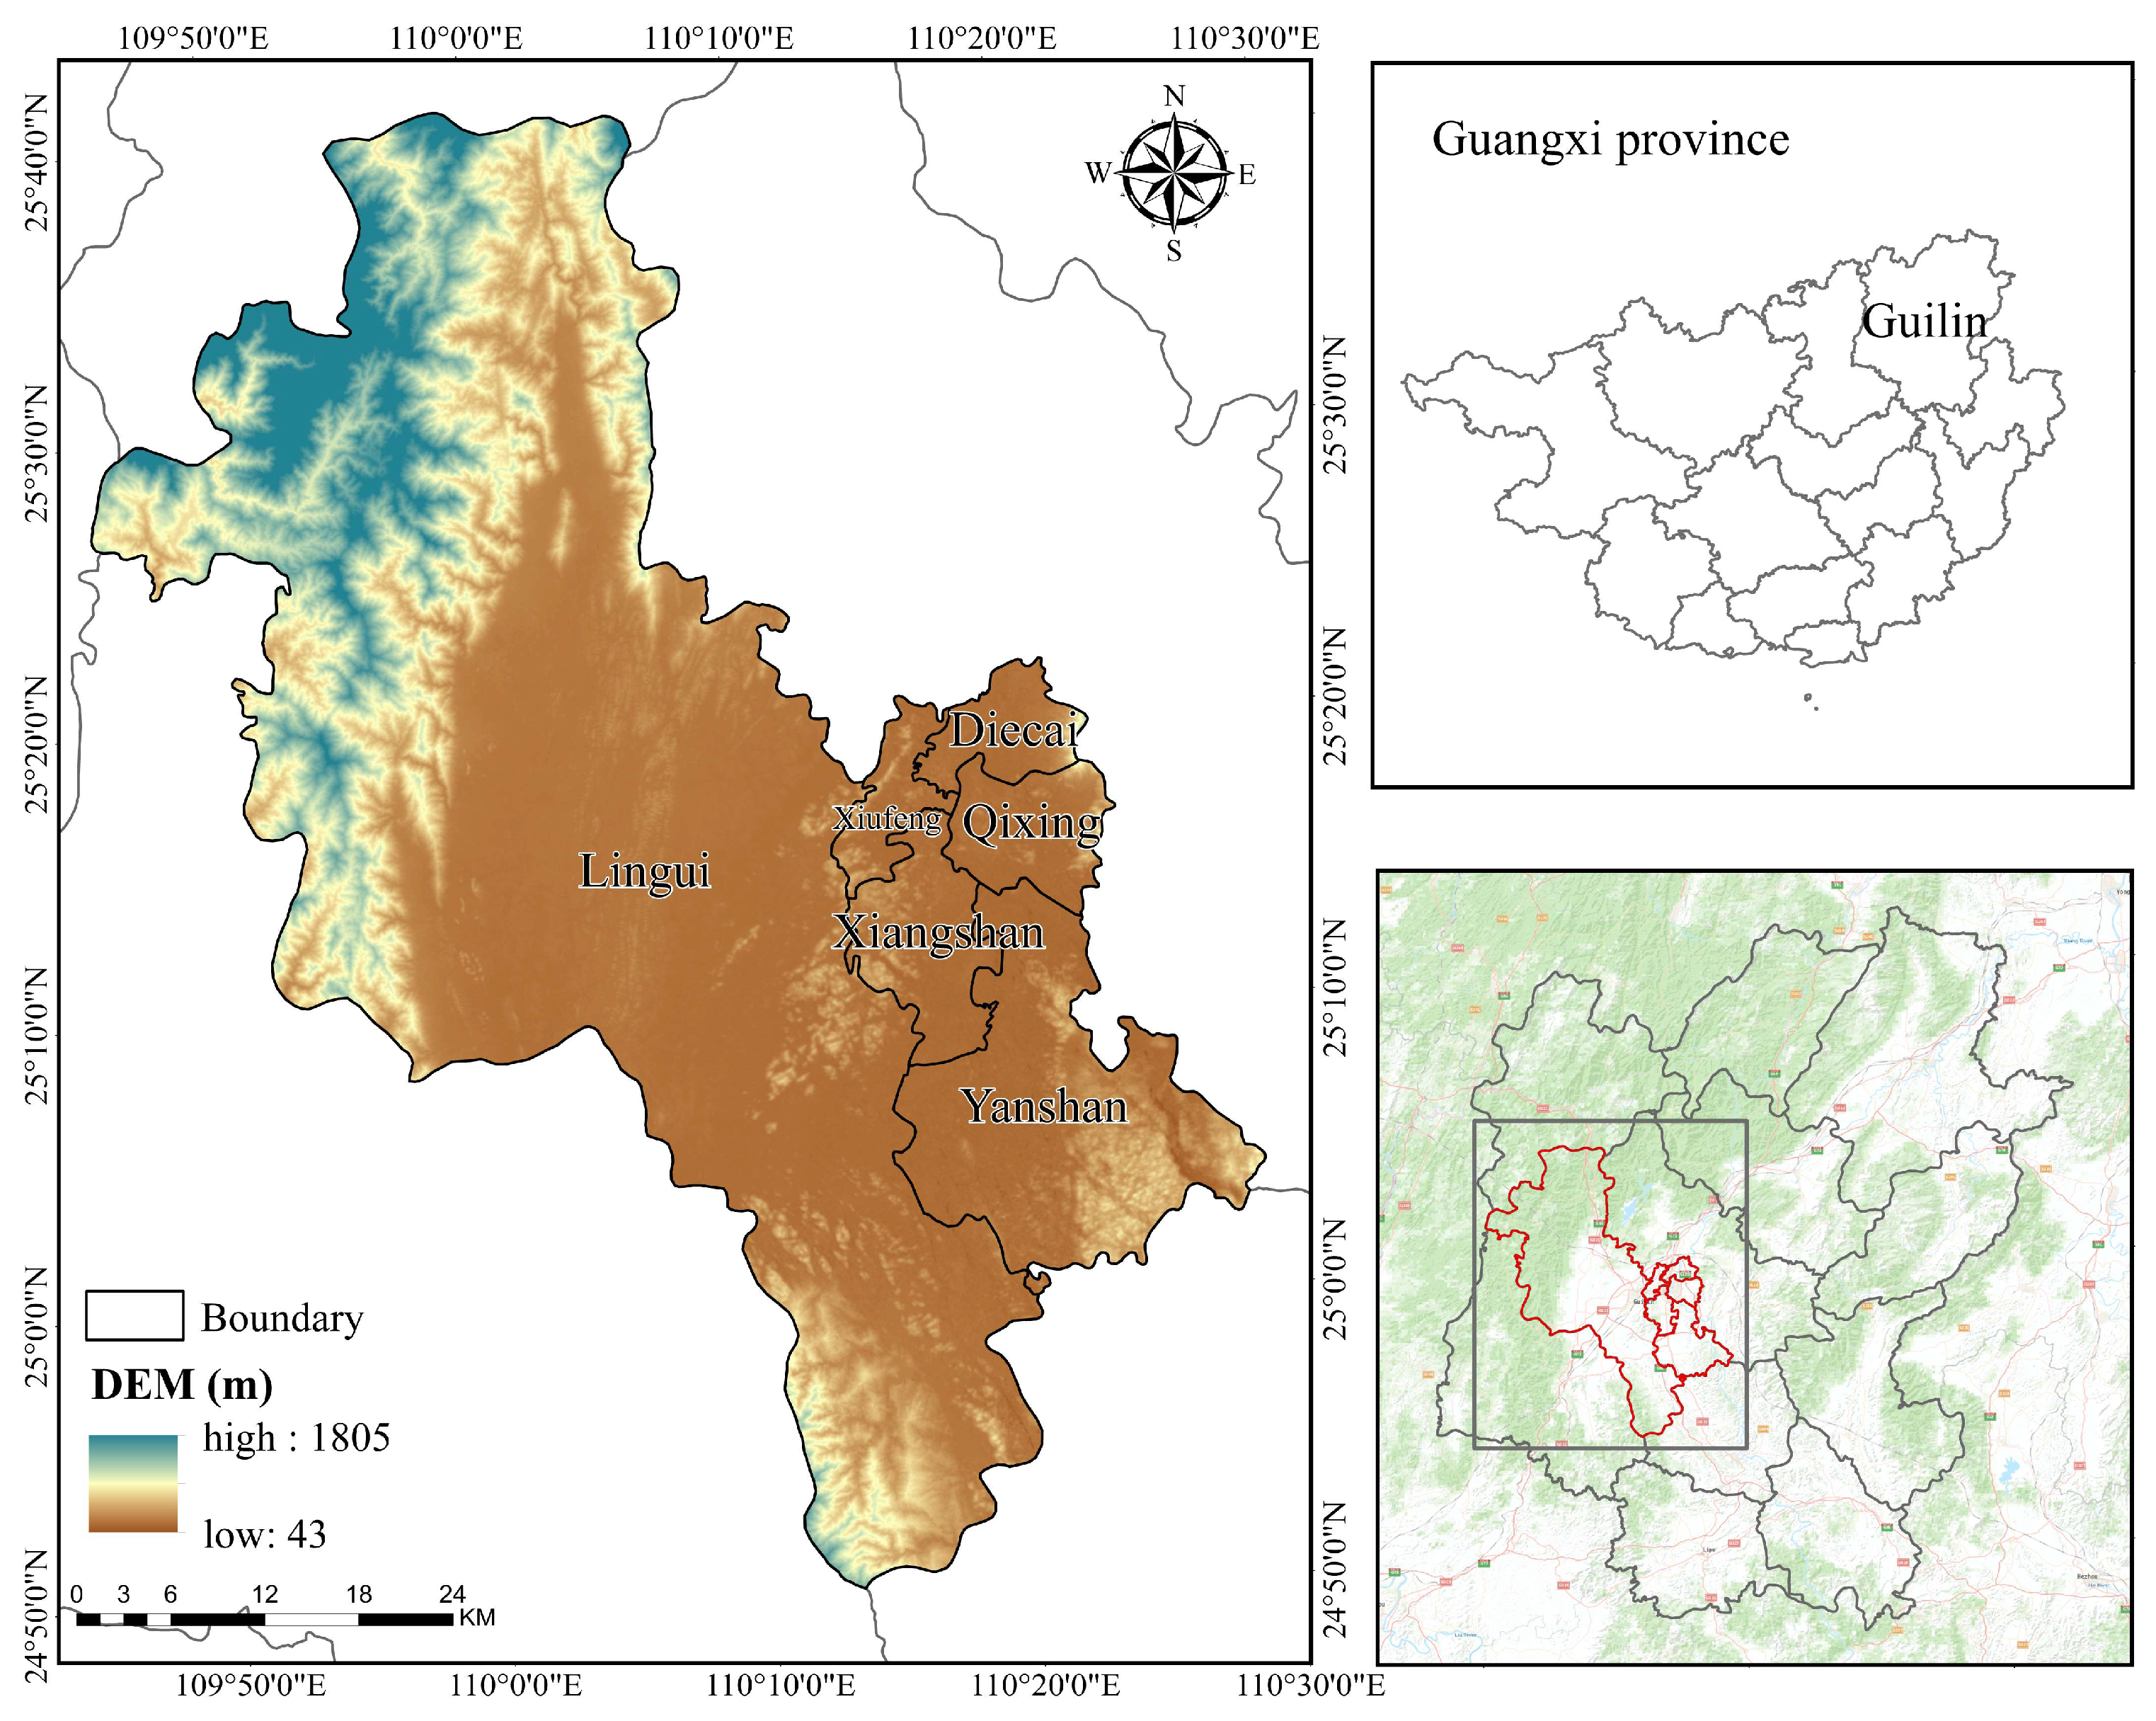
In response to the United Nations Sustainable Development Goals, scholars and research institutions both domestically and internationally have utilized the SDG index framework to conduct comprehensive study and discussion on the sustainable development index system and methods across various scales and dimensions. The purpose of this endeavor is to systematically and scientifically assess the progress of the SDGs [16]. The European Commission builds a set of sustainable development evaluation indicators based on the 17 SDGs, each containing six indicators to measure the social, economic, environmental, and institutional progress of sustainable development. At the national and regional scale, some scholars adopt the correlation with the Sustainable Development Goals, global sustainable development indicators, the Millennium Development Goals, the past two years of time series data, and data quality and reliability of four criteria selected from 93 initial indicators, combined with the regional truth and expert opinion for 22 countries in the Arab region and developed a set of 56 indicators of a coordinated sustainable development evaluation system [17,18].
There is a growing body of research on the integrated assessment of the development process of SDGs. Pradhan and Luis Miguel Fonseca pointed out the existence of synergies and trade-offs among SDGs, with SDG1 and SDG3 having synergistic relationships with most of the goals [19,20]. McArthur categorized all the SDGs, emphasized the goal of “no one left behind”, and explored empirical studies in Canada [21]. Wang Tao evaluated the development of urban SDGs in terms of economic, social, and resource–environmental dimensions [22]. Collste assessed sustainable development in Tanzania in terms of health, education, and energy [10]. Fried et al. [23] leveraged open data, including OpenStreetMap road network and World-Pop population data to derive the values of SDG11.2.1 indicator and accessibility metrics and identified transport inequalities of low-income communities. Allen evaluated the indicators underlying the Arab Sustainable Development Report (ASDR) at the United Nations, confirming that robust indicator frameworks can be transformed into management tools that can help countries to formulate strategies, allocate resources, and monitor progress [24]. Xu et al. [25] analyzed the spatial and temporal distribution characteristics of SDGs in China’s provincial-level administrative regions, comparing the differences in the progress of targets and indicators in different regions. Guo et al. [26] explored the United Nations Sustainable Development Solutions Network, which constructed a set of national indicator systems based on a global indicator framework. Ishtiaque et al. [27] conducted a comprehensive study of forests, wetlands, erosion, and landslides in Bangladesh and conducted a comprehensive assessment of SDG15. Bowen Kathryn J suggested that the framework for achieving SDGs be categorized into three key areas of surveillance, assessment, and review and to refine the global financial flows and make research recommendations [28]. Gao et al. [29] proposed an SDG-oriented evaluation index system for “Beautiful China”, covering four dimensions and 43 indicators. Cao et al. [30] combined the current situation of the Yangtze River Delta region and constructed a regional sustainable development indicator system from the four dimensions of economy, society, environment, and resources.
Evaluation methodology: Over the past two decades, scholars have constructed sustainable development evaluation models using a variety of methods, such as data envelopment analysis (DEA) and the ecological footprint method, to assess the level of regional sustainable development [31]. Since the implementation of the UN 2030 Agenda for Sustainable Development, an indicator system based on the composite index method is usually adopted, combined with a comprehensive analysis of data from multiple sources to ensure the objectivity and accuracy of the assessment results. Different indicator assignment methods will produce different evaluation results, and scientific and reasonable weights must be set, including the equal weight method, entropy weight method, and so on. Some scholars used the entropy weighting method to weight the indicators and evaluated the sustainable development index and target progress of the Yangtze River Economic Zone and Lincang City [32,33]. Other scholars used the relative entropy-based combined allocation method, combined with the entropy weighting method and the coefficient of variation method, to calculate the weights and evaluated the sustainable development level of urbanization in some tourist cities and Gansu Province [34,35]. There are also studies that use remote sensing data and network big data and other multi-source data to establish an open urban sustainability evaluation index system framework or a linear weight judgment method of indicators based on the coefficient of the variation-entropy weight method to assess the sustainable development level and tourism competitiveness index [36]. There are also scholars who use remote sensing technical means to model and analyze the accessibility of urban green space or construct an integrated social–ecological system assessment model framework to analyze the interaction among SDGs [37,38,39]. In addition, there are also studies that have developed a sustainable development model of coastal areas [40,41].
Studies on the development of public transportation encompass various aspects such as environmental impacts, economic benefits, social equity, policy considerations, and integration with urban planning in order to achieve sustainable urban development. Wilfried Puwein suggested implementing price regulations, such as congestion taxes and higher road tolls, to reduce tailpipe emissions, alleviate environmental pressures, and address traffic congestion [42]. Anis Purwaningsih conducted research on global transportation and environmental policy instruments, including public transportation subsidies, fuel levies, congestion taxes, and energy efficiency improvements, and evaluated their effectiveness and challenges [43]. M. Hatzopoulou and E.J. Miller highlighted the inadequacy of traditional transportation planning in meeting modern needs and emphasized the importance of evaluating the effectiveness of sustainable transportation policies to meet current demands [44]. Todd Goldman explains the concept and methods of implementing sustainable transportation and advocates for the application of transportation innovations to achieve sustainable objectives [45]. Nidziy argues that increased investment in transportation infrastructure stimulates economic growth, creates employment opportunities, reduces transportation costs, and enhances quality of life [46]. Chen et al. [47] provide an overview of research progress in traffic monitoring and behavioral recognition, including vehicle detection, tracking, and behavior recognition, as well as the utilization of deep learning in traffic semantic understanding. Sun et al. [48] view the bus route trajectory as a sub-map of the city and propose a routing algorithm based on bus trajectory (BTSC). Yang et al. [49] propose a traffic propagation prediction graph convolution network (TPP-GCN) model based on multi-graph learning for predicting the traffic flow in the urban road network and validate the effectiveness of the model using Shenzhen cab GPS data.
In summary, while research related to SDGs has achieved certain results, it also faces numerous problems and challenges. These include the need for a unified understanding of the concept and clear boundaries of SDGs, the improvement of research models related to SDGs, and the development of localized indicator systems for different research objectives. Current studies primarily focus on evaluating the level of sustainable development of cities at a global or national scale, with limited research conducted at the city and county level and even fewer studies on individual indicators. Most studies rely on a single data source, primarily statistical information. Therefore, this paper combines spatial data and statistical data to assess the sustainability of public transportation in the six urban areas of Guilin. By visualizing changes from point to point, it highlights the variations in the development of public transportation in the region. This analysis can aid in the formulation of targeted public transportation development plans, enhance the overall level of sustainable development in the region, and raise awareness of China’s evaluation of public transportation within the framework of the 2030 Agenda for Sustainable Development. Ultimately, this research aims to contribute to the construction of an indicator system based on SDGs by providing a valuable case study.

3. Study Area

Guilin City (Figure 1) is located in the northeastern part of Guangxi Zhuang Autonomous Region, China. It is situated at the southern end of the Hunan–Guangxi Corridor, in the southwest of the Nanling Mountain system, and at the northern end of the Guilin–Yangshuo Karst Basin, along the “Xiang-Guangxi Road”. Its geographical coordinates are 109°36′–111°29′ E, 24°15′–26°23′ N. The city is 236 km long from north to south and 189 km wide from east to west. The urban area of Guilin city includes Xiufeng District, Qixing District, Xiangshan District, Diecai District, Yanshan District, and Lingui District, collectively known as the “Six Urban Areas”. It has a sub-tropical monsoon climate, with an annual average precipitation of 1887.6 mm and an annual average temperature of 18.9 °C. The city covers an area of 27,800 square kilometers. Guilin was selected as a National Sustainable Development Agenda Innovation Demonstration Zone in China in 2018 under the theme of “sustainable use of landscape resources” [50].
Guilin has a unique natural environment and a special geographic structure, which is a representative area of China’s karst landscape. Its unique geographic structure determines its unique natural and humanistic environment. Guilin mainly relies on tourism as its only economic structure, and the development of this city lacks the impetus of high-tech industries. In order to establish the development positioning of Guilin as “a city, a capital, a place, and a center”, 31 supportive policies and initiatives have been introduced. These clearly put forward that Guilin should take the lead and be the vanguard in the construction of a world tourist destination in Guangxi. It is planned to make breakthrough progress in the construction of Guilin’s world-class tourist city by 2025. Moreover, in 2018, Guilin has taken the following measures with the theme of “sustainable utilization of landscape resources”. Guilin was selected as China’s National Sustainable Development Agenda Innovation Demonstration Zone, in China’s first batch of innovation demonstration zones. Guilin will provide a decision-making basis and case references for China’s sustainable development agenda. However, the study of combining the SDGs with localized indicators to conduct a comprehensive assessment of Guilin’s sustainable development still needs to be further improved. Therefore, this study takes the six urban districts of Guilin as the study area and uses Sustainable Development Indicator (SDI) 11.2.1 as the core to conduct an evaluation study on the sustainable development indicators of Guilin’s public transportation. Guilin is known for having the best mountains and water in the world [51,52].
Public transportation in Guilin primarily consists of buses, taxis, and special tourist lines. The public transportation system in Guilin is fairly comprehensive, with multiple bus lines covering the main areas of the city, offering convenience for both residents and tourists. Additionally, Guilin also provides special tourist lines that facilitate transportation for visitors to famous attractions. Taxis are also a popular mode of transportation for both residents and tourists, with a plentiful supply in Guilin, enhancing convenience. Overall, Guilin’s urban public transportation infrastructure is well developed, offering diverse travel options for both citizens and tourists. As of 2021, the road network density in Guilin’s municipal jurisdiction was 8.1 km/km2 and the per capita road area was 20.8 m2/person, with 113,980,300 passengers/year and 473 traffic accidents resulting in 534 injuries/year.

4. Materials and Methods

4.1. Datasets

The spatial data required for the study were obtained from the Center for Resource and Environmental Science and Data of the Chinese Academy of Sciences (http://www.resdc.cn/data.aspx, accessed on 30 June 2023) for the vector map of administrative districts and DEM data; POI (public transportation stops) data were obtained from Gaode Map. Population grid data were obtained from (https://landscan.ornl.gov, accessed on 30 June 2023) and public transportation-related data were obtained from Guilin Transportation Bureau, statistical bulletins, Guilin Statistical Yearbook, as well as relevant literature and field research data [53].

4.2. Methods

The workflow for SDG indicator assessment is shown in Figure 2. It included dynamic analysis of public transportation directionality and SDG11.2.1 indicators using point-of-interest data and LandScan population data and evaluation of public transportation sustainability using the entropy value method in combination with statistical data.

4.2.1. Construction of the Index System

The global index framework of SDGs, proposed by the United Nations in 2015, aims to assess sustainable development at the national level. However, there are limitations in assessing sustainable development at the regional scale within a country [54]. Therefore, this study constructs an indicator system and evaluation criteria to comprehensively evaluate the sustainability of public transportation in Guilin City, based on the documents of the Urban Traffic Management Evaluation System for Small and Medium-sized Cities, Environmental Quality Standards, and Urban Road Traffic Planning and Design Specifications. This approach follows the principles of science, systematicity, availability, and comparability and combines the United Nations’ indicators of sustainable development with the actual development of Guilin City. Due to difficulties in obtaining certain data, only representative indicators are selected for the public transportation evaluation index system in this paper. Indicators are primarily derived from three overarching perspectives: the status of public transportation development, socio-economic development, and the level of traffic management. The index system is presented in Table 1, and the evaluation grades are shown in Table 2.

4.2.2. Kernel Density Analysis

Kernel density analysis is a method for analyzing the distribution of spatial events, which assumes that geographic events can occur at any location in space but with different probabilities at different locations. By estimating the kernel density for all sample points, the kernel density index map of the spatial distribution of bus stops can be obtained [59]. The specific calculation formula is as follows:
n x = 1 n h i = 1 n k x x i h  

4.2.3. Standard Deviation Elliptic Analysis

The standard deviation ellipse is used to measure the degree of dispersion, the directional distribution, and the distribution pattern of discrete points. Various parameters of the standard deviation ellipse (e.g., long axis, short axis) can also be used to measure the characteristics of the discrete points, as well as the central tendency, the dispersion, and the directional tendency [60].
S D E X = i = 1 n ( x i X ) 2 n
S D E Y = i = 1 n ( y i Y ) 2 n

4.2.4. SDG11.2.1 Index Calculation

SDG11.2.1 refers to one of the indicators of the United Nations to provide a safe, affordable, accessible, and sustainable transportation system for all. Specifically, the significance of SDG11.2.1 is to drive urban transport systems in a more sustainable direction to improve traffic efficiency, reduce congestion, improve air quality, and ensure that people can access affordable, safe, accessible, and sustainable transport systems by 2030 [61].
P = M N 100
where “P” is the proportion of the population that can use public transport, “M” is the 500 m coverage of the population, and “N” is the total population of the study area (note: convenient use of public transport refers to the population within 500 m of a bus stop).
The SDG11.2.1 indicator was calculated as the population percentage of the public transport accessibility assessment. The higher the proportion of the population with easy access to public transport services, the better barrier-free access is and vice versa [62]. This index reflects the service status of the regional road network and traffic stations. By superposition of the service range of 500 m and the population grid data of the bus station, the population range of public transport can be easily used. The index of SDG11.2.1 in 2015, 2018, and 2021 of Guilin is calculated through the formula, and the proportion of the population with convenient use of public transport in the whole city and by region is analyzed.

4.2.5. Entropy Method

Since there is no consensus on the weights of SDGs, this study adopts the entropy weight method to deal with the scores of each indicator. The method is simple and easy to implement, supports the modification and expansion of the indicator system at a later stage, and at the same time, it can highlight the fairness of different goals. The entropy method is an objective assignment method to assess the degree of dispersion of a certain index. The greater the degree of dispersion, the greater the influence of the index on the comprehensive evaluation [63].
Due to the differences in magnitude and unit of each index, direct comparison and calculation are not possible. Therefore, prior to calculating the index weight, it is necessary to process the data in a dimensionless manner. After the dimensionless calculation, the objective weight is determined using the entropy method, which ensures that the evaluation results are more objective and accurate. The specific steps are as follows:
Assuming that given an n indicators, where X i = X 1 , X 2 , , X n , X 1 , X 2 , , X n , the standardized post-values are   Y 1 , Y 2 , , Y n . First, the data were standardized. The standardization formulas of positive and negative indicators are as follows:
Y i j = X i j m i n ( X j ) m a x ( X j ) m i n ( X j )
Y i j = m a x ( X j ) X i j m a x ( X j ) m i n ( X j )
The data were made dimensionless using the specific gravity method:
Z i j = Y i j i n Y i j
The entropy calculation formula of each index is:
E j = 1 ln n i = 1 n Z i j ln Z i j  
The difference coefficient of the index is:
G j = 1 E j
The weight calculation formula of each index is:
W j = G j j = 1 n G j
where j = 1, 2, …, k.

4.2.6. Calculation of Public Transport Sustainability

Sustainable development of urban public transport reflects the comprehensive development level of urban public transportation. With the method of the theoretical system of urban public transportation evaluation index classification standard and evaluation model principle, and after the entropy method to determine the weight, according to Formula (10) and Table 3 the comprehensive evaluation of urban public transport sustainable development level of ref. [64] is carried out.
F = j = 1 k W j X j
where, F is the representative comprehensive evaluation of the value, Wj represents the weight value of the item j index, and Xj represents the score of the item j index.

5. Results

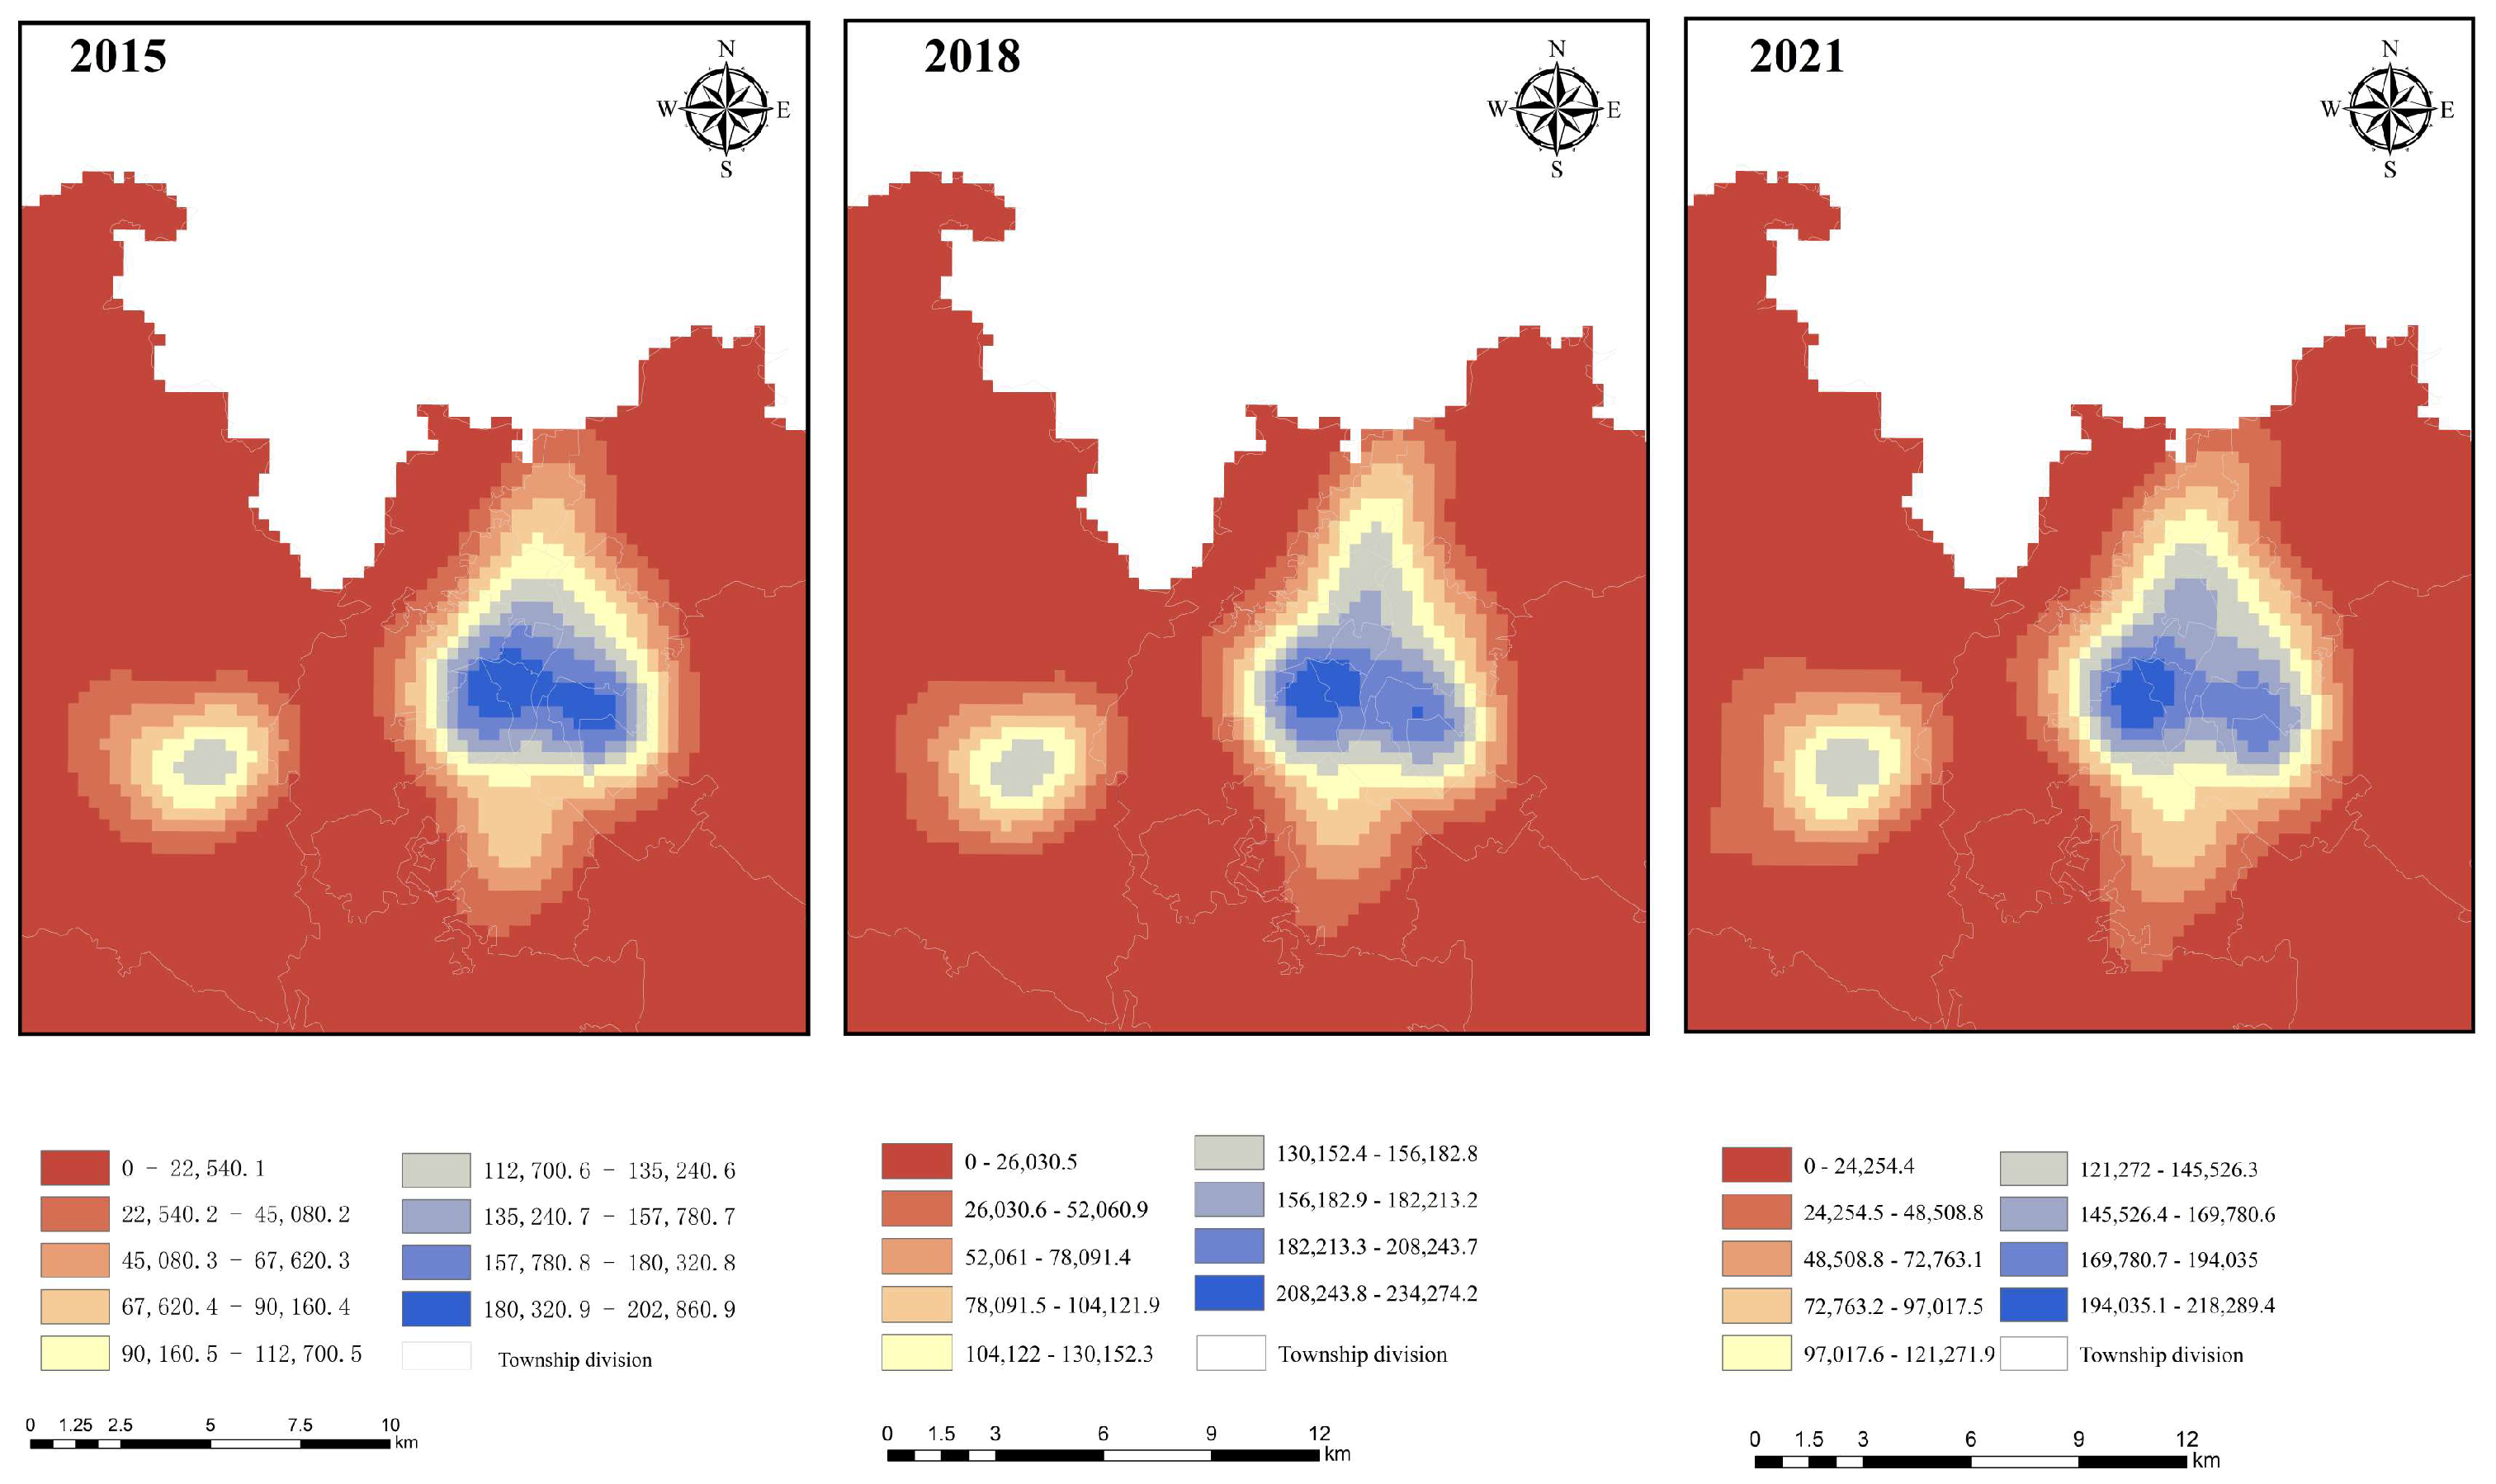
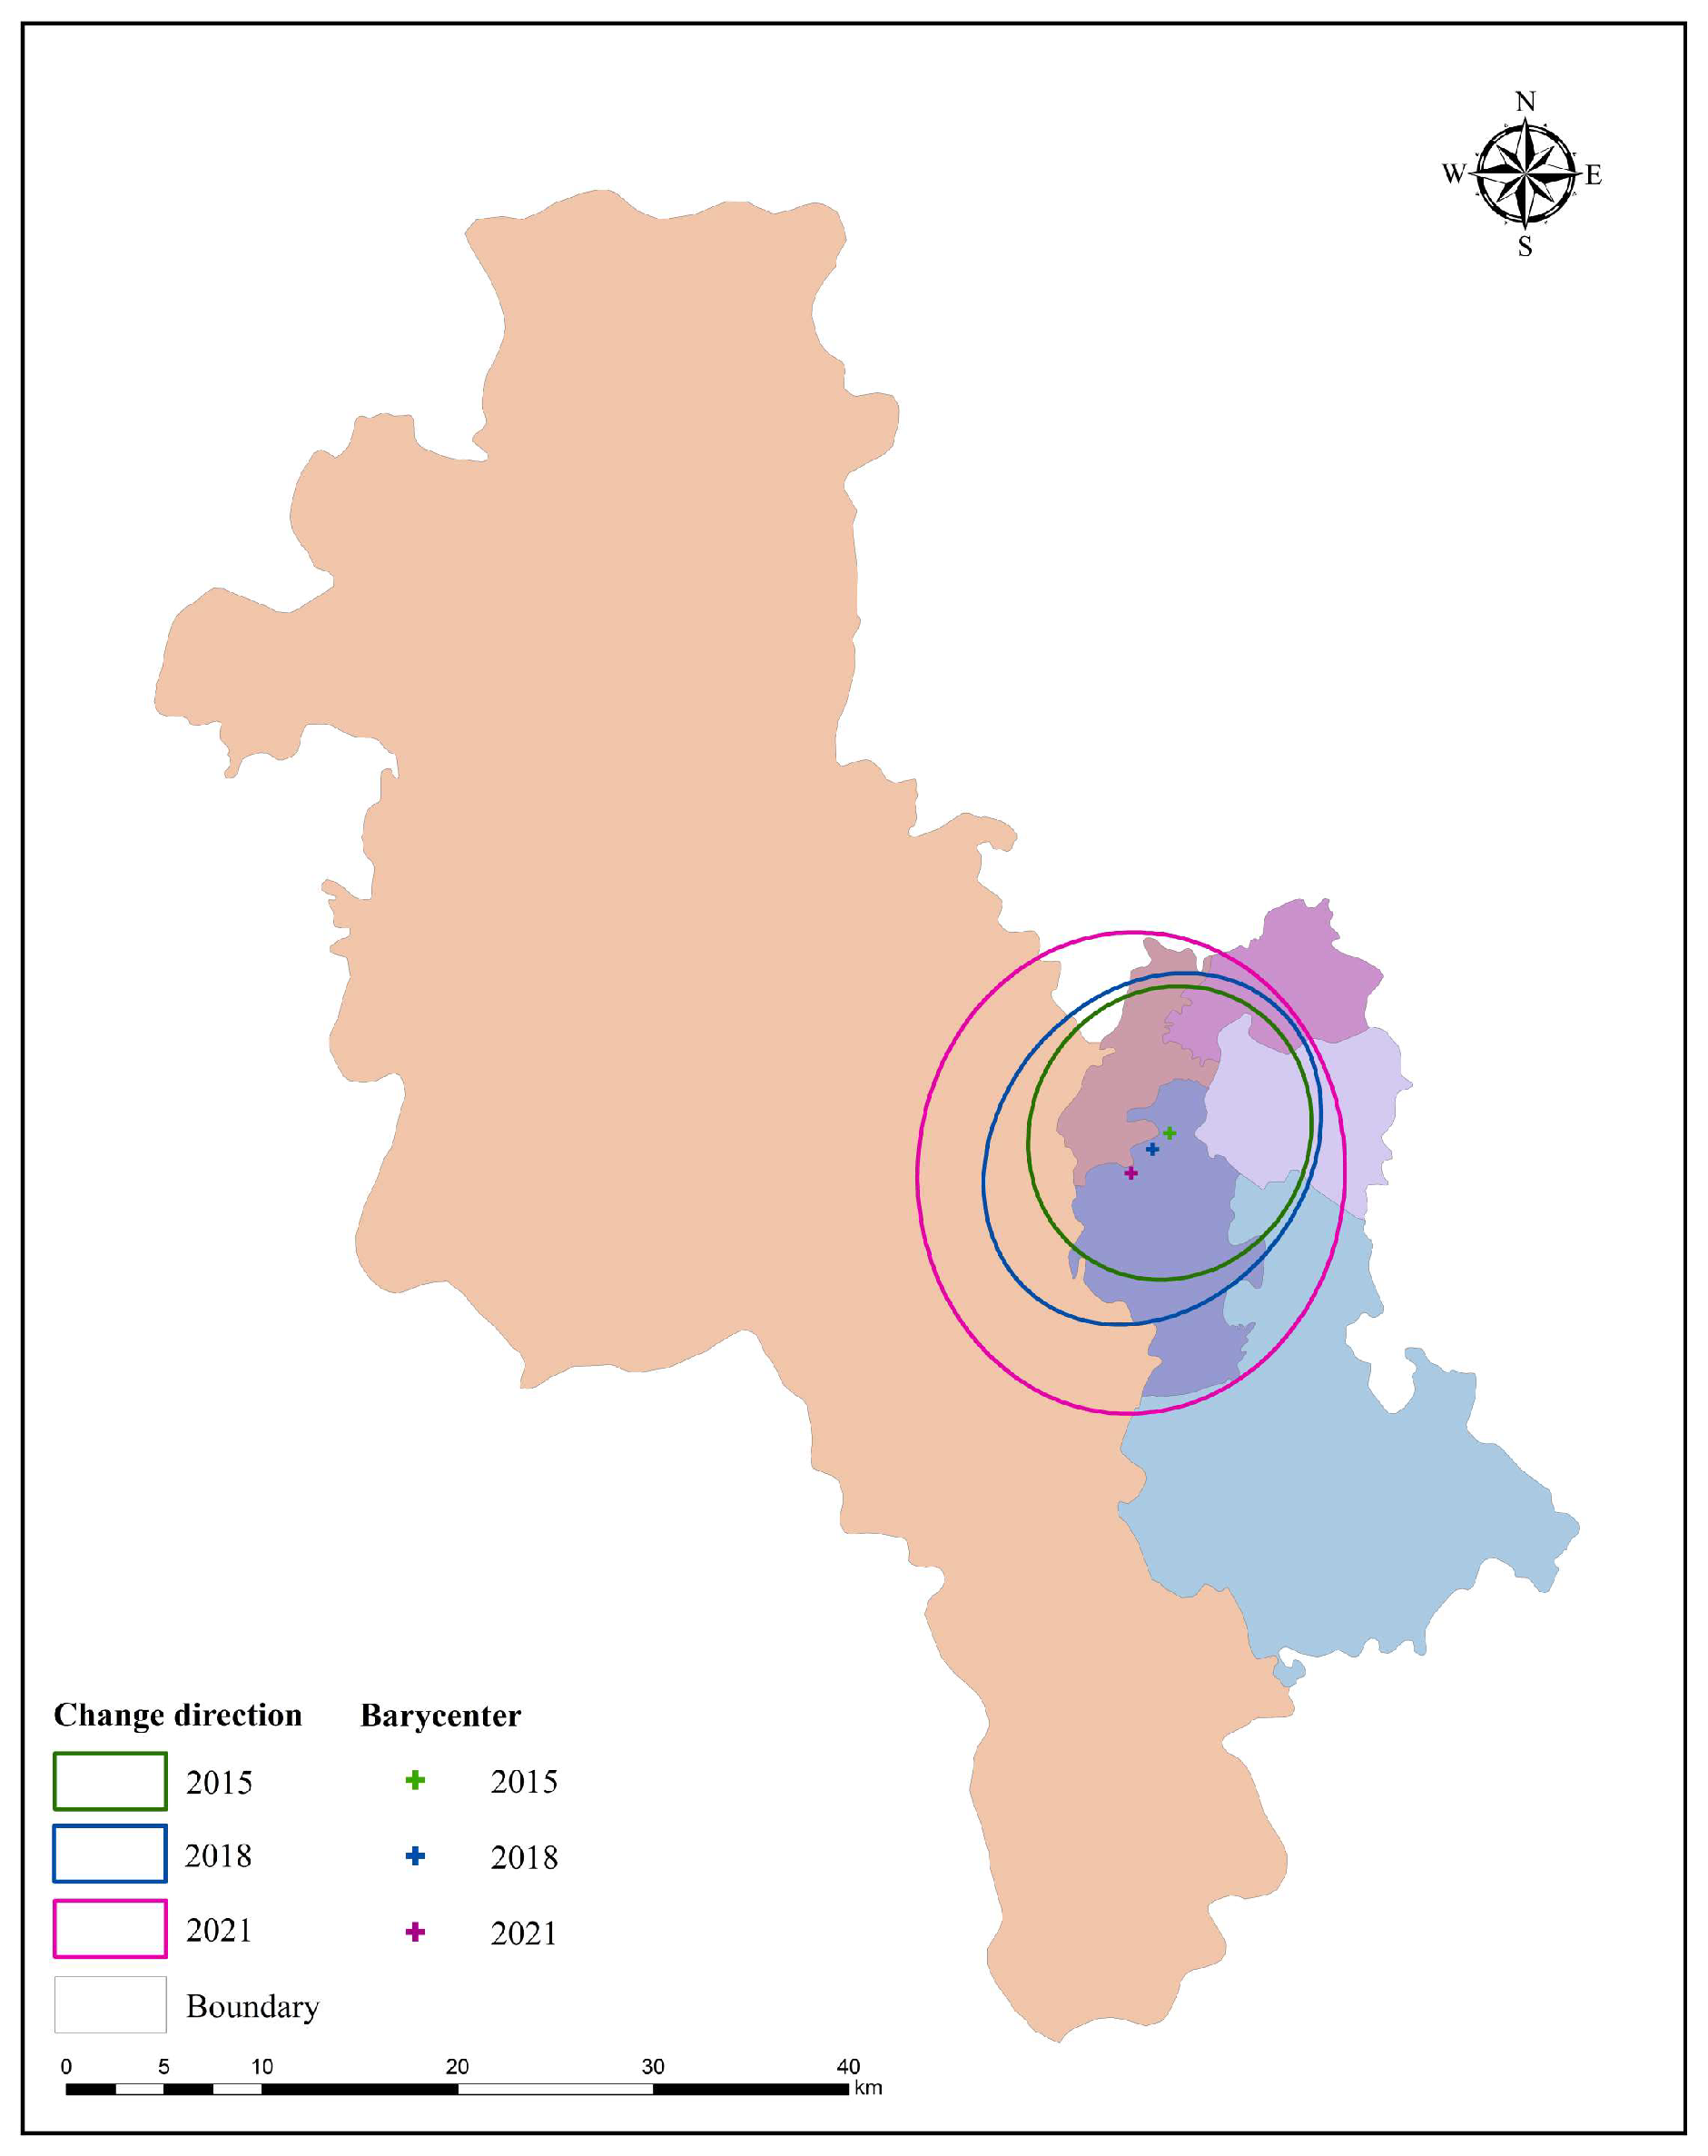
5.1. Analysis of Spatial Changes in Public Transportation in Guilin

Bus station POIs are mainly concentrated around Xiu Feng District, showing a high degree of aggregation and a more dense distribution. There is no subway in Guilin, so bus stops are the transportation facilities that cover the widest area and the largest number of public transportation facilities in the city. After many lines and stations, planning has undergone several adjustments and changes and it is now mature. It can be clearly seen in four jurisdictions, Xiufeng District, Diecai District, Qixing District, and Xiangshan District, that bus stops had a high-density distribution, while in two jurisdictions, Lingui District and Yanshan District, there was also a high-density area. Residential areas are distributed in a ring shape, while POIs are more concentrated and more evenly distributed around the city center on the whole; however, the area of Lingui District is larger compared to the area of several other districts, and only the area close to the city center is more densely populated with transportation facilities, while the distribution of public transportation facility points in other areas is sparse, and the degree of coverage is low compared to the other districts, which is consistent with the characteristics of the spatial distribution of the residential space in the area. The kernel densities of POIs of residential areas and POIs of public transportation facilities in the six urban areas of Guilin City in 2015, 2018, and 2021 are shown in Figure 3 and Figure 4. Compared with the spatial layout in 2015, the distribution gradually expands in 2018. The density range is larger in 2021, and a small agglomeration area is formed in Lingui District. From the interval distribution of kernel density values in the three periods, it can be found that the order of years in terms of residential and transportation kernel density values is 2021 > 2018 > 2015. Public transportation is well developed in the streets, but there are deficiencies in public transportation facilities in the surrounding townships.
Using the ArcGIS 10.2 software’s standard deviation ellipse geographic distribution algorithm, the main parameters of the standard deviation ellipse for public transportation in six urban areas of Guilin City were calculated from 2015 to 2021. Based on this, the moving path and trend of the center of gravity of the standard deviation ellipse were determined. Schematic diagrams of the center of gravity location and moving direction of the public transportation stations in the six urban areas of Guilin City were also obtained (Figure 5). The standard deviation ellipse area increased from 2015 to 2021, and the bus stops exhibited a spatial distribution characteristic of overall expansion during the sample period. This indicates that public transportation in Guilin City developed between 2015 and 2021. The overall path of the center of gravity movement of public transportation in Guilin City from 2015 to 2021 shows a southwesterly trend, moving from (110.275, 25.252) in 2015 to (110.255, 25.234) in 2021. This means that public transportation in the region is developing towards a more balanced trend during the sample period.

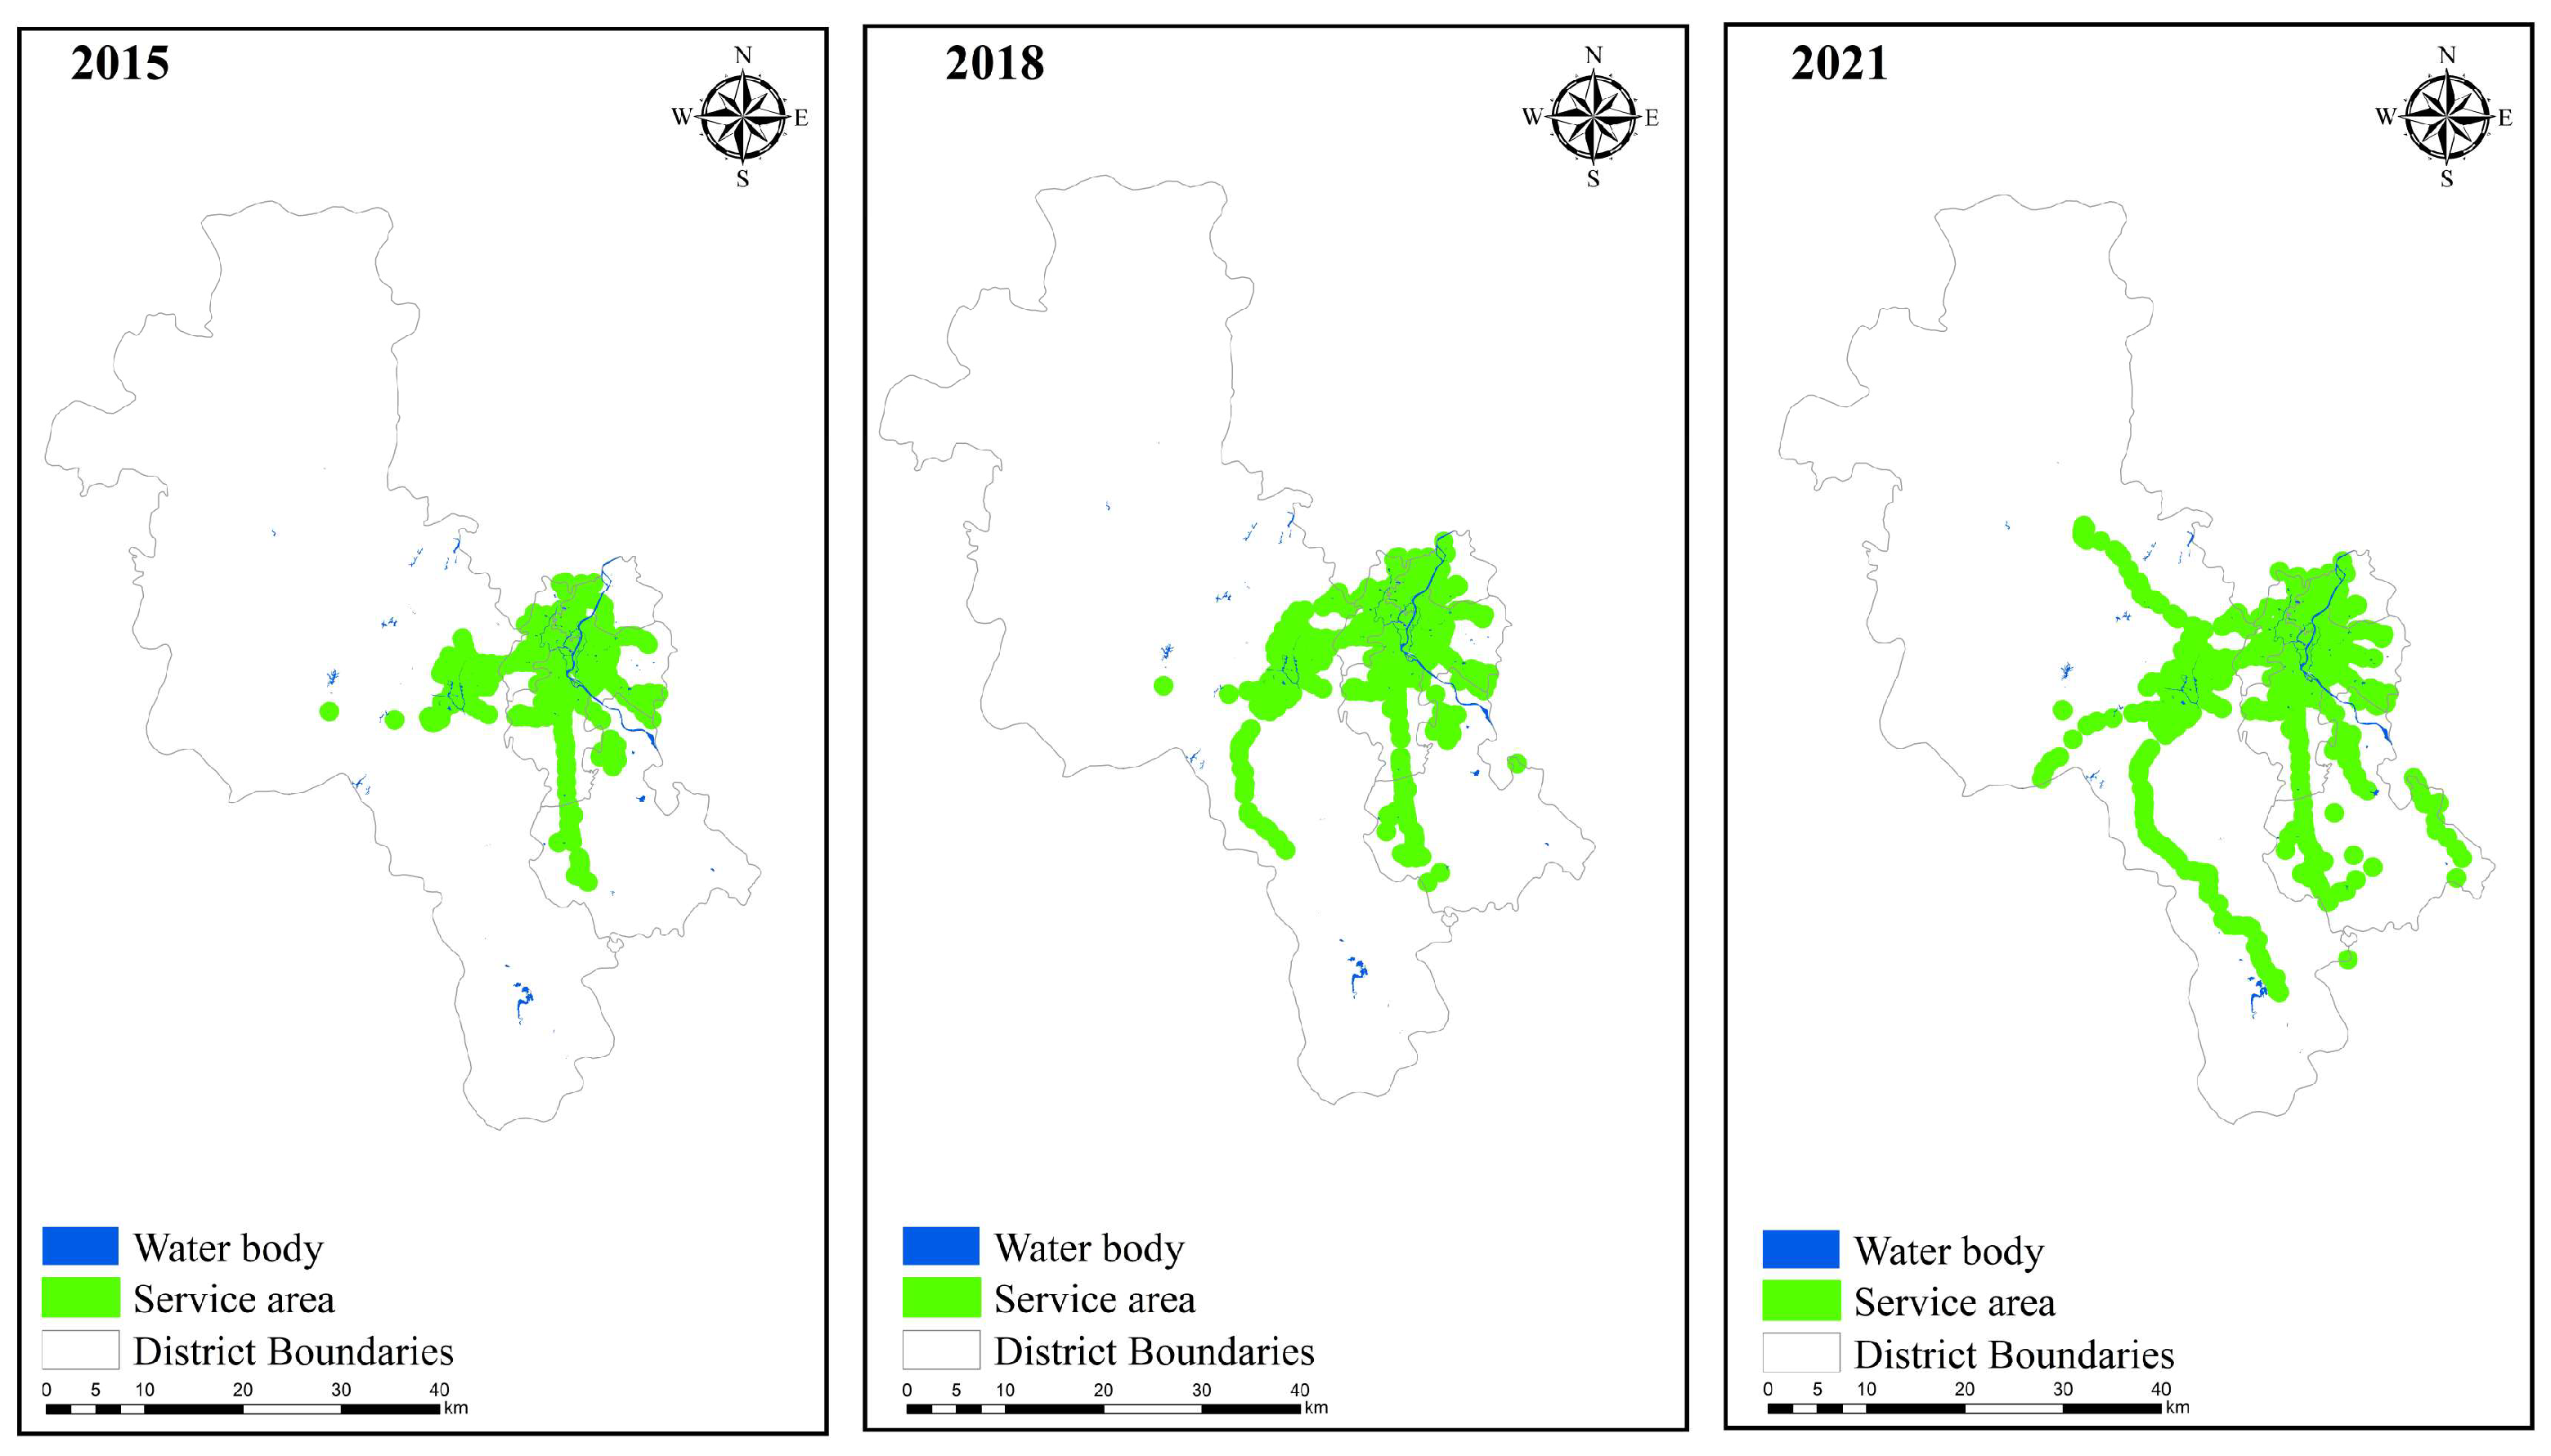
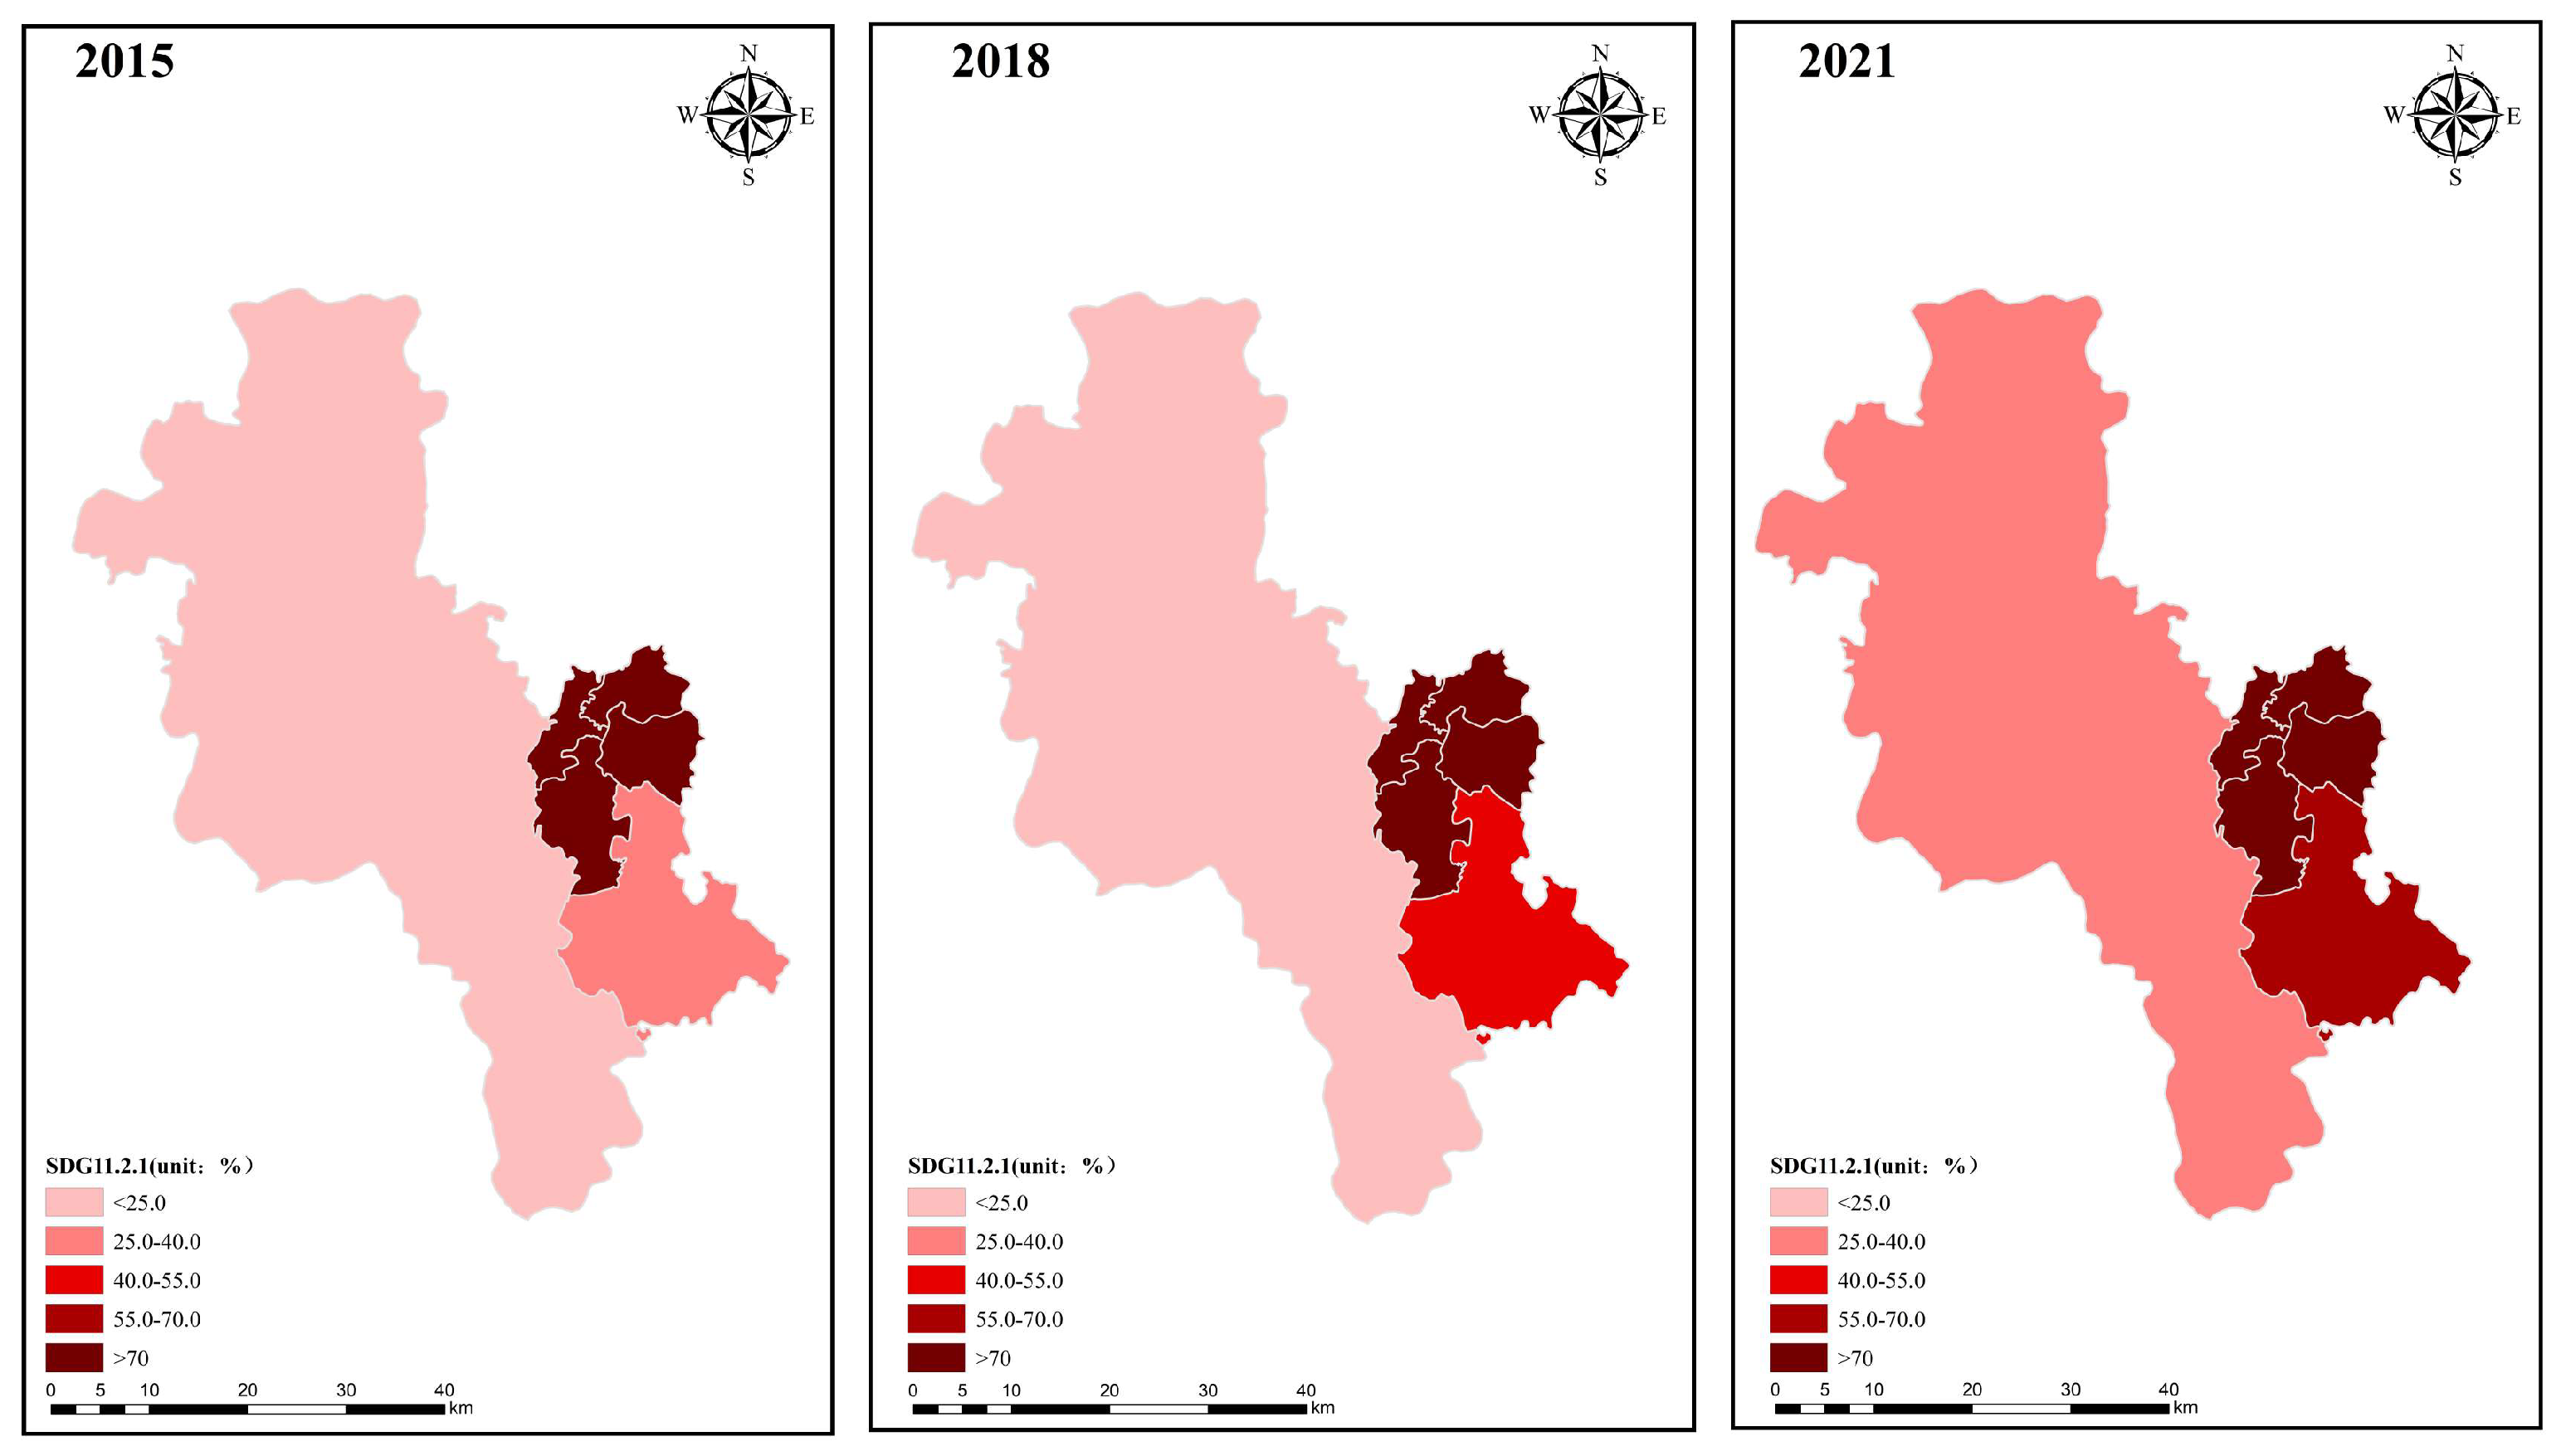
5.2. The Proportion of the Population Who Can Conveniently Use the Public Transport in Guilin City

To study SDG11.2.1, the data of public transport stations (buses) with spatial attributes were extracted, a buffer range of 500 m (Figure 6) was created, the population grid data were overlaid, and the proportion of the population with convenient use of public transport in the six urban areas was calculated [66]. For 2015 to 2021, the spatial distribution coverage of 500 m in Guilin is shown in Figure 2. It can be seen that the number of bus stops is increasing year by year, and the service area is expanding, from 147.98 km2 in 2015 to 197.56 km2 in 2018 to 259.18 km2 in 2021. They serve most areas of the city. In particular, Xiufeng District, Diecai District, Xiangshan District, and Qixing District were almost fully covered by 2021, and the service area of Yanshan District and Lingui District were gradually expanded. The public transportation convenience of the six central urban areas of Guilin is better than that of the peripheral areas.
The percentage of the population with accessible public transportation can be observed in the six urban areas (Figure 7 and Figure 8). It rose from 69.06% in 2015 to 71.63% in 2018 and further to 75.60% in 2021. Xiufeng District, Diecai District, Xiangshan District, and Qixing District increased the use of public transportation by over 90% from 2015 to 2021. Lingui District and Yanshan District had a lower proportion of the population utilizing public transportation compared to the other four urban areas. However, there was a noticeable increase in the number of bus stops in Lingui District and Yanshan District from 2015 to 2021. The percentage of the population with easy access to public transportation also significantly increased. That of Yanshan District rose from 33.22% in 2015 to 68.87% in 2021, while that of Lingui District increased from 15.27% in 2015 to 37.25% in 2021. The proportion of the population with accessible public transportation continues to rise. Overall, from 2015 to 2021, the convenience of public transportation in the six urban areas of Guilin City has consistently improved and gradually expanded from the city center to the outskirts. The overall level of sustainable development of public transportation in Guilin City has improved, but areas distant from the central urban area have a lower level of public transportation accessibility.
The rise of Yanshan District was not sudden; it was a result of six years of building a strong foundation for its current rapid development. This was achieved through the revitalization of Guilin’s industries, the establishment of a world-class tourist city, and the pursuit of other development opportunities. Furthermore, Yanshan is actively working to improve its public service facilities within the city. The completion of projects such as the Affiliated Golden Goose School of Normal University and the Yanshan Branch of Nanshi Mountain Hospital will effectively address the gaps in the area’s support system. This will provide Yanshan’s youth with more opportunities for urban development and attract more talented individuals to contribute to the city’s construction and development, thereby contributing to its continued rise. Yanshan is strategically positioned as the center of higher education in Guangxi, and it is also home to Guilin’s flourishing leisure and tourism industry. The combination of its cultural and tourism industry belt, along with its scientific and educational talent, provides strong support. When strategies such as “tourism+” and “industry+” are implemented, they become the main drivers of Yanshan’s rapid development. The city is now the main engine propelling its development forward. Yanshan has established a dual internal and external transportation network, with accelerated construction projects such as the “South, North, Fly, Xiang” roads, progressively forming a well-connected road system. This is aimed at achieving holistic growth for the city.
Since the county was abolished and changed to a district in 2015, the urbanization development in Lingui District has been rapid under the strategic deployment of “protecting Li River, developing Lingui, and creating a new Guilin”. The resident population has also increased significantly from 468,400 in 2015 to 557,500 in 2021. The increase in population requires supporting infrastructure, so the numbers of transportation stations, routes, and service areas have gradually increased. Lingui New District is centered around the landscape and develops various transportation arteries around Century Avenue and West City Avenue in a cross shape. Relying on the construction of the Guilin Economic and Technological Development Zone, Lingui District steadily promotes new industrialization and accelerates the improvement of industrial development quality and efficiency. Following the development concept of “one district, multiple parks”, the construction of industrial parks is accelerated, characteristic industries are cultivated, and industrial park development, park–town integration, and industrial–city integration are promoted to create the Ling-Su and Yi-Jiang high-tech industrial belt and promote industrial strengthening and upgrading.

5.3. Analysis of the Sustainable Development of the Public Transportation Space in Guilin City

Due to the different units used for the indicators, the collected data need to be standardized to make them comparable. Then, the entropy value method is used to calculate the weight of each index. After that, the status value of public transportation, the classification table of public transportation, and the evaluation index of sustainable development of urban public transportation are taken into account. Finally, the sustainable development level of public transportation in the six urban areas of Guilin is judged based on the criteria for judging. After processing and calculating the data, the weights and composite scores were obtained as shown in Table 4 and Table 5.
In 2015, the comprehensive score of sustainable development of public transport in the six urban areas of Guilin was 64.30. According to the Grade of Sustainable Development of Urban Public Transport (Table 3), it belongs to the low sustainable development level, and the comprehensive score of 2021 was 74.48, which belongs to the medium sustainable development. From 2015 to 2021, several indicators have shown an obvious trend in the new energy bus share, bus entry rate, bus site coverage, and the number of public transport vehicles per ten thousand people. Guilin, in recent years, has actively advocated “bus priority, green travel” and has increased the infrastructure construction of public transport. It has vigorously developed urban public transport and made efforts to build a more satisfactory urban public transportation system [67]. However, the average distance between bus stations, the average running speed of public transportation, and the density of the bus network have grown slowly, so the comprehensive evaluation is at the general sustainable development level. The comprehensive score of sustainable development of public transport in Guilin has increased from 64.30 to 74.48 and the evaluation has moved from the weak sustainable development level to the general sustainable development level, indicating that Guilin has made some progress in public transport construction and the service system. However, there is still room for improvement, and the future development prospects are great [68]. The quality and efficiency of public transport can be improved by strengthening the construction of public transport facilities, optimizing the planning of public transport lines, and promoting green travel modes.
There are differences in public transportation needs between tourists and residents, with the former traveling for sightseeing and focusing on routes that cover attractions and business districts and the latter focusing more on their daily needs, such as work and shopping. Tourists have the flexibility to travel during off-peak hours and use external sources for route information, while residents often travel during peak hours and are more familiar with the local public transportation network. Understanding and accommodating these differences can improve the relevance of public transportation services.

6. Discussion

SDG11.2.1 evaluation results show that the quality and convenience of public transportation in the six districts in the central area of Guilin are good. With time, the overall situation of the study area from 2015 to 2021 has improved, and the proportion of the population with access to public transportation and the convenient use of public transportation have been increasing. This is due to public transportation in the city center being superior to that of the outlying areas. This is consistent with the findings of Tiznado-Aitken, Munoz [69], and Han et al. [66].
Among them, the four districts of Xiufeng District, Diecai District, Xiangshan District, and Qixing District have had smooth overall development from 2015 to 2021. The development trend of Yanshan District and Lingui District is also evident, mainly driven by policy reasons and development orientation. In recent years, Yanshan District has taken advantage of the industrial revitalization of Guilin and the construction of a tourism city. It has filled the gap in the regional support system by strengthening the construction of public service facilities, providing more opportunities for development and attracting talent to promote the city’s growth. Yanshan District, as the center of higher education in Guangxi and the birthplace of the new peak of Guilin’s leisure and tourism, has strong support from its cultural and tourism industries and scientific and technological educational strength. Under the strategic plan of “Protecting New River, Developing Lingui, and Creating New Guilin”, urbanization in Lingui District has rapidly developed. The population has also significantly increased, requiring supporting infrastructure. As a result, the numbers of transportation stations, routes, and service areas have gradually increased. Relying on the construction of the Guilin Economic and Technological Development Zone, Lingui District has steadily promoted new industrialization and accelerated the quality and efficiency of industrial development. The development of the city requires public transportation.
With the public improvement of the transportation system and the increase in the number of buses and running lines, traffic has reduced. The field investigation found that increasing numbers of local residents are choosing to travel by electric car. People can choose a more flexible route and time according to their needs, without being limited by public transport fixed lines and shifts. This trend leads to a decrease in the use of public transport, which has a great impact on the public transport system. It not only affects the operational efficiency of public transport but is also a waste of public transport resources. Therefore, it is necessary to advocate for citizens to abide by the “prioritize public transport” policy [70].
In future development, the background of urban development and the external environment of urban public transportation will also pose new challenges to urban transportation planning and management work [71]. The concept of sustainable development will further our understanding of urban traffic in terms of resources, ecology, society, economy, and other fields. This prompts us to study traffic in order to achieve economic efficiency and social equity, maintain ecological balance, and adhere to the principles of resource allocation and utilization. A comprehensive evaluation of urban public transport is necessary. Urban public transport will play a bigger role in urban traffic. This is not only the need of urban development but also the need of sustainable development in urban traffic.
The data used in this study included statistics and geospatial data, but the data were inconsistent. Panel statistics and geospatial data differ in source, quality, and accuracy, and both have certain limitations [72]. For example, panel statistics may not be updated in a timely manner, and computational differences caused by variations in geospatial data processing methods may affect the comparability and consistency of indicators. Moreover, this study only evaluates the three issues in 2015, 2018, and 2021, and the study period largely depends on the availability of open geospatial data. In the future, comparative studies between panel statistics and geospatial data can further examine how to better combine these two datasets, reduce calculation errors, support geospatial data sharing, develop multi-source data fusion technology, and improve the resolution and accuracy of SDG measurement [73]. This study mainly provides an evaluation of the sustainable development of the Index of Public Transport in Chinese cities under the framework of United Nations goals, and it also provides a case and reference for the sustainable development of public transport in other cities around the world [74].

7. Conclusions

Following the guidelines of SDG11.2 indicators, the public transport service area in the six urban areas of Guilin gradually expanded, and the service area expanded from 147.98 km2 in 2015 to 259.18 km2 in 2021; the proportion of the population with accessible public transport gradually increased from 69.6.06% in 2015 to 75.60% in 2021; the comprehensive evaluation score of sustainable development of public transport also increased from 64.30 to 74.48. The proportion of the population with convenient public transport in Yanshan District and Lingui District rose from 2015 to 2021, increasing from 33.22% in 2015 to 68.87% in 2021 in Yanshan District and from 15.27% in 2015 to 37.25% in 2021 in Lingui District. However, the convenience of Lingui District and Yanshan District is lower than that of the other four districts, where the proportion of convenient public transport is higher than 90%. The range of kernel density distribution in the three periods reveals that the size of the kernel density values of public transportation stations is highest in 2021, followed by 2020 and 2015. The distribution expands mainly in a southwestern direction. Residential areas have the highest density in the city center, and there is a slight expansion trend from 2015 to 2021, indicating a close link between public transportation and population changes. The six urban districts of Guilin made significant progress in the share of new energy buses, bus sharing rate, and the coverage rate of bus stations and public transport vehicles for 10,000 people; however, the indicators of the average stop distance of bus stops, the average operating speed of public transportation, and the density of the bus network have grown slowly. Then, it is necessary to offer different strategies for different types of users. Tourists should plan their routes ahead of time in order to take into account the location of popular places, such as attractions and business districts. Commuters should explore employment areas and other significant destinations to establish a regular commuting route. Tourists can attempt to avoid traveling during peak traffic hours, as this can alleviate traffic congestion and save time, enabling them to reach their destination more quickly. Commuters can opt for dedicated commuter lines or public transportation services that are known for their punctuality. This study assesses the sustainable development of public transportation at a local level, aiming to highlight variations in public transportation development within the region and facilitate the creation of specific plans to enhance the overall sustainable development of the area. There are also many cities around the world that prioritize tourism, and this study can serve as a reference for similar cities. Another goal is to enhance global awareness regarding the evaluation of public transportation in the context of the 2030 Agenda for Sustainable Development.

Author Contributions

Conceptualization, Q.Z. and C.L.; methodology, Q.Z. and Y.C.; formal analysis, Q.Z.; writing—original draft preparation, Q.Z.; writing—review and editing, Q.Z., C.L., L.L., J.H. and Y.C. All authors have read and agreed to the published version of the manuscript.

Funding

This research was funded by National Key R&D Program of China (Project No. 2022YFC3800700), and supported by High Quality Development Project of “Research Center of China–Pakistan Economic Corridor” (Kashi University), “The Belt and Road” National and Regional Research Center of the State Ethnic Affairs Commission (No. ZBJJZL2023B01).

Institutional Review Board Statement

Not applicable.

Informed Consent Statement

Not applicable.

Data Availability Statement

The original contributions presented in the study are included in the article, further inquiries can be directed to the corresponding author/s.

Acknowledgments

The data collection of this study has been strongly supported by Guilin Science and Technology Bureau and Guilin Transportation Bureau, for which the authors would like to express their gratitude.

Conflicts of Interest

The authors declare no conflicts of interest.

References

  1. UN. Transforming Our World: The 2030 Agenda for Sustainable Development. 2015. Available online: http://www.un.org/ga/search/view_doc.asp?symbol=A/RES/70/1&Lang=E (accessed on 30 June 2022).
  2. Patel, Z.; Greyling, S.; Simon, D.; Arfvidsson, H.; Moodley, N.; Primo, N.; Wright, C. Local responses to global sustainability agendas: Learning from experimenting with the urban sustainable development goal in Cape Town. Sustain. Sci. 2017, 12, 785–797. [Google Scholar] [CrossRef] [PubMed]
  3. Guo, H.; Liang, D.; Sun, Z.; Chen, F.; Wang, X.; Li, J.; Zhu, L.; Bian, J.; Wei, Y.; Huang, L.; et al. Measuring and evaluating SDG indicators with Big Earth Data. Sci. Bull. 2022, 67, 1792–1801. [Google Scholar] [CrossRef] [PubMed]
  4. United Nations. THE 17 GOALS Sustainable Development. Available online: https://sdgs.un.org/goals (accessed on 7 September 2021).
  5. Tosun, J.; Leininger, J. Governing the interlinkages between the sustainable development goals: Approaches to attain policy integration. Glob. Chall. 2017, 1, 1700036. [Google Scholar] [CrossRef] [PubMed]
  6. Chidozie, F.; Oluwatobi, O.A. International organizations and global governance agenda: SDGs as a paragon. Acta Univ. Danubius. Relationes Int. 2017, 10, 43–60. [Google Scholar]
  7. Stafford-Smith, M.; Griggs, D.; Gaffney, O.; Ullah, F.; Reyers, B.; Kanie, N.; OConnell, D. Integration: The key to implementing the Sustainable Development Goals. Sustain. Sci. 2017, 12, 911–919. [Google Scholar] [CrossRef] [PubMed]
  8. Horn, P.; Grugel, J. The SDGs in middle-income countries: Setting or serving domestic development agendas? Evidence from Ecuador. World Dev. 2018, 109, 73–84. [Google Scholar] [CrossRef]
  9. Hosseini, K.; Stefaniec, A.; Hosseini, S.P. World Heritage Sites in developing countries: Assessing impacts and handling complexities toward sustainable tourism. J. Destin. Mark. Manag. 2021, 20, 100616. [Google Scholar] [CrossRef]
  10. Collste, D.; Pedercini, M.; Cornell, S.E. Policy coherence to achieve the SDGs: Using integrated simulation models to assess effective policies. Sustain. Sci. 2017, 12, 921–931. [Google Scholar] [CrossRef] [PubMed]
  11. Kastrinos, N.; Weber, K.M. Sustainable development goals in the research and innovation policy of the European Union. Technol. Forecast. Soc. Chang. 2020, 157, 120056. [Google Scholar] [CrossRef]
  12. Su, X.; Zheng, C.; Yang, Y.; Yang, Y.; Zhao, W.; Yu, Y. Spatial structure and development patterns of urban traffic flow network in less developed areas: A sustainable development perspective. Sustainability 2022, 14, 8095. [Google Scholar] [CrossRef]
  13. Hosseini, K.; Stefaniec, A. A wolf in sheep’s clothing: Exposing the structural violence of private electric automobility. Energy Res. Soc. Sci. 2023, 99, 103052. [Google Scholar] [CrossRef]
  14. Mattioli, G.; Roberts, C.; Steinberger, J.K.; Brown, A. The political economy of car dependence: A systems of provision approach. Energy Res. Soc. Sci. 2020, 66, 101486. [Google Scholar] [CrossRef]
  15. Huang, C.; Sun, Z.; Jiang, H.; Wang, J.; Wang, P.; Tao, J.; Liu, H.; Liu, N. Big Earth Data Supports Sustainable Cities and Communities: Progress and Challenges. Bull. Chin. Acad. Sci. 2021, 36, 9. [Google Scholar]
  16. Fu, B.; Zhang, J.; Wang, S.; Zhao, W. Classification–coordination–collaboration: A systems approach for advancing Sustainable Development Goals. Natl. Sci. Rev. 2020, 7, 838–840. [Google Scholar] [CrossRef]
  17. Allen, C.; Metternicht, G.; Wiedmann, T. Initial progress in implementing the Sustainable Development Goals (SDGs): A review of evidence from countries. Sustain. Sci. 2018, 13, 1453–1467. [Google Scholar] [CrossRef]
  18. Ricciolini, E.; Rocchi, L.; Cardinali, M.; Paolotti, L.; Ruiz, F.; Cabello, J.M.; Boggia, A. Assessing progress towards SDGs implementation using multiple reference point based multicriteria methods: The case study of the European countries. Soc. Ind. Res. 2022, 162, 1233–1260. [Google Scholar] [CrossRef] [PubMed]
  19. Pradhan, P.; Costa, L.; Rybski, D.; Lucht, W.; Kropp, J.P. A Systematic Study of Sustainable Development Goal (SDG) Interactions. Earth’s Future 2017, 5, 1169–1179. [Google Scholar] [CrossRef]
  20. Fonseca, L.M.; Domingues, J.P.; Dima, A.M. Mapping the sustainable development goals relationships. Sustainability 2020, 12, 3359. [Google Scholar] [CrossRef]
  21. McArthur, J.W.; Rasmussen, K. Classifying Sustainable Development Goal trajectories: A country-level methodology for identifying which issues and people are getting left behind. World Dev. 2019, 123, 104608. [Google Scholar] [CrossRef]
  22. Wang, T.; Zhang, J.; Liu, B. Evaluation index system of national innovation demonstration zones for the 2030 agenda for sustainable development. China Population. Resour. Environ. 2020, 30, 17–26. [Google Scholar]
  23. Fried, T.; Tun, T.H.; Klopp, J.M.; Welle, B. Measuring the Sustainable Development Goal (SDG) transport target and accessibility of Nairobi’s matatus. Transp. Res. Rec. 2020, 2674, 196–207. [Google Scholar] [CrossRef]
  24. Allen, C.; Nejdawi, R.; El-Baba, J.; Hamati, K.; Metternicht, G.; Wiedmann, T. Indicator-Based Assessments of Progress towards the Sustainable Development Goals (SDGs): A Case Study from the Arab Region. Sustain. Sci. 2017, 12, 975–989. [Google Scholar] [CrossRef]
  25. Xu, Z.; Chau, S.N.; Chen, X.; Zhang, J.; Li, Y.; Dietz, T.; Wang, J.; Winkler, J.A.; Fan, F.; Huang, B.; et al. Assessing progress towards sustainable development over space and time. Nature 2020, 577, 74–78. [Google Scholar] [CrossRef] [PubMed]
  26. Guo, R.; Dai, X.; Liu, L. Progress and practice in China. Eco-Econ. 2022, 38, 211–217. [Google Scholar]
  27. Ishtiaque, A.; Masrur, A.; Rabby, Y.W.; Jerin, T.; Dewan, A. Remote sensing-based research for monitoring progress towards SDG 15 in Bangladesh: A review. Remote Sens. 2020, 12, 691. [Google Scholar] [CrossRef]
  28. Bowen, K.J.; Cradock-Henry, N.A.; Koch, F.; Patterson, J.; Häyhä, T.; Vogt, J.; Barbi, F. Implementing the “Sustainable Development Goals”: Towards addressing three key governance challenges—Collective action, trade-offs, and accountability. Curr. Opin. Environ. Sustain. 2017, 26, 90–96. [Google Scholar] [CrossRef]
  29. Gao, F.; Zhao, X.; Song, X. Connotation and evaluation index system of beautiful China facing SDGs. Prog. Earth Sci. 2019, 34, 295–305. [Google Scholar]
  30. Cao, M.; Zhao, Z.; Hu, X. Measurement and Analysis of Sustainable Development Goals in Yangtze River Delta Region. Mod. Surv. Mapp. 2021, 44, 1–5. [Google Scholar]
  31. Yan, X.; Fan, X.; Zhang, C. Urban traffic posture prediction algorithm based on graph convolutional neural network. J. Zhejiang Uni. (Eng. Ed.) 2020, 54, 1147–1155. [Google Scholar]
  32. Huang, C.; Feng, Y.; Gao, F. Comprehensive assessment of SDGs in sustainable development agenda innovation demonstration zones—A case study of Lincang City. Prog. Earth Sci. 2023, 38, 987–998. [Google Scholar]
  33. Wei, D.; Li, W.; Yang, W.; Chen, H. Assessing the progress and spatial patterns of sustainable eco-environmental development based on the 2030 Agenda for SDGs in China. Int. J. Sustain. Dev. World Ecol. 2023, 30, 387–401. [Google Scholar] [CrossRef]
  34. Ma, Y.; Zhang, Z. Evaluation and influencing factor analysis of urbanization in Gansu Province under the framework of SDGs. J. Lanzhou Uni. (Nat. Sci. Ed.) 2021, 57, 627–636. [Google Scholar]
  35. Gao, J.; Shao, C.; Chen, S.; Wei, Z. Evaluation of sustainable development of tourism cities based on SDGs and tourism competitiveness index: Analysis of 221 prefecture-level cities in China. Sustainability 2021, 13, 12338. [Google Scholar] [CrossRef]
  36. Shao, C.; Gao, J.; Zhao, R. Evaluation of sustainable development of tourism-oriented cities based on SDGs and tourism competitiveness index—Taking Guilin as an example. China Pop-Resour. Environ. 2022, 32, 162–176. [Google Scholar]
  37. Molina-Azorín, J.F.; Font, X. Mixed methods in sustainable tourism research: An analysis of prevalence, designs and application in JOST (2005–2014). J. Sustain. Tour. 2016, 24, 549–573. [Google Scholar] [CrossRef]
  38. Giuliani, G.; Mazzetti, P.; Santoro, M.; Nativi, S.; van Bemmelen, J.; Colangeli, G.; Lehmann, A. From Data to Knowledge using the GEOSS platform to support Sustainable Development Goals. IOP Conf. Ser. Earth Environ. Sci. 2020, 509, 012020. [Google Scholar] [CrossRef]
  39. Marcinko, C.L.J.; Nicholls, R.J.; Daw, T.M.; Hazra, S.; Hutton, C.W.; Hill, C.T.; Mondal, P.P. The development of a framework for the integrated assessment of SDG trade-offs in the Sundarban Biosphere reserve. Water 2021, 13, 528. [Google Scholar] [CrossRef]
  40. Alves, F.L.; Da Silva, C.P.; Pinto, P. The assessment of the coastal zone development at a regional level—The case study of Portugal central area. J. Coast. Res. 2024, 50 (Suppl. S1), 72–76. [Google Scholar] [CrossRef]
  41. D’Adamo, I.; Gastaldi, M.; Imbriani, C.; Morone, P. Assessing regional performance for the Sustainable Development Goals inItaly. Sci. Rep. 2021, 11, 24117. [Google Scholar] [CrossRef]
  42. Anitescu, C.; Atroshchenko, E.; Alajlan, N.; Rabczuk, T. Artificial neural network methods for the solution of second order boundary value problems. Comput. Mater. Contin. 2019, 59, 345–359. [Google Scholar] [CrossRef]
  43. Purwaningsih, A.; Lubis, S.W.; Hermawan, E.; Andarini, D.F.; Harjana, T.; Ratri, D.N.; Sujalu, A.P. Moisture origin and transport for extreme precipitation over Indonesia’s new capital city, Nusantara in August 2021. Atmosphere 2022, 13, 1391. [Google Scholar] [CrossRef]
  44. Hatzopoulou, M.; Miller, E.J. Linking an activity-based travel demand model with traffic emission and dispersion models: Transport’s contribution to air pollution in Toronto. Transp. Res. Part D Trans. Environ. 2010, 15, 315–325. [Google Scholar] [CrossRef]
  45. Goldman, T.; Gorham, R. Sustainable urban transport: Four innovative directions. Technol. Soc. 2006, 28, 261–273. [Google Scholar] [CrossRef]
  46. Nidziy, E. Financing the construction of transport infrastructure as the basis for sustainable development of the regional economy. IOP Conf. Ser. Earth. Environ. Sci. 2017, 90, 012172. [Google Scholar] [CrossRef]
  47. Chen, J.; Wang, Q.; Cheng, H.; Peng, W.; Xu, W. A review of vision-based traffic semantic understanding in ITSs. IEEE Trans. Intel. Trans. Sys. 2022, 23, 19954–19979. [Google Scholar] [CrossRef]
  48. Sun, G.; Zhang, Y.; Liao, D.; Yu, H.; Du, X.; Guizani, M. Bus-trajectory-based street-centric routing for message delivery in urban vehicular ad hoc networks. IEEE Trans. Veh. Technol. 2018, 67, 7550–7563. [Google Scholar] [CrossRef]
  49. Yang, H.; Li, Z.; Qi, Y. Predicting traffic propagation flow in urban road network with multi-graph convolutional network. Complex Intel. Sys. 2024, 10, 23–35. [Google Scholar] [CrossRef]
  50. The State Council of the People’s Republic of China. The State Council on the Approval of the Construction of the National Sustainable Development Agenda Innovation Demonstration Zone [EB/OL]. 2018. Available online: http://www.gov.cn/zhengce/content/2018-02/24/content_5268410.htm (accessed on 1 June 2023).
  51. Chang, Y.; Ouyang, X.; Fei, X.; Sun, Z.; Li, S.; Jiang, H.; Li, H. Comprehensive Assessment of Sustainable Development Goal 11 at the Sub-City Scale: A Case Study of Guilin City. Remote Sens. 2023, 15, 4722. [Google Scholar] [CrossRef]
  52. Dong, S.; Mo, Y.; Ma, J. Research progress on ecology and sustainable development of Guilin Lijiang River Basin, China, based on bibliometric analysis. Environ. Sci. Pollut. Res. 2023, 31, 6694–6722. [Google Scholar] [CrossRef]
  53. Sun, Z.; Xu, R.; Du, W.; Wang, L.; Lu, D. High-resolution urban land mapping in China from sentinel 1A/2 imagery based on Google Earth Engine. Remote Sens. 2019, 11, 752. [Google Scholar] [CrossRef]
  54. Zhu, J.; Sun, X.; He, Z. Research on China’s sustainable development evaluation indicators in the framework of SDGs. China Popul. Resour. Environ. 2018, 28, 9–18. [Google Scholar]
  55. Hosseini, K.; Stefaniec, A.; O’Mahony, M.; Caulfield, B. Optimising shared electric mobility hubs: Insights from performance analysis and factors influencing riding demand. Case Stud. Transp. Policy 2023, 13, 101052. [Google Scholar] [CrossRef]
  56. GB 50220-95; Ministry of Construction of the People’s Republics of China. Urban Road Traffic Planning and Design Specification. China Planning Press: Beijing, China, 1995.
  57. Department of Construction of the People’s Republics of China. Urban Traffic Management Evaluation Index System; China Planning Press: Beijing, China, 2008. [Google Scholar]
  58. Zhang, N. Evaluation on Sustainable Development of Urban Passenger Transport. Master’s Thesis, Shijiazhuang Tiedao University, Shijiazhuang, China, 2014. [Google Scholar]
  59. Zhang, Y.; Wang, G.; Zhao, F. Research on the spatial layout of medical facilities in the main urban area of Jilin City based on GIS. Geo Inf. 2024, 22, 48–51. [Google Scholar]
  60. Hu, J.; Yu, J.; Zhang, C. A study on the spatial distribution of China’s aid to Africa based on standard deviation ellipse. World Geo. Res. 2024, 3, 79–88. Available online: http://kns.cnki.net/kcms/detail/31.1626.P.20240123.1056.002.html (accessed on 15 April 2024).
  61. Brussel, M.; Zuidgeest, M.; Pfeffer, K.; van Maarseveen, M. Access or Accessibility? A Critique of the Urban Transport SDG Indicator. ISPRS Int. J. Geo Inf. 2019, 8, 67. [Google Scholar] [CrossRef]
  62. Zhang, C.; Sun, Z.; Xing, Q.; Sun, J.; Xia, T.; Yu, H. Localizing indicators of SDG11 for an integrated assessment of urban sustainability—A case study of Hainan province. Sustainability 2021, 13, 11092. [Google Scholar] [CrossRef]
  63. Xu, W.; Su, Y.; Li, H.; Wang, S.; Jiang, X.; Ma, J. Evaluation of Bus Station Layouts in Transportation Hub Based on Entropy Weight Method. J. Transp. Syst. Eng. Inf. Technol. 2023, 23, 104–112. [Google Scholar]
  64. Chu, Y. Research on sustainable Development of Urban Public Transportation in Changsha City. Master’s Thesis, Changsha University of Science and Technology, Changsha, China, 2013. [Google Scholar]
  65. Cai, D. Study on Sustainable Development of Urban Public Transport-Take Chongqing City. Ph.D. Thesis, Chongqing Jiaotong University, Chongqing, China, 2010. [Google Scholar]
  66. Han, L.; Lu, L.; Lu, J.; Liu, X.; Zhang, S.; Luo, K.; He, D.; Wang, P.; Guo, H.; Li, Q. Assessing Spatiotemporal Changes of SDG Indicators at the Neighborhood Level in Guilin, China: A Geospatial Big Data Approach. Remote Sens. 2022, 14, 4985. [Google Scholar] [CrossRef]
  67. Ji, X.; Zhang, H.; Chen, F. The evaluation model of the priority development degree of public transportation based on the element extension model of entropy weight. J. Kunming Univ. Sci. Technol. (Nat. Sci. Ed.) 2013, 38, 32–38. [Google Scholar]
  68. Wang, P.; Wang, B.; Xu, B.; Huang, Y.; Gao, F.; Zhao, X.; Huang, C.; Song, X.; Zhou, L. Progress and prospect of sustainable development goals in underdeveloped mountainous areas. Adv. Earth Sci. 2022, 37, 937–948. [Google Scholar]
  69. Tiznado-Aitken, I.; Muñoz, J.C.; Hurtubia, R. The Role of Accessibility to Public Transport and Quality of Walking Environment on Urban Equity: The Case of Santiago de Chile. Transp. Res. Rec. 2018, 2672, 129–138. [Google Scholar] [CrossRef]
  70. Zhang, X. Research on the Optimization of the “Bus Priority” Policy in Small and Medium-Sized Cities. Ph.D. Thesis, Nanjing University of Science and Technology, Nanjing, China, 2021. [Google Scholar]
  71. Wu, J. Reflections on Urban Public Transportation and Urban Development. Transp. World 2021, 35, 4–5. [Google Scholar]
  72. Leyk, S.; Gaughan, A.E.; Adamo, S.B.; de Sherbinin, A.; Balk, D.; Freire, S.; Pesaresi, M. The spatial allocation of population: A review of large-scale gridded population data products and their fitness for use. Earth Sys. Sci. Data 2019, 11, 1385–1409. [Google Scholar] [CrossRef]
  73. Gan, L. Quantitative Evaluation of SDGs Sustainable Development Framework of SDGs in Chengdu-Chongqing Economic Circle. Master’s Thesis, Chongqing Normal University, Chongqing, China, 2021. [Google Scholar]
  74. Klopp, J.M.; Petretta, D.L. The urban sustainable development goal: Indicators, complexity and the politics of measuring cities. Cities 2017, 63, 92–97. [Google Scholar] [CrossRef]
Figure 1. Overview of the study area.
Sustainability 16 04542 g001
Figure 2. Workflow for SDG indicator assessment in this study.
Sustainability 16 04542 g002
Figure 3. Nuclear density of spatial distribution of residential areas in Guilin from 2015 to 2021.
Sustainability 16 04542 g003
Figure 4. Spatial distribution nuclear density of bus stops in Guilin from 2015 to 2021.
Sustainability 16 04542 g004
Figure 5. The Center of Gravity and Standard Deviation Ellipse Distribution of Bus Stops in Guilin City from 2015 to 2021.
Sustainability 16 04542 g005
Figure 6. Spatial distribution of service areas (500 m) of bus stops in the six districts of Guilin from 2015 to 2021.
Sustainability 16 04542 g006
Figure 7. Spatial distribution of SDG11.2.1 in the six districts of Guilin from 2015 to 2021.
Sustainability 16 04542 g007
Figure 8. The proportion of the population with convenient access to public transport stations in the six districts of Guilin from 2015 to 2021.
Sustainability 16 04542 g008
Table 1. Index system of urban public transport evaluation.
Evaluation IndicatorUnitAttributeDefinitionSDG Indicator
Bus network densitykm/km2+Refers to the total length of bus routes divided by land area of the city served by bus.11.2.1
Share of new energy buses%+Ratio of new energy public transport vehicles to total public transport vehicles.11.2.1
Bus entry rate%+Refers to the proportion of the number of parked vehicles occupied on the road outside the starting point and terminal area of public transport to the total number of public transport vehicles.11.2.1
Bus share rate%+Refers to the ratio of trips made by urban residents who choose public transportation as a mode of travel to the total number of trips made.11.2.1
Average distance between bus stopskmRefers to the ratio of the total length of city bus routes to the total number of stops.11.2.1
Public transportation priority policyterm+According to the characteristics of the city itself, the strategy of priority development of public transport and the matching urban public passenger transport regulations are formulated.11.2.1
Average speed of public transportationkm/h+Refers to the average speed between the first and last stations of the line (including the driving time among the stations and the stop time of each station) except for the travel length.11.2.1
Proportion of population within a radius of 500 m, a walkable distance [55]%+Refers to the ratio of the population within 500 m of a bus stop to the total urban population11.2.1
Number of public transportation vehicles available per 10,000 peopleVehicle+Refers to the number of marked buses per 10,000 people in a certain space in the city11.2.1
GDP growth rate%+Refers to the rate of urban GDP increase in that year compared with the previous year11.2.1
Table 2. Evaluation index grade of the sustainable development of urban public transport [56,57,58].
Evaluation Indicator[90, 100]80, 90)70, 80)60, 70)0, 60)
Bus network density[3, 4]2.5, 3)2, 2.5)1.5, 2)0, 1.5)
Share of new energy buses≥9060, 90)30, 60)10,30)<10
Bus entry rate≥9080, 90)70, 80)60,70)0, 60)
Bus share rate[35, 40]30, 35)25, 30)20, 25)0, 20)
Average distance between bus stops[500, 600]600, 700)700, 800)800, 1000) or 300, 500)>1000 or <300
Public transportation priority policyMeet eight itemsMeet seven itemsMeet six itemsMeet five itemsLess than five items
Average speed of public transportation[25, 30]22, 25)19, 22)16, 19)0, 16)
Proportion of population within a radius of 500 m, a walkable distance ≥9080, 90)70, 80)60, 70)0, 60)
Number of public transportation vehicles available per 10,000 people≥1614, 16)12, 14)8, 12)0, 8)
GDP growth rate≥86, 8)4, 6)2, 4)<2
Table 3. Sustainable development grades of urban public transport [65].
Comprehensive Index[0–60][60–70][70–80][80–90]>90
Development levelUnsustainable developmentLow sustainable developmentMedium sustainable developmentGood sustainable developmentVery good sustainable development
Table 4. Entropy method weight calculation.
Evaluation IndicatorEntropy ValueDiversity Factor Weight
Bus network density0.9993 0.0007 0.0033
Share of new energy buses0.9624 0.0376 0.1653
Bus entry rate0.9999 0.0134 0.0004
Bus share rate0.9916 0.0084 0.0370
Average distance between bus stops0.9987 0.0013 0.0056
Public transportation priority policy0.9205 0.0795 0.3493
Average speed of public transportation0.9968 0.0032 0.0140
Proportion of population within a radius of 500 m, a walkable distance 0.9934 0.0066 0.0291
Number of public transportation vehicles available per 10,000 people0.9423 0.0577 0.2536
GDP growth rate0.9676 0.0324 0.1424
Total 1
Table 5. Index evaluation results.
Evaluation IndicatorFinal Score in 2015Final Score in 2021
Bus network density0.3026 0.3106
Share of new energy buses12.7083 14.3759
Bus entry rate0.0411 0.0420
Bus share rate2.2254 2.5894
Average distance between bus stops0.2836 0.3352
Public transportation priority policy19.2135 26.2003
Average speed of public transportation0.7871 1.0658
Proportion of population within a radius of 500 m, a walkable distance 2.0080 2.1984
Number of public transportation vehicles available per 10,000 people13.9506 16.6139
GDP growth rate12.7785 10.7496
Total64.30 74.48
Disclaimer/Publisher’s Note: The statements, opinions and data contained in all publications are solely those of the individual author(s) and contributor(s) and not of MDPI and/or the editor(s). MDPI and/or the editor(s) disclaim responsibility for any injury to people or property resulting from any ideas, methods, instructions or products referred to in the content.

