Article

Assessment of Desertification Dynamics in Arid Coastal Areas by Integrating Remote Sensing Data and Statistical Techniques

1
Desert Research Center, El Matariya11753, Egypt
2
Geography Department, Umm Al-Qura University, Makkah 21955, Saudi Arabia
3
Geology Department, Tanta University, Tanta 31527, Egypt
4
Department of Earth and Ocean Sciences, University of North Carolina Wilmington, 601 South College Road, Wilmington, NC 28403-5944, USA
*
Author to whom correspondence should be addressed.
Sustainability 2024, 16(11), 4527; https://doi.org/10.3390/su16114527
Submission received: 21 March 2024 / Revised: 15 May 2024 / Accepted: 21 May 2024 / Published: 27 May 2024
(This article belongs to the Section Environmental Sustainability and Applications)

Abstract

:
Arid coastal regions are threatened by land desertification, which poses a serious threat to desert ecosystems, urban areas, and sustainability on a local as well as global scale. The present study aims to map desertification and the degree of its severity over the Jazan province on the western coast of Saudi Arabia. This investigation was conducted through the integration of remote sensing data (2001 and 2020) and statistical techniques. A scatter diagram, Karl Pearson correlation coefficient, and significance p-value test were performed on various spectral indices and tasseled cap transformation (TCT) derivative matrices to determine the strong significant relation of the spectral indices combination. Based on these analyses, the desertification degree index (DDI) was developed using a NDVI–TCG combination. The desertification grades were mapped and categorized into five classes, namely, non-desertification, low, moderate, severe, and extreme desertification. The results indicated that the spatial distribution of desertification grades declined from west to east during the period from 2001 to 2020. The degree of desertification improved during the study period since there was a significant reduction in extremely serious desertification land by 15.5% and an increase in weak desertification land by 7.8%. The dynamic changes in the DDI classes in the Jazan province mainly involve transformation from extremely serious to serious, serious to moderate, and moderate to weak, with areas of 2268.1 km2, 1518.5 km2, and 1062.5 km2, respectively. Generally, over the 19-year period, the restoration of vegetated areas accounted for 41.99% of the total study area, while desertification degradation land represented 15.57% of the total area of the Jazan province.

1. Introduction

Desertification is a complex land degradation process affecting arid, semi-arid, and partially sub-humid regions [1,2], caused by human activity and climate change [3,4]. Desertification, a global, regional, and local issue, has been studied using various techniques, including empirical, remote sensing, and model-based approaches [5,6,7,8]. Over the past three decades, remote sensing data has been utilized for monitoring ecosystems and natural disasters such as landscape degradation of coastal deserts [9], drought [10], and desertification [11,12]. Remote sensing collects precise data, provides rapid updates, and analyzes imagery over long periods of time, aiding in combating desertification in arid and semiarid regions and minimizing its effects.
Several studies have identified desertification based on changes in vegetation, such as the normalized difference vegetation index (NDVI), the temperature vegetation dryness index (TDVI), the net primary productivity (NPP), and the vegetation coverage index (VCI) [13,14,15,16,17]. Some suggested that desertification might be extracted using NDVI–albedo feature space [18]. Some studies monitored desertification by establishing a quantitative relationship between the three thematic indices of tasseled cap transformation (TCT); (tasseled cap brightness, tasseled cap greenness, and tasseled cap wetness) [19,20,21]. The majority of previous studies used TCB–TCG or TCB–TCW models [19,22] to analyze desertification by calculating vegetation cover, but no studies used NDVI with TCT thematic indices.
Jazan is experiencing a decline in vegetation and cultivated land, leading to a decrease in biodiversity and contributing to droughts and desertification. Coastal degradation, possibly due to coastal development projects, is also a significant environmental issue [9,23]. Limited studies on desertification and land degradation in Jazan have been conducted, with NDVI being a single indicator that makes it difficult to determine overall desertification characteristics; such studies AL-Sheikh [24] and Abd El-Hamid et al. [25]. This deficit motivates us to establish a model based on two indices that can enable us to extract varying levels of desertification with a high discrimination among different land cover classes with a risk of desertification.
This study aims to (1) assess and monitor the desertification degree in the Jazan province from 2001 to 2020, (2) utilize eight combinations of different spectral indices (NDVI, TCG, TCB, TCW, LST, and surface albedo) to identify a pixel-based relationships, (3) use a number of statistical approaches (scatter diagram, Pearson correlation, and significant p-value test) to determine the most effective combination of spectral indices that contribute to desertification, (4) construct the desertification degree index (DDI) based on the strongest significant combination of the spectral indices, (5) validate the DDI classes based on ground data and high-resolution images, and (6) monitor maps and determine the transfer matrix of the desertification grades in the Jazan region.

2. Materials and Methods
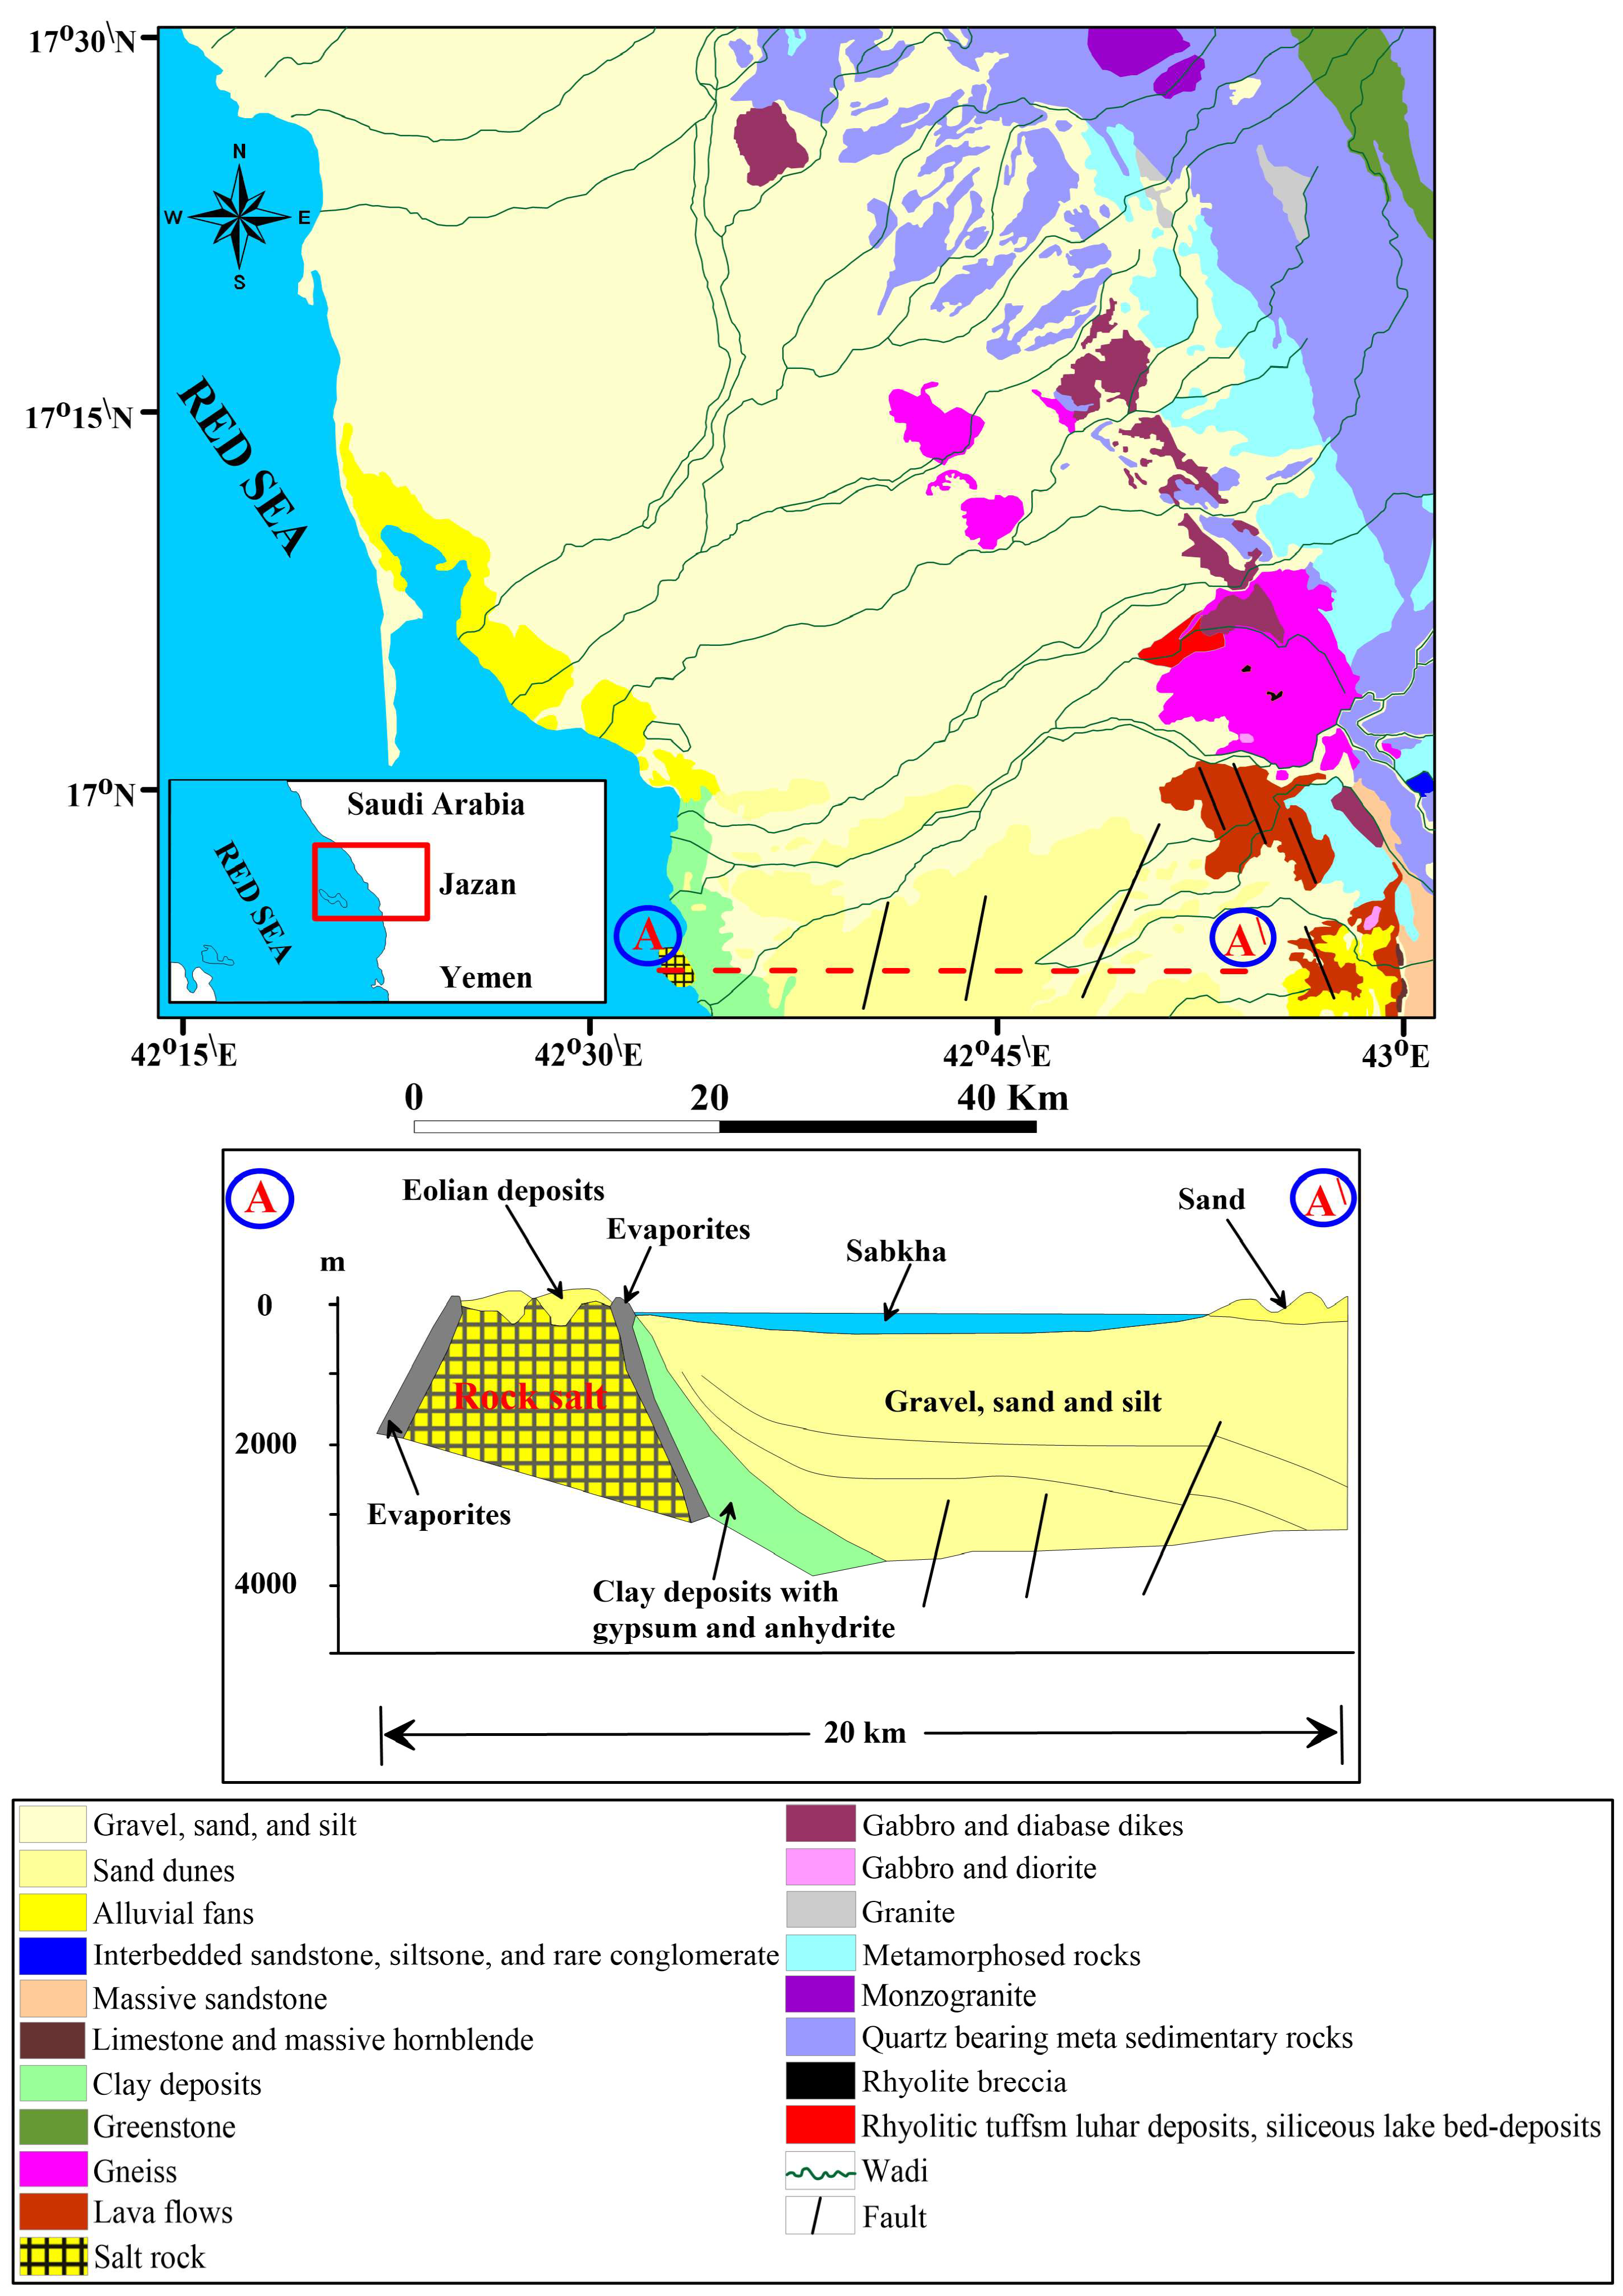
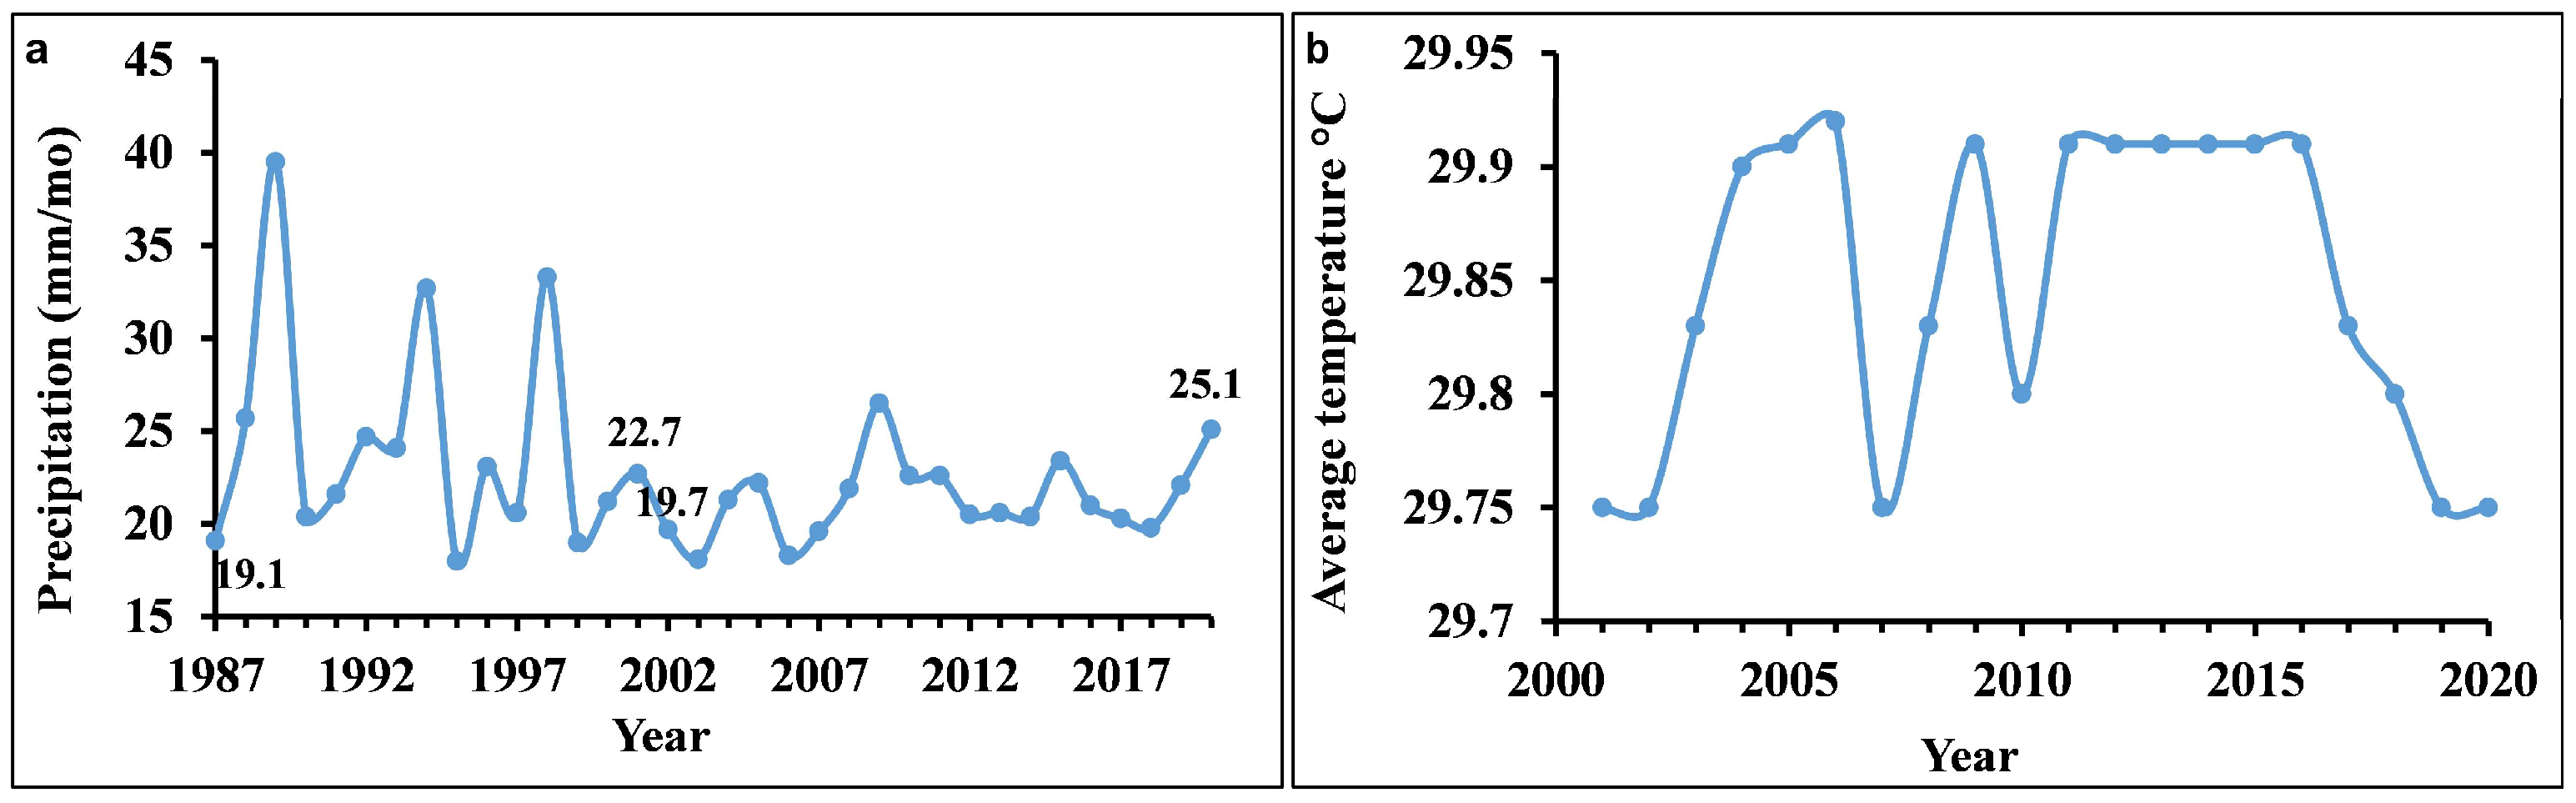
2.1. Study Area

The Jazan province is situated between latitudes 16°30′ and 17°45′ N and longitudes 42°31′20″ and 43°20′16″ E in the southwest of Saudi Arabia [13] (Figure 1), encompassing 16 governorates. The province of Jazan extends 300 km north of Yemen along the southern shore of the Red Sea and covers an area of 11,671 km2 [26]. Geographically, the province is divided into four distinct areas: the coastal plains, the highlands, the Sarawat Mountains, and the Farasan Islands. The Jazan region is part of the Precambrian Arabian Shield, composed of igneous and metamorphic rocks (Figure 2). A significant portion of Jazan is covered with alluvial deposits originating from the Red Sea shoreline. The coastal plains, ranging from 5–10 km in width and covered with Tertiary deposits, have experienced various tectonic movements.
The geological setting of Jazan reflects three major periods: early Tertiary sedimentary rocks deposited in the Arabian Shield during the Late Proterozoic, igneous and sedimentary rocks deposited on the Shield during the Cambrian and early Tertiary periods, and rocks deposited in the Red Sea basin from the middle Tertiary to the present day [27,28]. The area is characterized by a faulting and jointing pattern, with extensive grabens and horsts formed by faults running from NE to SW (Figure 2). A prominent characteristic of the study area is NE trending faults believed to be associated with Precambrian compressional forces acting from E to W. The Tertiary basaltic lava flow, resulting from faulting in the NNW and EW and a long fracture set in the NNW, is attributed to Tertiary tectonics [29].
Figure 2. A geologic map of the Jazan area in southwest Saudi Arabia, with surface cross section showing the different rock units, modified after [30]. The red box shows the location of the investigated area on Saudi Arabia.
Sustainability 16 04527 g002

2.2. Methodology

Figure 3 illustrates the main procedures of the study. The proposed method is based on analyzing the relationship between spectral indices using three statistical techniques to select a combination with a significant high relationship.

2.2.1. Multispectral Data and Image Processing

Over the past two decades, the desertification phenomena in the Jazan province have been assessed using remote sensing data. Landsat 7 and Landsat 8 images were acquired on 28 September 2001 and 10 October 2020, respectively (https://earthexplorer.usgs.gov/) (accessed on 20 October 2020). ArcGIS 10.8 software was employed to preprocess the remote sensing images. The preprocessing included radiometric calibration, atmospheric correction, image mosaic, and clipping depending on the domain of the study area.

2.2.2. Derivation of NDVI, Albedo, and LST Indices

NDVI (normalized vegetation index) serves as a biophysical indicator of vegetation cover. NDVI is derived from the ratio of atmospherically corrected reflectance of the red and near-infrared bands [31,32].
NDVI = (pnirpr)/(pnir + pr),
Albedo refers to how much energy a surface reflects and is a reflection of its physical characteristics. The Liang [33] inversion model was used to determine the surface albedo.
Albedo = ((0.356 × pblue) + (0.130 × pred) + (0.373 × pnir) + (0.085 × pswir1) + (0.072 × pswir2))/1.016,
LST (land surface temperature) was determined using the spectral radiance of the thermal band 6 of the satellite Landsat 7 and the thermal band 10 of Landsat 8. Chander et al. [34] and Silva et al. [35] outlined the procedures for converting Landsat 7 and Landsat 8 images to top of atmosphere radiance, respectively.
Lλ of band 6 = ((LMAX − LMIN)/(QCALMAX − QCALMIN)) × (QCAL − QCALMIN) + LMIN,
Lλ of band 10 = ML × QCAL + AL − Oi,
Allen et al. [36] developed the equation for calculating the LST in Celsius.
LST in Celsius = K2/Ln(K1/Lλ +1) − 273.15,
where Lλ = spectral radiance, QCAL = quantized calibrated pixel value in DN, LMAXλ = spectral radiance scaled to QCALMAX in (Watts/(m2·Sr·µm)), LMINλ = spectral radiance scaled to QCALMIN in (Watts/(m2·Sr·µm)), QCALMIN = minimum quantized calibrated pixel value in DN, QCALMAX = maximum quantized calibrated pixel value in DN, ML = radiance multiplicative band, AL = radiance add band, Oi = correction value for band 10 is 0.29, K2 = calibration constant 2, and K1 = calibration constant 1.

2.2.3. Tasseled Cap Transformation (TCT)

TCT is a method that converts spectral data into specific indicators without losing information about a scene’s characteristics [37]. It uses three thematic indices: tasseled cap brightness (TCB), tasseled cap greenness (TCG), and tasseled cap wetness (TCW) to detect overall brightness, vegetation coverage, and water and soil moisture, respectively. The transformation process was applied through coefficients on 7 bands of Landsat images (Blue, Green, Red, NIR, SWIR1, and SWIR2) to provide new indicators for brightness, greenness, and wetness. In accordance with Baig et al. [37], coefficients were applied to Landsat 8 bands to estimate TCTs’ indices., while Huang et al. [38] outlined coefficients for Landsat 7 bands.
For the purposes of data comparison and linear correlation, the NDVI, albedo, TCT, and LST values were normalized using the following equation:
Normalized Index = (Index − Indexmin)/(Indexmax − Indexmin),

2.2.4. Linear Correlation Analysis and Desertification Degree Index (DDI)

The research focuses on creating the DDI model by measuring the correlation between biophysical and physical characteristics of earth surfaces using three methods. ArcGIS 10.8 was used to create a fishnet with 921 points, assigning values of NDVI, albedo, TCB, TCG, TCW, and LST to each point. A scatter diagram, Karl Pearson correlation coefficient, and p-value were used to study the correlation and significance of a hypothesis test between these points. Correlation analysis for Jazan was carried out among NDVI–albedo, NDVI–TCG, NDVI–TCB, NDVI–TCW, NDVI–LST, TCG–TCB, TCW–TCB, and TCW–TCG. The two indices that show the most significant and strongest correlation were used to establish the DDI, and as a result the following linear regression equation was developed between the two indices.
y = Kx + b,
As a result the DDI value has been calculated as follows [17,18,22,39]:
DDI = ax − y,
where y is independent index, x is dependent index, k is slope of the curve, and a value was calculated using a = −1/k.
The DDI was categorized into five classes using the Jenks natural break classification algorithm (ArcGIS 10.8). Desertification phenomena in arid regions were successfully classified by this algorithm [18,39]. Jenks natural breaks are used to find the best arrangement of values into different categories through data clustering. In this method, the variance between classes is maximized, and the variance within classes is minimized [40,41].

2.2.5. Accuracy Assessment

The study used confusion matrix analysis to determine classification accuracy and reliability. This method identifies errors and inaccuracies in categories, including overall accuracy, user accuracy, producer accuracy, and Kappa coefficient. The calculation methods of the accuracy indices were outlined by [42], Table 1. A total of 215 validation points were randomly distributed over the study area to ensure accuracy. The results were examined using Landsat true color images and Google Earth Pro. The confusion matrix and accuracy indices were established using the results. A field campaign was conducted on 2 November 2020, to assess the accuracy of the 2020 DDI classes, including full vegetation coverage, partial vegetation coverage, sparse vegetation, and bright soil.

2.2.6. Creation of the DDI Classes Change Matrix

Lu et al. [43] developed a change detection method called classification change matrix, which describes the spatial distribution of changes in land classes [44]. ArcGIS 10.8 was used to analyze the temporal dynamics of desertification land classes, constructing a DDI transfer matrix. The change matrix showed changes in DDI classes between 2001 and 2020, assessing overall changes within the studied time periods.

3. Results

3.1. Derivation of NDVI, TCT Features, and LST

Remote sensing data was used to calculate NDVI, albedo, LST, and TCT indices, as shown in Figure 4 and Figure 5. Based on the NDVI and TCG results, the northeast and southeast parts of the study area (Ar-Rayth and Ad-Dayer governates and their surroundings) have the highest values of greenness in 2020 (Figure 4b and Figure 5d). However, vegetation cover in 2001 is limited to Ar-Rayth governorate and a few locations within the study area (Figure 4a and Figure 5c). According to the study, the Jazan region’s vegetation has grown and expanded between 2001 and 2020, with an increase in shrubs, grassland, and sparse vegetation (Figure 4a,b), indicating that the expansion is primarily caused by precipitation. Figure 6a displays the change in the rainfall rates in the Jazan region from 1987 to 2020 (https://en.climate-data.org/asia/saudi-arabia-29/) (accessed on 15 February 2023). Vegetation cover is directly related to precipitation, and we found an increase in these rates between 2001 and 2020. Therefore, we believe that precipitation was the most effective factor for increasing vegetation cover during this time.
Albedo and TCB are both measures of how much energy is reflected by the earth’s surface. Figure 4c and Figure 5a display the albedo and TCB values for 2001, respectively, while Figure 4d and Figure 5b illustrate the albedo and TCB values for 2020, respectively. Based on the analyses of albedo and TCB for 2001 and 2020, low values were found in the northeastern and southeastern parts of the study area, corresponding to areas with green vegetation cover. Conversely, the highest values, which reflect soils, are found in the central area along the shoreline until the Ad-Darb governorate in the north.
Regarding LST, the rates and distribution of temperatures are nearly similar for both 2001 and 2020 as shown in (Figure 4e,f), respectively. The LST of the Ar-Rayth and Ad-Dayer governorates and surrounding areas is distinguished by the lowest temperature, which ranges from 19 to 39 °C (https://ncm.gov.sa/ar/ accessed on 15 February 2023). LST reaches its highest values in the central region of the Jazan province where there is low, dense vegetation or barren areas and sand dunes. Desert areas have a higher LST due to lower moisture and more solar radiation [45]. The average temperature was measured in the Jazan province from 2001 to 2020, and was nearly 30 °C (https://en.climate-data.org/asia/saudi-arabia-29/) (accessed on 15 February 2023), (Figure 6b).
Figure 5e,f display the TCW features of 2001 and 2020, respectively. The TCW index determines soil moisture, and the highest TCW values were found in the northeast and southeast zones (related to green areas) and along the shoreline of Jazan (corresponding to water bodies and wetlands). The lowest values were located in the central parts of the Jazan province, representing dry areas, such as sand dunes and bright soils. Soil moisture areas in 2020 increase compared to 2001 due to the increase in vegetated cover as TCW is proportional with vegetated area.

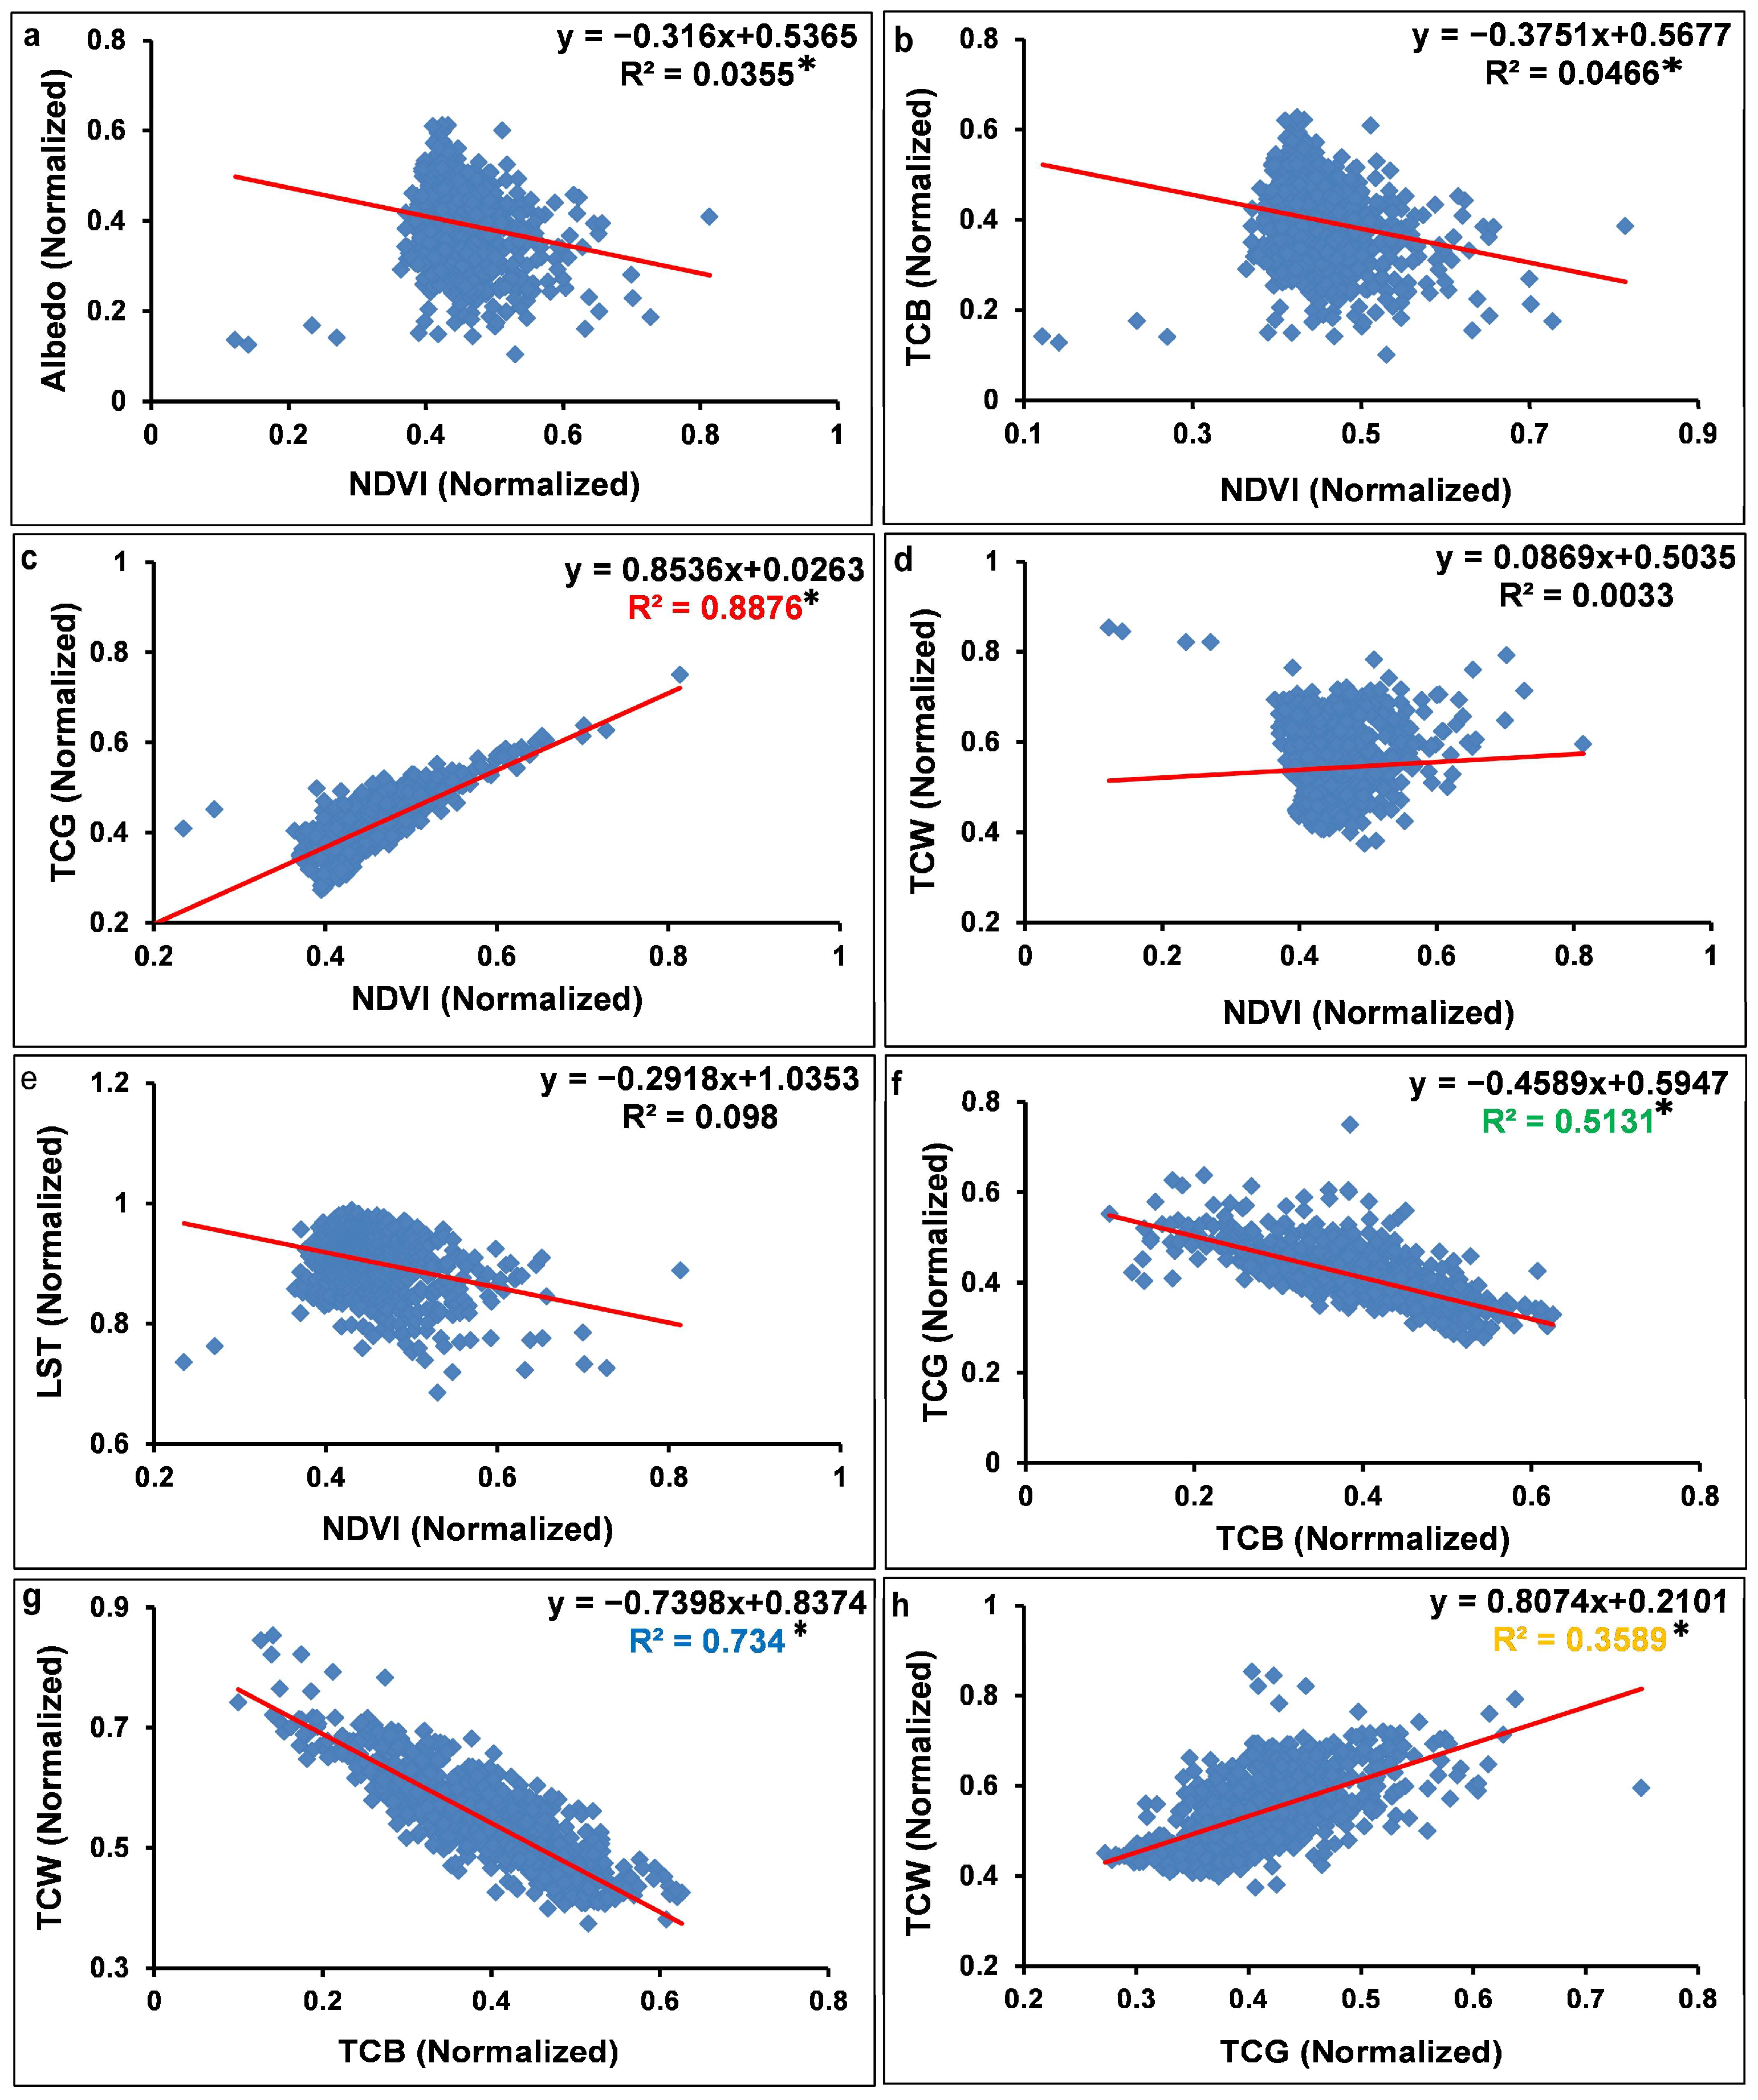
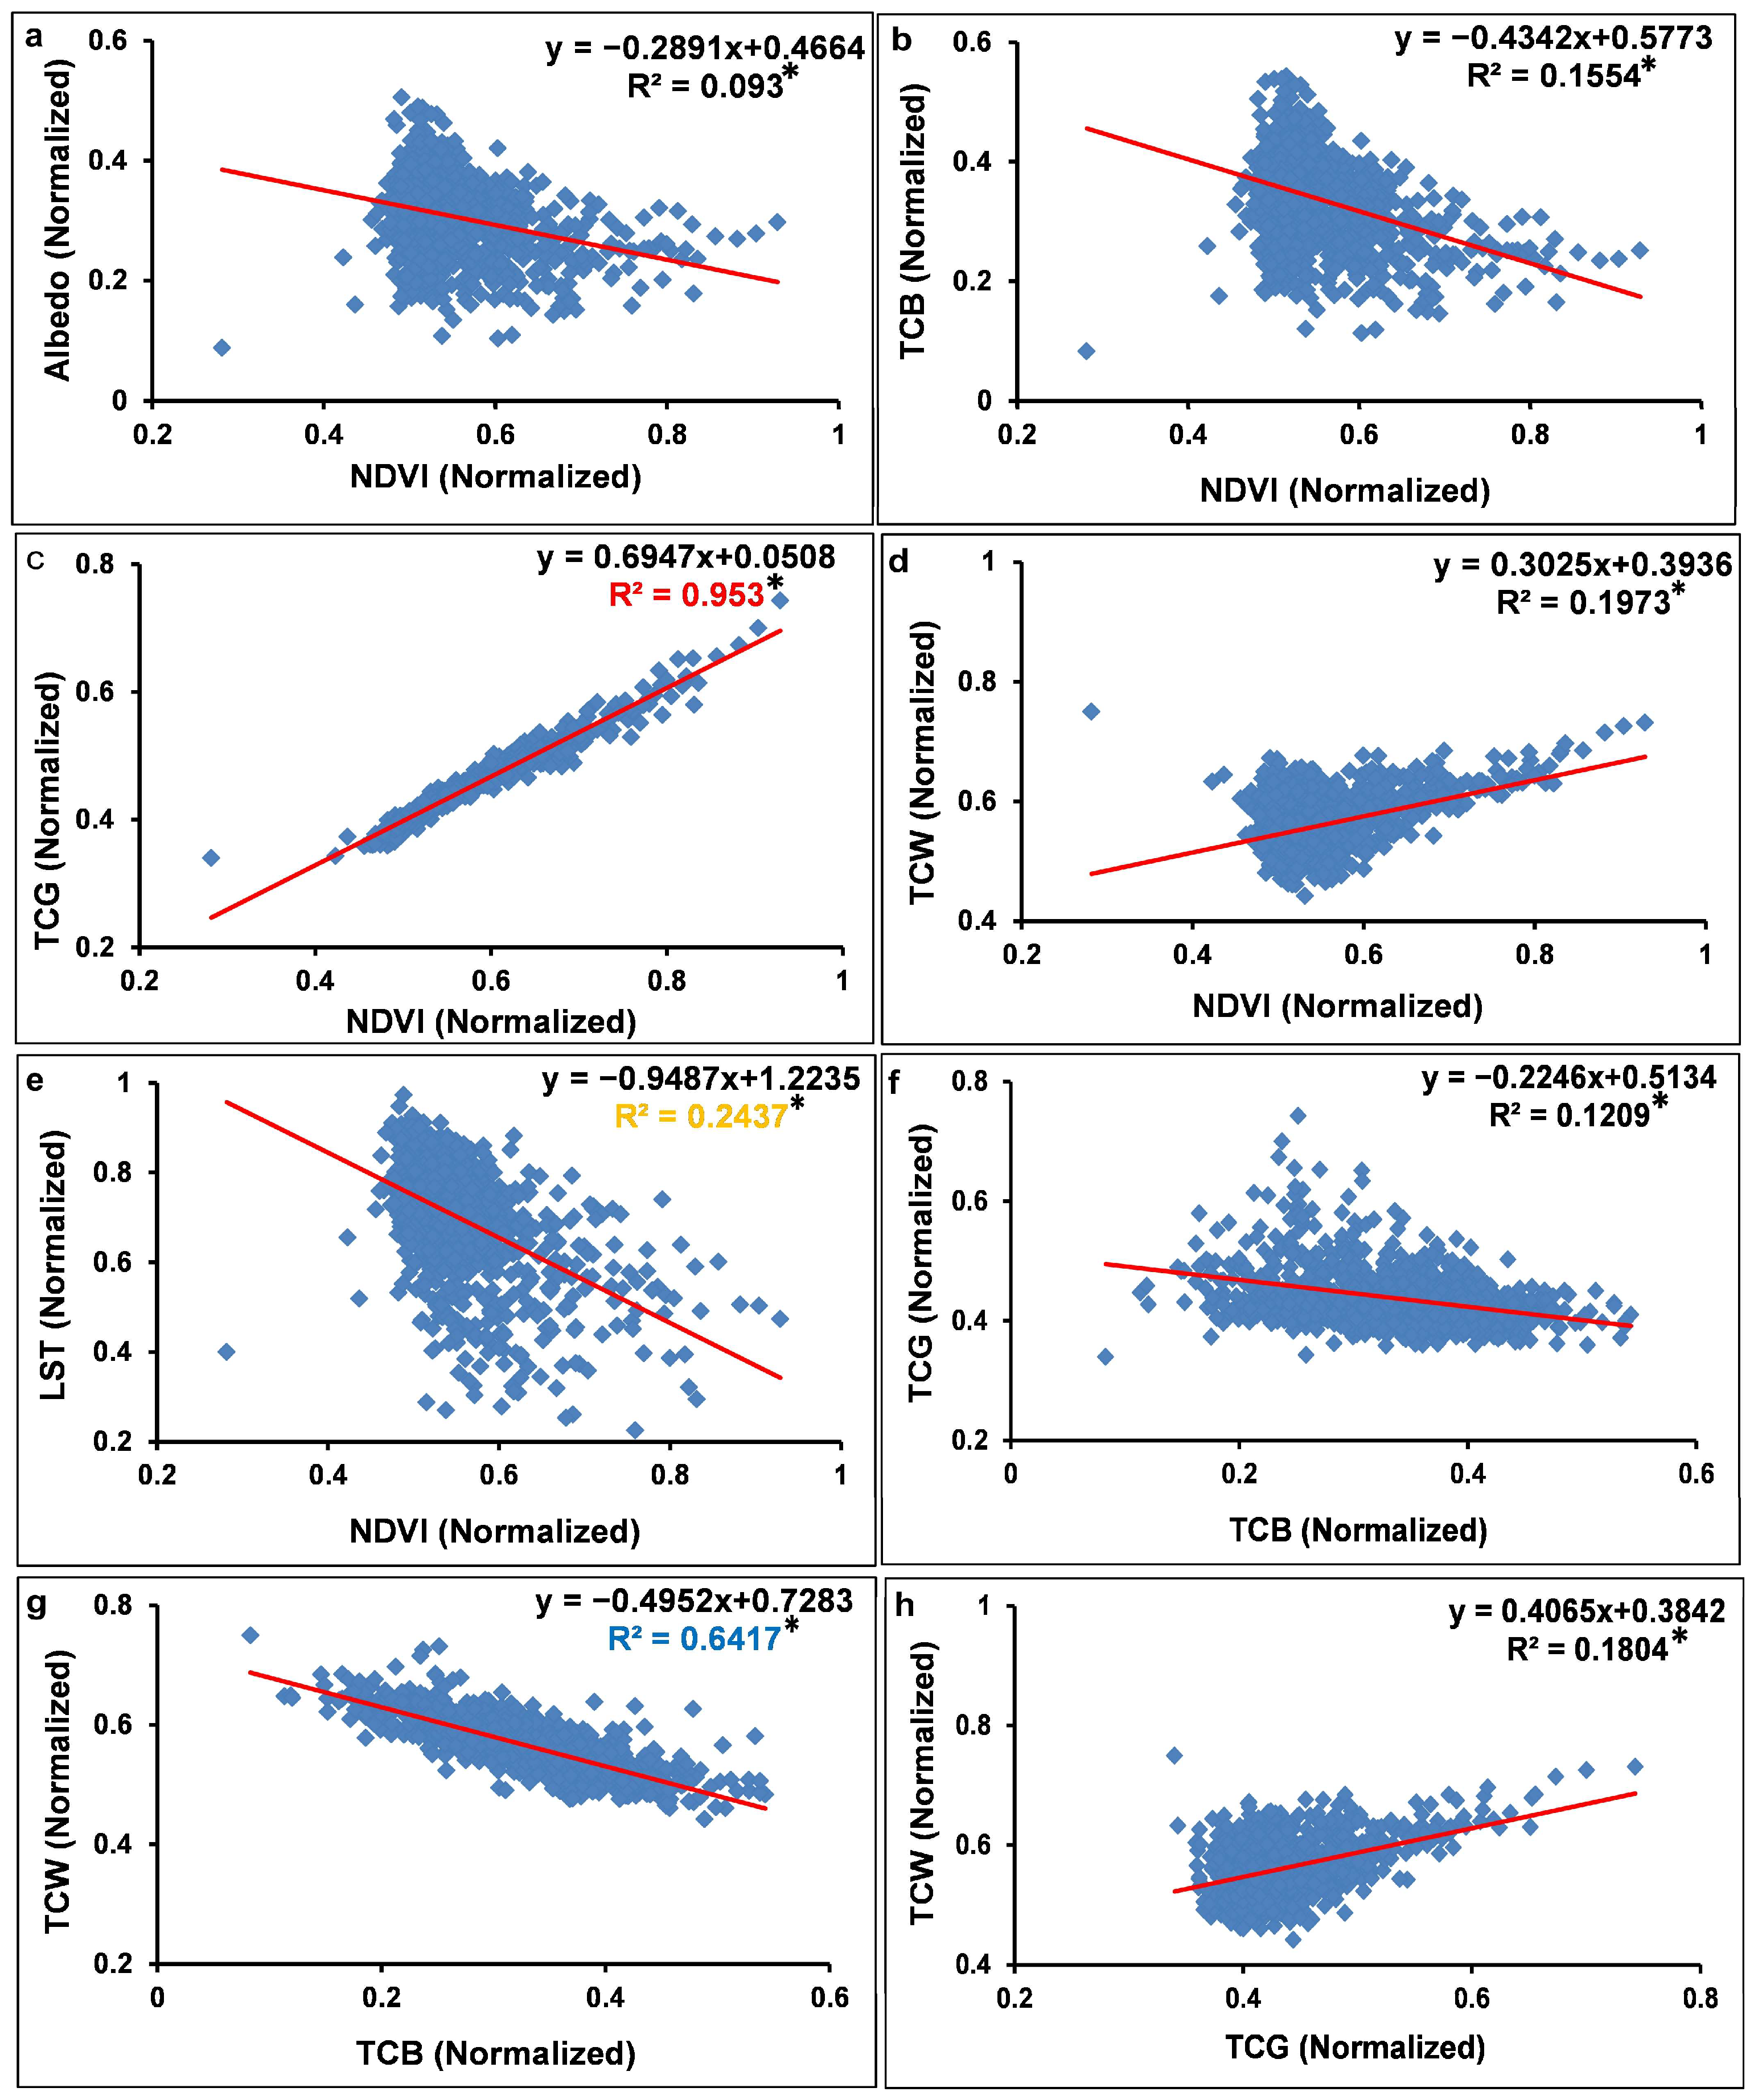
3.2. Linear Regression Analysis and the DDI Creation

The DDI serves as a direct indicator of vegetation degradation and land desertification [46]. There are several variables used to express the DDI since they impact it. The relations between these variables are managed and identified through various statistical analyses. By employing a scatter diagram, the Karl Pearson correlation coefficient, and by calculating the p-value, we can select the combination with the highest correlation and best visualization of different types of land classifications. Based on (Figure 7 and Figure 8), as well as Table 2, we show the linear correlations between the various biophysical and physical environmental parameters. The correlation analysis of the 2001 fishnet points revealed that the combination of NDVI–TCG has an adequate distribution around the best fit line (Figure 7), with a very strong significant relationship correlation (r = 0.79 and p-value < 0.05) (Table 2). TCB–TCG and TCB–TCW relationships display a strong significant correlation (r = −0.71 and p-value < 0.05) and (r = −0.70 and p-value < 0.05), respectively. A moderately significant correlation is found between TCG–TCW (r = 0.59 and p-value < 0.05). The combinations of NDVI–albedo and NDVI–TCB show a lower significant correlation, while NDVI–TCW and NDVI–LST have a lower non-significant correlation according to the Pearson correlation coefficient (Table 2).
Figure 8 shows that the 2020 variables have a significant and very strong correlation between NDVI–TCG with perfect coefficient values (r = 0.97 and p-value < 0.05) and optimum clustering around 1:1 line (Figure 8 and Table 2). A very high significant correlation was also found between TCB–TCW (r = −0.80 and p-value < 0.05). NDVI and LST have been identified as important indicators of soil moisture, as well as variations in the evaporation rate. As NDVI increases, the proportion of cool vegetation to warm soil increases, leading to a decrease in thermal emissions [47,48]. The NDVI–LST combination for 2020 shows a significant moderate correlation (r = −0.49 and p-value < 0.05) based on Pearson, (Table 2). The relationship between NDVI–TCW and TCG–TCW shows a significant moderate to low correlation as displayed in (Table 2). The findings revealed that there is a significant low relationship between vegetation cover (greenness) and the amount of reflected energy (brightness) as shown in the combinations of NDVI–albedo, NDVI–TCB, and TCB–TCG (Figure 8 and Table 2).
The evaluation of dynamic desertification can be made more reliable and acceptable by using two indices rather than employing single spectrum information. In this research DDI is expressed in terms of NDVI − tasseled cap greenness (TCG) combinations as follow:
DDI2001 = − 1.17 × NDVI − TCG,
DDI2020 = − 1.43 × NDVI − TCG,
Based on Jenks natural break algorithm [41], the DDI was categorized into five levels: non-desertification, weak, moderate, serious, and extremely serious. Figure 9 illustrates the spatial classification of the DDI in the Jazan province from 2001 to 2020. In 2001, areas classified as extremely serious to serious desertification lands were located in the southern parts extending northward, parallel to the coastline, including the Samtah, Ahad al-Masarihah, Abu Arish, Damad, Sabya, Bish, and Ad-Darb governorates. Moderate desertification areas extended in the eastern portion of the Jazan province except the Ar-Rayth, Al Harth, Fayfa, and Ad-Dayer regions, which were dominated by non- to weak desertification lands.
In 2020, desertification degrees decreased due to increased rainfall rates, and authorities are working to develop Jazan’s potential through various programs and initiatives in line with the Saudi Vision 2030’s goals, resulting in a noticeable decrease in desertification degrees compared to 2001. Therefore, the region has emerged as a top tourism destination in the Kingdom (https://www.undp.org/saudi-arabia/) (accessed on 2 October 2023). The weak and moderate desertification lands are distributed in the eastern, central, and southern parts, consequently extremely serious to serious desertification classes were obviously decreased, particularly in the south. Table 3 shows statistical data on DDI classes in the study area from 2001 to 2020. Extremely serious desertification experienced a significant degradation, from 31.86% in 2001 to 16.34% in 2020. Non- to weak desertification lands increased by two times, while moderate and serious classes experienced increases of 2.69% and 4.21%, respectively. DDI enhanced over the study period, as seen by the significant increase in the weak desertification class and the largest decrease in desertification lands was under the extremely serious class.

3.3. Accuracy Assessment of DDI Classes

The accuracy of the DDI classes was obtained using the confusion matrix of 215 points. Table 4 revealed that the Kappa coefficients of both the 2001 and 2020 images were over 95%, with overall accuracy of 0.97 and 0.94, meeting the requirements for desertification dynamics research in the region. Among them, the NDVI–TCG model has high production and user accuracy for all DDI classes (non-desertification, weak, moderate, serious, and extremely serious), implying that underestimation of these desertification levels is minimal. Also, it is evidence indicating a low multi-metric error in identifying DDI classes’ areas.
The validation results show that, in comparison to other common remote sensing techniques for desertification monitoring, the NDVI–TCG model can produce optimal results in both the extraction of desertification land and the classification of desertification degree with higher accuracy and efficiency.

3.4. The Dynamic Changes of DDI and Its Characteristics

A transfer matrix was used to assess the spatial distribution of desertification land and its characteristics between 2001 and 2020. Also, the matrix accurately quantifies the transformation process between different land types. Table 4 and Table 5 display the transfer matrix of the DDI classes and the areas of transformation. Figure 10 shows the spatial representation of dynamic changes in desertification land. Results show that 42.45% of Jazan province remained stable and did not experience any changes in desertification between 2001 and 2020. However, 57.55% of the total area was converted into another desertification class with the order of change being extremely serious, serious, moderate, weak, and non-desertification, in descending order.
The conversion of the DDI classes in the study area was from extremely serious to serious, serious to moderate, and moderate to weak with areas of 2268.1 km2, 1518.5 km2, and 1062.5 km2, respectively. Almost half of the area of extremely serious land is converted to other DDI classes, and it reaches 2332.3 km2. The area of the different types of DDI classes transformed to weak desertification land was 1166.5 km2. The Jazan province has experienced a significant increase in weak and moderate classes, while a decline in extremely serious classes due to the combination of natural environment and human activities.
Dynamic changes in DDI classes were spatially distributed in (Figure 10) and were classified into the following: obvious restoration (DDI class decreased by two or more grades), restoration (DDI class decreased to the adjacent grade), no change (DDI class remained stable), degradation (DDI class increased to the adjacent grade), and severe degradation (DDI increased by two or more grades). The spatial change dynamic of DDI classes indicates that between 2001 and 2020, the distribution of no change areas was scattered, particularly in the west and the central areas. The restoration and severe restoration regions are mostly concentrated in eastern areas including Samtah, Al Harth, Fayfa, and Ad Dair, while the degradation and obvious degradation areas are mainly located in the northeastern regions of the north Ad-Dayer governorate. The vegetation restoration area is 6304.78 km2 of the total area, which is larger than the vegetation degradation area (2337.6 km2), (Table 6).

4. Discussion

4.1. The Spectral Indicators and the Desertification Evalution

In this study, we utilized tasseled cap-derived indices, NDVI, albedo, and LST to monitor and assess the degree of desertification. Various statistical approaches were employed to determine the strongest significant correlation among the spectral indices. Based on the correlation analyses, a desertification degree model was developed using NDVI–TCG combination to construct a map depicting different desertification grades in the Jazan province. The NDVI and TCG index combination proved to be a simple and efficient method for quantitatively assessing and monitoring desertification grades in arid and semiarid areas, utilizing various satellites and sensors.
Similar to previous studies [18,39,40], the NDVI–albedo model did not exhibit good discrimination between land cover features due to its weak relationship (Table 2). The relationship between NDVI and surface albedo did not meet Equation (8) because dark soils, representing soils rich in organic matter, could be classified as low desertified lands [18]. Additionally, LST displayed weak to moderate correlation, indicating its inability to distinguish between various degrees of desertification, consistent with previous findings [49].
Researchers [19,50] have reported a strong negative correlation between TCW and TCB, suggesting that TCW–TCB can serve as a useful indicator for assessing vegetation and environment in arid and semi-arid areas. However, our study relied on the NDVI–TCG combination to establish a desertification map of the study area due to its higher correlation coefficient value compared to the TCW–TCB combination (Table 2, Figure 7 and Figure 8).

4.2. Desertification in the Jazan Province

In Jazan, land degradation and desertification have not been thoroughly monitored, and sophisticated investigations on this issue are lacking. EL-Sheikh’s [27] study was conducted prior to the time period of our research and investigated the environmental degradation in the Jazan province from 1987 to 2002 based on NDVI. The study revealed a significant degradation due to the decrease in the amount of rainfall. Abd El-Hamid et al. [28] utilized the NDVI and a statistical model to monitor vegetation cover during the periods 2008, 2014, and 2018. Their findings showed an increase in the NDVI from 2008 to 2014, followed by a decrease in vegetation cover in 2018. They attributed this increase to factors such as increasing rainfall rates and modest growth in agricultural activities, while the subsequent decrease was attributed to desertification resulting from urban sprawl. Their findings from 2008 to 2014 confirmed our results; it is mainly attributed to the increase in rainfall rates (Figure 6) and modest growth in agricultural activities.
Previous studies [24,25] utilized NDVI to monitor vegetation cover and environmental degradation over specific time periods. Our study stands out for establishing a DDI model based on the combination of two indices (NDVI–TCG). The evaluation of dynamic desertification can be made more credible and acceptable by using two indices instead of relying just on information from a single spectrum. Additionally, we tracked dynamic changes in desertification within the study area and verified the accuracy of our model, providing a more credible assessment of desertification dynamics.

5. Conclusions

In this study, we investigated the spatial and temporal changes in land desertification within the Jazan province over the past two decades from a spatiotemporal perspective. The proposed model was applied utilizing two indicators (NDVI and TCG) since the statistical analysis revealed the combination of NDVI–TCG. The DDI was applied to quantitatively map the desertification grades. The findings of the investigation indicate the following: (1) The proposed index (DDI) proves to be reliable for desertification monitoring, offering an accurate, precise, and efficient method solely reliant on remote sensing imagery for determining desertification levels; (2) Overall, there has been an improvement in the desertification situation within the study area, with a decrease in the severity of desertification grades; (3) From 2001 to 2020, the restoration of desertified land predominantly involved the transition from extremely serious to serious and from moderate to weak desertification, while the degradation of desertified land was mainly due to the transformation from moderate to serious desertification; (4) The desertification degree index increased due to the significant increase in weak and moderate classes and the decline in extremely serious classes; (5) The degree of conversion for each type of land affected by desertification follows the following order: extremely serious > serious > moderate > weak > non-desertification; (6) The restoration of desertified lands is primarily attributed to several factors, including increased rainfall, a modest rise in modern agricultural practices, and government initiatives aimed at agricultural reclamation.

Author Contributions

Conceptualization, O.A.A. and A.F.A.; methodology, S.S.H.; software, A.S.F.; validation, A.S.F., O.A.A. and S.S.H.; formal analysis, S.S.H.; investigation, O.A.A.; resources, A.S.F.; data curation, A.S.F.; writing—original draft preparation, S.S.H.; writing—review and editing, O.A.A. and A.F.A.; visualization, O.A.A.; supervision, O.A.A.; project administration, O.A.A. and A.S.F.; funding acquisition, O.A.A. and A.F.A. All authors have read and agreed to the published version of the manuscript.

Funding

This research received no external funding.

Institutional Review Board Statement

Not applicable.

Informed Consent Statement

Not applicable.

Data Availability Statement

The data are available when requested.

Conflicts of Interest

The authors declare no conflicts of interest.

References

  1. Wang, T.; Xue, X.; Zhou, L.; Guo, J. Combating Aeolian Desertification in Northern China. Land Degrad. Dev. 2012, 26, 118–132. [Google Scholar] [CrossRef]
  2. United Nations Environment (UNE). World Atlas of Desertification: Second Edition. 1997. Available online: https://wedocs.unep.org/xmlui/handle/20.500.11822/30300 (accessed on 25 August 2023).
  3. Lichtenberg, E.; Ding, C. Assessing farmland protection policy in China. Land Use Policy 2008, 25, 59–68. [Google Scholar] [CrossRef]
  4. Cui, Y. Interpretation and Dynamic Analysis in Desertification—A Case Study of Kubuqi Desert. Appl. Mech. Mater. 2013, 295–298, 2102–2106. [Google Scholar] [CrossRef]
  5. Liu, S.; Wang, T. Aeolian desertification from the mid-1970s to 2005 in Otindag Sandy Land, Northern China. Environ. Geol. 2007, 51, 1057–1064. [Google Scholar] [CrossRef]
  6. Li, J.; Yang, X.; Jin, Y.; Yang, Z.; Huang, W.; Zhao, L.; Gao, T.; Yu, H.; Ma, H.; Qin, Z.; et al. Monitoring and analysis of grassland desertification dynamics using Landsat images in Ningxia, China. Remote Sens. Environ. 2013, 138, 19–26. [Google Scholar] [CrossRef]
  7. Ding, H.P.; Jianping, C.; Wang, G. A model for desertification evolution employing GIS with cellular automata. Comput. Model. Simul. 2009, 39, 324–328. [Google Scholar]
  8. Xue, Z.; Qin, Z.; Li, H.; Ding, G.; Meng, X. Evaluation of aeolian desertification from 1975 to 2010 and its causes in northwest Shanxi Province, China. Glob. Planet. Chang. 2013, 107, 102–108. [Google Scholar] [CrossRef]
  9. Alharbi, O.A.; Rangel-Buitrago, N. Landscape degradation in the Jazan coastal desert: Understanding the impact of human activities. Mar. Pollut. Bull. 2023, 190, 114874. [Google Scholar] [CrossRef]
  10. Mehravar, S.; Amani, M.; Moghimi, A.; Javan, F.D.; Samadzadegan, F.; Ghorbanian, A.; Stein, A.; Mohammadzadeh, A.; Mirmazloumi, S.M. Temperature-Vegetation-soil Moisture-Precipitation Drought Index (TVMPDI); 21-Year Drought Monitoring in Iran using Satellite Imagery within Google Earth Engine. Adv. Space Res. 2021, 68, 4573–4593. [Google Scholar] [CrossRef]
  11. Yang, G.; Chen, D.; He, X.L.; Long, A.H.; Yang, M.J.; Li, X.L. Land use change characteristics affected by water saving practices in Manas River Basin, China using Landsat satellite images. Int. J. Agric. Biol. Eng. 2017, 10, 6. [Google Scholar] [CrossRef]
  12. Meng, D.; Zhang, Z.; Yang, T.; Gong, H.; Zhao, W.; Li, X.; Gong, Z.; Wang, Y.; Hu, Z.; Sun, Y. Research on dynamic evolvement of desertification in Beijing and its neighboring areas by remote sensing. In Proceedings of the 2007 IEEE International Geoscience and Remote Sensing Symposium, Barcelona, Spain, 23–28 July 2007; p. 701. [Google Scholar] [CrossRef]
  13. Bai, Z.G.; Dent, D.L.; Olsson, L.; Schaepman, M.E. Proxy global assessment of land degradation. Soil Use Manag. 2008, 24, 223–234. [Google Scholar] [CrossRef]
  14. De Jong, R.; de Bruin, S.; de Wit, A.; Schaepman, M.E.; Dent, D.L. Analysis of monotonic greening and browning trends from global NDVI time-series. Remote Sens. Environ. 2011, 115, 692–702. [Google Scholar] [CrossRef]
  15. Fensholt, R.; Horion, S.; Tagesson, T.; Ehammer, A.; Grogan, K.; Tian, F.; Huber, S.; Verbesselt, J.; Prince, S.D.; Tucker, C.J.; et al. Assessment of Vegetation Trends in Drylands from Time Series of Earth Observation Data. In Remote Sensing Time Series: Revealing Land Surface Dynamics; Kuenzer, C., Dech, S., Wagner, W., Eds.; Remote Sensing and Digital Image Processing; Springer International Publishing: Cham, Switzerland, 2015; pp. 159–182. [Google Scholar] [CrossRef]
  16. Andela, N.; Liu, Y.Y.; van Dijk, A.I.J.M.; de Jeu, R.A.M.; McVicar, T.R. Global changes in dryland vegetation dynamics (1988–2008) assessed by satellite remote sensing: Comparing a new passive microwave vegetation density record with reflective greenness data. Biogeosciences 2013, 10, 6657–6676. [Google Scholar] [CrossRef]
  17. Feng, Y.; Wang, S.; Zhao, M.; Zhou, L. Monitoring of Land Desertification Changes in Urat Front Banner from 2010 to 2020 Based on Remote Sensing Data. Water 2022, 14, 1777. [Google Scholar] [CrossRef]
  18. Ma, Z.; Xie, Y.; Jiao, J.; Li, L.; Wang, X. The Construction and Application of an Aledo-NDVI Based Desertification Monitoring Model. Procedia Environ. Sci. 2011, 10, 2029–2035. [Google Scholar] [CrossRef]
  19. Lamqadem, A.A.; Saber, H.; Pradhan, B. Quantitative Assessment of Desertification in an Arid Oasis Using Remote Sensing Data and Spectral Index Techniques. Remote Sens. 2018, 10, 1862. [Google Scholar] [CrossRef]
  20. Kauth, R.; Thomas, G. The Tasselled Cap—A Graphic Description of the Spectral-Temporal Development of Agricultural Crops as Seen by LANDSAT. LARS Symp. 1976, 159, 41–51. Available online: https://docs.lib.purdue.edu/lars_symp/159 (accessed on 25 August 2023).
  21. Schoenert, M.; Weichelt, H.; Zillmann, E.; Jürgens, C. Derivation of Tasseled Cap Coefficients for RapidEye data. Proc. SPIE 2014, 9245, 153–163. [Google Scholar] [CrossRef]
  22. Jing-hu, P.; Xiaojuan, Q. Extracting desertification from landsat imagery using a feature space composed of vegetation index and albedo—A case study of Zhangye oasis and its adjacent areas. Sci. Surv. Mapp. 2010, 35, 193–195. Available online: https://www.semanticscholar.org/paper/Extracting-desertification-from-landsat-imagery-a-Jing-hu-Xiaojuan/7801b552c6e31abdd26554e51954d7c76ade7738 (accessed on 15 August 2023).
  23. Feoli, E.; Vuerich, L.G.; Zerihun, W. Evaluation of environmental degradation in northern Ethiopia using GIS to integrate vegetation, geomorphological, erosion and socio-economic factors. Agric. Ecosyst. Environ. 2002, 91, 313–325. [Google Scholar] [CrossRef]
  24. AL-Sheikh, A.B.Y. Environmental degradation and its impact on tourism in Jazan, KSA using Remote Sensing and GIS. Int. J. Environ. Sci. 2012, 3, 421–432. [Google Scholar] [CrossRef]
  25. El-Hamid, H.T.A.; Hafiz, M.A.; Wenlong, W.; Qiaomin, L. Detection of Environmental Degradation in Jazan Region on the Red Sea, KSA, Using Mathematical Treatments of Remote Sensing Data. Remote Sens. Earth Syst. Sci. 2019, 2, 183–196. [Google Scholar] [CrossRef]
  26. General Authority for Statistics. Population Characteristic Surveys. Available online: https://www.stats.gov.sa/en/5655 (accessed on 13 August 2023).
  27. Blank, H.R.; Johnson, P.; Gettings, M.E.; Simmons, G.C. Explanatory Notes to the Geologic Map of the Jizan Quadrangle; Deputy Ministry for Mineral Resources, Ministry of Petroleum and Mineral Resources: Jiddah, Saudi Arabia, 1985. [Google Scholar]
  28. El Sabrouti, M.A. Texture and mineralogy of the surface sediments of Sharm Obhur, west Red Sea coast of Saudi Arabia. Mar. Geol. 1983, 53, 103–116. [Google Scholar] [CrossRef]
  29. Basahel, A.N.; Bahafzalla, A.; Mansour, H.H.; Omara, S. Primary sedimentary structures and depositional environments of the Haddat Ash Sham sedimentary sequence, northeast of Jeddah, Saudi Arabia. Arab. Gulf J. Sci. Res. 1983, 1, 143–156. [Google Scholar]
  30. Batayneh, A.; Elawadi, E.; Mogren, S.; Ibrahim, E.; Qaisy, S. Groundwater quality of the shallow alluvial aquifer of Wadi Jazan (Southwest Saudi Arabia) and its suitability for domestic and irrigation purpose. Sci. Res. Essays 2012, 7, 352–364. [Google Scholar]
  31. Zabel, F.; Hank, T.B.; Mauser, W. Improving arable land heterogeneity information in available land cover products for land surface modelling using MERIS NDVI data. Hydrol. Earth Syst. Sci. 2010, 14, 2073–2084. [Google Scholar] [CrossRef]
  32. Lin, X.; Niu, J.; Berndtsson, R.; Yu, X.; Zhang, L.; Chen, X. NDVI Dynamics and Its Response to Climate Change and Reforestation in Northern China. Remote Sens. 2020, 12, 4138. [Google Scholar] [CrossRef]
  33. Liang, S.; Shuey, C.J.; Russ, A.L.; Fang, H.; Chen, M.; Walthall, C.L.; Daughtry, C.S.; Hunt, R. Narrowband to broadband conversions of land surface albedo: II. Validation. Remote Sens. Environ. 2003, 84, 25–41. [Google Scholar] [CrossRef]
  34. Chander, G.; Markham, B.L.; Helder, D.L. Summary of current radiometric calibration coefficients for Landsat MSS, TM, ETM+, and EO-1 ALI sensors. Remote Sens. Environ. 2009, 113, 893–903. [Google Scholar] [CrossRef]
  35. Silva, B.B.D.; Braga, A.C.; Braga, C.C.; de Oliveira, L.M.; Montenegro, S.M.; Barbosa, B., Jr. Procedures for calculation of the albedo with OLI-Landsat 8 images: Application to the Brazilian semi-arid. Rev. Bras. Eng. Agríc. Ambient. 2016, 20, 3–8. [Google Scholar] [CrossRef]
  36. Allen, R.G.; Tasumi, M.; Trezza, R.; Waters, R.; Bastiaanssen, W. “MET-479-Waters-et-al-SEBAL.pdf.” in Advance Training and Users Manual–Idaho Implementation. 2002. Available online: https://posmet.ufv.br (accessed on 13 August 2023).
  37. Baig, M.H.A.; Zhang, L.; Shuai, T.; Tong, Q. Derivation of a tasselled cap transformation based on Landsat 8 at-satellite reflectance. Remote Sens. Lett. 2014, 5, 423–431. [Google Scholar] [CrossRef]
  38. Huang, C.; Wylie, B.; Yang, L.; Homer, C.; Zylstra, G. Derivation of a tasselled cap transformation based on Landsat 7 at-satellite reflectance. Int. J. Remote Sens. 2002, 23, 1741–1748. [Google Scholar] [CrossRef]
  39. Pan, J.; Li, T. Extracting desertification from Landsat TM imagery based on spectral mixture analysis and Albedo-Vegetation feature space. Nat. Hazards 2013, 68, 915–927. [Google Scholar] [CrossRef]
  40. Becerril-Piña, R.; Delgado, C.D.; Mastachi, C.; Sosa, E.G. Integration of remote sensing techniques for monitoring desertification in Mexico. Hum. Ecol. Risk Assess. 2016, 22, 1323–1340. [Google Scholar] [CrossRef]
  41. Jenks, G.F. Generalization in Statistical Mapping. Ann. Assoc. Am. Geogr. 1963, 53, 15–26. [Google Scholar] [CrossRef]
  42. Prasad, S.V.S.; Savithri, D. Techniques in Image Classification; A Survey by Mr. 2015. Available online: https://www.semanticscholar.org/paper/Techniques-in-Image-Classification-%3B-A-Survey-By-Mr-Prasad-Savithri/32acc00da16974a93c66834d5016d7ecb2150482 (accessed on 13 December 2023).
  43. Lu, D.; Mausel, P.; Brondízio, E.; Moran, E. Change detection techniques. Int. J. Remote Sens. 2004, 25, 2365–2401. [Google Scholar] [CrossRef]
  44. Liu, D.; Li, B.; Liu, X.; Warrington, D.N. Monitoring land use change at a small watershed scale on the Loess Plateau, China: Applications of landscape metrics, remote sensing and GIS. Environ. Earth Sci. 2011, 64, 2229–2239. [Google Scholar] [CrossRef]
  45. Tian, F.; Qiu, G.; Yang, Y.; Xiong, Y.J.; Wang, P. Studies on the Relationships Between Land Surface Temperature and Environmental Factors in an Inland River Catchment Based on Geographically Weighted Regression and MODIS Data. IEEE J. Sel. Top. Appl. Earth Obs. Remote Sens. 2012, 5, 687–698. [Google Scholar] [CrossRef]
  46. Rahman, M.M.; Szabó, G. Impact of Land Use and Land Cover Changes on Urban Ecosystem Service Value in Dhaka, Bangladesh. Land 2021, 10, 793. [Google Scholar] [CrossRef]
  47. Goetz, S.J. Multi-sensor analysis of NDVI, surface temperature and biophysical variables at a mixed grassland site. Int. J. Remote Sens. 1997, 18, 71–94. [Google Scholar] [CrossRef]
  48. Kustas, W.P.; Moran, M.S.; Humes, K.S.; Stannard, D.I.; Pinter, P.J.; Hipps, L.E.; Swiatek, E.; Goodrich, D.C. Surface energy balance estimates at local and regional scales using optical remote sensing from an aircraft platform and atmospheric data collected over semiarid rangelands. Water Resour. Res. 1994, 30, 1241–1259. [Google Scholar] [CrossRef]
  49. Duan, H.; Wang, T.; Xue, X.; Yan, C. Dynamic monitoring of aeolian desertification based on multiple indicators in Horqin Sandy Land, China. Sci. Total Environ. 2019, 650, 2374–2388. [Google Scholar] [CrossRef] [PubMed]
  50. Crist, E.P.; Laurin, R.; Cicone, R.C. Vegetation and Soils Information Contained in Transformed Thematic Mapper Data. Available online: http://www.ciesin.org/docs/005-419/005-419.html (accessed on 21 April 2024).
Figure 1. Location map of the area under investigation.
Sustainability 16 04527 g001
Figure 3. The proposed methodology flowchart of the study area.
Sustainability 16 04527 g003
Figure 4. NDVI, albedo, and LST during the study period (2001 and 2020).
Sustainability 16 04527 g004
Figure 5. Tasseled cap transformation features during the study period 2001 and 2020.
Sustainability 16 04527 g005
Figure 6. (a) Precipitation rate in Jazan province from 1987 to 2020 and (b) average temperature in study area from 2001 to 2020.
Sustainability 16 04527 g006
Figure 7. Linear regression relationships of biophysical and physical variables (year 2001); (a) NDVI – albedo combination; (b) NDVI – TCB; (c) NDVI – TCG; (d) NDVI – TCW; (e) NDVI – LST; (f) TCB – TCG; (g) TCB – TCW; (h) TCG − TCW. R2 values listed in red font indicate very high correlation; blue font indicates high correlation; values mentioned in green font indicate intermediate correlation; yellow font indicates weak correlation, and black font indicates very weak correlation. * p-value < 0.05 regression is statistically significant.
Sustainability 16 04527 g007
Figure 8. (ah). Linear regression relationships of biophysical and physical variables (year 2020); (a) NDVI – albedo combination; (b) NDVI – TCB; (c) NDVI – TCG; (d) NDVI – TCW; (e) NDVI – LST; (f) TCB – TCG; (g) TCB – TCW; (h) TCG − TCW. R2 values given in red font indicate very high correlation; blue font indicates high correlation; yellow font indicates weak correlation; and black font reflects very weak correlation). * p-value < 0.05 regression is statistically significant.
Sustainability 16 04527 g008
Figure 9. Spatial distribution of desertification classes: (1) non-desertification, (2) weak, (3) moderate, (4) serious, (5) extremely serious.
Sustainability 16 04527 g009
Figure 10. Spatial distributions of dynamic changes of DDI in Jazan province.
Sustainability 16 04527 g010
Table 1. Accuracy indices and their calculation equations [42].
IndexEquationAbbreviations
Overall accuracy i = 1 r x i i x 100 (9)r the number of rows and columns in the confusion matrix
n the total number of pixels in the confusion matrix
xii major diagonal element for class i
xi+ count of pixels in row i
x+i count of pixels in column i
User accuracy x i i i = 1 r x i + 100 (10)
Producer accuracy x i i i = 1 r x + i 100 (11)
Kappa coefficient n i = 1 r x i i i = 1 r x i + x + i n 2 i = 1 r x i + x + i 100 (12)
Table 2. Linear correlation analysis of biophysical and physical parameters based on Pearson correlation coefficient.
Pearson Correlation Coefficient (r)
2001NDVI–albedo−0.18 *
NDVI–TCB−0.21 *
NDVI–TCG0.79 *
NDVI–TCW0.05
NDVI–LST−0.31
TCB–TCG−0.71 *
TCB–TCW−0.70 *
TCG–TCW0.59 *
2020NDVI–albedo−0.30 *
NDVI–TCB−0.39 *
NDVI–TCG0.97 *
NDVI–TCW0.44 *
NDVI–LST−0.49 *
TCB–TCG−0.34 *
TCB–TCW−0.80 *
TCG–TCW0.42 *
Values listed in red font indicate very high correlation; blue font indicates high correlation; values listed in green font indicate intermediate correlation; yellow font indicates weak correlation; and black font indicates very weak correlation. * p-value < 0.05 correlation is statistically significant.
Table 3. Classes of DDI in the study area during 2001and 2020.
DDI Classes20012020
Area (km2)%Area (km2)%
Non-desertification2271.51356.702.37
Weak1122.177.472288.6915.23
Moderate3420.0322.763823.2025.45
Serious5468.4336.406101.3440.61
Extremely serious4787.3031.86245516.34
Table 4. The accuracy assessment of the DDI classes (%).
DDI Classes20012020
User’sProducer’sUser’sProducer’s
Non-desertification10095.410095.7
Weak95.910092.392.3
Moderate96.896.895.494
Serious97.392.593.898.7
Extremely serious97.610010095.5
Kappa96.495.8
Overall97.294.3
Table 5. Transition matrix of DDI classes in the study area (km2).
DDI Classes2020
Non-
Desertification
WeakModerateSeriousExtremely SeriousTotal Reduced
2001Non-
desertification
54.193.842.632.44226.9
Weak97.3489.6366.1146.122.61121.6
Moderate1061062.51284.5843.8121.53418.4
Serious44.3504.11518.52819.5580.15466.4
Extremely serious23.5144.7620.52268.11726.64783.4
Total increased325.12294.83832.16109.92454.815,016.7
Table 6. The dynamic change of DDI classes in the study area.
Severe
Degradation
DegradationNo ChangeRestorationObvious Restoration
Area (km2)369.491968.116374.344737.091567.69
%2.4613.1142.4531.5510.44
Disclaimer/Publisher’s Note: The statements, opinions and data contained in all publications are solely those of the individual author(s) and contributor(s) and not of MDPI and/or the editor(s). MDPI and/or the editor(s) disclaim responsibility for any injury to people or property resulting from any ideas, methods, instructions or products referred to in the content.

