Article

Investigating the Correlation between Air Pollution and Housing Prices in Seoul, South Korea: Application of Explainable Artificial Intelligence in Random Forest Machine Learning

1
Department of Urban Planning and Real Estate, Dankook University, Yongin 16890, Republic of Korea
2
School of Urban Planning and Real Estate Studies, Dankook University, Yongin 16890, Republic of Korea
*
Author to whom correspondence should be addressed.
Sustainability 2024, 16(11), 4453; https://doi.org/10.3390/su16114453
Submission received: 5 March 2024 / Revised: 21 May 2024 / Accepted: 22 May 2024 / Published: 24 May 2024

Abstract

:
South Korea’s Particulate Matter (PM) concentration is among the highest among Organization for Economic Cooperation and Development (OECD) member countries. However, many studies in South Korea primarily focus on housing characteristics and the physical built environment when estimating apartment prices, often neglecting environmental factors. This study investigated factors influencing apartment prices using transaction data for Seoul apartments provided by the Ministry of Land, Infrastructure, and Transport (MOLIT) in 2019. For this purpose, the study compared and analyzed a traditional hedonic price model with a machine learning-based random forest model. The main findings are as follows: First, the evaluation results of the traditional hedonic price model and the machine learning-based random forest model indicated that the random forest model was found to be more suitable for predicting apartment prices. Second, an importance analysis using Explainable Artificial Intelligence (XAI) showed that PM is more important in determining apartment prices than access to education and bus stops, which were considered in this study. Finally, the study found that areas with higher concentrations of PM tend to have higher apartment prices. Therefore, when proposing policies to stabilize apartment prices, it is essential to consider environmental factors. Furthermore, it is necessary to devise measures such as assigning PM labels to apartments during the home purchasing process, enabling buyers to consider PM and obtain relevant information accordingly.

1. Introduction

Approximately 90% of the world’s population resides in areas where the air quality exceeds the standards set by the World Health Organization (WHO) [1]. Air pollution poses a global risk, leading to high rates of disease and mortality [2], and damages various economic sectors, such as manufacturing, agriculture, and transportation [3]. Moreover, global deaths attributable to air pollution exposure have increased by 51% since 1990, and without more appropriate measures, they are estimated to double by 2050 [4,5]. As such, air pollution is recognized as a very serious problem worldwide. Among these, particulate matter (PM) is more harmful to human health than other air pollutants. Prolonged exposure to high PM levels increases the risk of respiratory diseases and diabetes [6,7]. Long-term exposure to PM2.5 significantly increases the risk of cancer as well as cardiovascular and respiratory diseases [8,9]. Therefore, the International Agency for Research on Cancer, a WHO subsidiary, has classified PM as a Group 1 carcinogen [10]. PM concentrations in South Korea are extremely high. As of 2019, South Korea’s annual average PM10 concentration was 42 μm/m3, which is approximately 2.8 times higher than the WHO standard of 15 μm/m3. PM2.5 recorded a level of 23 μm/m3, which is more than 4 times higher than the WHO standard of 5 μm/m3. Therefore, urgent efforts to reduce PM emissions in South Korea are crucial.
In South Korea, with improvements in income and education levels alongside economic growth, there is a growing demand for pleasant residential environments, and people are showing an increasing interest in neighborhood environments. Air quality significantly affects the choice of residence and housing [3]. Considering the importance of housing as a fundamental form of consumption and the largest single component of most family assets, residents worldwide are sensitive to all factors that may affect the convenience value of housing and its market capitalization [11]. Consequently, when choosing residential areas, people also pay attention to local facilities that affect air quality and the ripple effects of air pollution [12,13]. Thus, environmental factors play a crucial role in determining an individual’s quality of life, making them important considerations when selecting residential areas [14]. Though there are many studies focusing on estimating housing prices based on factors related to house characteristics and the physically built environment in South Korea, the studies that consider PM from an environmental perspective are very limited.
However, it is challenging to represent the factors that linearly influence housing market prices in the real world. This is because it is difficult to capture all the characteristics that affect the housing market. Modeling based on machine learning techniques can complement traditional regression methods, and such approaches can be applied to investigate the linear or non-linear relationships between dependent and independent variables and the hierarchical structure of housing price determinants [15]. In particular, there have been many recent studies using machine learning-based random forest models to estimate housing prices [16,17,18,19]. However, in analyses utilizing machine-learning models, the focus is mostly on predictive capability. This is because the typical artificial intelligence models possess a black box, meaning that they only provide conclusions based on their own judgment without revealing the mechanisms behind the conclusions. Therefore, in most studies utilizing black-box models in the housing market, researchers have pursued the goal of achieving better predictive accuracy while sacrificing model interpretability [15,20,21]. A methodology called Explainable Artificial Intelligence (XAI) has emerged that can ensure both explanatory power and predictive power between variables to a certain extent in the field of artificial intelligence. XAI is a class of systems that provides visual insights into how artificial intelligence systems make decisions, predict, and execute tasks [22].
This study aims to examine the relationship between apartment prices and PM, an area that has rarely been studied in South Korea. In addition, it compares the results of the traditional hedonic price model and the machine learning-based random forest model, which is known for its excellent predictive power. Additionally, the study intends to apply XAI to uncover the explanatory power between variables that have not been elucidated owing to the limitations of black box models in the traditional artificial intelligence field. Through this approach, the objective is to provide more insights into not only the predictive capability of housing prices but also the relationship between variables.
Maslow proposed that human needs can be categorized into five levels of needs in relative priority order: physiological, safety, love, esteem, and self-actualization [23]. In this theory, higher-order needs emerge when people feel that their lower-level needs have been sufficiently satisfied. Owning a home is a major demand to meet these needs, as it not only provides a space to rest but also privacy [24]. Accordingly, the characteristics of structure, dwelling, and the built environment in studies estimating housing prices are common not only in South Korea but also around the world.
Among structural characteristics, area is one of the most commonly considered variables. Generally, it has been found that housing prices tend to be higher as the area increases [25,26,27,28,29,30], and similarly, higher floors are associated with higher housing prices [3,31,32,33,34,35]. Additionally, factors such as the number of rooms and bathrooms are frequently taken into account, and overall, it has been observed that housing prices tend to be higher with a greater number of rooms and bathrooms [36,37,38,39,40].
While structural characteristics include the individual attributes of housing, dwelling characteristics, which encompass the concept of housing communities, have also been extensively studied. Building age is one of the most commonly considered variables in dwelling characteristics. In general, people who buy real estate tend to prefer comfortable new homes, so housing prices are found to fall over time [30,41,42,43,44,45]. However, in South Korea, the most representative type of housing, apartments, exhibit a U-shaped relationship with age, where prices initially decline due to aging but then rise again at a certain point due to expectations of reconstruction, where older apartments are demolished and replaced with newly constructed apartments. Therefore, there are cases where age and its square are used together for apartment prices to consider non-linear relationships. In fact, studies conducted targeting Seoul and its surrounding areas found that the square of age had a positive effect on housing prices [28,46,47]. Therefore, it was argued that the prices of apartments in South Korea would increase again after a certain point. South Korea has a very high population density. High-rise multifamily housing, in the form of apartments in which multiple households live in one building, is the most common housing type. Therefore, the number of households in apartment complexes and the number of parking lots are among the dwelling characteristics frequently considered in South Korea. In general, the more households and parking lots, the higher the housing price [48,49,50].
Finally, factors related to the built environment significantly influence housing prices. Among the variables commonly used in previous studies, prominent ones include locational factors such as proximity to the Central Business District (CBD), parks, transportation, schools, and amenities. In general, housing prices appear to decrease as the distance to the CBD increases. This shows mostly the same results regardless of the study area [44,45,51,52,53,54]. Parks also significantly influence housing prices. It has been observed that housing prices tend to decrease as the distance from parks increases [33,35,43,55]. Factors related to transportation are also frequently considered for their effects on housing prices. Access to subway stations, in particular, is found to increase housing prices as accessibility improves [27,28,36,52,55,56]. Moreover, some studies [18,34,38,57] argue that proximity to bus stops leads to higher housing prices. However, there is also the consistent argument that housing prices decrease in closer proximity to bus stops [30,32]. Regarding accessibility to schools, it has been observed that housing prices tend to decrease as the distance from schools increases [34,39,45,56].
PM consists of solid and liquid particles emitted from various sources, such as vehicle emissions, domestic and industrial emissions, forest fires, and smoke [58]. In addition to these various sources of emissions, PM also varies in size. PM10 refers to PM with a diameter of 10 μm or less, while PM2.5 refers to PM with a diameter of 2.5 μm or less. Among these, PM2.5 has a significant impact on human health, visibility, ecosystems, weather, and climate [59]. Due to the severity of PM2.5, previous studies on housing prices and PM have also focused more on PM2.5. Zhang et al. [60], investigating the impact of air quality on house prices, found that both PM10 and PM2.5 concentrations were associated with a decrease in housing prices. They argue that urban residents with the financial capacity to afford real estate prices might be willing to pay the cost of avoiding exposure to pollution, thereby increasing the possibility of migration. Also, Xue et al. [61] examined the relationship between PM2.5 and housing prices. The findings revealed that as PM2.5 concentrations increased, housing prices tended to decrease. Since PM2.5 generally has ripple effects, the government should optimize environmental governance systems and promote regional cooperation in governance, according to the study. Borja-Urbano et al. [62], conducted in Quito and focusing on the impact of air pollution on housing prices, found that not only PM2.5 but also concentrations of CO, O3, and NOx are associated with lower housing prices. The study suggested that policymakers should consider various strategies when designing rational air pollution control policies. Zou et al. [63], exploring the non-linear impact of air pollution on housing prices, claimed that while PM10 does not have a significant impact on housing prices, PM2.5 leads to a decrease in housing prices at higher concentrations. Additionally, Chen et al. [64], utilizing the spatial Durbin model to investigate the ripple effects of air pollution on housing prices, argued that housing prices and PM2.5 concentrations have an inverse relationship.
However, other studies have argued that housing prices and PM concentrations are positively correlated. Sun and Yang [65] divided China into southern and northern regions and investigated the asymmetric and spatially nonstationary effects of particulate air pollution using geographically weighted quantile regression. The results indicate that, in the southern region of China, housing prices decrease with higher PM2.5 concentrations, whereas in the northern region, prices tend to rise with higher concentrations. It has been suggested that the northern region is significantly affected by industrial pollution and that rapid urban economic development has led to the sacrifice of environmental health. Although economic development has brought about a real estate boom, it is deemed unsustainable. Therefore, raising resident awareness of environmental protection is crucial, and governments must emphasize green development. Additionally, it was argued that encouraging social management of PM2.5 pollution and enhancing support for sustainable industries are necessary to promote sustainable economic growth. Furthermore, Dai et al. [66] investigated the relationship between environmental risk and housing prices and claimed that housing prices increase with higher PM2.5 concentrations. Air pollutants are closely related to human activities and mainly occur in areas with high population densities. Because housing prices are more likely to rise in areas where human activities are concentrated due to high-density development in cities, the relationship between housing prices and air pollution tends to be positive (+). Thus, while the overall relationship between housing prices and PM tends to be inverse, there are instances in which they exhibit a proportional relationship depending on the spatial scope or location.
People are increasingly concerned about the impact of local facilities on air quality and the ripple effects of air pollution when choosing a place of residence. As a result, studies that consider factors influencing housing prices include not only structural characteristics, dwelling characteristics, and built environment characteristics around houses, but also air pollution characteristics. However, South Korea stands out among the organizations for economic cooperation and development countries for having the most severe air pollution exposure [67]. In particular, Seoul’s average PM10 concentration is 42 μm/m3, more than twice the WHO standard, and PM2.5 is 25 μm/m3, which is five times higher than the WHO standard. Meanwhile, Seoul is the most expensive region in South Korea, with housing prices more than twice as high as the average apartment price in all of South Korea. Accordingly, the city of Seoul is in urgent need of efforts to both reduce air pollution and stabilize housing prices. However, studies estimating housing prices have mainly focused on structural, dwelling, and built environment characteristics, limiting the consideration of air pollution characteristics. Furthermore, as evidence continues to show that machine-learning methods outperform traditional hedonic models in terms of predictive power, studies utilizing machine learning to estimate housing prices are rapidly increasing. However, the use of artificial intelligence methods based on machine learning only provides conclusions, such as predictive power, based on its own judgment without revealing the mechanisms through which individual variables lead to these conclusions, which is a significant limitation [29,68,69].
This study aims to investigate the impact of air pollution, specifically PM, the most serious pollutant in Seoul, South Korea, on apartment prices. Employing a machine-learning-based random forest model, this study seeks to address the limitations of traditional artificial intelligence black box models by leveraging XAI. Through XAI, the goal is not only to improve the predictive capability of the machine learning-based model but also to forecast the influence of individual variables. This approach provides more precise and varied insights into housing policies.

2. Materials and Methods
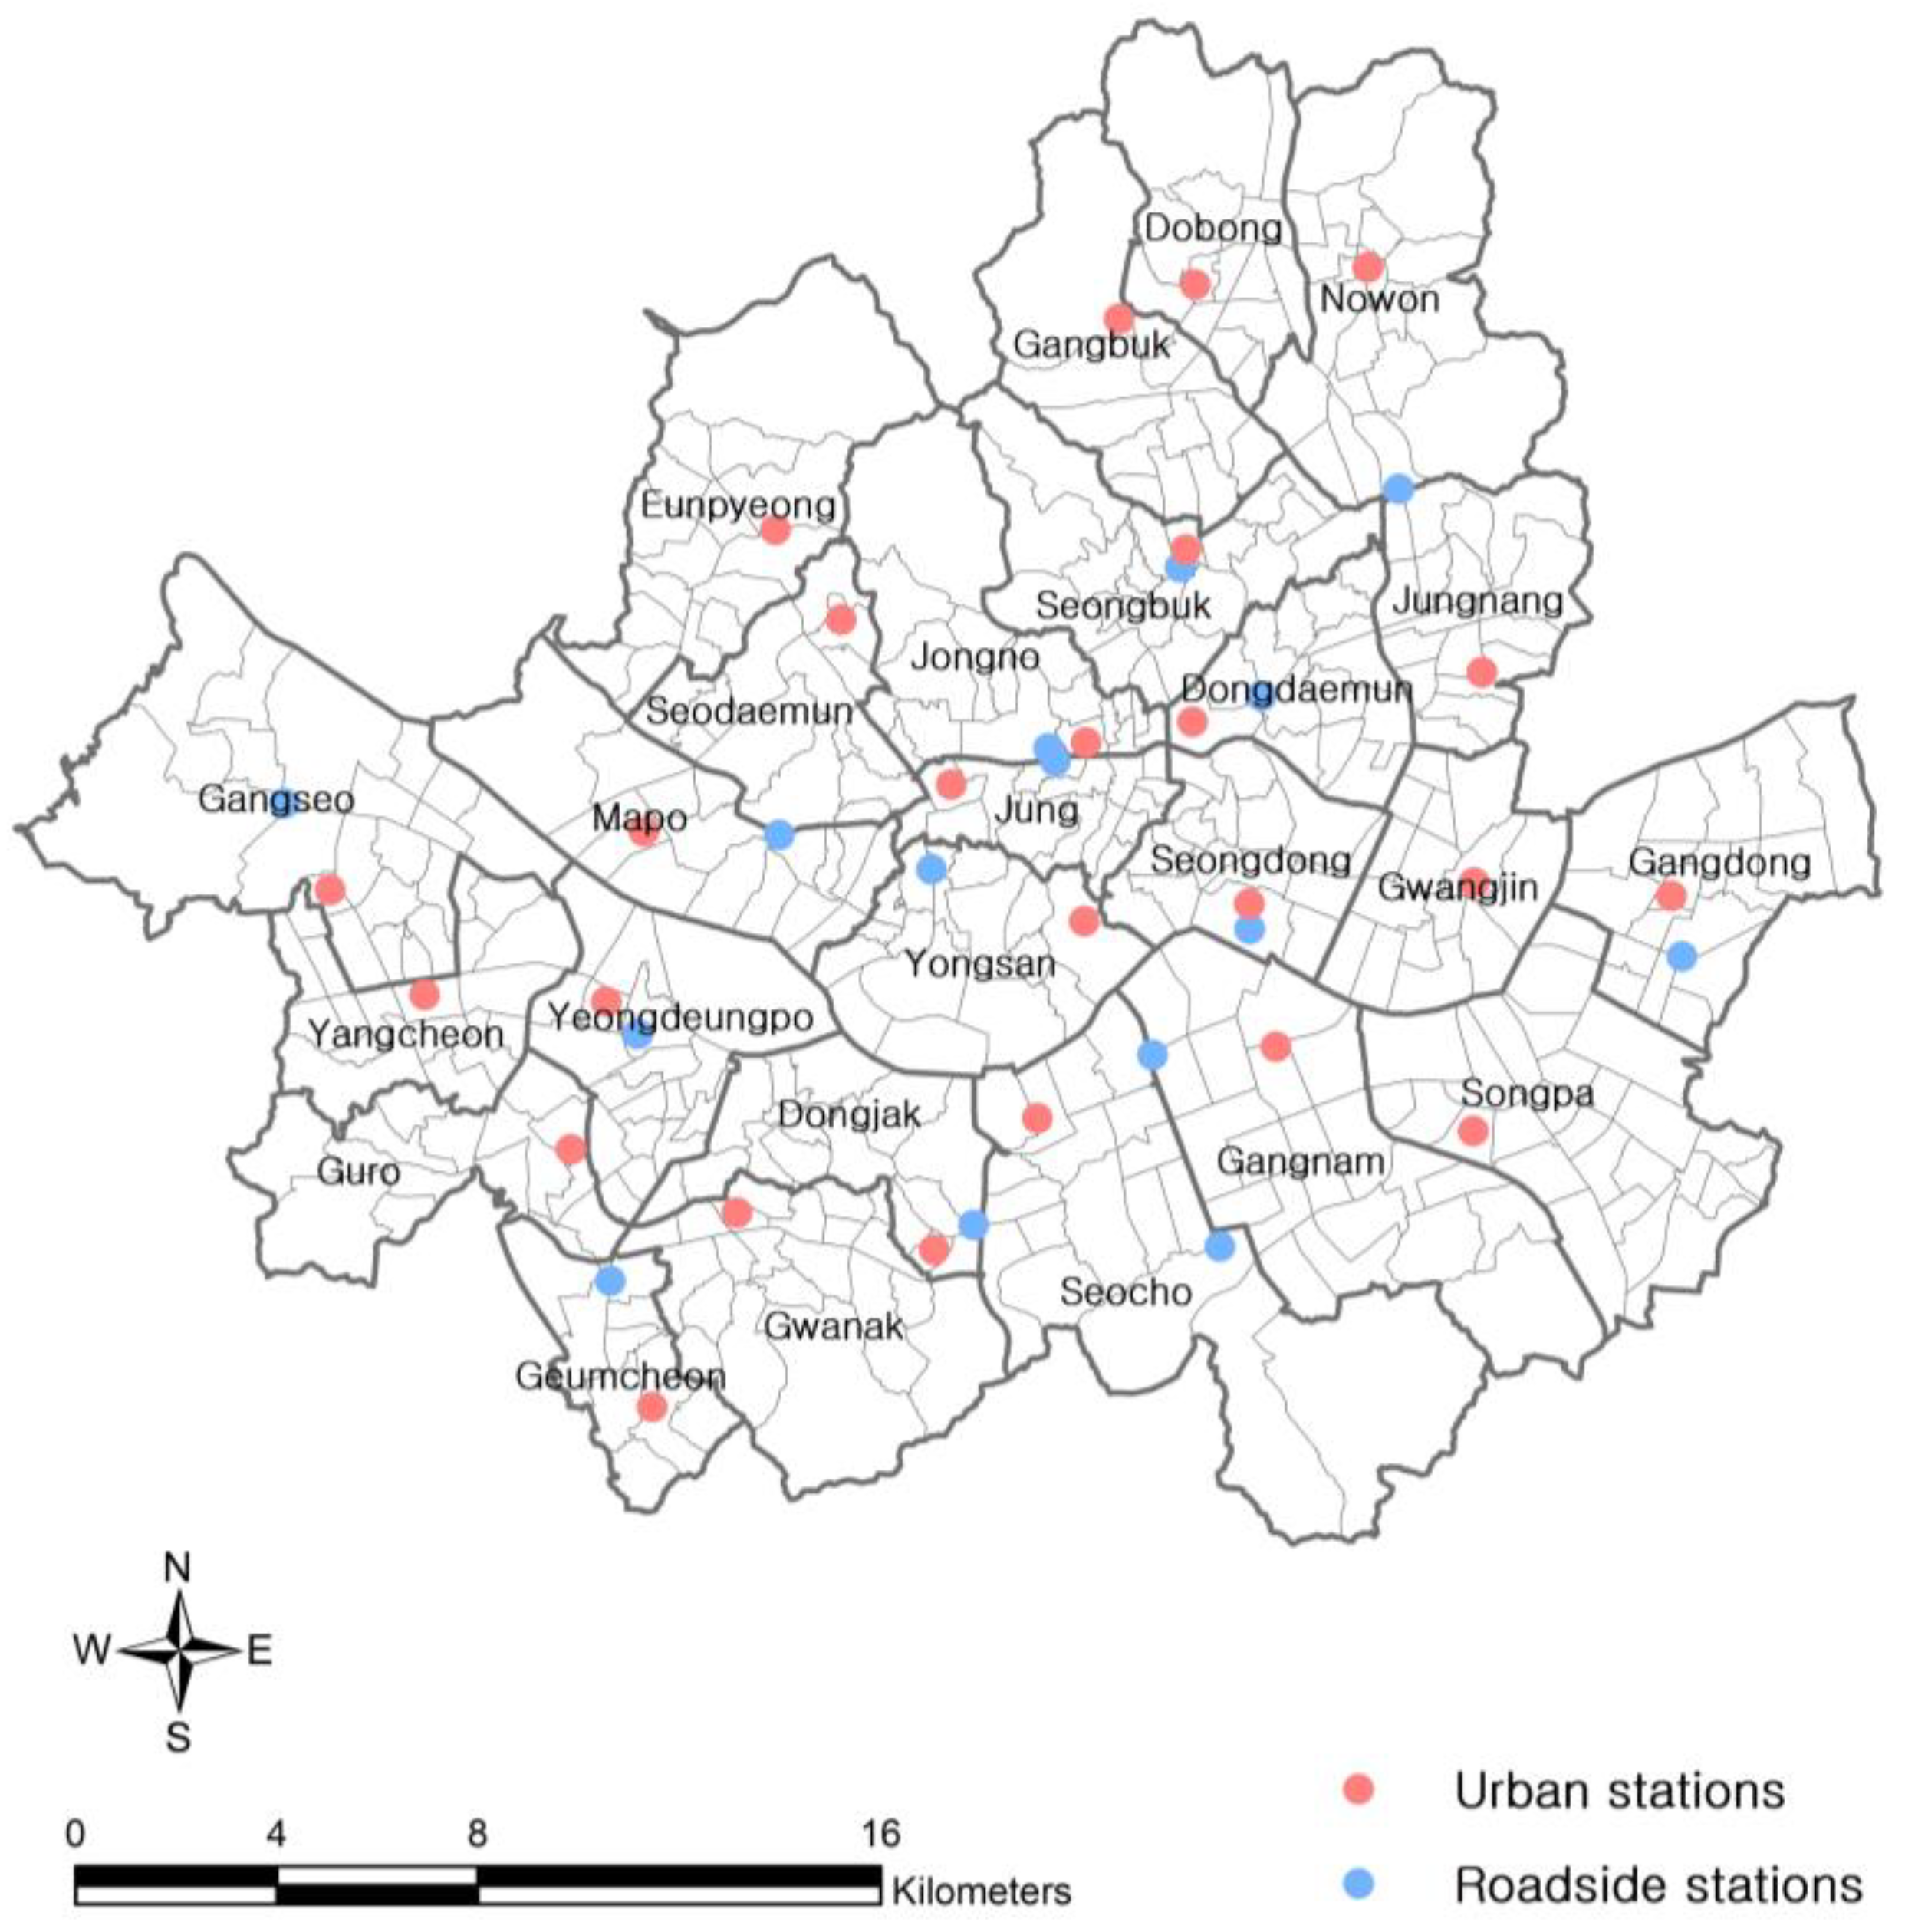
2.1. Study Area

This study investigates the factors influencing housing prices, focusing on Seoul, the capital of South Korea, as shown in Figure 1. Seoul has an area of 605.21 km2 and a population of 10,010,983, making it a city with a fairly high population density.

2.2. Materials

To investigate the factors influencing apartment prices in Seoul, this study categorized the variables into three main categories: structural, dwelling, and built environment characteristics, as shown in Table 1. Built environment characteristics were further subdivided into PM, accessibility, and location.

2.2.1. Apartment Prices

To investigate the factors influencing apartment prices in Seoul, this study utilized the 2019 apartment transaction data provided by Ministry of Land, Infrastructure and Transport (MOLIT) [70]. This dataset includes information such as address, date, price, area, floor, and construction year of the transactions. In 2019, 78,084 apartment transactions were conducted in Seoul. Among these, transactions with incorrect values recorded in the MOLIT-provided data or those in which the location information of the transactions was unclear were excluded. Additionally, structural and dwelling information could not be obtained, and these cases were excluded. Through these processing steps, 71,716 apartment transaction records were analyzed.

2.2.2. PM Concentrations

In South Korea, the characteristics of housing properties and the built environment characteristics of neighborhoods are mainly considered factors for predicting apartment prices, and cases in which PM is considered from an environmental perspective are very limited. Accordingly, spatial interpolation was performed to measure PM concentrations in Seoul using PM data for each of the 40 air monitoring stations installed in Seoul (Figure 2). Spatial interpolation is a method of estimating the observed value of the point to be obtained from the actual observed value of surrounding points. There are several methods for this interpolation, such as Inverse Distance Weighted (IDW) and kriging. Among them, IDW practically assumes that the ratio of correlation and similarity between neighbors is proportional to the distance between neighbors [71]. Therefore, in this study, IDW interpolation was used to construct PM data, and the PM concentration estimated through interpolation was represented as a raster with a size of 50 m × 50 m to ensure analysis accuracy. Meanwhile, PM concentration data were measured based on a 400 m radius from each transacted apartment point. Because 400 m is generally used as the appropriate walking distance in studies related to walkability [72,73,74,75].

2.3. Methods

2.3.1. Hedonic Price Model

This study seeks to evaluate which model is more suitable for predicting housing prices using a traditional linear regression model and a machine learning-based random forest model. In this regard, an analysis was conducted on the factors influencing apartment prices using the most commonly used ordinary least squares-based hedonic price model in real estate valuation studies. Among the various hedonic models, the semi-log is the most widely used [26,42,66,76], and the equation for the semi-log-based hedonic price model is as follows [52]:
l n Y = α + β X + e
where l n Y represents apartment prices, α is the mean constant, β X is the coefficient for each independent variable, and e is the residual error term. This hedonic price model has the advantage of being able to intuitively interpret how much each characteristic affects housing prices. However, this model not only assumes a linear relationship between independent and dependent variables but also has limitations in capturing complex non-linear relationships.

2.3.2. Random Forest

Random forest is an integrated machine learning approach that can be used for both classification and regression, based on a tree-based ensemble method [77]. It combines many decision trees using a bagging method called bootstrap aggregation [78]. This approach involves individually training several different trees and then aggregating the predictions of multiple decision trees, resulting in more reliable predictions than a single decision tree [29]. In addition, random forest algorithms such as decision trees can be very useful in housing value analysis because they can capture non-linear relationships between dependent and independent variables [79] and have the advantage of high model accuracy [80]. However, unlike the hedonic price model, this model has a complex structure due to the inclusion of multiple decision trees, and there is also the limitation that learning and prediction may take longer as the amount of data increases.

2.3.3. Model Evaluation

To compare the analysis results of the traditional hedonic price model and machine learning-based random forest, this study utilized R-Squared (R2), Root Mean Square Error (RMSE), and Mean Absolute Error (MAE) [63].
R 2 = 1 i = 1 M y ^ y i 2 i = 1 M y i y ¯ 2
R M S E = i = 1 M y i y ¯ 2 M
M A E = 1 M i = 1 M y i y ^ i
where yi represents observed values, y ^ i signifies predicted values, y ¯ denotes the mean of observed values, and M represents dataset size. RMSE and MAE indicate the disparities between predicted and actual housing price values, while R2 offers insight into the model’s goodness of fit. A higher R2 and lower RMSE and MAE values indicate greater predictive accuracy. Therefore, this study aims to select the model, whether the traditional hedonic model or the machine learning-based random forest, with a higher R2 and lower RMSE and MAE values as the final model.

2.3.4. Explainable Artificial Intelligence

Currently, artificial intelligence is increasingly used to make predictions and facilitate decision making [81]. However, artificial intelligence lacks the clarity and interpretability of machine learning solutions because it is a black box in which it is unknown how individual variables affect the prediction results [82]. To address these issues, XAI frameworks emphasizing accountability, transparency, ethics, and reliability [83] have been proposed. Various approaches exist for implementing XAI, and a noteworthy method is SHapley Additive exPlanations (SHAP) [84]. SHAP is used for machine learning model interpretation and can visually express not only the important characteristics of the XAI model but also whether each input characteristic makes a positive or negative contribution [83,85]. SHAP can be divided into a global and local explanation. The global explanation aims to estimate the general contribution of each conditioning factor to understand the factors that affect house prices [86]. In another aspect, a local explanation highlights factors that significantly contributed to the prediction by allowing the impact of each factor to be identified at the individual pixel level [87,88].

3. Results and Discussions

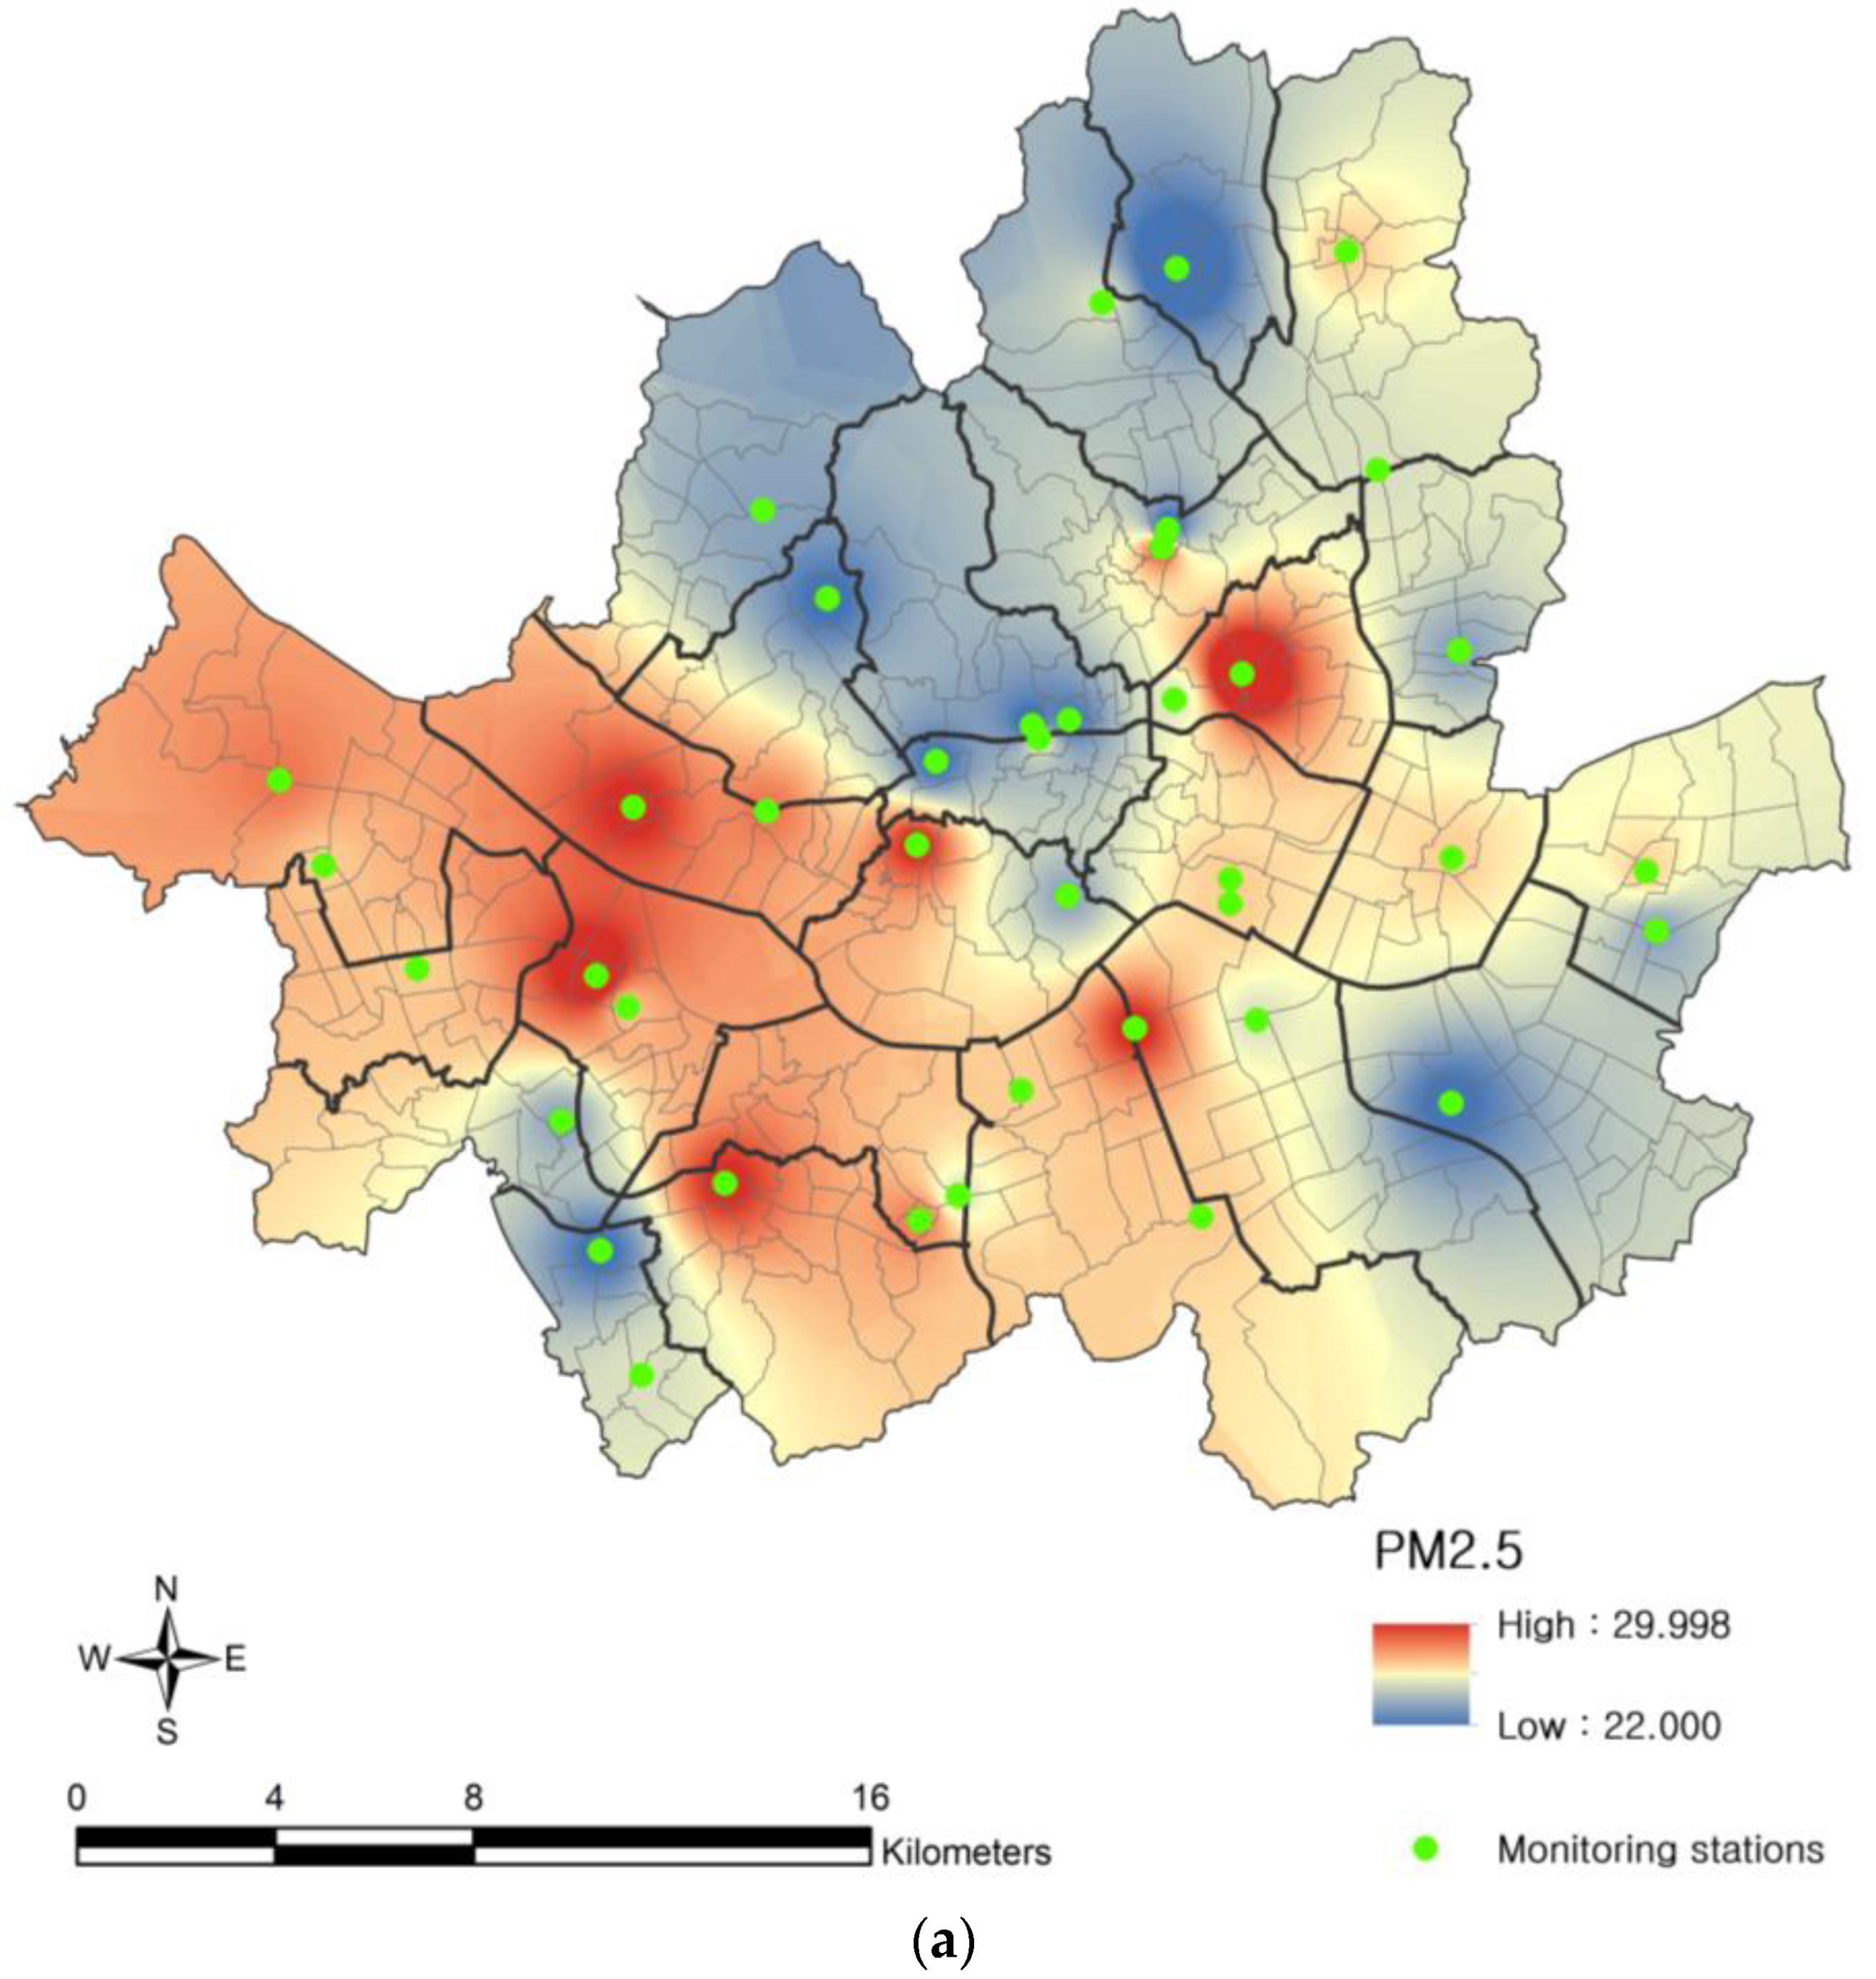
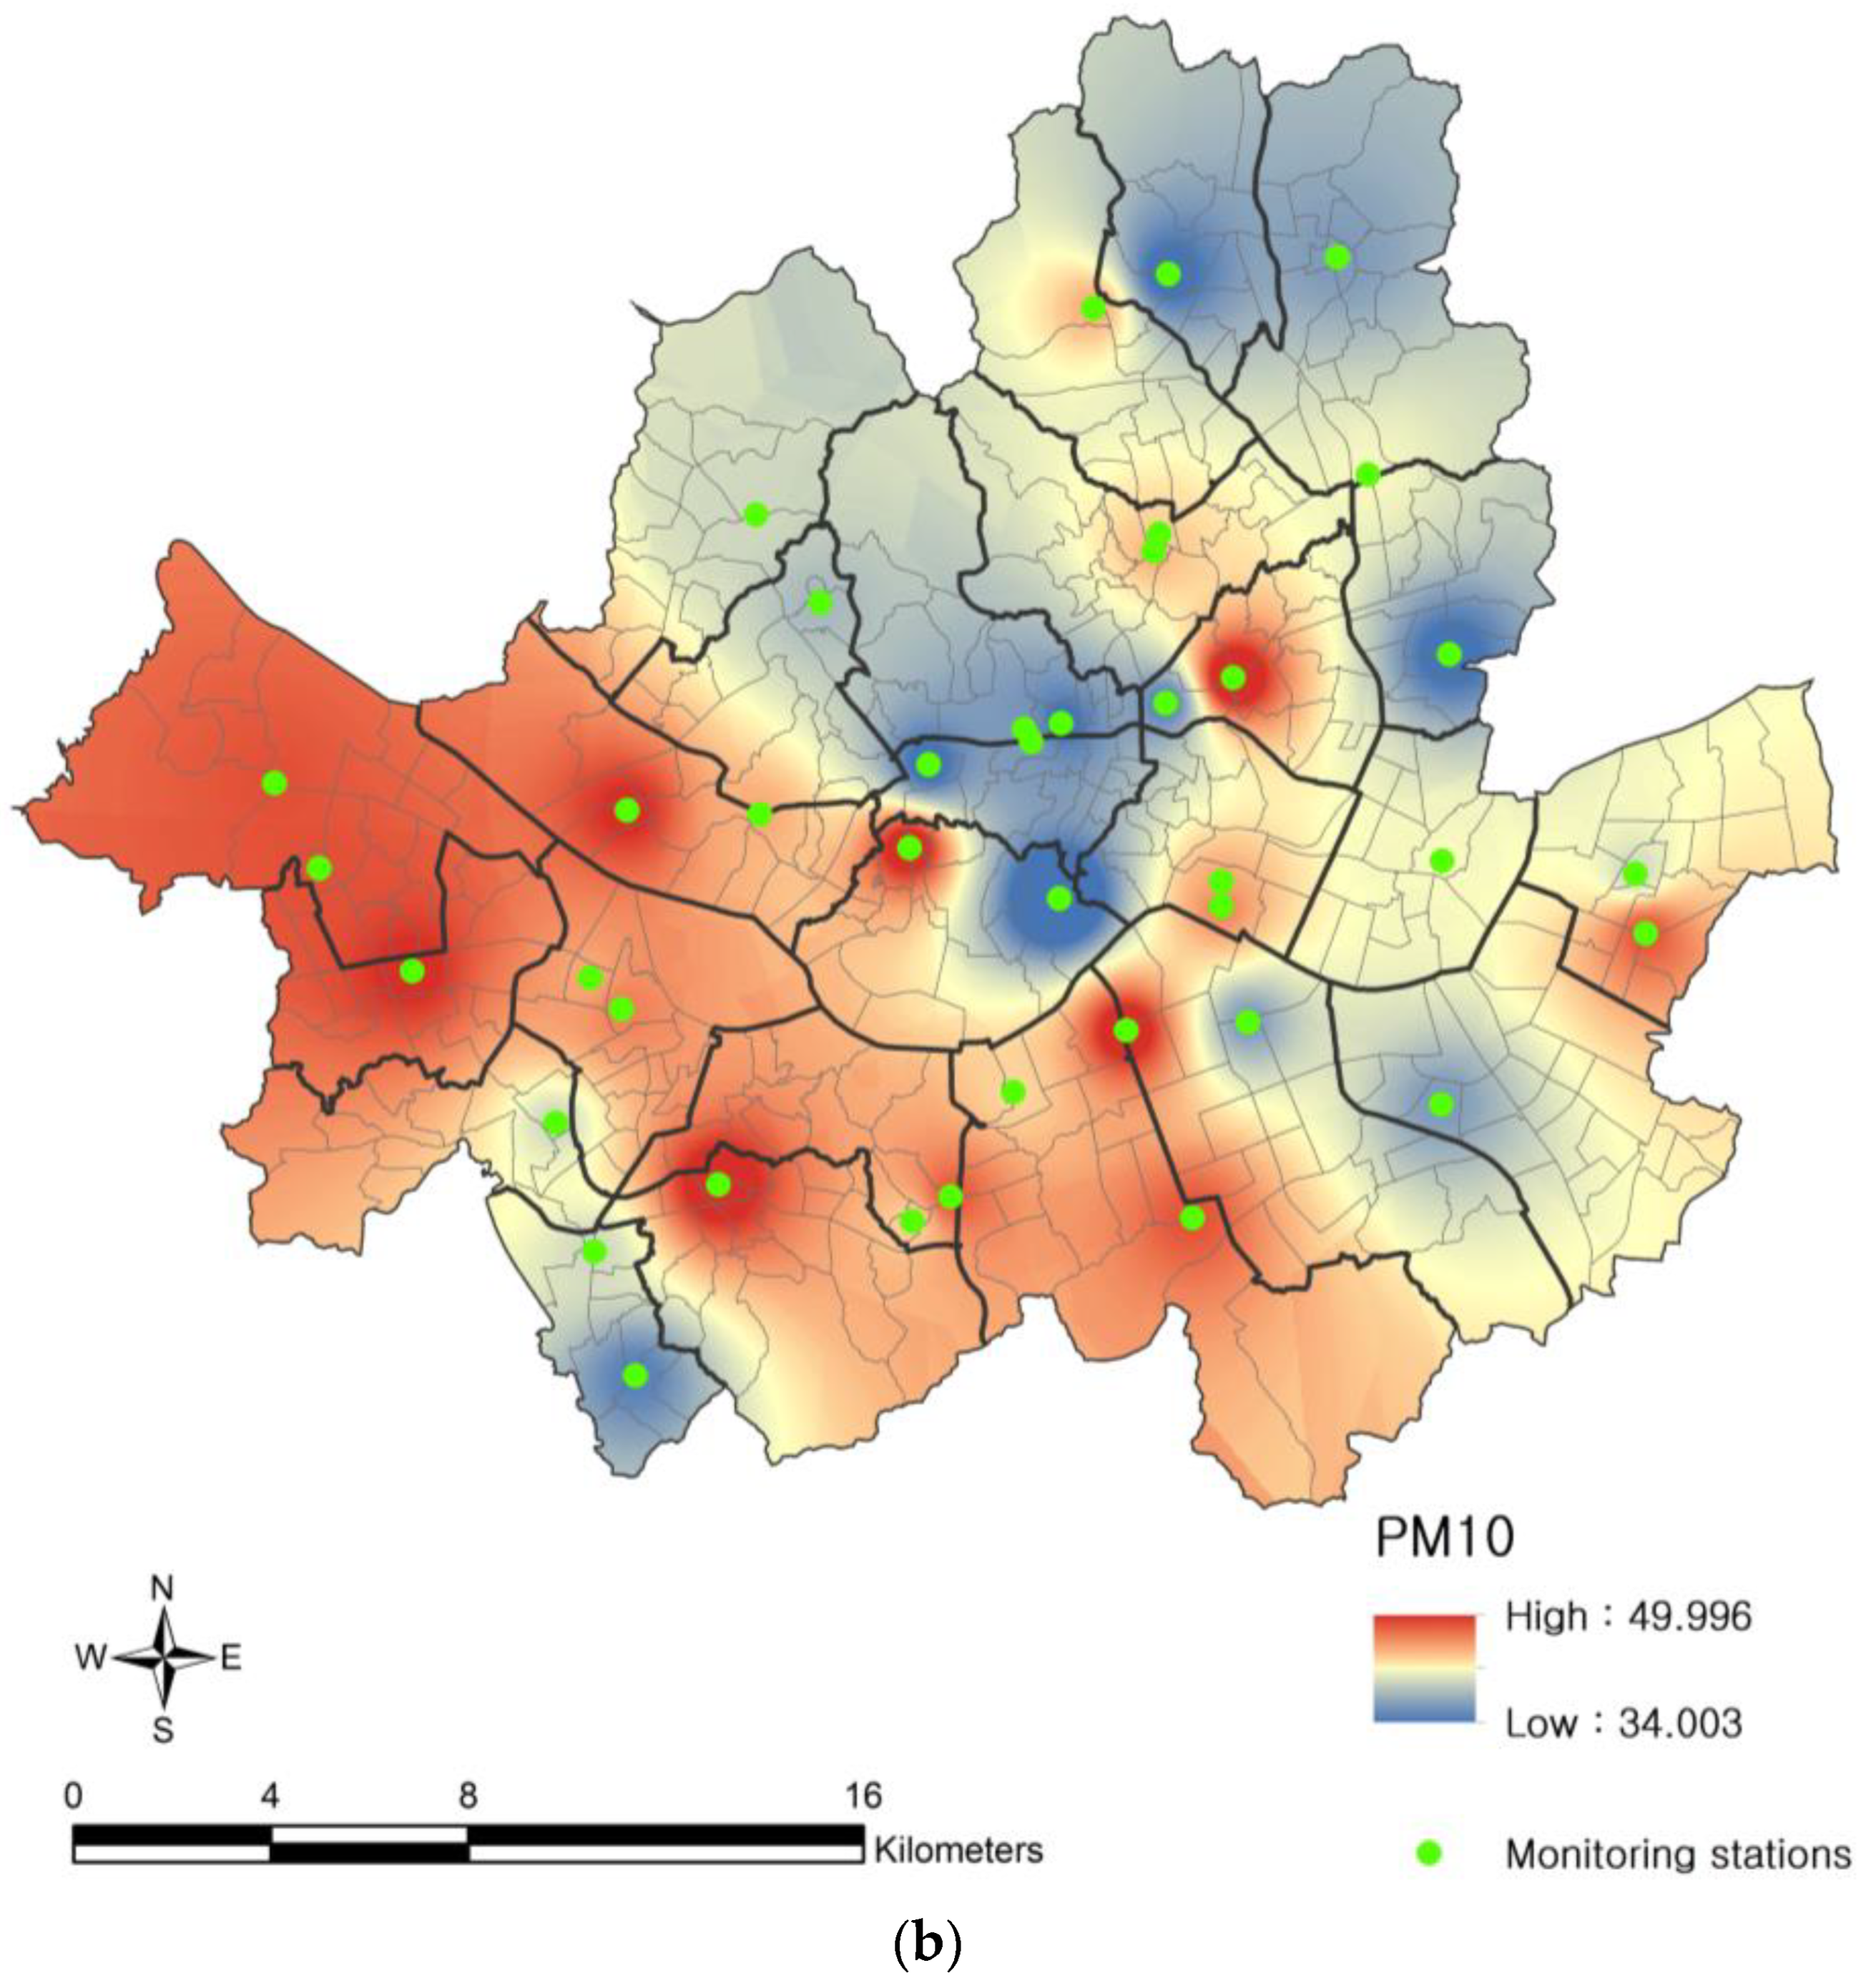
3.1. Spatial Distribution of PM Concentrations

The spatial distribution of PM types in Seoul in 2019, as determined by interpolation, is shown in Figure 3a,b. PM2.5 and PM10 exhibited similar distributions. Regardless of the type, the concentration of PM was generally high in the southwestern area of Seoul, whereas it was relatively low in the northern area. More closely, PM2.5, appeared to be more locally concentrated than PM10. Compared with Figure 1, it can be seen that PM concentrations are generally higher in areas where apartment prices are high.

3.2. Descriptive Statistics

Table 2 presents the descriptive statistics for the variables used in this study. The average transaction price per square meter for apartments in Seoul in 2019 was 1.036 million won ($8856). Meanwhile, the average transaction price per square meter for apartments in Seoul exhibits a significant deviation, ranging from a minimum of 0.163 million won ($1395) to a maximum of 4.337 million won ($37,068).
The PM characteristics considered in this study showed that the average concentrations of PM2.5 are 25.47 μg/m3 and PM10 are 43.47 μg/m3. These values significantly exceed the WHO standards of 5 μg/m3 for PM2.5 and 15 μg/m3 for PM10. Even at their minimum values, PM2.5 records 22.17 μg/m3, and PM10 records 34.80 μg/m3, still exceeding the WHO standards. This indicates that Seoul is highly vulnerable to PM2.5 and PM10, highlighting the urgent need for efforts to mitigate PM pollution citywide.

3.3. Model Evaluation Comparison

The adequacy of the traditional hedonic price model and machine learning-based random forest analysis are presented in Table 3. The R2 value for the hedonic price model is 0.676, whereas it improves significantly to 0.962 in the random forest model, indicating a substantial enhancement in the model’s explanatory power. Both the MAE and RMSE were lower in the random forest model than in the hedonic price model. This finding suggests that the random forest model is more suitable than the traditional hedonic price model for estimating apartment prices in Seoul. Therefore, in this study, a machine learning-based random forest model was adopted.

3.4. Regression Analysis

Before explaining the results of the random forest analysis through the verification of model suitability, the results of the hedonic price model analysis are presented in Table 4. The main results are as follows. Among the variables considered, the number of baths was the only one that did not appear to have any effect on apartment prices. This is believed to reflect the fact that most apartments in South Korea have two bathrooms, regardless of apartment size. In addition, age has a negative (−) relationship with apartment prices, but age-squared has a positive (+) relationship with apartment prices. This can be interpreted to mean that the price of apartments in Seoul decreases as buildings age but starts to rise again at a certain point due to expectations for reconstruction. In addition, the closer the accessibility to most facilities, excluding bus stops and kindergartens, the higher the apartment prices.

3.5. Machine Learning Algorithm

3.5.1. Hyperparameter Tuning

For the random forest analysis in this study, the train-test data ratio was 7:3. In addition, random search was employed for hyperparameter tuning. For the random search, the number of estimators was specified between 1 and 100; the maximum features were chosen from auto, sqrt, and log2; and the maximum depth was set to be within the range of 1 to 20. Moreover, to derive the optimal hyperparameter values through random search, the number of iterations for the random search was set to 100. The final hyperparameter values obtained from these steps are listed in Table 5. The number of estimators was 83, maximum features were auto, maximum depth was 19, cross-validation was 5, and the number of iterations for the random search was 100.

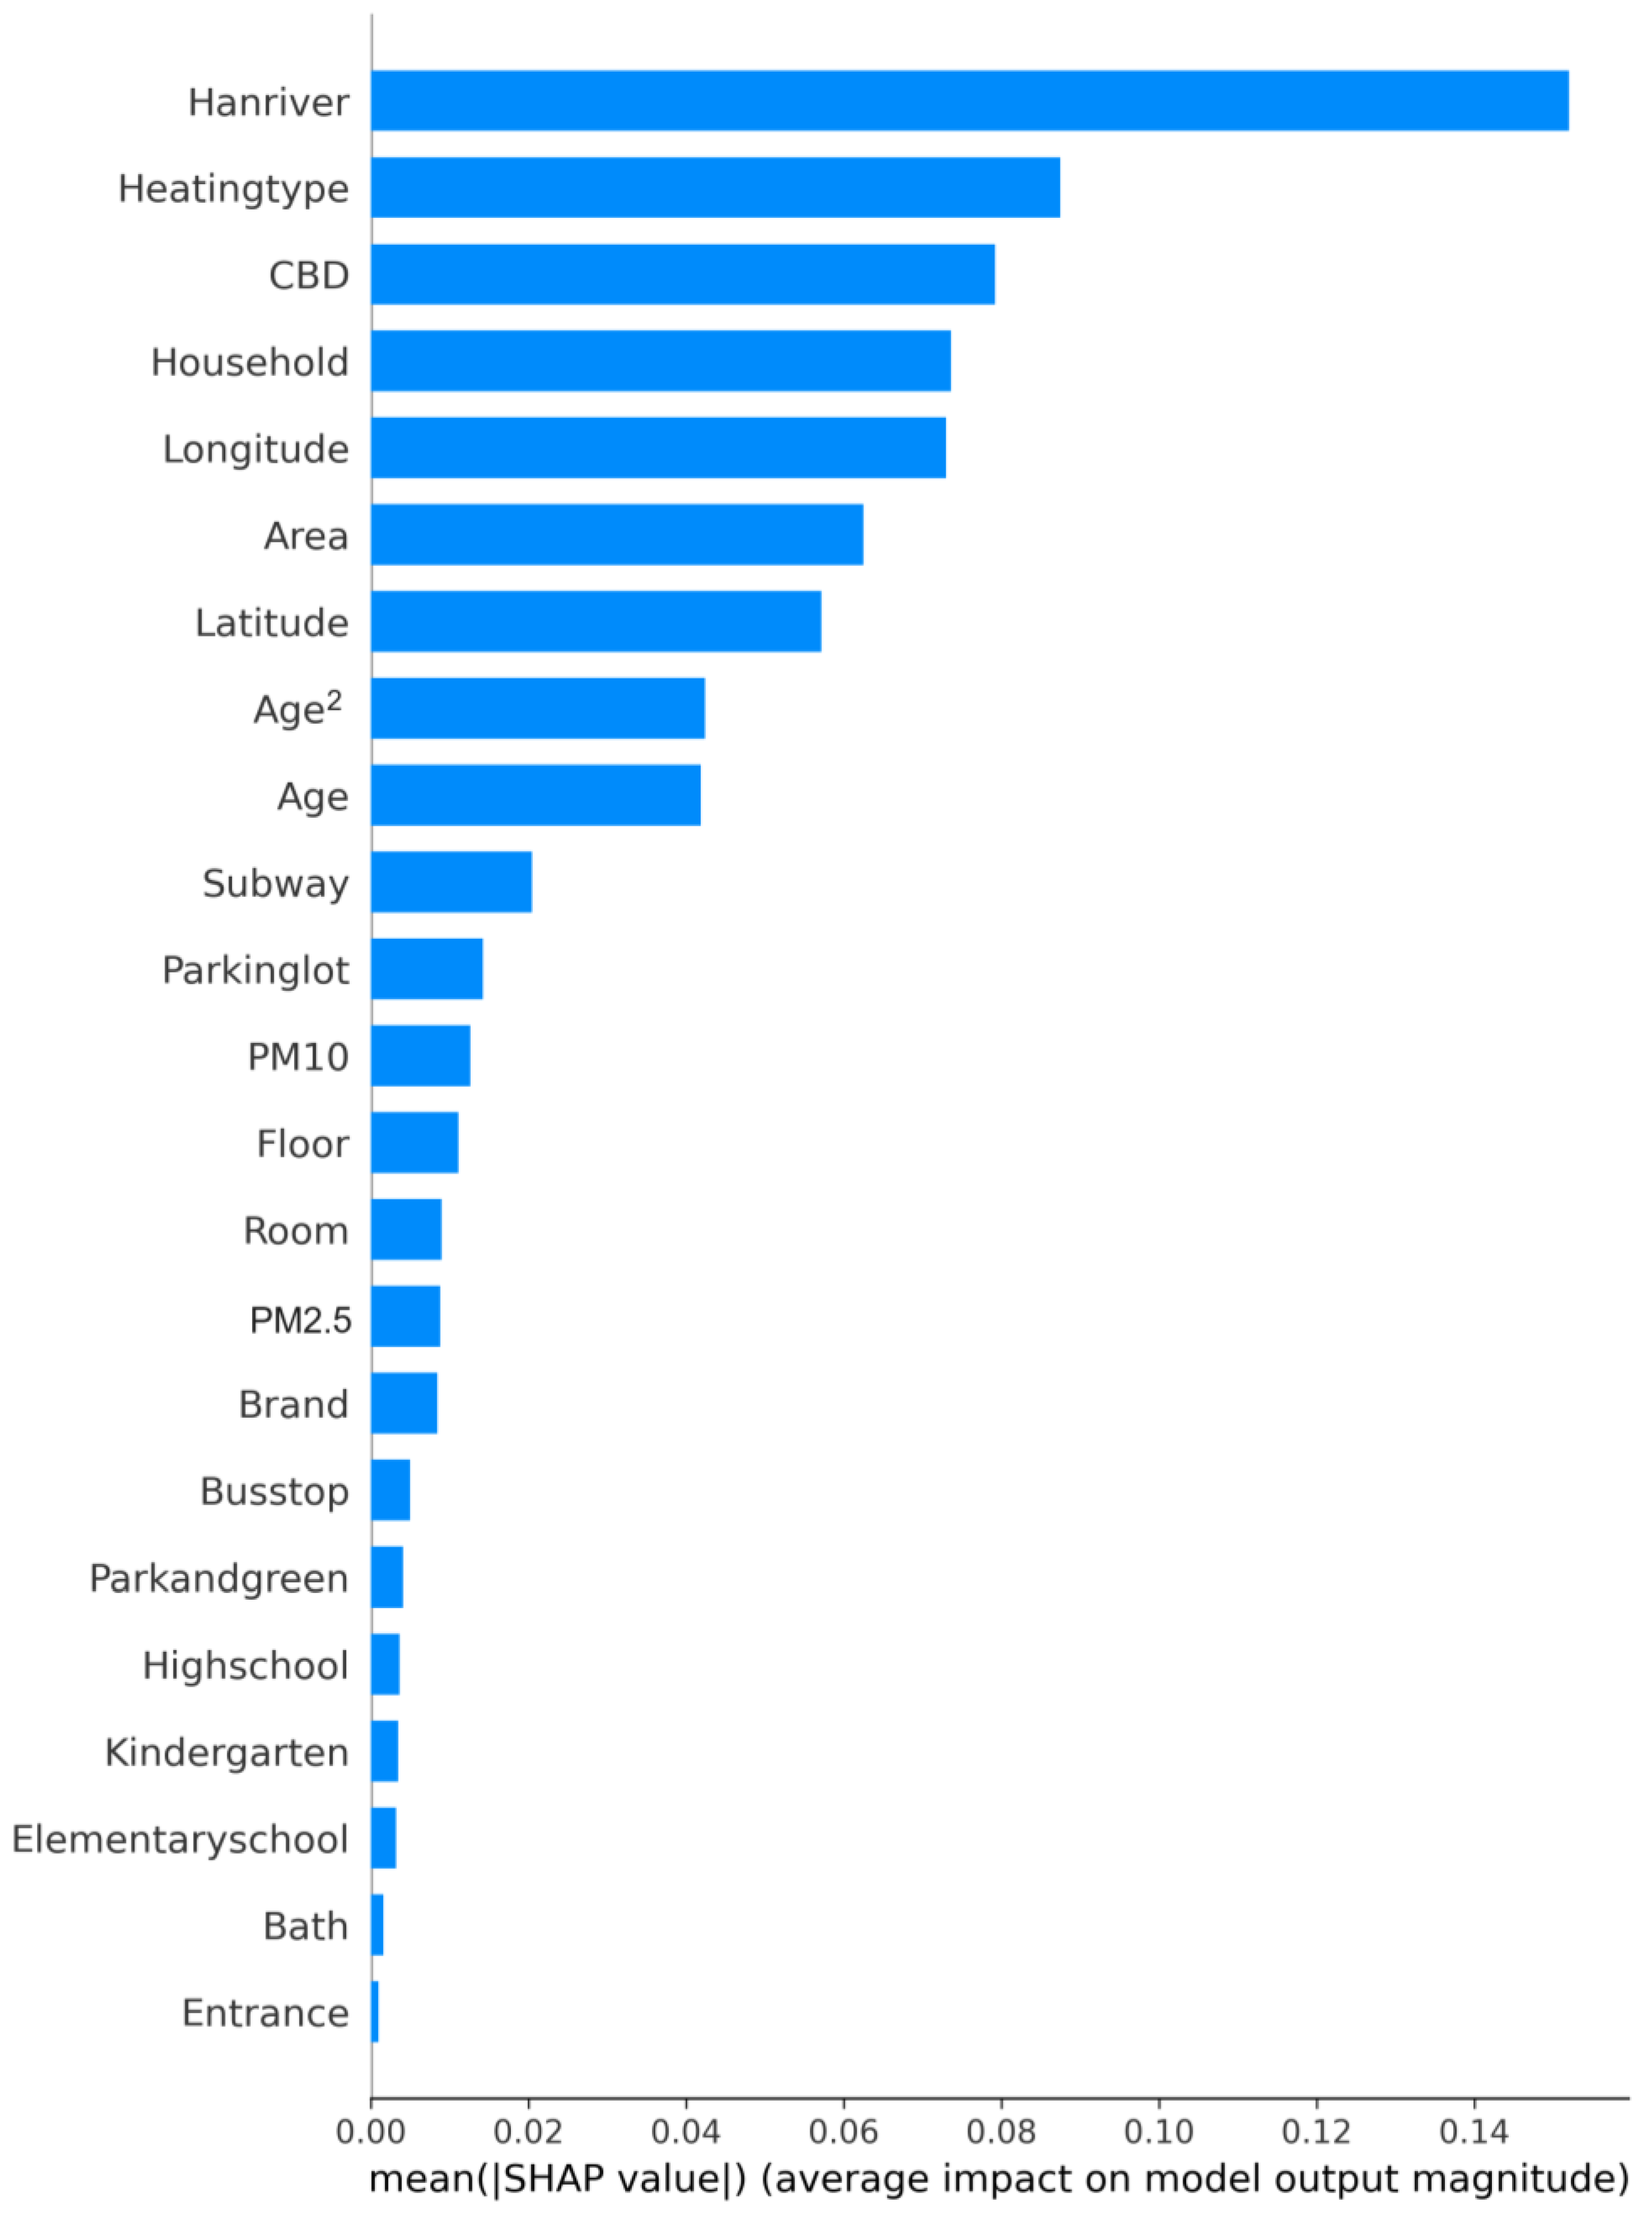
3.5.2. Importance of Features

Figure 4 presents the importance of the features from highest to lowest based on the XAI. The variables influencing apartment prices in Seoul were ranked in the following order of importance: distance to the Han River; type of heating; distance to the CBD; number of households; and longitude, area, and latitude. This indicates that apartment characteristics and the built environment play a complex role in estimating apartment prices.
Accessibility to the Han River was significantly more important than other features. This is likely attributable to the Han River’s prominent role as a natural recreational space traversing the center of Seoul and being perceived as one of the most representative leisure spots in the city.
However, in terms of location characteristics, the longitude appears to be more important than the latitude. This suggests that the east-west position may be more crucial than the north–south position in determining apartment prices in Seoul. However, in reality, Seoul’s main housing policy is implemented by dividing Seoul into northern and southern areas based on the Han River. Nevertheless, the analysis results show that the importance of the east and west is actually higher than that of the north and south. Thus, it is necessary to divide Seoul into east and west to estimate the degree of change and imbalance in apartment prices and consider appropriate housing supply and management measures.
Additionally, the number of households is an important factor in determining apartment prices. As apartments in large complexes are large, they tend to maintain relatively stable price fluctuations compared with those that are not, even during times of high economic volatility. Therefore, in the case of large apartment complexes, there is a strong tendency to prefer them because of their ability to provide more stable asset protection than other apartments. Moreover, large apartment complexes often have well-established security systems, ensuring residents’ safety and offering various amenities such as fitness centers, swimming pools, and parks because of their large number of households. Therefore, the number of households plays a crucial role in determining apartment prices.
In contrast, both PM10 and PM2.5 were ranked in the intermediate category of importance. In particular, it was revealed that PM concentration has a more significant impact on apartment prices than on educational facility accessibility. This suggests that air pollution contributes to apartment prices in Seoul, to a certain extent. Therefore, it suggests the necessity for housing policies in South Korea to consider environmental factors such as PM, in addition to the attributes of apartments and the physical location environment, when estimating apartment prices in Seoul.

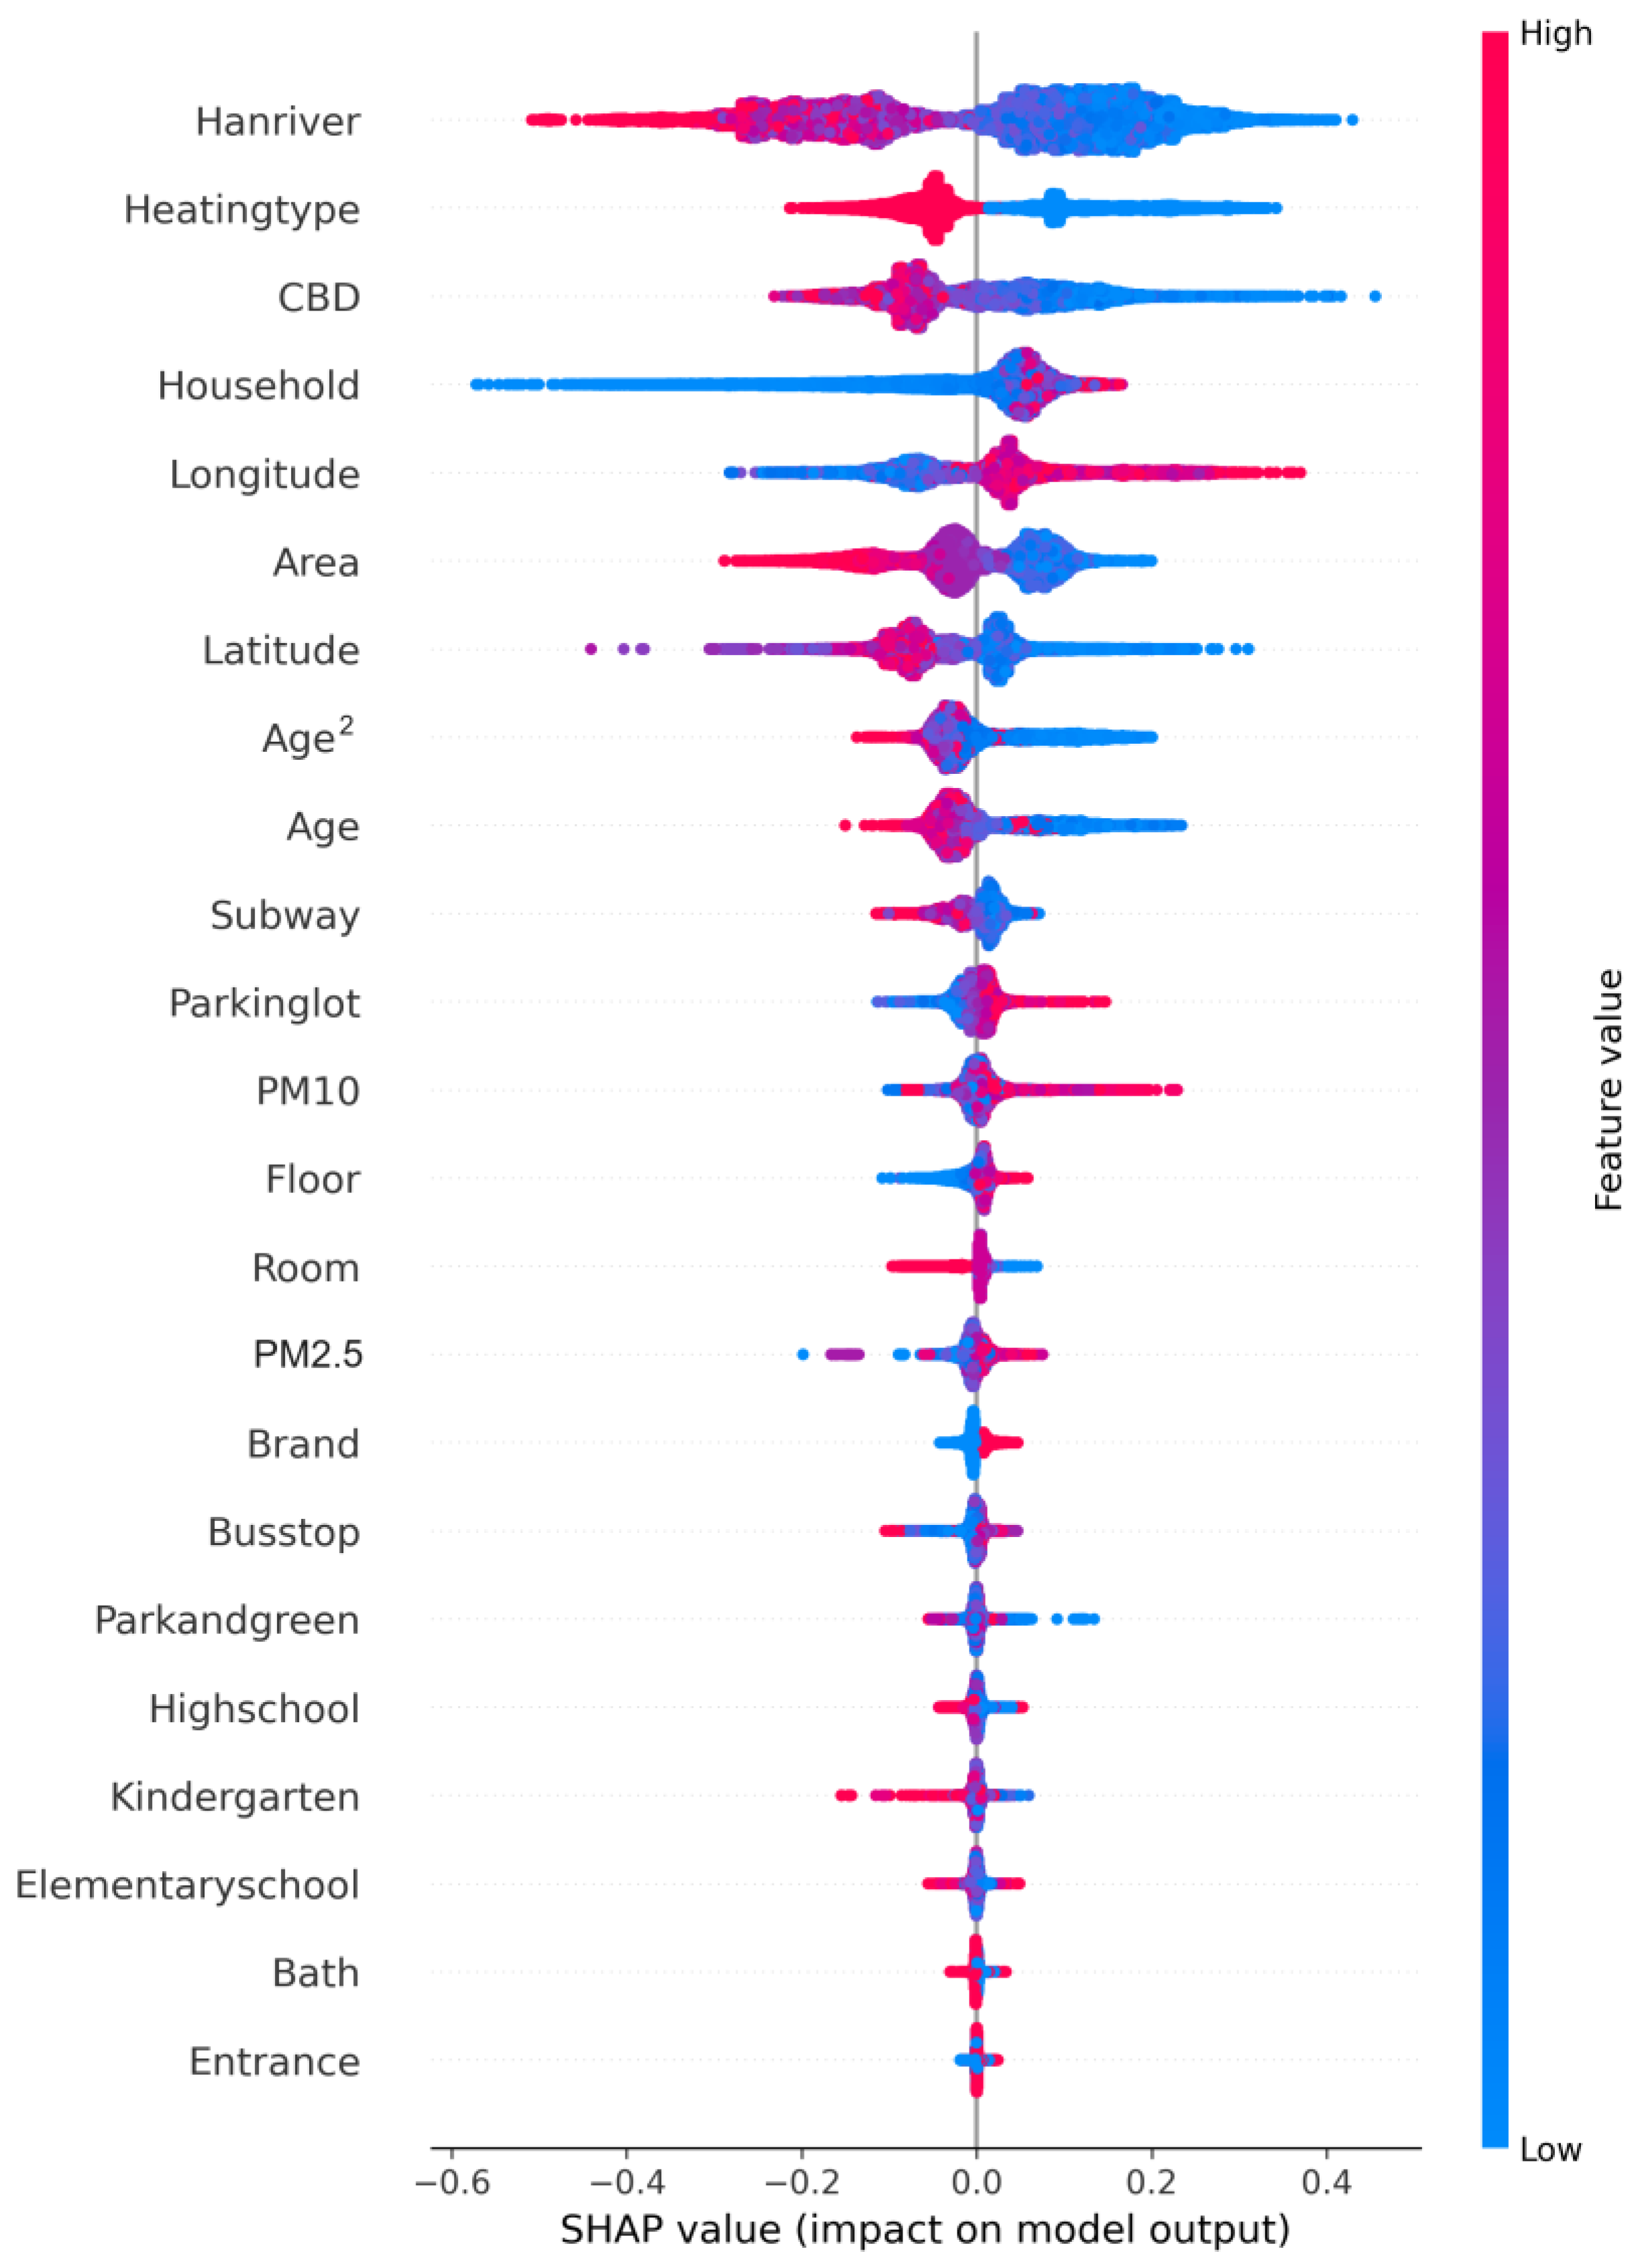
3.5.3. Effect of Features

Figure 5 shows the results of applying SHAP to visualize the impact of each feature on predicting apartment prices in Seoul as positive (+) and negative (−) effects in order of importance. Before explaining the analysis results, among the variables considered in this study, the number of rooms, PM10 concentration, and distance to the kindergarten had different influences from the analysis results of the existing traditional hedonic price model. Similar findings were also observed in a study on the real estate market in Rotterdam, Netherlands [89]. Potrawa and Tetereva [89] claimed that there were variables that caused differences in the influence between the OLS and random forest models. Therefore, the random forest algorithm can more accurately capture the non-linear relationship between the dependent and independent variables.
Prior to the analysis of the results of individual variables, it was found that overall, the lower the value of the structure characteristics, the higher the apartment price. However, for the dwelling characteristics, it was found that the higher the value for all variables except age, the higher the apartment price. In addition, in the built environment characteristics, the higher the level of the PM characteristics, the higher the apartment price, and for variables related to accessibility, it was found that the better the accessibility, the higher the apartment price.
Accessibility to the Han River, which was shown to be the most important factor affecting apartment prices in Seoul, decreased as the distance increased. In fact, Figure 1 shows that apartment prices along the Han River are notably high. The Han River is Seoul’s main open space that runs through the center of Seoul and provides great views of apartments along the Han River. In addition, people’s preference for waterside spaces, where various outdoor activities such as jogging and biking are possible, is believed to be the main reason for high apartment prices.
In the case of heating type, apartment prices were lower when individual heating was used compared with district heating. Compared with individual heating, district heating has a higher thermal efficiency [90], and residents tend to prefer it because the energy costs are lower. Therefore, South Korea prioritizes district heating for the reconstruction and development of new cities [91]. This means that the policy of prioritizing district heating is supported by consumers who want to purchase apartments.
The apartment prices increased as the distance to the CBD decreased. This result aligns with many studies that have attempted to estimate housing prices in the CBD [44,45,51,52,53,54]. A study analyzing housing price determinants in Beijing, China Duan et al. [40] claimed that housing prices are higher because of supply shortages in downtown areas, where land use regulations are strict and developable land is relatively scarce. Additionally, Hussain et al. [45], argued that living near the CBD can reduce transportation costs to reach workplaces and enhance convenience, resulting in higher housing prices near the CBD. In fact, Seoul has recently attempted to solve the problem of housing supply within the city center through the construction of high-rise apartments by introducing a plan to relax floor area ratio restrictions when apartment construction and redevelopment proceed in areas near the CBD. In addition, there is a need to create an environment in which people can fully enjoy accessibility to amenities such as transportation, medical care, childcare, and culture, which are concentrated in the CBD, even within the neighborhood rather than the CBD.
The apartment prices increased as the number of households within an apartment increased. Apartments with a large number of households tend to have a more active housing market and thus provide stability in the real estate market. Therefore, compared with apartments with fewer households, apartments with a larger number of households can more effectively protect assets, leading to a higher preference among the public for large apartment complexes. Additionally, large apartment complexes often have well-established security systems that enhance residents’ safety, as well as various lifestyle amenities, such as fitness centers, cultural facilities, and parks within the complex, which are considered factors that contribute to increasing apartment prices.
In this study, longitude and latitude were utilized to control for factors influencing apartment prices based on spatial characteristics. Higher longitudes and lower latitudes were associated with higher apartment prices. Therefore, when considering both variables collectively, it can be estimated that apartments located in the southeastern region of Seoul command higher prices. This observation aligns with the distribution of apartment prices in Seoul, as shown in Figure 1, where apartments in the southeastern region of Seoul are clustered at higher prices. This area corresponds to one of the three CBDs in Seoul, known as “Gangnam,” which is one of the most developed and densely populated areas with considerable economic activity. “Gangnam” is not only characterized by a high concentration of job opportunities but also boasts excellent transportation accessibility and a plethora of cultural facilities for leisure activities. In particular, apartment prices are estimated to be high because this area specializes in education, and the demand for living in the area is quite high.
In contrast, smaller apartments tend to have higher prices. Although this result contradicts previous studies, it reflects the characteristics of Seoul, South Korea. South Korea is on the verge of becoming a post-aged society because of a significant decline in population, with Seoul’s birth rate standing at 0.717, which is very low [92]. Therefore, there has been a significant increase in the demand for smaller apartments compared with larger ones. However, prices have increased owing to insufficient supply. Therefore, to stabilize prices, it is necessary to expand the supply of apartments with smaller areas in future apartment constructions.
In terms of apartment age, the prices of newly built apartments were higher. This shows the same results as most previous studies [40,41,42,43,44,45]. In general, real estate often deteriorates over time and its value decreases; therefore, it is believed that the higher the apartment age, the lower the housing price. In particular, in Seoul, as new apartments are built owing to continuous reconstruction and redevelopment, people’s tendency to move to new apartments is believed to affect apartment prices.
However, variables related to accessibility in terms of public transportation, such as distance to subway entrances and bus stops, yielded contrasting results. It was found that the closer the distance to subway entrances, the higher the apartment prices, whereas the farther the distance to bus stops, the higher the prices. Zhang and Dong [56]. found that bus stops tended to decrease housing prices, which was attributed to noise pollution. However, the subway has the advantage of not being exposed to direct noise and exhaust fumes compared with buses and is not affected by traffic congestion during commuting. Additionally, areas around subway stations often provide various amenities owing to commercial development. These results indicate a preference for subways over buses among residents; therefore, proximity to subway stations is associated with higher apartment prices.
The apartment price was higher for the higher number of parking lots per household. Despite Seoul’s high population density and increasing traffic congestion, the number of vehicles owned per household is steadily increasing as vehicle consumption increases because of an increase in household income owing to economic growth and an increase in the working population. Accordingly, the number of parking lots per household is a major factor in the choice of a house. Therefore, parking spaces have become valuable resources and indispensable elements in the development of new communities [36].
The apartment price was higher for the higher floor level. This result aligns with most previous studies [31,32,33,34,35]. Generally, higher floors command a premium owing to the panoramic view they offer, which is considered a factor that contributes to an increase in apartment prices. Indeed, Xiao et al. [33] investigated the impact of landscape proximity based on floor level on housing prices. As a result, housing prices increased at higher floor levels. It has been argued that residing in high-rise apartments is advantageous for maximizing the amenity value of the landscape, allowing residents to enjoy significant benefits from the scenery.
Both PM2.5 and PM10, which were considered to examine the impact of air pollution on apartment prices, were measured to have an overall positive (+) effect. In other words, areas with higher apartment prices had higher concentrations of PM2.5 and PM10. Sun and Yang [65] investigated the asymmetric and spatial non-stationary effects of particulate air pollution, and their study showed similar results in northern China, where prices increased as PM concentrations increased. In this regard, the northern regions are experiencing the most significant impact of industrial pollution, and it is argued that health is being sacrificed due to rapid urban economic development. Dai et al. [66] also investigated the relationship between environmental risks and housing prices and argued that the higher the PM concentration, the higher the housing price. This is closely related to human activities, as air pollutants tend to be generated mainly in densely populated areas. In other words, areas where human activities are concentrated because of urban development tend to have higher housing prices; however, the concentration of air pollutants may also increase because of such developments. Indeed, by examining Figure 1 and Figure 3, it can be observed that high-priced apartments in Seoul are mostly located near Gangnam or the three previously mentioned CBDs. These areas are known to have the highest development density in Seoul, resulting in significant traffic volume and elevated PM concentrations from sources such as diesel vehicles and tire wear [93]. Accordingly, there is a need to minimize the impact of PM on apartment prices by considering restricting the entry of old diesel vehicles around the CBD, which has the highest development density in Seoul. However, if the socioeconomic benefits obtained from the non-environmental factors considered in this study outweigh the advantages of living in areas with low air pollution, citizens may choose to reside in areas with high PM concentrations despite the potential adverse effects on their health. Therefore, the government must better coordinate and manage the relationship between urban development and air pollution by optimizing the environmental governance system to minimize exposure to air pollution [61].

4. Conclusions

Air pollution is a significant issue with a serious impact on human health. Therefore, selecting healthy and safe residential areas and houses within the constraints of limited resources is important. However, in densely populated Seoul, the impact on housing prices has been studied primarily by focusing on the characteristics of housing structures and the physical built environment around the complexes owing to the shortage of housing supply. Nevertheless, with increasing interest in health and quality of life, there is growing interest in the impact of environmental factors such as air pollution on the housing market. Therefore, this study applies XAI based on machine learning to investigate the relationship between apartment prices and PM, which is relatively understudied in South Korea. The main findings were as follows:
First, in this study, the predictive power was compared using the hedonic price model and the machine learning-based random forest model to investigate the factors affecting apartment prices. As a result, the machine learning-based random forest was found to be more suitable for predicting housing prices than the hedonic price model.
Second, the importance analysis revealed that the factors affecting apartment prices in Seoul were in the following order: accessibility to the Han River, heating type, CBD accessibility, household, longitude, area, latitude, age, and subway entrance. Meanwhile, PM2.5 and PM10 were found to be more important than accessibility to educational facilities and apartment brands. This implies that factors related to air pollution also contribute to a certain extent in determining apartment prices. Accordingly, when presenting various policies to stabilize apartment prices, there is a need to propose housing policies that consider environmental factors. Meanwhile, South Korea has considerable interest in PM among air pollutants. Accordingly, Information and Communication Technologies (ICT)-based mobile phone Global Positioning System (GPS) is used to determine PM levels at the current location by using data from the nearest monitoring station. Therefore, given the seriousness of air pollution issues globally, it is necessary to devise measures such as assigning PM labels to apartments during the home purchasing process, enabling buyers to consider PM and obtain relevant information accordingly. Additionally, implementing a certification and evaluation system for PM labels and offering incentives such as tax deductions for buildings with high ratings could be considered. As in Maslow’s theory that spiritual satisfaction can be pursued only when physiological and safety needs are satisfied, all people who own a house, regardless of gender, age, or occupation, should be able to escape the environmental risk of air pollution. This is because satisfying the need for safety when all surrounding factors are equal results in a subjective feeling of safety [94]. In that case, humans will move forward to satisfy their spirits.
Third, the apartment prices were higher for better accessibility to the Han River, Seoul’s representative waterfront space. Therefore, a housing policy is needed to ensure that more apartments are supplied so that more people can enjoy open spaces and to alleviate the increase in apartment prices around open spaces. In addition, there is a need to create a social mix by providing affordable housing in open spaces around the Han River.
Fourth, apartment prices increased with better accessibility to the CBD. The demand for a CBD is high owing to its convenience in facilities and transportation, but its supply is low owing to a lack of developable land and strict regulations. Therefore, there is a need to consider ways to expand supply by relaxing the floor area ratio when constructing apartments near the CBD. Instead, construction companies that receive incentives convert part of the land needed for apartment construction into open spaces that can be used by all citizens, thereby improving the overall quality of life.
Fifth, apartment prices increased when there was no individual heating. The representative heating types for apartments in Seoul include individual and district heating. Among them, district heating has good energy efficiency; therefore, residents have the advantage of lower maintenance costs, and it is believed that apartment prices are high owing to high demand. Therefore, when constructing new apartments in the future, it is necessary to adopt a district heating supply method and manage it to maintain eco-friendly apartment construction.
Sixth, apartment prices were higher in smaller areas. In Seoul, the birth rate is rapidly decreasing, and as a result, the number of family members is also rapidly decreasing. Accordingly, it is believed that the demand for small areas is increasing, rather than for unnecessarily large areas. Therefore, there is a need to further expand the supply of small-area apartments in line with the changes in South Korea’s demographic structure. Meanwhile, globally, countries with higher gross domestic product (GDP) per capita tend to have smaller families. Therefore, in countries with fast-growing economies, it may be necessary to be proactive about the supply of small-sized housing to prevent future small-sized housing shortages from causing prices to rise exponentially.
Finally, apartment prices were higher in areas with higher PM concentrations. This could be associated with human activities, as the areas where human activities are concentrated due to urban development tend to have higher apartment prices. In other words, the quality of life may be high in large cities formed by rapid growth due to the construction of various infrastructures. However, if the socioeconomic benefits obtained from the non-environmental factors considered in this study outweigh the advantages of living in areas with low air pollution, citizens may choose to reside in areas with high PM concentrations despite the potential adverse effects on their health. Therefore, the government must further optimize the environmental governance system to properly regulate and manage the relationship between urban development and air pollution. Real estate developers also need to devise measures to improve the air quality in the vicinity when constructing apartments.
This study had several limitations as well. First, the study utilized transaction data from 2019 to identify the factors influencing apartment prices in Seoul. Conducting a study based on a single year limits the ability to capture time-series changes in the independent variables that affect apartment prices, making it challenging to generalize the findings. Second, apartment prices can be influenced by macroeconomic indicators such as interest rates and economic growth rates. However, as this study focused on a single year, macroeconomic indicators were not incorporated. Therefore, future analyses that consider multiyear data and relevant macroeconomic indicators will provide a more accurate understanding of the causal relationships underlying temporal changes in apartment prices. Third, the interpolation method, which is a method of predicting the value of an unpredicted area through the values measured at actual points, allows for more accurate measurement of the surrounding area as more points are measured. Therefore, it is expected that the accuracy of the interpolation method can be further improved if more air pollution measurement stations are installed in the future. Lastly, in this study, the analysis was conducted using random forest, the most representative regression prediction method among the artificial intelligence methods. However, it is believed that if more diverse artificial intelligence algorithms are used in the future, more appropriate algorithms will be discovered to estimate housing prices.

Author Contributions

Conceptualization, S.P. and D.K.; methodology, S.P. and D.K.; writing—original draft preparation, S.P. and D.K.; writing—review and editing, S.P. and D.K. All authors have read and agreed to the published version of the manuscript.

Funding

This work was supported by the National Research Foundation of Korea (NRF) (NRF-2022R1F1A1076512) and by the Ministry of Education of the Republic of Korea and the National Research Foundation of Korea (NRF-2022S1A5A2A01049943).

Institutional Review Board Statement

Not applicable.

Informed Consent Statement

Not applicable.

Data Availability Statement

The original data presented in the study are openly available in Ministry of Land, Infrastructure and Transport (MOLIT) at https://rt.molit.go.kr/ (accessed on 21 May 2024).

Conflicts of Interest

The authors declare no conflicts of interest.

References

  1. Yuan, M.; Song, Y.; Huang, Y.; Shen, H.; Li, T. Exploring the Association between the Built Environment and Remotely Sensed PM2.5 Concentrations in Urban Areas. J. Clean. Prod. 2019, 220, 1014–1023. [Google Scholar] [CrossRef]
  2. Apte, J.S.; Marshall, J.D.; Cohen, A.J.; Brauer, M. Addressing Global Mortality from Ambient PM2.5. Environ. Sci. Technol. 2015, 49, 8057–8066. [Google Scholar] [CrossRef] [PubMed]
  3. Tang, M.; Niemeier, D. How Does Air Pollution Influence Housing Prices in the Bay Area? Int. J. Environ. Res. Public Health 2021, 18, 12195. [Google Scholar] [CrossRef]
  4. Rajagopalan, S.; Landrigan, P.J. Pollution and the Heart. N. Engl. J. Med. 2021, 385, 1881–1892. [Google Scholar] [CrossRef]
  5. Vohra, K.; Vodonos, A.; Schwartz, J.; Marais, E.A.; Sulprizio, M.P.; Mickley, L.J. Global Mortality from Outdoor Fine Particle Pollution Generated by Fossil Fuel Combustion: Results from GEOS-Chem. Environ. Res. 2021, 195, 110754. [Google Scholar] [CrossRef]
  6. Lin, S.; Liu, X.; Le, L.H.; Hwang, S.-A. Chronic Exposure to Ambient Ozone and Asthma Hospital Admissions among Children. Environ. Health Perspect. 2008, 116, 1725–1730. [Google Scholar] [CrossRef]
  7. Krämer, U.; Herder, C.; Sugiri, D.; Strassburger, K.; Schikowski, T.; Ranft, U.; Rathmann, W. Traffic-Related Air Pollution and Incident Type 2 Diabetes: Results from the SALIA Cohort Study. Environ. Health Perspect. 2010, 118, 1273–1279. [Google Scholar] [CrossRef] [PubMed]
  8. Cohen, A.J.; Brauer, M.; Burnett, R.; Anderson, H.R.; Frostad, J.; Estep, K.; Balakrishnan, K.; Brunekreef, B.; Dandona, L.; Dandona, R. Estimates and 25-Year Trends of the Global Burden of Disease Attributable to Ambient Air Pollution: An Analysis of Data from the Global Burden of Diseases Study 2015. Lancet 2017, 389, 1907–1918. [Google Scholar] [CrossRef] [PubMed]
  9. Wei, J.; Liu, S.; Li, Z.; Liu, C.; Qin, K.; Liu, X.; Pinker, R.T.; Dickerson, R.R.; Lin, J.; Boersma, K.F.; et al. Ground-Level NO 2 Surveillance from Space Across China for High Resolution Using Interpretable Spatiotemporally Weighted Artificial Intelligence. Environ. Sci. Technol. 2022, 56, 9988–9998. [Google Scholar] [CrossRef]
  10. Loomis, D.; Huang, W.; Chen, G. The International Agency for Research on Cancer (IARC) Evaluation of the Carcinogenicity of Outdoor Air Pollution: Focus on China. Chin. J. Cancer 2014, 33, 189. [Google Scholar] [CrossRef]
  11. Zhang, H.; Chen, J.; Wang, Z. Spatial Heterogeneity in Spillover Effect of Air Pollution on Housing Prices: Evidence from China. Cities 2021, 113, 103145. [Google Scholar] [CrossRef]
  12. Chen, X.; Ye, J. When the Wind Blows: Spatial Spillover Effects of Urban Air Pollution in China. J. Environ. Plan. Manag. 2019, 62, 1359–1376. [Google Scholar] [CrossRef]
  13. Zhao, D.; Sing, T.F. Air Pollution, Economic Spillovers, and Urban Growth in China. Ann. Reg. Sci 2017, 58, 321–340. [Google Scholar] [CrossRef]
  14. Huang, Z.; Skidmore, M. The Impact of Wildfires and Wildfire-Induced Air Pollution on House Prices in the United States. Land Econ. 2024, 100, 22–50. [Google Scholar] [CrossRef]
  15. Hong, J.; Choi, H.; Kim, W. A House Price Valuation Based on the Random Forest Approach: The Mass Appraisal of Residential Property in South Korea. Int. J. Strateg. Prop. Manag. 2020, 24, 140–152. [Google Scholar] [CrossRef]
  16. Adetunji, A.B.; Akande, O.N.; Ajala, F.A.; Oyewo, O.; Akande, Y.F.; Oluwadara, G. House Price Prediction Using Random Forest Machine Learning Technique. Procedia Comput. Sci. 2022, 199, 806–813. [Google Scholar] [CrossRef]
  17. Wu, C.; Du, Y.; Li, S.; Liu, P.; Ye, X. Does Visual Contact with Green Space Impact Housing Pricesʔ An Integrated Approach of Machine Learning and Hedonic Modeling Based on the Perception of Green Space. Land Use Policy 2022, 115, 106048. [Google Scholar] [CrossRef]
  18. Xue, C.; Ju, Y.; Li, S.; Zhou, Q. Research on the Sustainable Development of Urban Housing Price Based on Transport Accessibility: A Case Study of Xi’an, China. Sustainability 2020, 12, 1497. [Google Scholar] [CrossRef]
  19. Khosravi, M.; Arif, S.B.; Ghaseminejad, A.; Tohidi, H.; Shabanian, H. Performance Evaluation of Machine Learning Regressors for Estimating Real Estate House Prices. Preprints 2022, 2022090341. [Google Scholar] [CrossRef]
  20. Abidoye, R.B.; Chan, A.P.C. Improving Property Valuation Accuracy: A Comparison of Hedonic Pricing Model and Artificial Neural Network. Pac. Rim Prop. Res. J. 2018, 24, 71–83. [Google Scholar] [CrossRef]
  21. Ma, L.; Sun, B. Machine Learning and AI in Marketing–Connecting Computing Power to Human Insights. Int. J. Res. Mark. 2020, 37, 481–504. [Google Scholar] [CrossRef]
  22. Rai, A. Explainable AI: From Black Box to Glass Box. J. Acad. Mark. Sci. 2020, 48, 137–141. [Google Scholar] [CrossRef]
  23. Pinjaman, S.; Kogid, M. Macroeconomic determinants of house prices in Malaysia. J. Ekon. Malays. 2020, 54, 153–165. [Google Scholar] [CrossRef]
  24. Zou, C. The House Price Prediction Using Machine Learning Algorithm: The Case of Jinan, China. Highlights Sci. Eng. Technol. 2023, 39, 327–333. [Google Scholar] [CrossRef]
  25. Aziz, A.; Anwar, M.M.; Abdo, H.G.; Almohamad, H.; Al Dughairi, A.A.; Al-Mutiry, M. Proximity to Neighborhood Services and Property Values in Urban Area: An Evaluation through the Hedonic Pricing Model. Land 2023, 12, 859. [Google Scholar] [CrossRef]
  26. Hussain, T.; Abbas, J.; Wei, Z.; Nurunnabi, M. The Effect of Sustainable Urban Planning and Slum Disamenity on the Value of Neighboring Residential Property: Application of the Hedonic Pricing Model in Rent Price Appraisal. Sustainability 2019, 11, 1144. [Google Scholar] [CrossRef]
  27. Won, J.; Lee, J.-S. Investigating How the Rents of Small Urban Houses Are Determined: Using Spatial Hedonic Modeling for Urban Residential Housing in Seoul. Sustainability 2017, 10, 31. [Google Scholar] [CrossRef]
  28. Jun, M.-J. Quantifying Welfare Loss Due to Longer Commute Times in Seoul: A Two-Stage Hedonic Price Approach. Cities 2019, 84, 75–82. [Google Scholar] [CrossRef]
  29. Yazdani, M. Machine Learning, Deep Learning, and Hedonic Methods for Real Estate Price Prediction. arXiv 2021, arXiv:2110.07151. [Google Scholar] [CrossRef]
  30. Chen, Y.; Luo, Z. Hedonic Pricing of Houses in Megacities Pre-and Post-COVID-19: A Case Study of Shanghai, China. Sustainability 2022, 14, 11021. [Google Scholar] [CrossRef]
  31. Soltani, A.; Heydari, M.; Aghaei, F.; Pettit, C.J. Housing Price Prediction Incorporating Spatio-Temporal Dependency into Machine Learning Algorithms. Cities 2022, 131, 103941. [Google Scholar] [CrossRef]
  32. Belcher, R.N.; Chisholm, R.A. Tropical Vegetation and Residential Property Value: A Hedonic Pricing Analysis in Singapore. Ecol. Econ. 2018, 149, 149–159. [Google Scholar] [CrossRef]
  33. Xiao, Y.; Hui, E.C.; Wen, H. Effects of Floor Level and Landscape Proximity on Housing Price: A Hedonic Analysis in Hangzhou, China. Habitat Int. 2019, 87, 11–26. [Google Scholar] [CrossRef]
  34. Kalliola, J.; Kapočiūtė-Dzikienė, J.; Damaševičius, R. Neural Network Hyperparameter Optimization for Prediction of Real Estate Prices in Helsinki. PeerJ Comput. Sci. 2021, 7, e444. [Google Scholar] [CrossRef] [PubMed]
  35. Li, S.; Jiang, Y.; Ke, S.; Nie, K.; Wu, C. Understanding the Effects of Influential Factors on Housing Prices by Combining Extreme Gradient Boosting and a Hedonic Price Model (XGBoost-HPM). Land 2021, 10, 533. [Google Scholar] [CrossRef]
  36. Xiao, Y.; Chen, X.; Li, Q.; Yu, X.; Chen, J.; Guo, J. Exploring Determinants of Housing Prices in Beijing: An Enhanced Hedonic Regression with Open Access POI Data. ISPRS Int. J. Geoinf. 2017, 6, 358. [Google Scholar] [CrossRef]
  37. Kemunto, M.G.; Nyangena, W. Residential Housing Demand in Nairobi; A Hedonic Pricing Approach. Am. J. Health Econ. 2016, 1, 64–85. [Google Scholar] [CrossRef]
  38. Kahveci, M.; Sabaj, E. Determinant of Housing Rents in Urban Albania: An Empirical Hedonic Price Application with NSA Survey Data. Eurasian J. Econ. Financ. 2017, 5, 51–65. [Google Scholar] [CrossRef]
  39. Xu, X.; Qiu, W.; Li, W.; Liu, X.; Zhang, Z.; Li, X.; Luo, D. Associations between Street-View Perceptions and Housing Prices: Subjective vs. Objective Measures Using Computer Vision and Machine Learning Techniques. Remote Sens. 2022, 14, 891. [Google Scholar] [CrossRef]
  40. Montero, J.-M.; Mínguez, R.; Fernández-Avilés, G. Housing Price Prediction: Parametric versus Semi-Parametric Spatial Hedonic Models. J. Geogr. Syst. 2018, 20, 27–55. [Google Scholar] [CrossRef]
  41. Wen, H.; Xiao, Y.; Zhang, L. Spatial Effect of River Landscape on Housing Price: An Empirical Study on the Grand Canal in Hangzhou, China. Habitat Int. 2017, 63, 34–44. [Google Scholar] [CrossRef]
  42. Wen, H.; Gui, Z.; Tian, C.; Xiao, Y.; Fang, L. Subway Opening, Traffic Accessibility, and Housing Prices: A Quantile Hedonic Analysis in Hangzhou, China. Sustainability 2018, 10, 2254. [Google Scholar] [CrossRef]
  43. Cui, N.; Gu, H.; Shen, T.; Feng, C. The Impact of Micro-Level Influencing Factors on Home Value: A Housing Price-Rent Comparison. Sustainability 2018, 10, 4343. [Google Scholar] [CrossRef]
  44. Duan, J.; Tian, G.; Yang, L.; Zhou, T. Addressing the Macroeconomic and Hedonic Determinants of Housing Prices in Beijing Metropolitan Area, China. Habitat Int. 2021, 113, 102374. [Google Scholar] [CrossRef]
  45. Hussain, T.; Abbas, J.; Wei, Z.; Ahmad, S.; Xuehao, B.; Gaoli, Z. Impact of Urban Village Disamenity on Neighboring Residential Properties: Empirical Evidence from Nanjing through Hedonic Pricing Model Appraisal. J. Urban Plan. Dev. 2021, 147, 04020055. [Google Scholar] [CrossRef]
  46. Seo, J.; Oh, J.; Kim, J. The Effects of Inundation Hazard Information on Residential Property Value: The Case of Seoul. J. Korean Apprais. Soc. 2020, 19, 165–185. [Google Scholar] [CrossRef]
  47. Bae, S. Effects of Urban Railway attributes on Housing Prices: Case of Apartments in Incheon Metropolitan City. Rev. Real Estate Urban Stud. 2020, 12, 63–81. [Google Scholar] [CrossRef]
  48. Kim, W.; Lee, S.; Jang, H.; Kim, J.; Hong, J. Analysis of Structural Change of Housing Preferences using Hedonic Price Model: Case Study of Apartment Transaction Data from 2006 to 2017 in Gangnam Area. Korea Real Estate Acad. Rev. 2019, 76, 137–150. [Google Scholar]
  49. Heo, S.; Chung, J. A Study on the Determinants of Apartment Price by Living Area in Sejong City’s Multifunctional Administration City. Korea Real Estate Acad. Rev. 2022, 86, 41–65. [Google Scholar] [CrossRef]
  50. Kim, H.N.; Kim, J.H.; Lee, J.H.; Huh, Y.K. Analysis of Factors Affecting Apartment Market Price Located Nearby Jangjeon Campus of Pusan National University. Archit. Inst. Korea-RA 2016, 18, 183–190. [Google Scholar]
  51. Huang, Z.; Chen, R.; Xu, D.; Zhou, W. Spatial and Hedonic Analysis of Housing Prices in Shanghai. Habitat Int. 2017, 67, 69–78. [Google Scholar] [CrossRef]
  52. Sun, H.; Wang, Y.; Li, Q. The Impact of Subway Lines on Residential Property Values in Tianjin: An Empirical Study Based on Hedonic Pricing Model. Discret. Dyn. Nat. Soc. 2016, 2016, e1478413. [Google Scholar] [CrossRef]
  53. Dziauddin, M.F. An Investigation of Condominium Property Value Uplift around Light Rail Transit Stations Using a Hedonic Pricing Model. IOP Conf. Ser. Earth Environ. Sci. 2019, 286, 012032. [Google Scholar] [CrossRef]
  54. Hawkins, J.; Habib, K.N. Spatio-Temporal Hedonic Price Model to Investigate the Dynamics of Housing Prices in Contexts of Urban Form and Transportation Services in Toronto. Transp. Res. Rec. 2018, 2672, 21–30. [Google Scholar] [CrossRef]
  55. Kang, Y.; Zhang, F.; Gao, S.; Peng, W.; Ratti, C. Human Settlement Value Assessment from a Place Perspective: Considering Human Dynamics and Perceptions in House Price Modeling. Cities 2021, 118, 103333. [Google Scholar] [CrossRef]
  56. Zhang, Y.; Dong, R. Impacts of Street-Visible Greenery on Housing Prices: Evidence from a Hedonic Price Model and a Massive Street View Image Dataset in Beijing. ISPRS Int. J. Geoinf. 2018, 7, 104. [Google Scholar] [CrossRef]
  57. Nguyen, T.T.M.; Nguyen, T.M.C. Analyzing the Impact of Accessibility on Property Price by Using Hedonic-Price Modelling for Supporting Urban Land Management towards TOD in Hanoi, Vietnam. IOP Conf. Ser. Mater. Sci. Eng. 2020, 869, 062039. [Google Scholar] [CrossRef]
  58. Polichetti, G.; Cocco, S.; Spinali, A.; Trimarco, V.; Nunziata, A. Effects of particulate matter (PM10, PM2.5 and PM1) on the cardiovascular system. Toxicology 2009, 261, 1–8. [Google Scholar] [CrossRef]
  59. Zhang, R.; Wang, G.; Guo, S.; Zamora, M.L.; Ying, Q.; Lin, Y.; Wang, W.; Hu, M.; Wang, Y. Formation of urban fine particulate matter. ACS Publ. 2015, 115, 3803–3855. [Google Scholar] [CrossRef]
  60. Zhang, S.; Zhou, Y.; Xu, P. Air Quality Affects House Prices—Analysis Based on RD of the Huai River Policy. Sustain. Cities Soc. 2022, 85, 104017. [Google Scholar] [CrossRef]
  61. Xue, W.; Li, X.; Yang, Z.; Wei, J. Are House Prices Affected by PM2.5 Pollution? Evidence from Beijing, China. Int. J. Environ. Res. Public Health 2022, 19, 8461. [Google Scholar] [CrossRef]
  62. Borja-Urbano, S.; Rodriguez Espinosa, F.; Luna-Ludeña, M.; Toulkeridis, T. Valuing the Impact of Air Pollution in Urban Residence Using Hedonic Pricing and Geospatial Analysis, Evidence From Quito, Ecuador. Air Soil Water Res. 2021, 14, 117862212110532. [Google Scholar] [CrossRef]
  63. Zou, G.; Lai, Z.; Li, Y.; Liu, X.; Li, W. Exploring the Nonlinear Impact of Air Pollution on Housing Prices: A Machine Learning Approach. Econ. Transp. 2022, 31, 100272. [Google Scholar] [CrossRef]
  64. Chen, X.; Shao, S.; Tian, Z.; Xie, Z.; Yin, P. Impacts of Air Pollution and Its Spatial Spillover Effect on Public Health Based on China’s Big Data Sample. J. Clean. Prod. 2017, 142, 915–925. [Google Scholar] [CrossRef]
  65. Sun, B.; Yang, S. Asymmetric and Spatial Non-Stationary Effects of Particulate Air Pollution on Urban Housing Prices in Chinese Cities. Int. J. Environ. Res. Public Health 2020, 17, 7443. [Google Scholar] [CrossRef] [PubMed]
  66. Dai, J.; Lv, P.; Ma, Z.; Bi, J.; Wen, T. Environmental Risk and Housing Price: An Empirical Study of Nanjing, China. J. Clean. Prod. 2020, 252, 119828. [Google Scholar] [CrossRef]
  67. Organization for Economic Cooperation and Development (OECD). Available online: https://data.oecd.org/air/air-pollution-exposure.htm (accessed on 15 July 2023).
  68. Beimer, J.; Francke, M. Out-of-Sample House Price Prediction by Hedonic Price Models and Machine Learning Algorithms. Real Estate Res. Q. 2019, 18, 13–20. [Google Scholar]
  69. Ho, W.K.O.; Tang, B.-S.; Wong, S.W. Predicting Property Prices with Machine Learning Algorithms. J. Prop. Res. 2021, 38, 48–70. [Google Scholar] [CrossRef]
  70. Ministry of Land, Infrastructure and Transport (MOLIT). Available online: https://rtdown.molit.go.kr/ (accessed on 3 June 2023).
  71. Setianto, A.; Triandini, T. Comparison of kriging and inverse distance weighted (IDW) interpolation methods in lineament extraction and analysis. J. Appl. Geol. 2013, 5, 21–29. [Google Scholar] [CrossRef]
  72. Dias, I.; Wijeweera, P. Assessing the Walk-Score of Walking Paths in Kandy City Area for Better Walking Experience for the Tourists. J. Inst. Eng. Sri Lanka 2021, 54, 27–38. [Google Scholar] [CrossRef]
  73. Pratama, Y. Identifying Public Facilities Surrounding MRT Stations Based on Pedestrian Walking Distance Using GIS-Based Buffer and Spatial Query Method (Case Study: Central and South Jakarta). SuperMap Cup, 15 August 2018. Available online: https://www.researchgate.net/publication/327754944_Identifying_Public_Facilities_Surrounding_MRT_Stations_Based_on_Pedestrian_Walking_Distance_using_GIS-Based_Buffer_and_Spatial_Query_Method_Case_study_Central_and_South_Jakarta (accessed on 21 May 2024).
  74. Etman, A.; Kamphuis, C.B.; Prins, R.G.; Burdorf, A.; Pierik, F.H.; van Lenthe, F.J. Characteristics of Residential Areas and Transportational Walking among Frail and Non-Frail Dutch Elderly: Does the Size of the Area Matter? Int. J. Health Geogr. 2014, 13, 7. [Google Scholar] [CrossRef] [PubMed]
  75. Abdul, H.N.; Mokhlas, H.; Tan, P.L.; Mustafa, M.; Sham, R. Towards Predicting the Walkability of Pedestrian Rail Commuters in Kuala Lumpur Conurbation. Int. J. Humanit. Arts Soc. Sci. 2015, 1, 48–61. [Google Scholar] [CrossRef]
  76. Malpezzi, S. Hedonic Pricing Models: A Selective and Applied Review. In Housing Economics and Public Policy; Blackwell Science Ltd.: Boston, MA, USA, 2001; Volume 10, pp. 67–89. [Google Scholar]
  77. Breiman, L. Random Forests. Mach. Learn. 2001, 45, 5–32. [Google Scholar] [CrossRef]
  78. Breiman, L. Bagging Predictors. Mach. Learn. 1996, 24, 123–1402. [Google Scholar] [CrossRef]
  79. Kiely, T.J.; Bastian, N.D. The Spatially Conscious Machine Learning Model. Stat. Anal. Data Min. 2020, 13, 31–49. [Google Scholar] [CrossRef]
  80. Kulkarni, V.; Sinha, P. Pruning of Random Forest Classifiers: A Survey and Future Directions. In Proceedings of the International Conference on Data Science & Engineering (ICDSE), Cochin, India, 18–20 July 2012; IEEE: Manhattan, NY, USA, 2012. [Google Scholar] [CrossRef]
  81. Karamanou, A.; Kalampokis, E.; Tarabanis, K. Linked Open Government Data to Predict and Explain House Prices: The Case of Scottish Statistics Portal. Big Data Res. 2022, 30, 100355. [Google Scholar] [CrossRef]
  82. Utama, C.; Meske, C.; Schneider, J.; Schlatmann, R.; Ulbrich, C. Explainable Artificial Intelligence for Photovoltaic Fault Detection: A Comparison of Instruments. Sol. Energy 2023, 249, 139–151. [Google Scholar] [CrossRef]
  83. Srivastava, P.R.; Mangla, S.K.; Eachempati, P.; Tiwari, A.K. An Explainable Artificial Intelligence Approach to Understanding Drivers of Economic Energy Consumption and Sustainability. Energy Econ. 2023, 125, 106868. [Google Scholar] [CrossRef]
  84. Lundberg, S.; Lee, S.-I. A Unified Approach to Interpreting Model Predictions. In Proceedings of the Advances in Neural Information Processing Systems (NIPS2017), Long Beach, CA, USA, 4–9 December 2017; Volume 30, pp. 4765–4774. [Google Scholar]
  85. Dou, M.; Gu, Y.; Fan, H. Incorporating Neighborhoods with Explainable Artificial Intelligence for Modeling Fine-Scale Housing Prices. Appl. Geogr. 2023, 158, 103032. [Google Scholar] [CrossRef]
  86. Sachit, M.S.; Shafri, H.Z.M.; Abdullah, A.F.; Rafie, A.S.M.; Gibril, M.B.A. Global spatial suitability mapping of wind and solar systems using an explainable ai-based approach. ISPRS Int. J. Geo-Inf. 2022, 11, 422. [Google Scholar] [CrossRef]
  87. Matin, S.S.; Pradhan, B. Earthquake-Induced Building-Damage Mapping Using Explainable Ai (Xai). Sensors 2021, 21, 4489. [Google Scholar] [CrossRef] [PubMed]
  88. Collini, E.; Palesi, L.A.I.; Nesi, P.; Pantaleo, G.; Nocentini, N.; Rosi, A. Predicting and Understanding Landslide Events with Explainable AI. IEEE Access 2022, 10, 31175–31189. [Google Scholar] [CrossRef]
  89. Potrawa, T.; Tetereva, A. How Much Is the View from the Window Worth? Machine Learning-Driven Hedonic Pricing Model of the Real Estate Market. J. Bus. Res. 2022, 144, 50–65. [Google Scholar] [CrossRef]
  90. Ministry of Land, Infrastructure and Transport (MOLIT). 5th Integrated Energy Supply Master Plan; MOLIT: Sejong, Republic of Korea, 2020.
  91. Jung, I.S.; Kim, J.Y.; Yoo, S.H. Analysis of the influence of residential heating method on apartment prices: An empirical study of Gyeyang-gu, Incheon, Korea. Korea Soc. Innov. 2022, 17, 177–193. [Google Scholar] [CrossRef]
  92. Korean Statistical Information Service (KOSIS). Available online: https://kosis.kr/statHtml/statHtml.do?orgId=101&tblId=DT_1B81A21&checkFlag=N (accessed on 8 January 2024).
  93. Pant, P.; Harrison, R.M. Estimation of the Contribution of Road Traffic Emissions to Particulate Matter Concentrations from Field Measurements: A Review. Atmos. Environ. 2013, 77, 78–97. [Google Scholar] [CrossRef]
  94. Zavei, S.J.A.P.; Jusan, M.M. Exploring housing attributes selection based on Maslow’s hierarchy of needs. Procedia Soc. Behav. Sci. 2012, 42, 311–319. [Google Scholar] [CrossRef]
Figure 1. Study area.
Sustainability 16 04453 g001
Figure 2. Air monitoring stations in Seoul.
Sustainability 16 04453 g002
Figure 3. (a) Spatial distribution of PM2.5. (b) Spatial distribution of PM10.
Sustainability 16 04453 g003aSustainability 16 04453 g003b
Figure 4. Importance of features.
Sustainability 16 04453 g004
Figure 5. Effect of features.
Sustainability 16 04453 g005
Table 1. Variable description.
ClassificationValuesDescriptions
Dependent
variable
PriceNumericalApartment transaction prices
Structure
characteristics
AreaNumericalArea of transacted apartment
FloorNumericalFloor of transacted apartment
EntranceCategoricalEntrance of transacted apartment
(1: Stair 0: Otherwise)
RoomNumericalNumber of rooms in transacted apartment
BathNumericalNumber of baths in transacted apartment
Dwelling
characteristics
AgeNumericalAge of transacted apartment
Age2NumericalSquare of the age of transacted apartment
HouseholdNumericalNumber of households in
transacted apartment
Parking lotNumericalParking lots per household in
transacted apartment
HeatingCategoricalHeating type of transacted apartment
(1: individual 0: Otherwise)
BrandCategoricalConstruction ranking of transacted apartment
(1: Top 10 0: Otherwise)
PM
characteristics
PM2.5NumericalAverage PM2.5 concentration within a 400 m radius of transacted apartment
PM10NumericalAverage PM10 concentration within a 400 m radius of transacted apartment
Accessibility
characteristics
CBDNumericalDistance from the transacted apartment
to the CBD
Han riverNumericalDistance from the transacted apartment
to the Han river
Park and greenNumericalDistance from the transacted apartment
to the park and green area
Bus stopNumericalDistance from the transacted apartment
to the bus stop
Subway exitNumericalDistance from the transacted apartment
to the subway exit
KindergartenNumericalDistance from the transacted apartment
to the kindergarten
Elementary schoolNumericalDistance from the transacted apartment
to the elementary school
High schoolNumericalDistance from the transacted apartment
to the high school
Location
characteristics
LongitudeNumericalLongitude of transacted apartment
LatitudeNumericalLatitude of transacted apartment
Table 2. Descriptive statistics.
ClassificationUnitsMinMaxMeanStd. Dev
Dependent
variable
Price10,000 ₩/m2163.19
($1394.79)
4336.95
($37,067.95)
1036.15
($8855.98)
506.65
($4330.34)
Structure
characteristics
Aream210.78273.8278.3830.41
FloorNumber1679.516.26
EntranceDummy010.700.46
RoomNumber182.910.738
BathNumber141.620.51
Dwelling
characteristics
AgeNumber05118.119.509
Age2(Number)202601418.42381.60
Household100 households0.0595.1010.9511.87
Parking lotNumber0.0211.961.120.52
HeatingDummy010.650.48
BrandDummy010.370.48
PM
characteristics
PM2.5μg/m322.1729.5325.470.96
PM10μg/m334.8049.1743.472.11
Accessibility
characteristics
CBD100 m2.05154.0563.8232.55
Han river100 m0.54147.9742.1934.24
Park and green100 m0.0011.221.651.37
Bus stop100 m0.085.601.280.68
Subway exit100 m0.1231.035.203.76
Kindergarten100 m0.0019.513.042.21
Elementary school100 m0.2217.603.271.56
High school100 m0.4029.166.003.51
Location
characteristics
Longitudedegree126.81127.18127.000.09
Latitudedegree37.4337.6937.550.06
Table 3. Model evaluation.
ClassificationHedonic Price ModelRandom Forest
R20.6760.962
MAE0.1950.059
RMSE0.2530.083
Table 4. Hedonic price model.
ClassificationCoef.Std Err.t
Intercept−90.783 ***1.991−45.589
Apartment
characteristics
Structure
characteristics
Area−0.004 ***0.000−58.327
Floor0.003 ***0.00021.553
Entrance0.027 ***0.0039.529
Room0.041 ***0.00218.157
Bath0.0060.0031.842
Dwelling
characteristics
Age−0.035 ***0.000−98.170
Age20.001 ***0.00092.040
Household0.004 ***0.00037.715
Parking lot0.099 ***0.00338.688
Heating−0.263 ***0.002−111.493
Brand0.107 ***0.00248.947
Built
environment
characteristics
PM
characteristics
PM2.50.062 ***0.00142.373
PM10−0.013 ***0.001−17.936
Accessibility
characteristics
CBD−0.005 ***0.000−89.823
Han river−0.002 ***0.000−31.026
Park and green−0.010 ***0.001−14.317
Bus stop0.044***0.00129.906
Subway exit−0.014 ***0.000−50.700
Kindergarten0.004 ***0.0008.578
Elementary school−0.009 ***0.001−13.081
High school−0.006 ***0.000−19.608
Location
characteristics
Longitude1.094 ***0.01383.650
Latitude−1.104 ***0.027−40.427
*** p < 0.001.
Table 5. Hyperparameter values.
ClassificationHyperparameter Values
Estimators83
Max featuresauto
Max depth19
Cross validation5
Iteration100
Disclaimer/Publisher’s Note: The statements, opinions and data contained in all publications are solely those of the individual author(s) and contributor(s) and not of MDPI and/or the editor(s). MDPI and/or the editor(s) disclaim responsibility for any injury to people or property resulting from any ideas, methods, instructions or products referred to in the content.

