
Life Cycle Assessment of Plant-Based vs. Beef Burgers: A Case Study in the UK


Abstract

1. Introduction and Literature Review
1.1. Background
1.2. Plant-Based Meat Analogues (PBMAs) and Production Methods (Extrusion)
1.3. Life Cycle Assessment (LCA) Overview and Studies on PBMAs
1.4. Context and Justification of the Research
1.5. Goals of the Current Study
- The primary objective of this study is to evaluate the environmental impacts of plant-based burger patties compared to traditional beef burgers, highlighting the potential benefits and areas for policy enhancement.
2. Materials and Methods
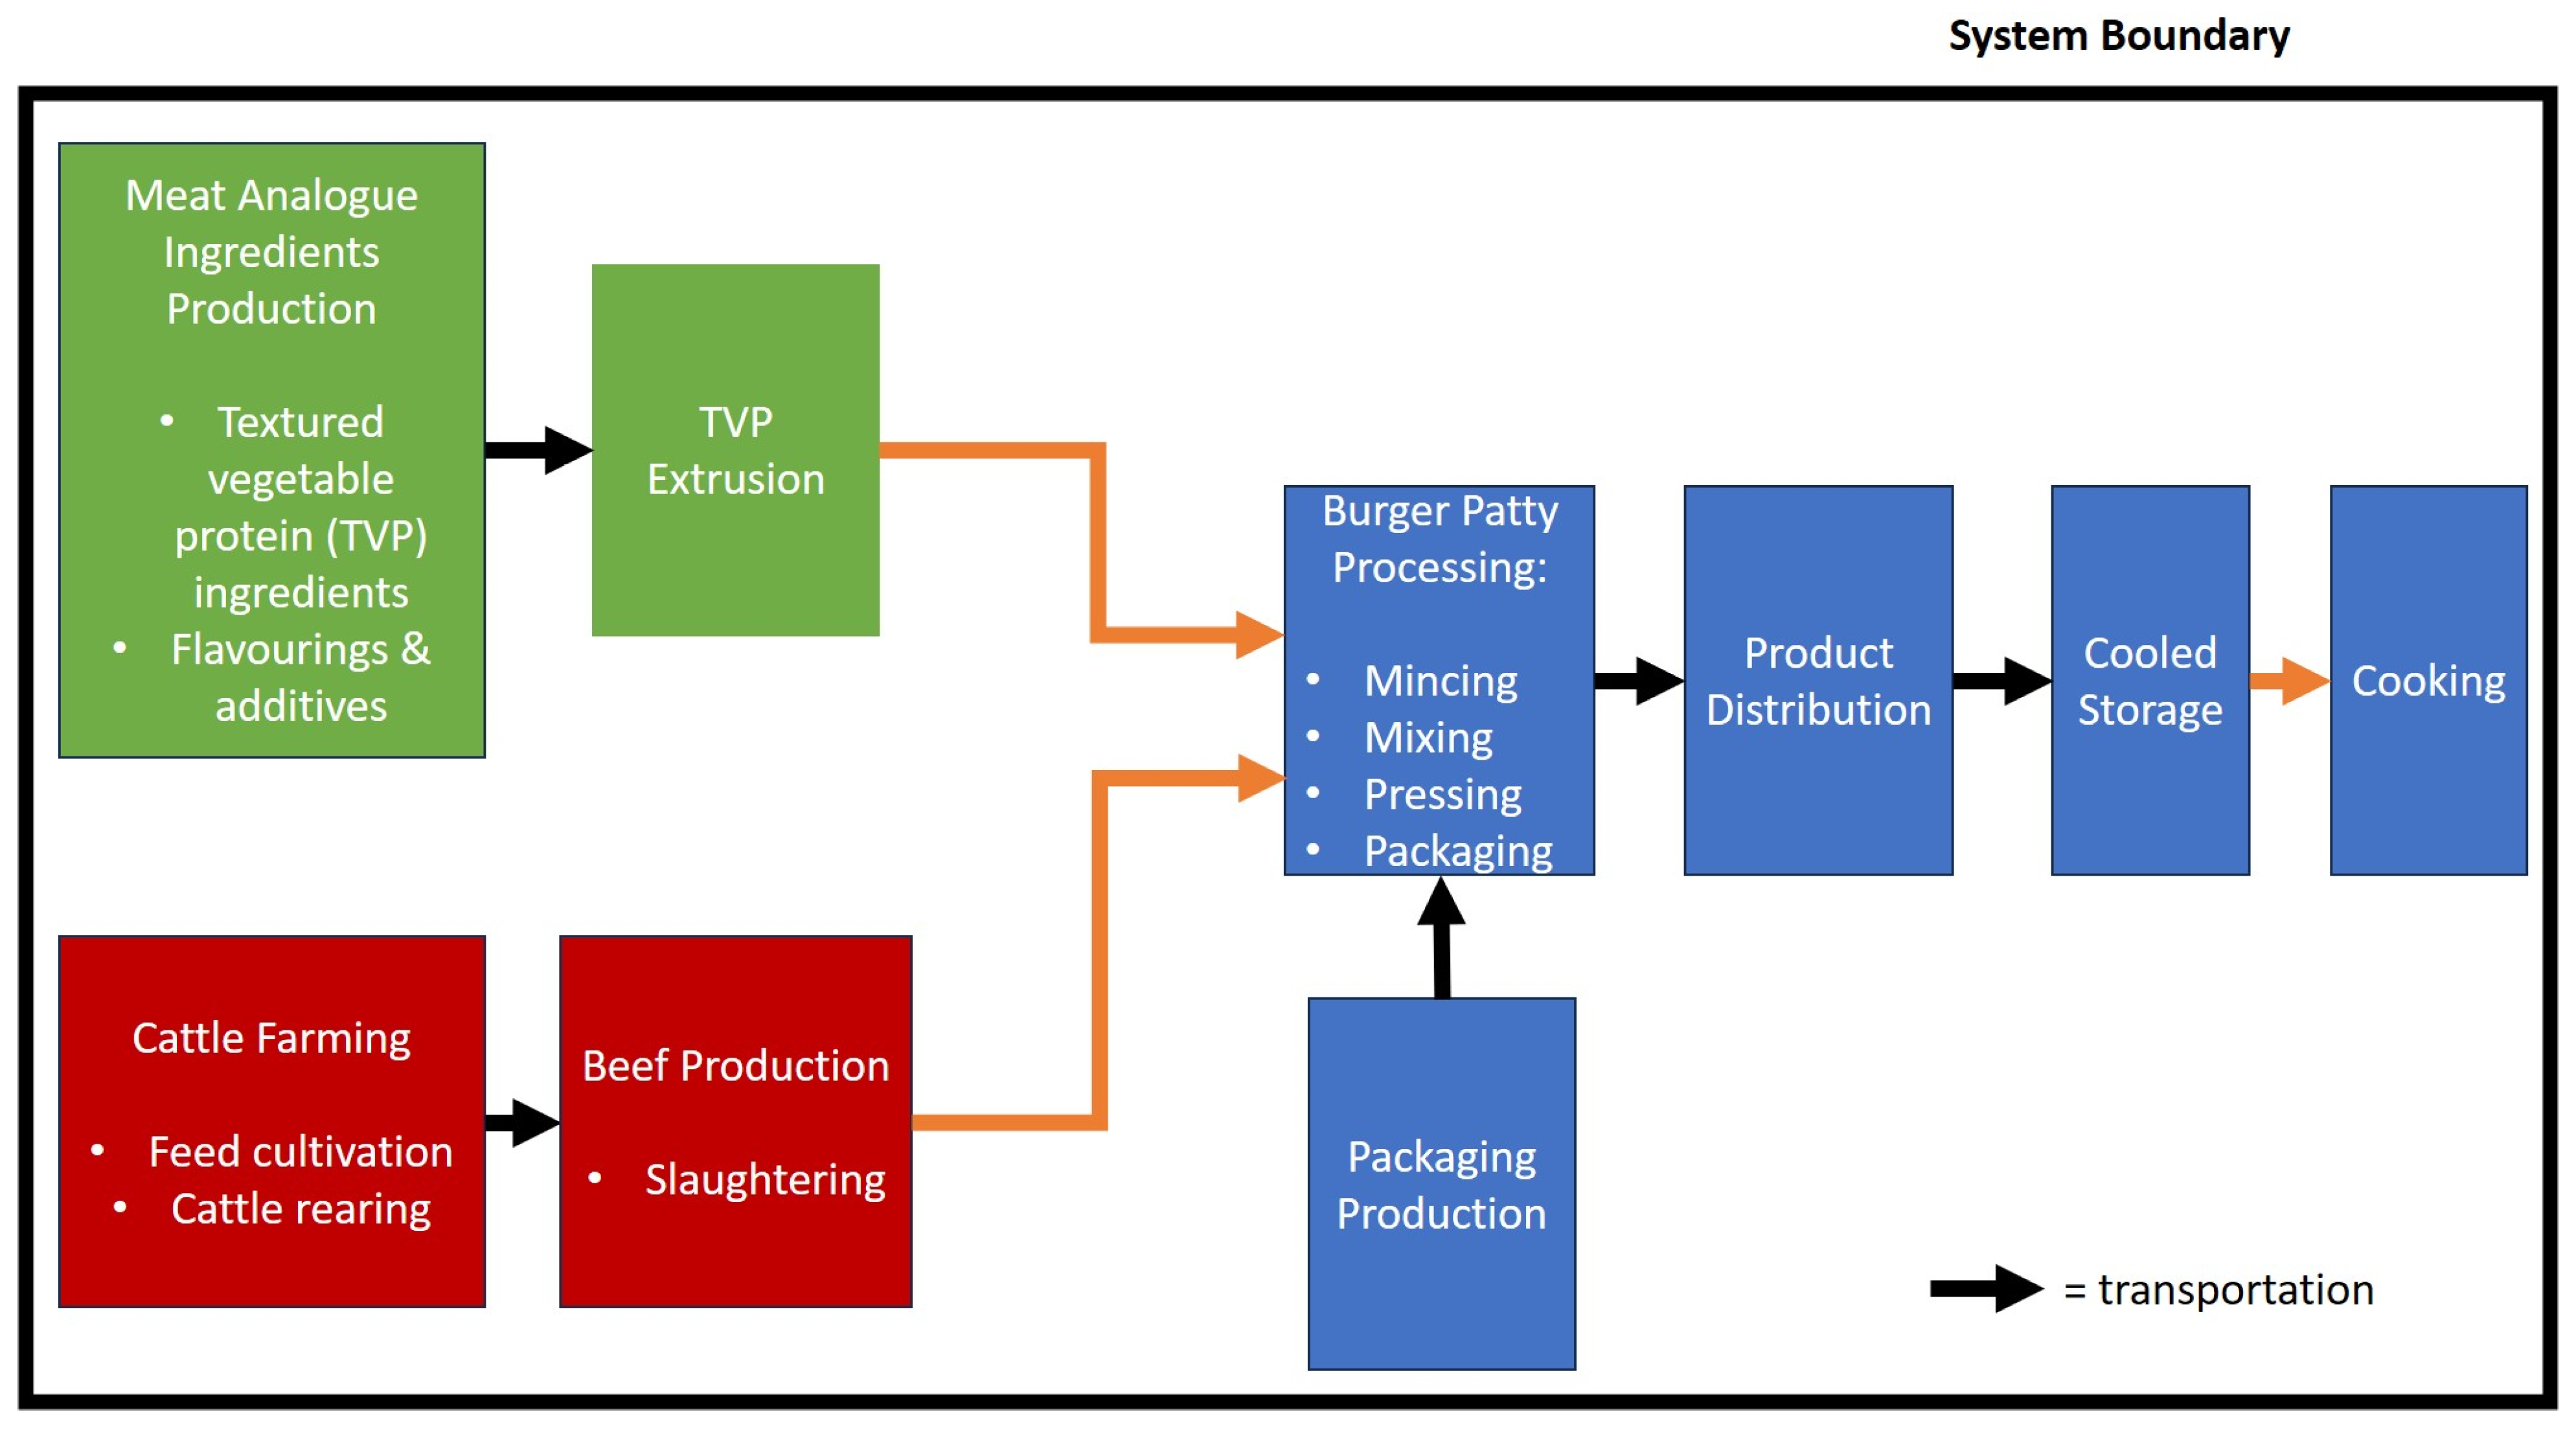
2.1. Goal, Scope, Functional Unit and System Boundary Definition
- Meat analogue (MA)—a 100 g plant-based burger patty produced in the UK with globally sourced ingredients.
- Beef burger (BB)—a 100 g British beef burger patty produced in the UK.
2.2. Life Cycle Inventory Analysis (LCIA)
2.2.1. Software, Data and Sources
2.2.2. Meat Analogue Ingredients (Cultivation and TVP Extrusion)
2.2.3. Beef Burger Ingredients and Production
2.2.4. Shared Stages (Burger Processing, Packaging, Distribution, Storage and Cooking)

| Stage | Input/Output/Process | Units | Input | Output | Source of Origin | Source of Process/Information |
|---|---|---|---|---|---|---|
| Beef Production (Feed Cultivation) | Fertiliser (N) | kg | 0.032 | UK | WFLDB [46] | |
| Fertiliser (P2O5) | kg | 0.022 | ||||
| Fertiliser (K2O) | kg | 0.025 | ||||
| Beef Production (Cattle Rearing) | Feed for cattle | kg | 0.65 | UK | WFLDB [46] | |
| Grazed grass | kg | 2.24 | ||||
| Manure | 0.805 | |||||
| Beef Production (Slaughtering) | Beef cattle live weight, mixed system | kg | 0.183 | UK | WFLDB [46] | |
| Slaughtering waste, beef cattle | kg | 0.092 | ||||
| Beef, fresh meat at slaughterhouse | kg | 0.091 | ||||
| Other BB Ingredients | Potato starch | kg | 0.004 | Netherlands [58] | Agri-footprint [42] | |
| Potato starch lorry transport | kg·km | 3.6 | European Commission [55] | |||
| Salt | kg | 0.001 | UK [53] | Ecoinvent [44] | ||
| Salt lorry transport | kg·km | 0.1 | Assumption [54] | |||
| Black pepper (BP) | kg | 0.0005 | Vietnam [64] | AGRIBALYSE [43] | ||
| BP container ship transport | kg·km | 8.25 | SeaRates [56] | |||
| BP lorry transport | kg·km | 0.5 | European Commission [55] | |||
| Tap water | kg | 0.004 | UK | Ecoinvent [44] | ||
| Burger Processing | Electricity for grinding/mixing | kWh | 0.0022 | Saerens et al. [30] | ||
| Losses from equipment cleaning | kg | 0.5 | Assumption [61] | |||
| Packaging | Thermoformed polypropylene tray | kg | 0.0235 | UK [65] | USLCI [45] | |
| Polyethylene lid film | kg | 0.0017 | USLCI [45] | |||
| Lorry transport | kg·km | 2.518 | European Commission [55] | |||
| Distribution | Burger transport, lorry with refrigeration machine | kg·km | 12.5 | EPD International AB [63] | ||
| Burger transport, passenger car | km | 4.35 | Piecyk et al. [62] | |||
| Storage | Energy for cooling | kWh | 0.034 | EPD International AB [63] | ||
| Cooking | Energy for cooking gas | kWh | 0.69 | European Commission [55] | ||
| Energy for cooking electricity | kWh | 0.23 | EPD International AB [63] | |||
| Cooked burger patty | Item | 1 |
| Stage | Input/Output/Process | Units | Input | Output | Source of Origin | Source of Process/Information |
|---|---|---|---|---|---|---|
| TVP Protein Production | Soy protein isolate (SPI) | kg | 0.0398 | USA [66] | Agri-footprint [42] | |
| SPI container ship transport | kg·km | 338.1 | SeaRates [56] | |||
| SPI lorry transport | kg·km | 39.8 | European Commission [55] | |||
| Vital wheat gluten (WG) | kg | 0.0318 | China [67] | Agri-footprint [42] | ||
| WG container ship transport | kg·km | 572.8 | SeaRates [56] | |||
| WG lorry transport | kg·km | 31.8 | European Commission [55] | |||
| Cornstarch (CS) | kg | 0.008 | USA [68] | Agri-footprint [42] | ||
| CS container ship transport | kg·km | 67.6 | SeaRates [56] | |||
| CS lorry transport | kg·km | 8.0 | European Commission [55] | |||
| Water influent | kg | 0.0199 | Saerens et al., Samard et al. [30,48] | |||
| Cooling water for extrusion | kg | 1.4396 | 1.4396 | Saerens et al. [30] | ||
| Electricity for extrusion | kWh | 0.023 | Saerens et al. [30] | |||
| Water vapour | kg | 0.0098 | Saerens et al. [30] | |||
| Combined waste from TVP production | kg | 0.0063 | Saerens et al. [30] | |||
| Other MA Ingredients | Coconut oil (CO) | kg | 0.0126 | Philippines [69] | Agri-footprint [42] | |
| CO ship tanker transport | kg·km | 220.5 | SeaRates [56] | |||
| CO lorry transport | kg·km | 12.6 | European Commission [55] | |||
| Carboxymethylcellulose (CMC) | kg | 0.003 | Finland [70] | Ecoinvent [44] | ||
| CMC container ship transport | kg·km | 6 | SeaRates [56] | |||
| CMC lorry transport | kg·km | 1.2 | European Commission [55] | |||
| Sodium phosphate (SP) | kg | 0.0005 | USA [71] | Ecoinvent [44] | ||
| SP container ship transport | kg·km | 4.3 | SeaRates [56] | |||
| SP lorry transport | kg·km | 0.5 | European Commission [55] | |||
| Salt | kg | 0.0001 | UK [53] | Ecoinvent [44] | ||
| Salt lorry transport | kg·km | 0.01 | Assumption [54] | |||
| Monosodium glutamate (MSG) | kg | 0.0005 | China [72] | WFLDB [46] | ||
| MSG container ship transport | kg·km | 9 | SeaRates [56] | |||
| MSG lorry transport | kg·km | 0.5 | European Commission [55] | |||
| Black pepper (BP) | kg | 0.0004 | Vietnam [64] | AGRIBALYSE [43] | ||
| BP container ship transport | kg·km | 6.6 | SeaRates [56] | |||
| BP lorry transport | kg·km | 0.4 | European Commission [55] | |||
| Burger Processing | Electricity for grinding/mixing | kWh | 0.0022 | Saerens et al. [30] | ||
| Losses from equipment cleaning | kg | 0.5 | Assumption [61] | |||
| Packaging | Thermoformed polypropylene tray | kg | 0.0235 | UK [65] | USLCI [45] | |
| Polyethylene lid film | kg | 0.0017 | USLCI [45] | |||
| Lorry transport | kg·km | 2.518 | European Commission [55] | |||
| Distribution | Burger transport, lorry with refrigeration machine | kg·km | 12.5 | EPD International AB [63] | ||
| Burger transport, passenger car | km | 4.35 | Piecyk et al. [62] | |||
| Storage | Energy for cooling | kWh | 0.034 | EPD International AB [63] | ||
| Cooking | Energy for cooking gas | kWh | 0.69 | European Commission [55] | ||
| Energy for cooking electricity | kWh | 0.23 | EPD International AB [63] | |||
| Cooked burger patty | Item | 1 |
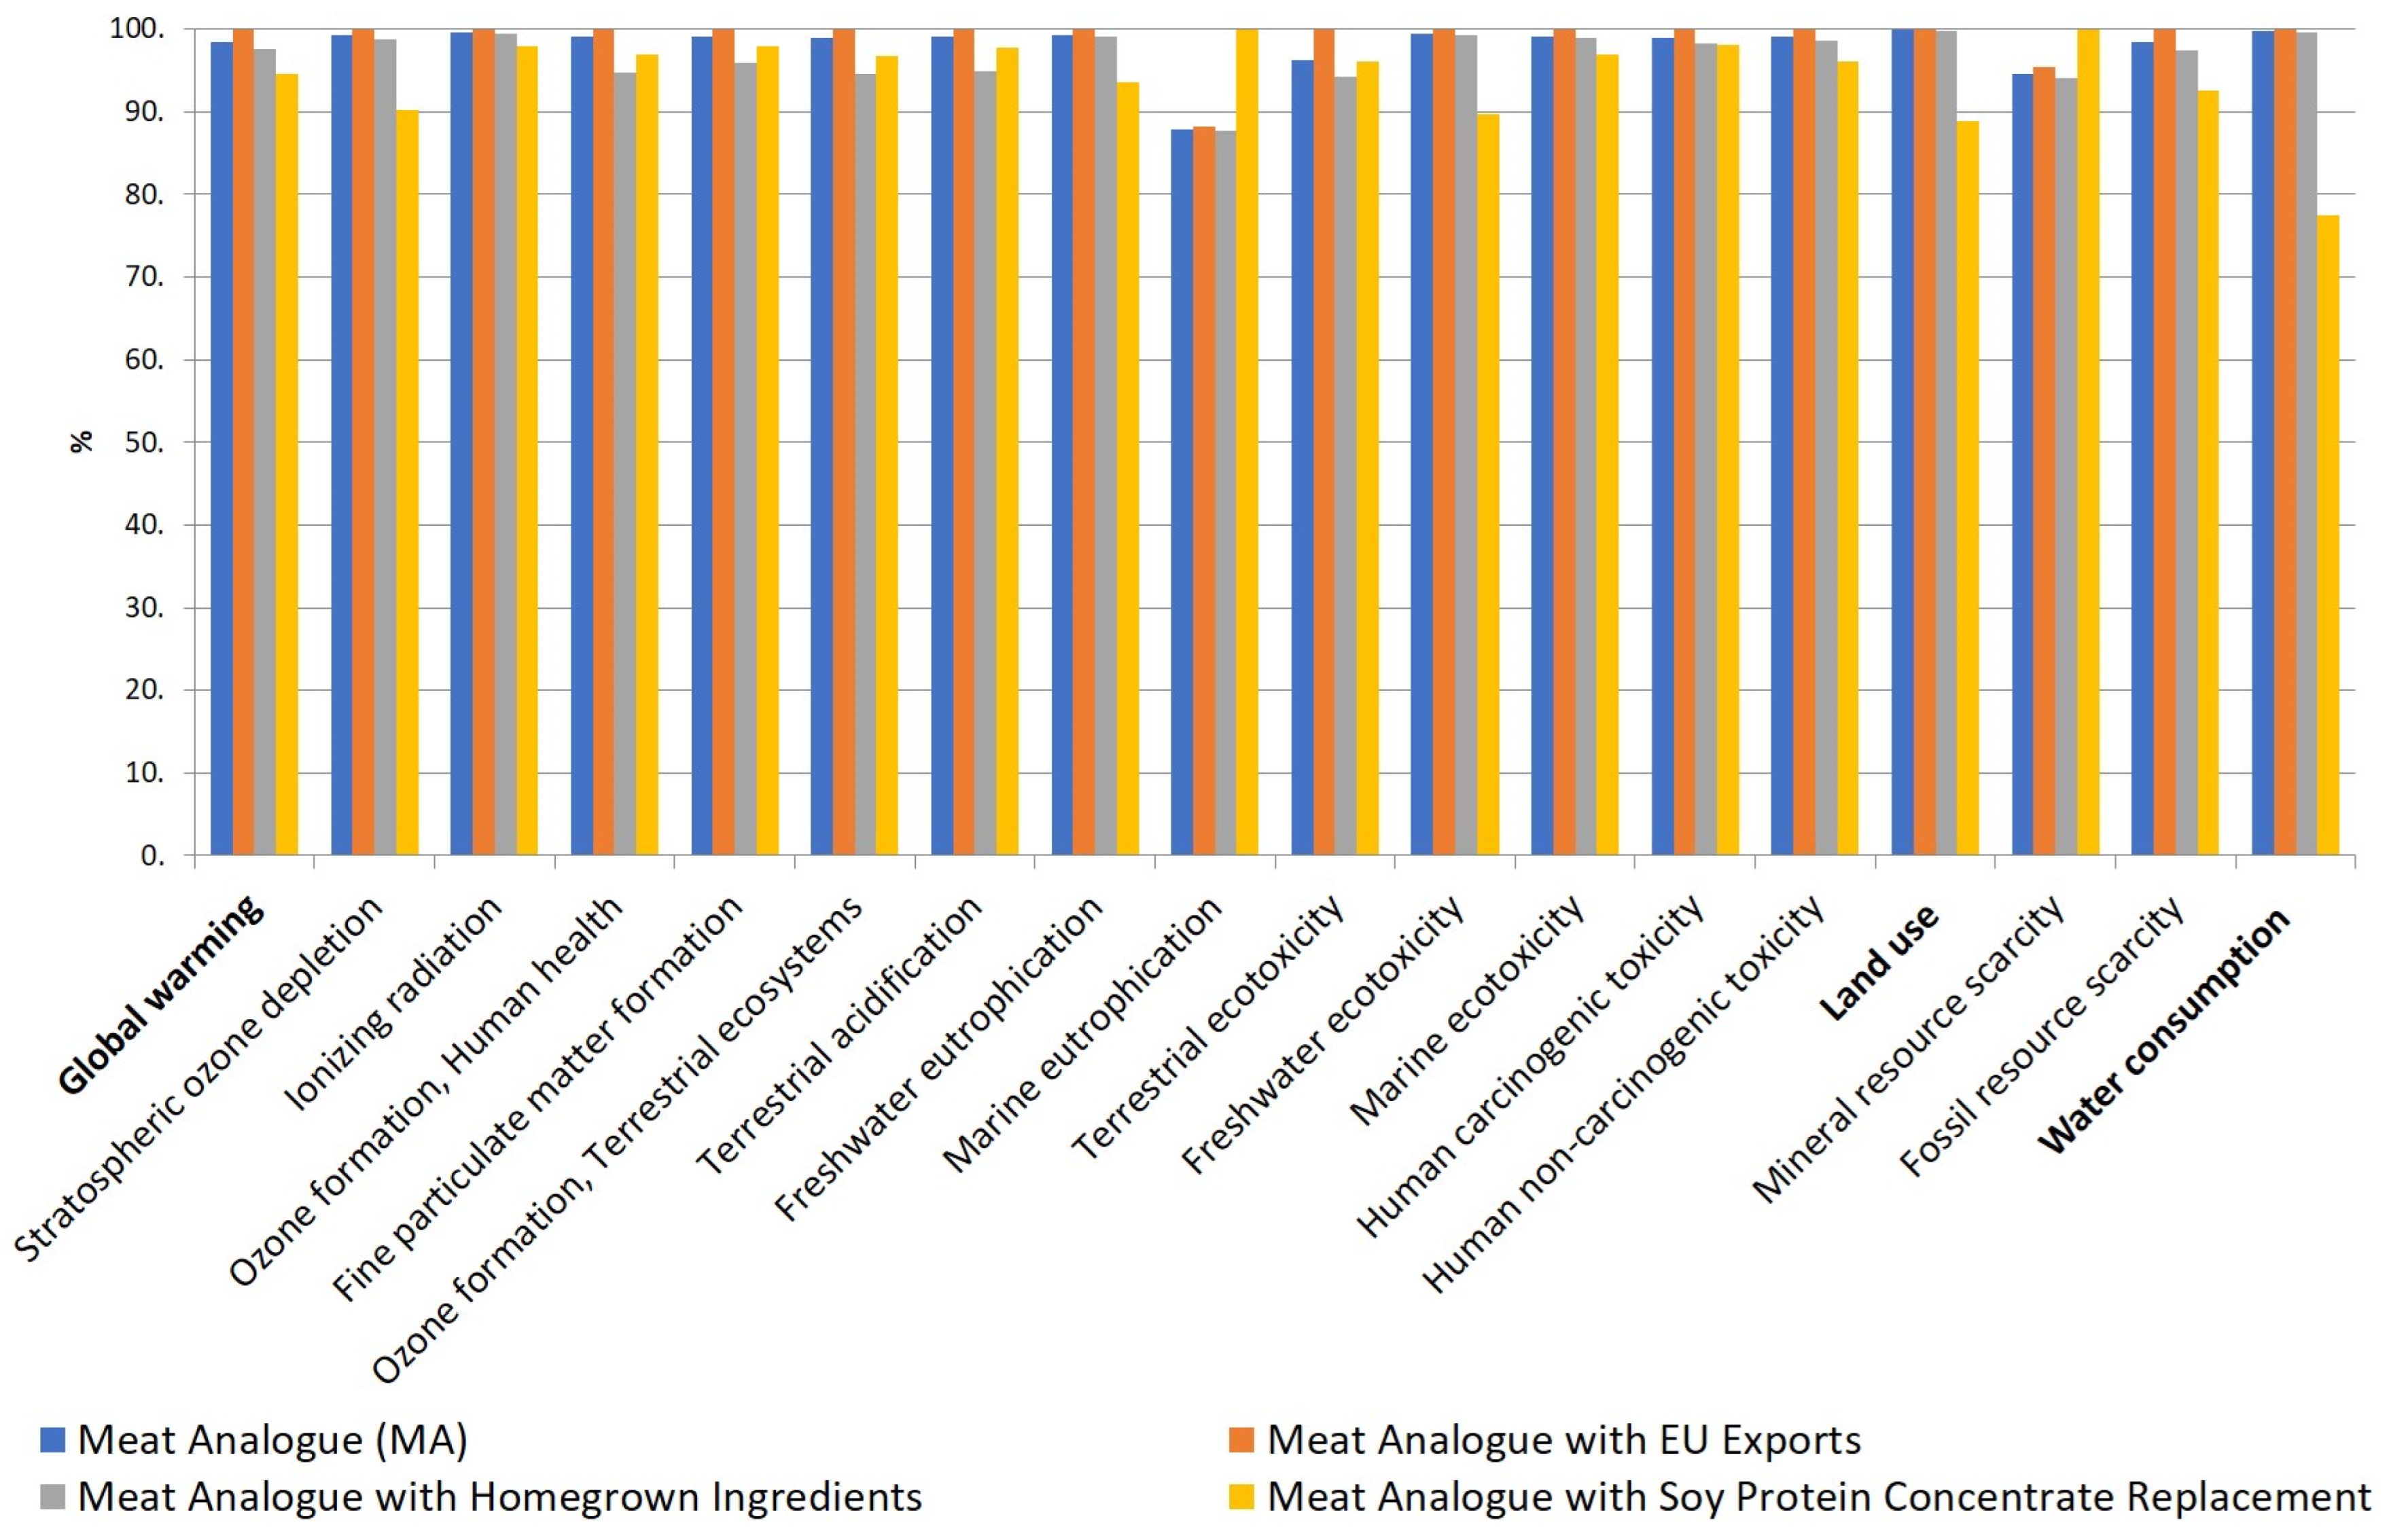
2.3. Scenario/Sensitivity Analyses
- EU exporting: The original model only analysed MA patties to be distributed and sold within the UK. However, considering the potential impacts for MA patty exporting to the European Union (EU) is also important, with UK food and drink export sales to the EU reaching GBP 6.9 bn in the first half of 2023 [73]. An alternative scenario of 100% exports to the EU, modelled with EU/UK centroids [74], was evaluated against the original model. This scenario aimed to determine whether environmental merits existed for local PBMA manufacturing within countries, compared to centralised production before continental distribution.
- Homegrown MA ingredients: In the main model, most MA patty ingredients were sourced from abroad, involving extensive shipping distances. The second scenario assessed the impact of using ingredients obtained within the UK against ingredients from abroad, determining whether MA patties produced exclusively from homegrown ingredients were significantly more environmentally friendly. Homegrown ingredients were assumed to require 100 km of transportation from production sites to the factory, similar to the salt assumption in Section 2.2.2.
- Soy protein concentrate replacement: The designed MA patty utilises SPI, which requires significant refinement [20]. A potential scenario of replacing SPI with soy protein concentrate (SPC), which has a less intensive production process, was evaluated against the main model [17]. This scenario aimed to establish whether SPC usage generated substantially lower environmental impacts, therefore providing increased benefits for reducing GHG emissions.
- Alternative characterisation method: The original model results were generated via ReCiPe v1.08 [47]. However, differing characterisation methods can be influential on the results of comparative LCA studies, generating different conclusions on the same model [75]. To verify the results, a sensitivity analysis was performed with an alternative characterisation method, IMPACT 2002+ v2.15 [76].
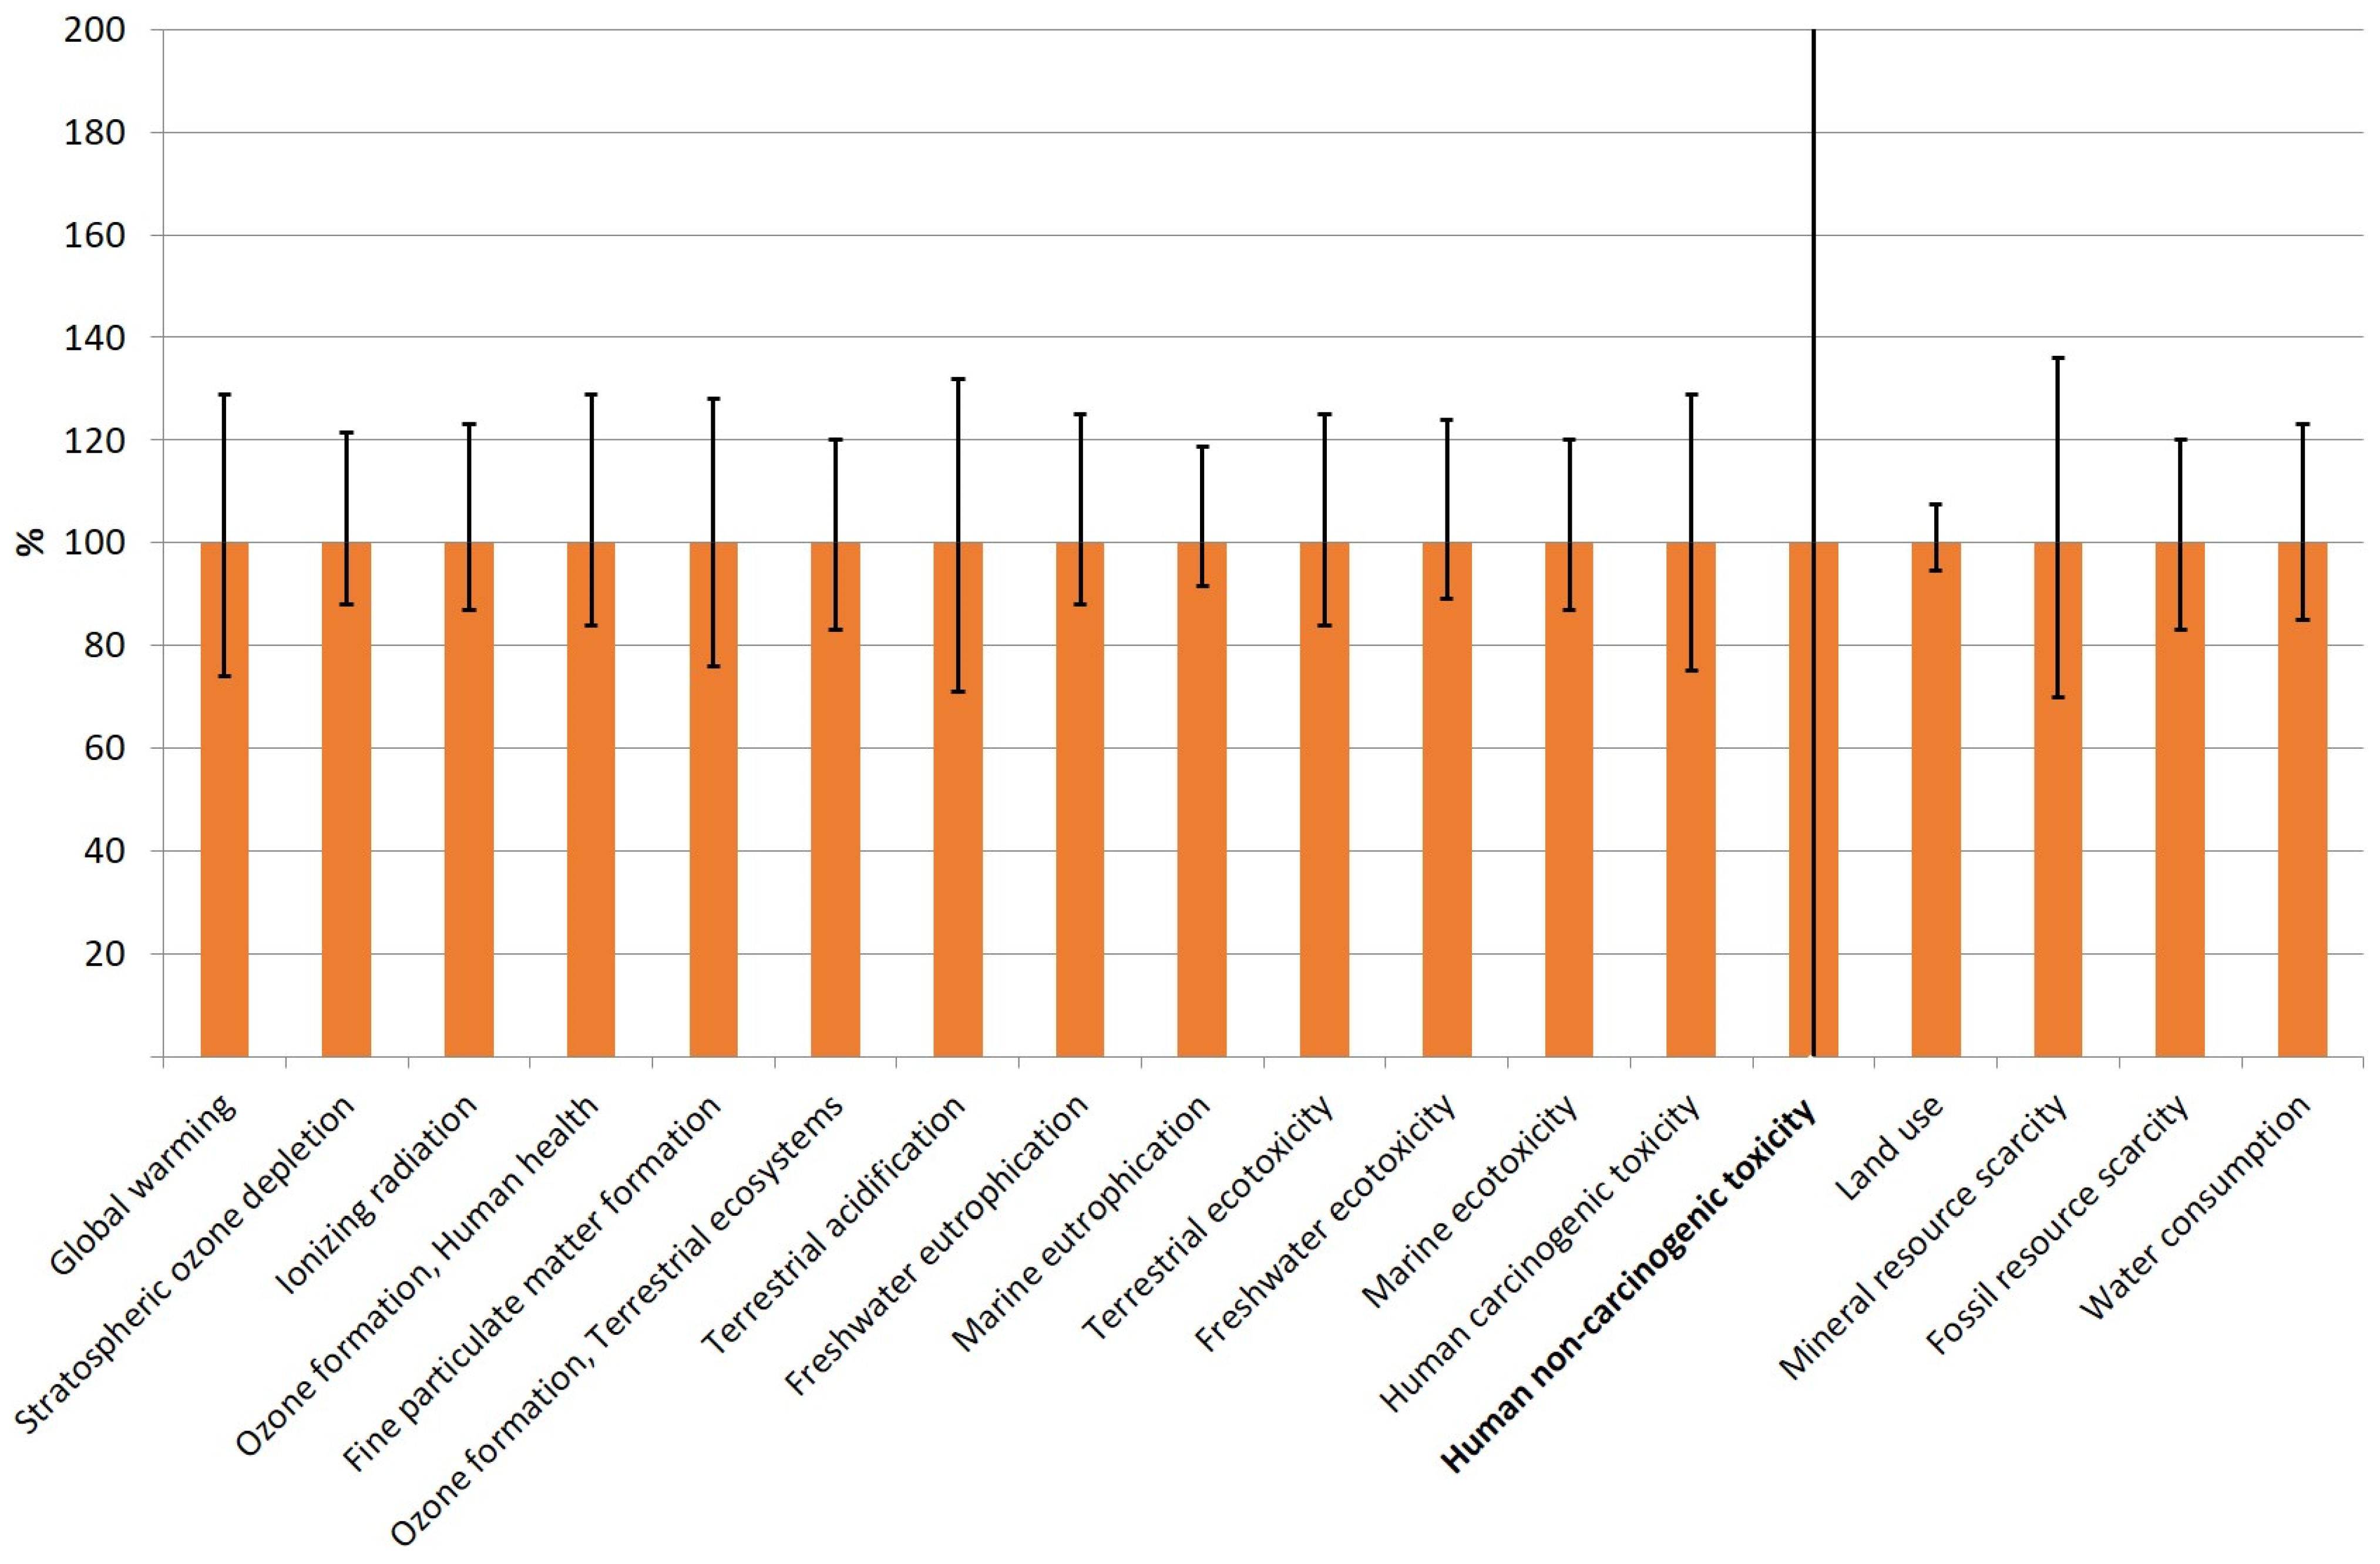
2.4. Uncertainty Analysis
3. Results and Discussion
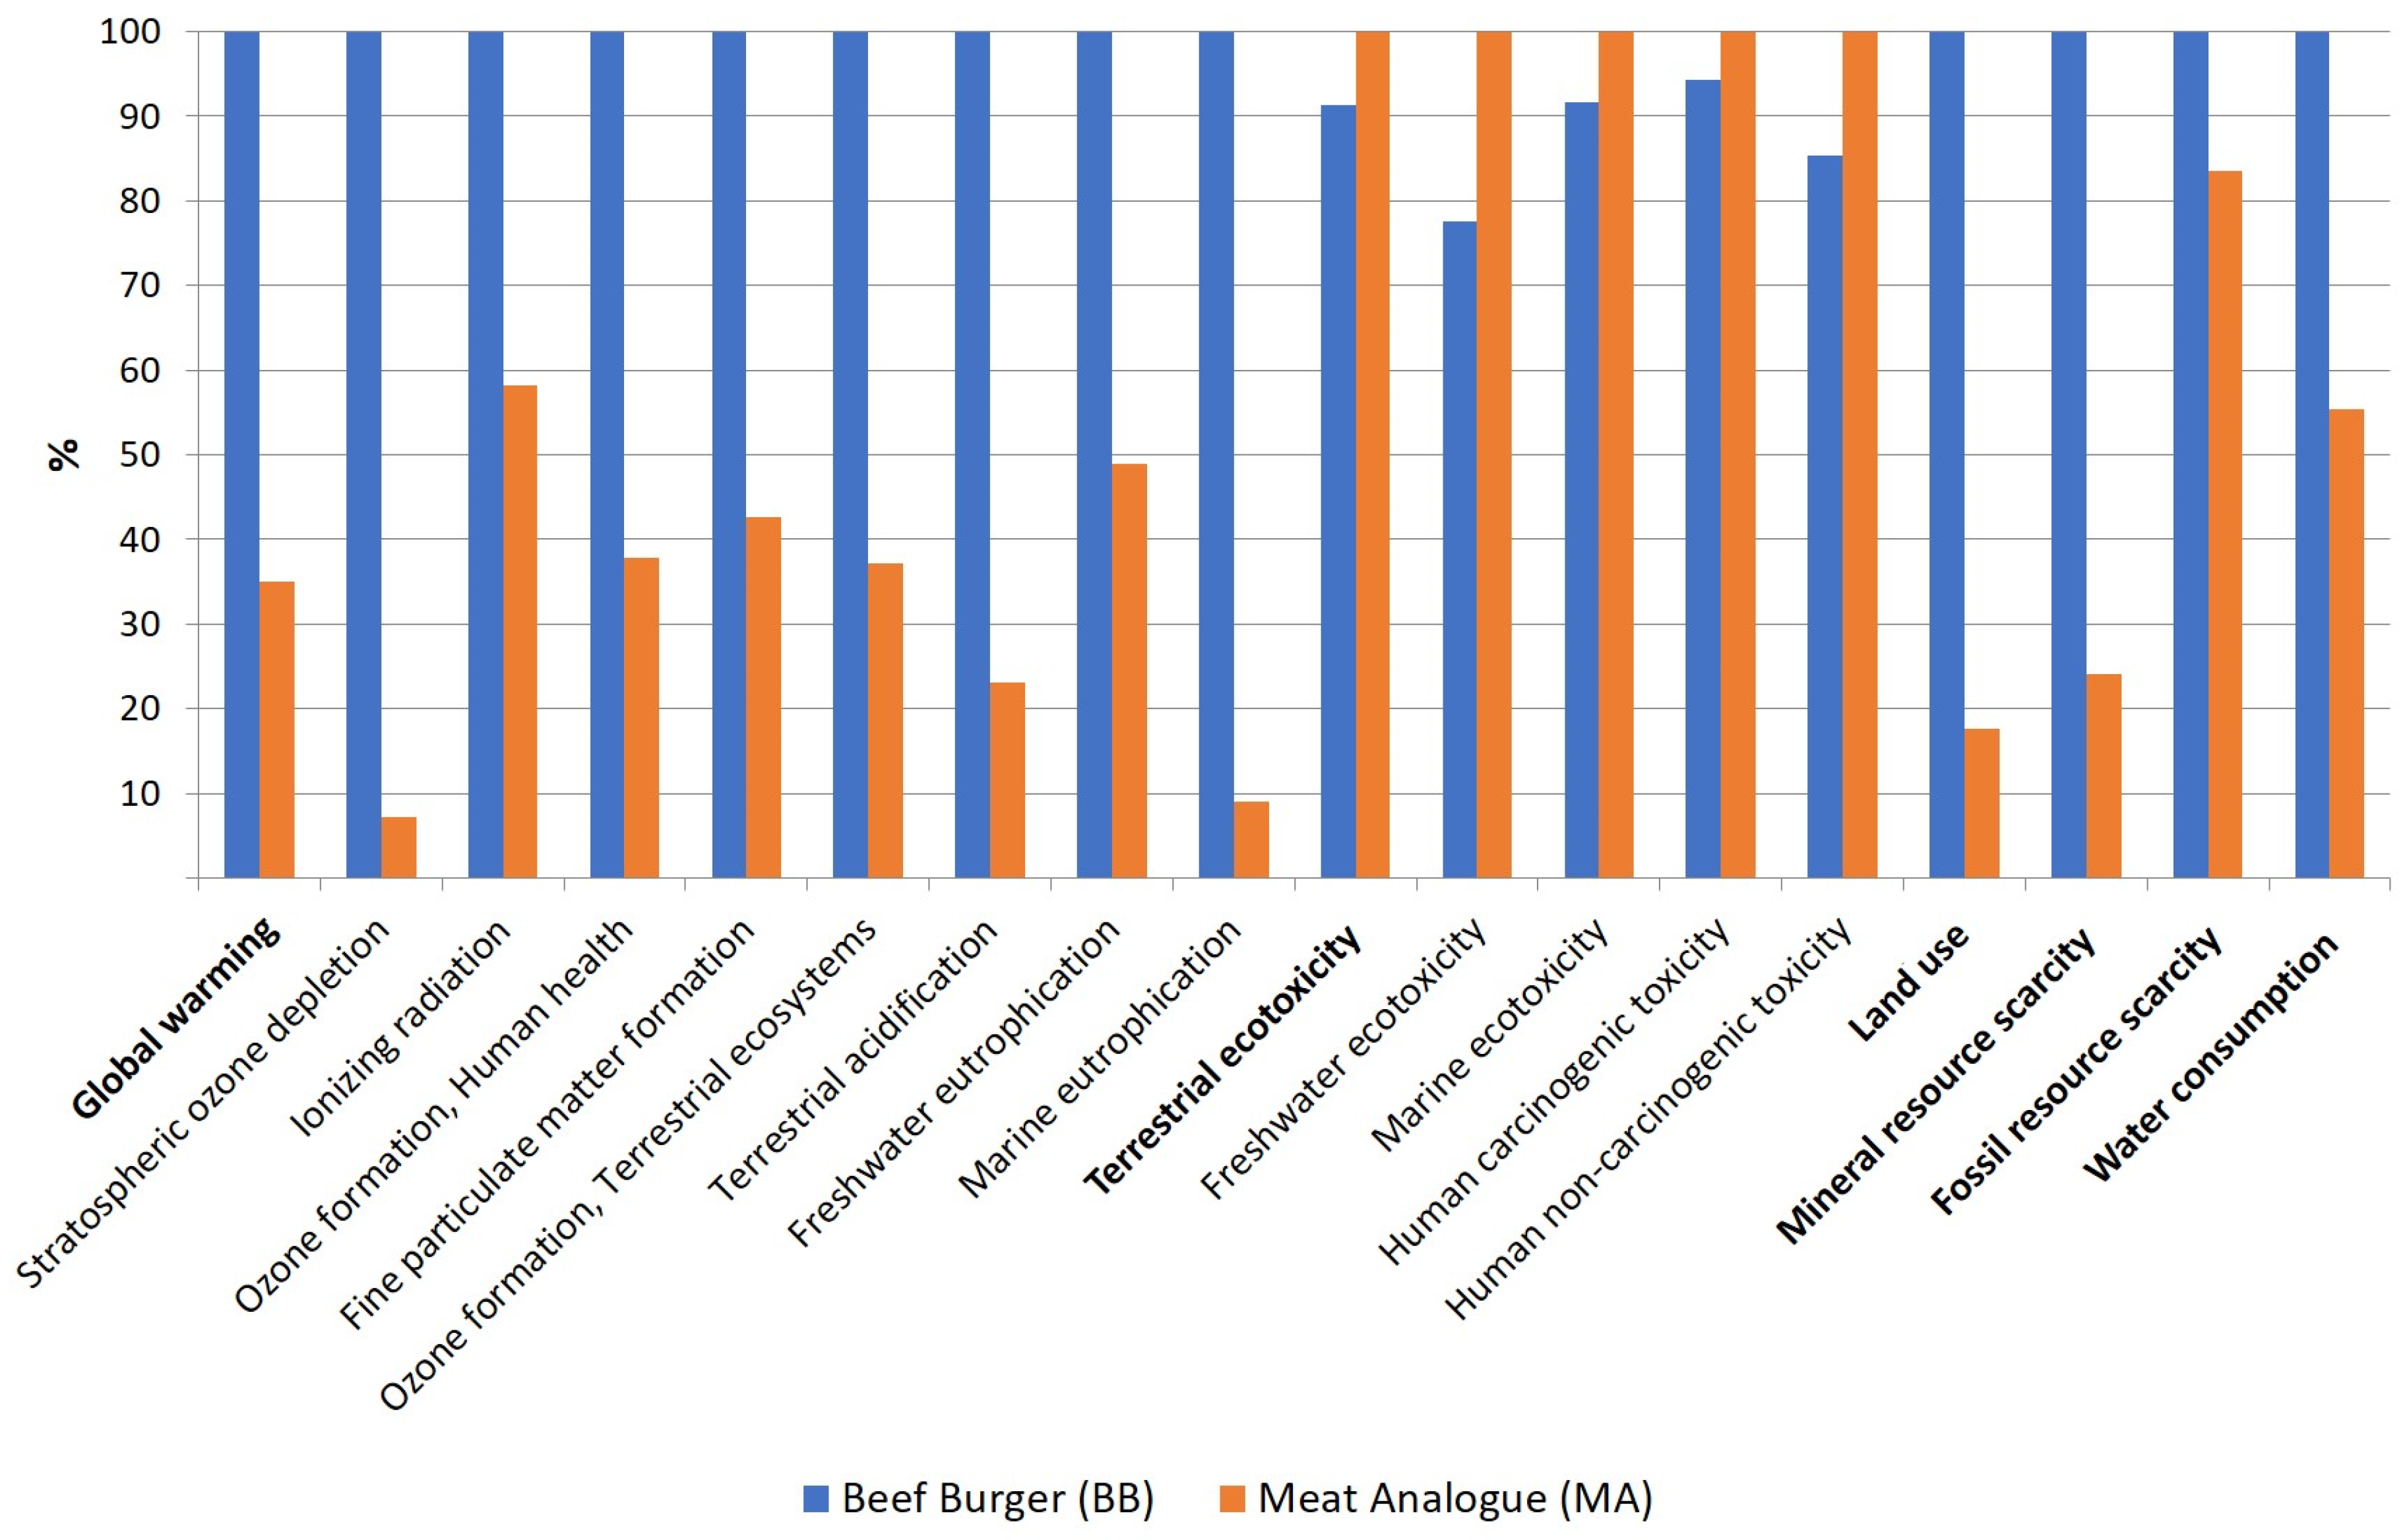
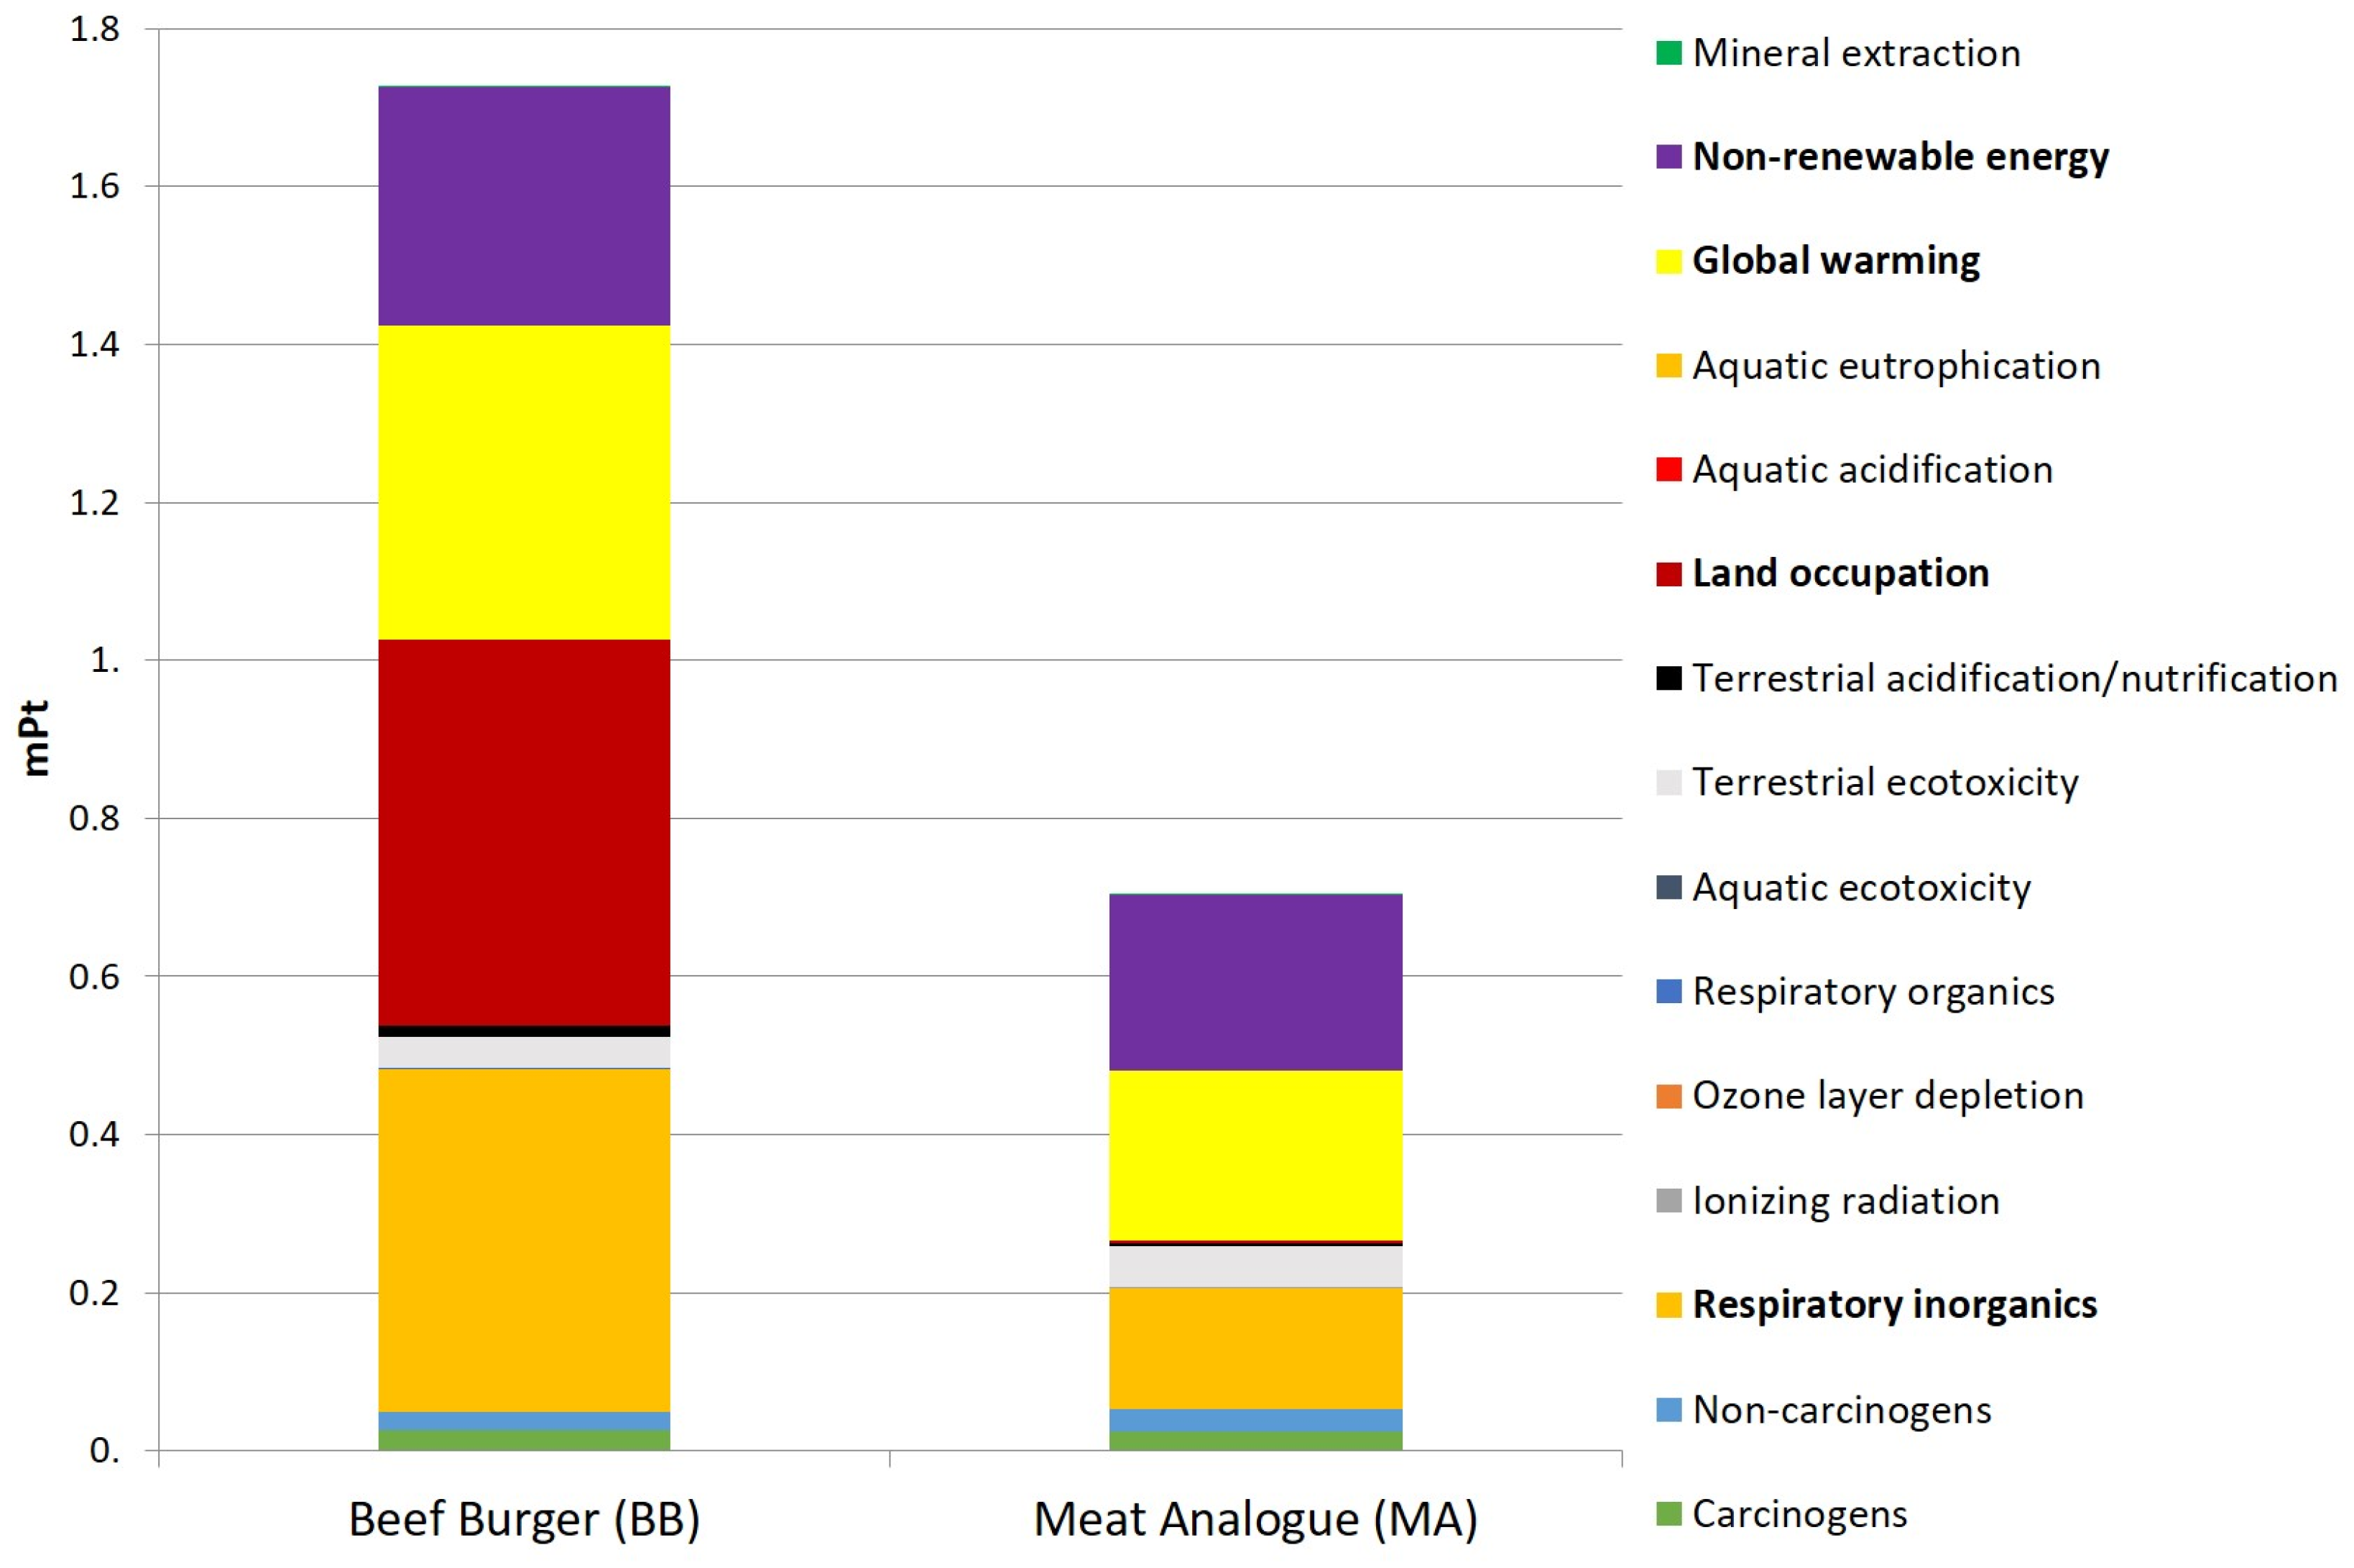
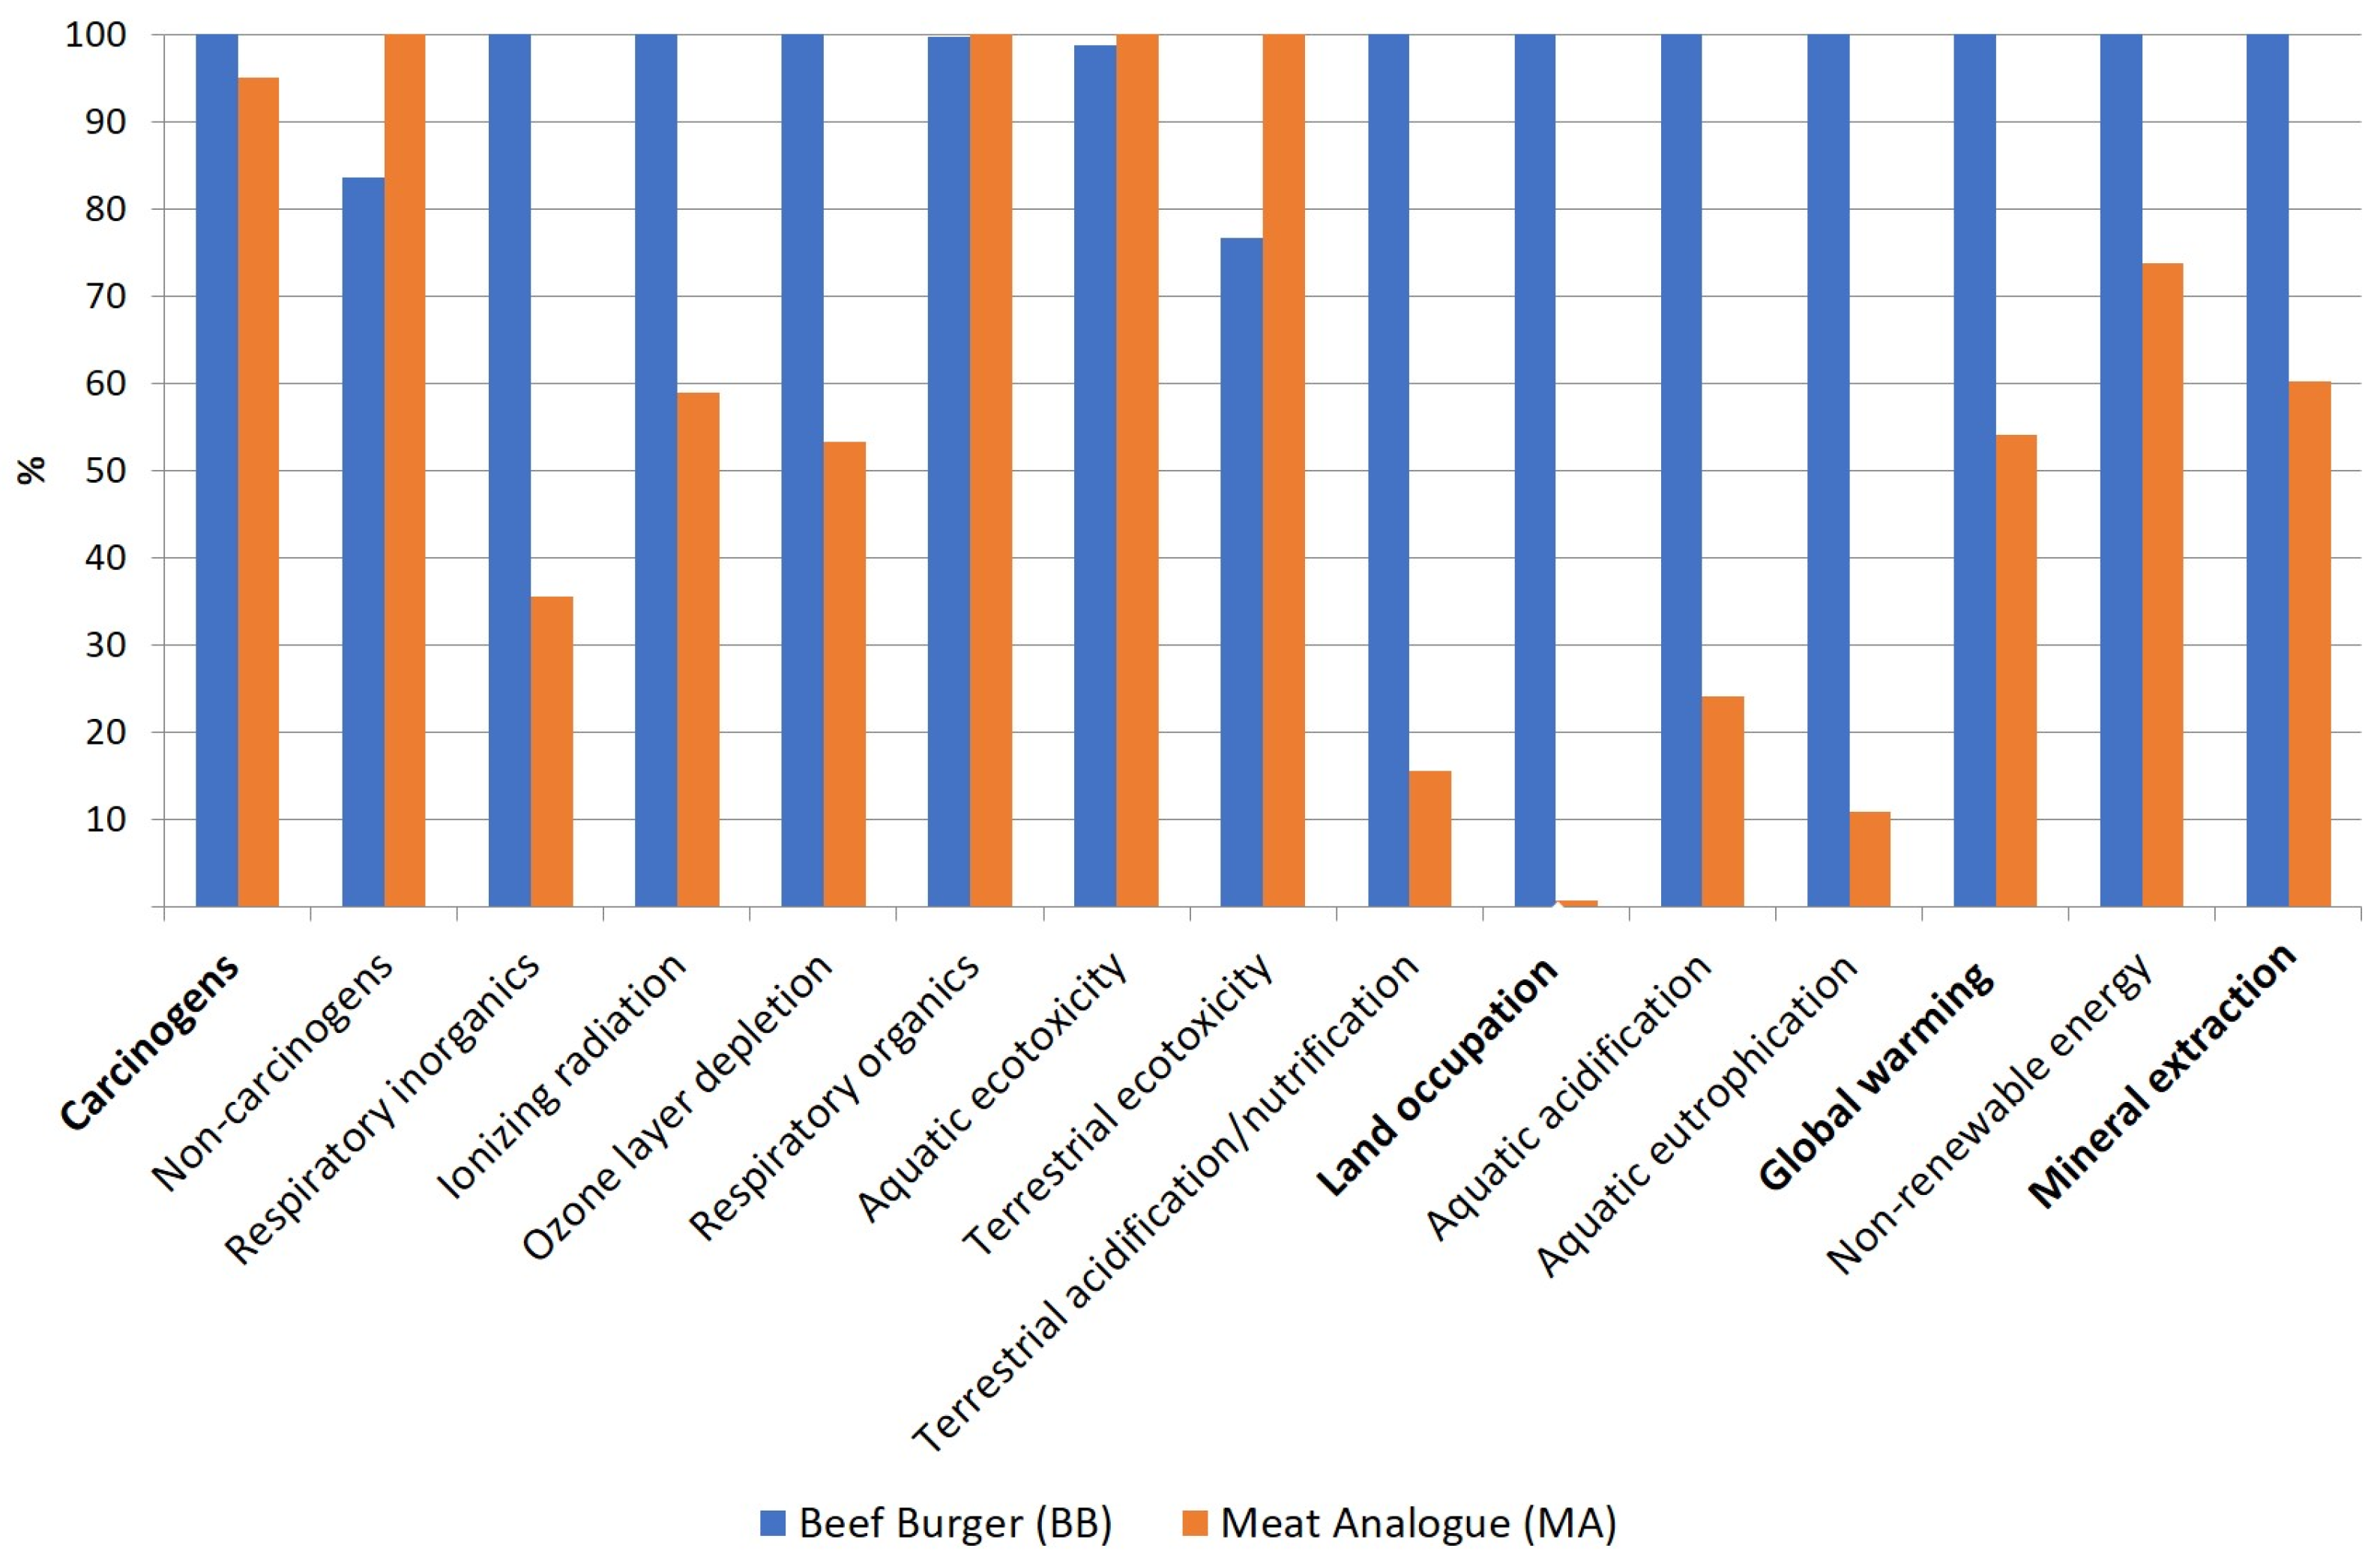
3.1. General Comparison between Meat Analogue and Beef Burger
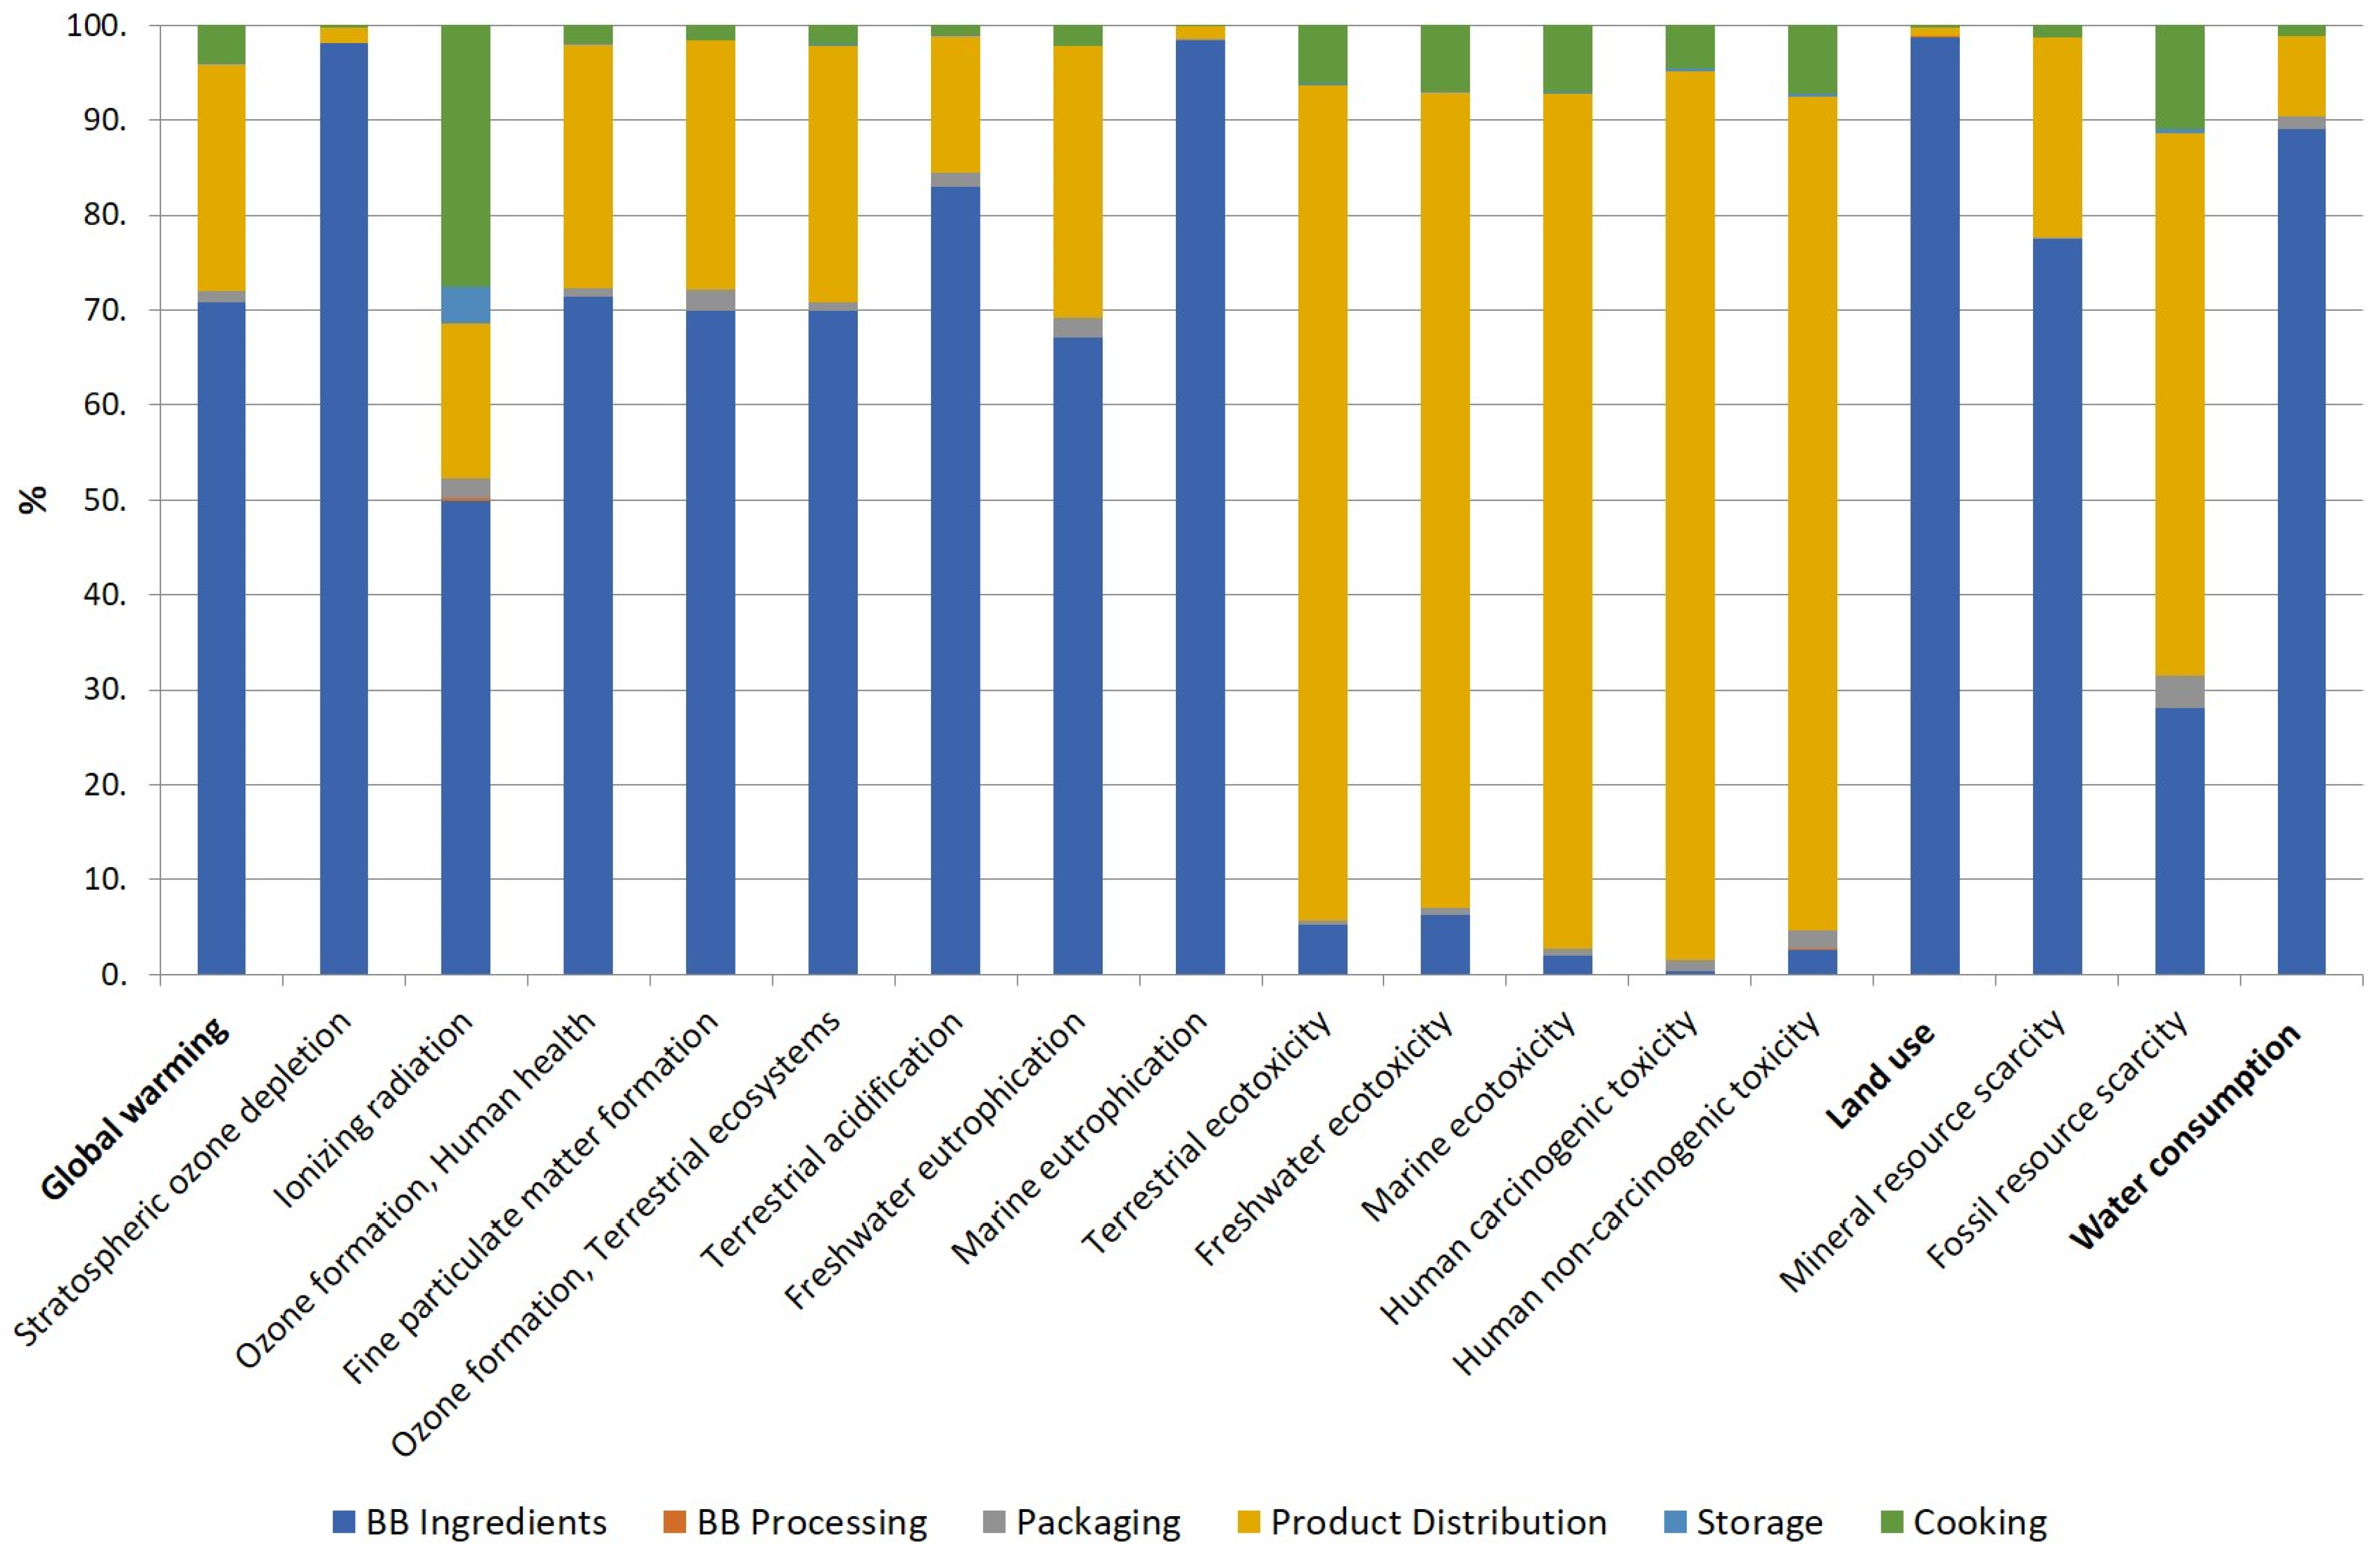
3.2. Individual Process Contributions for Patties
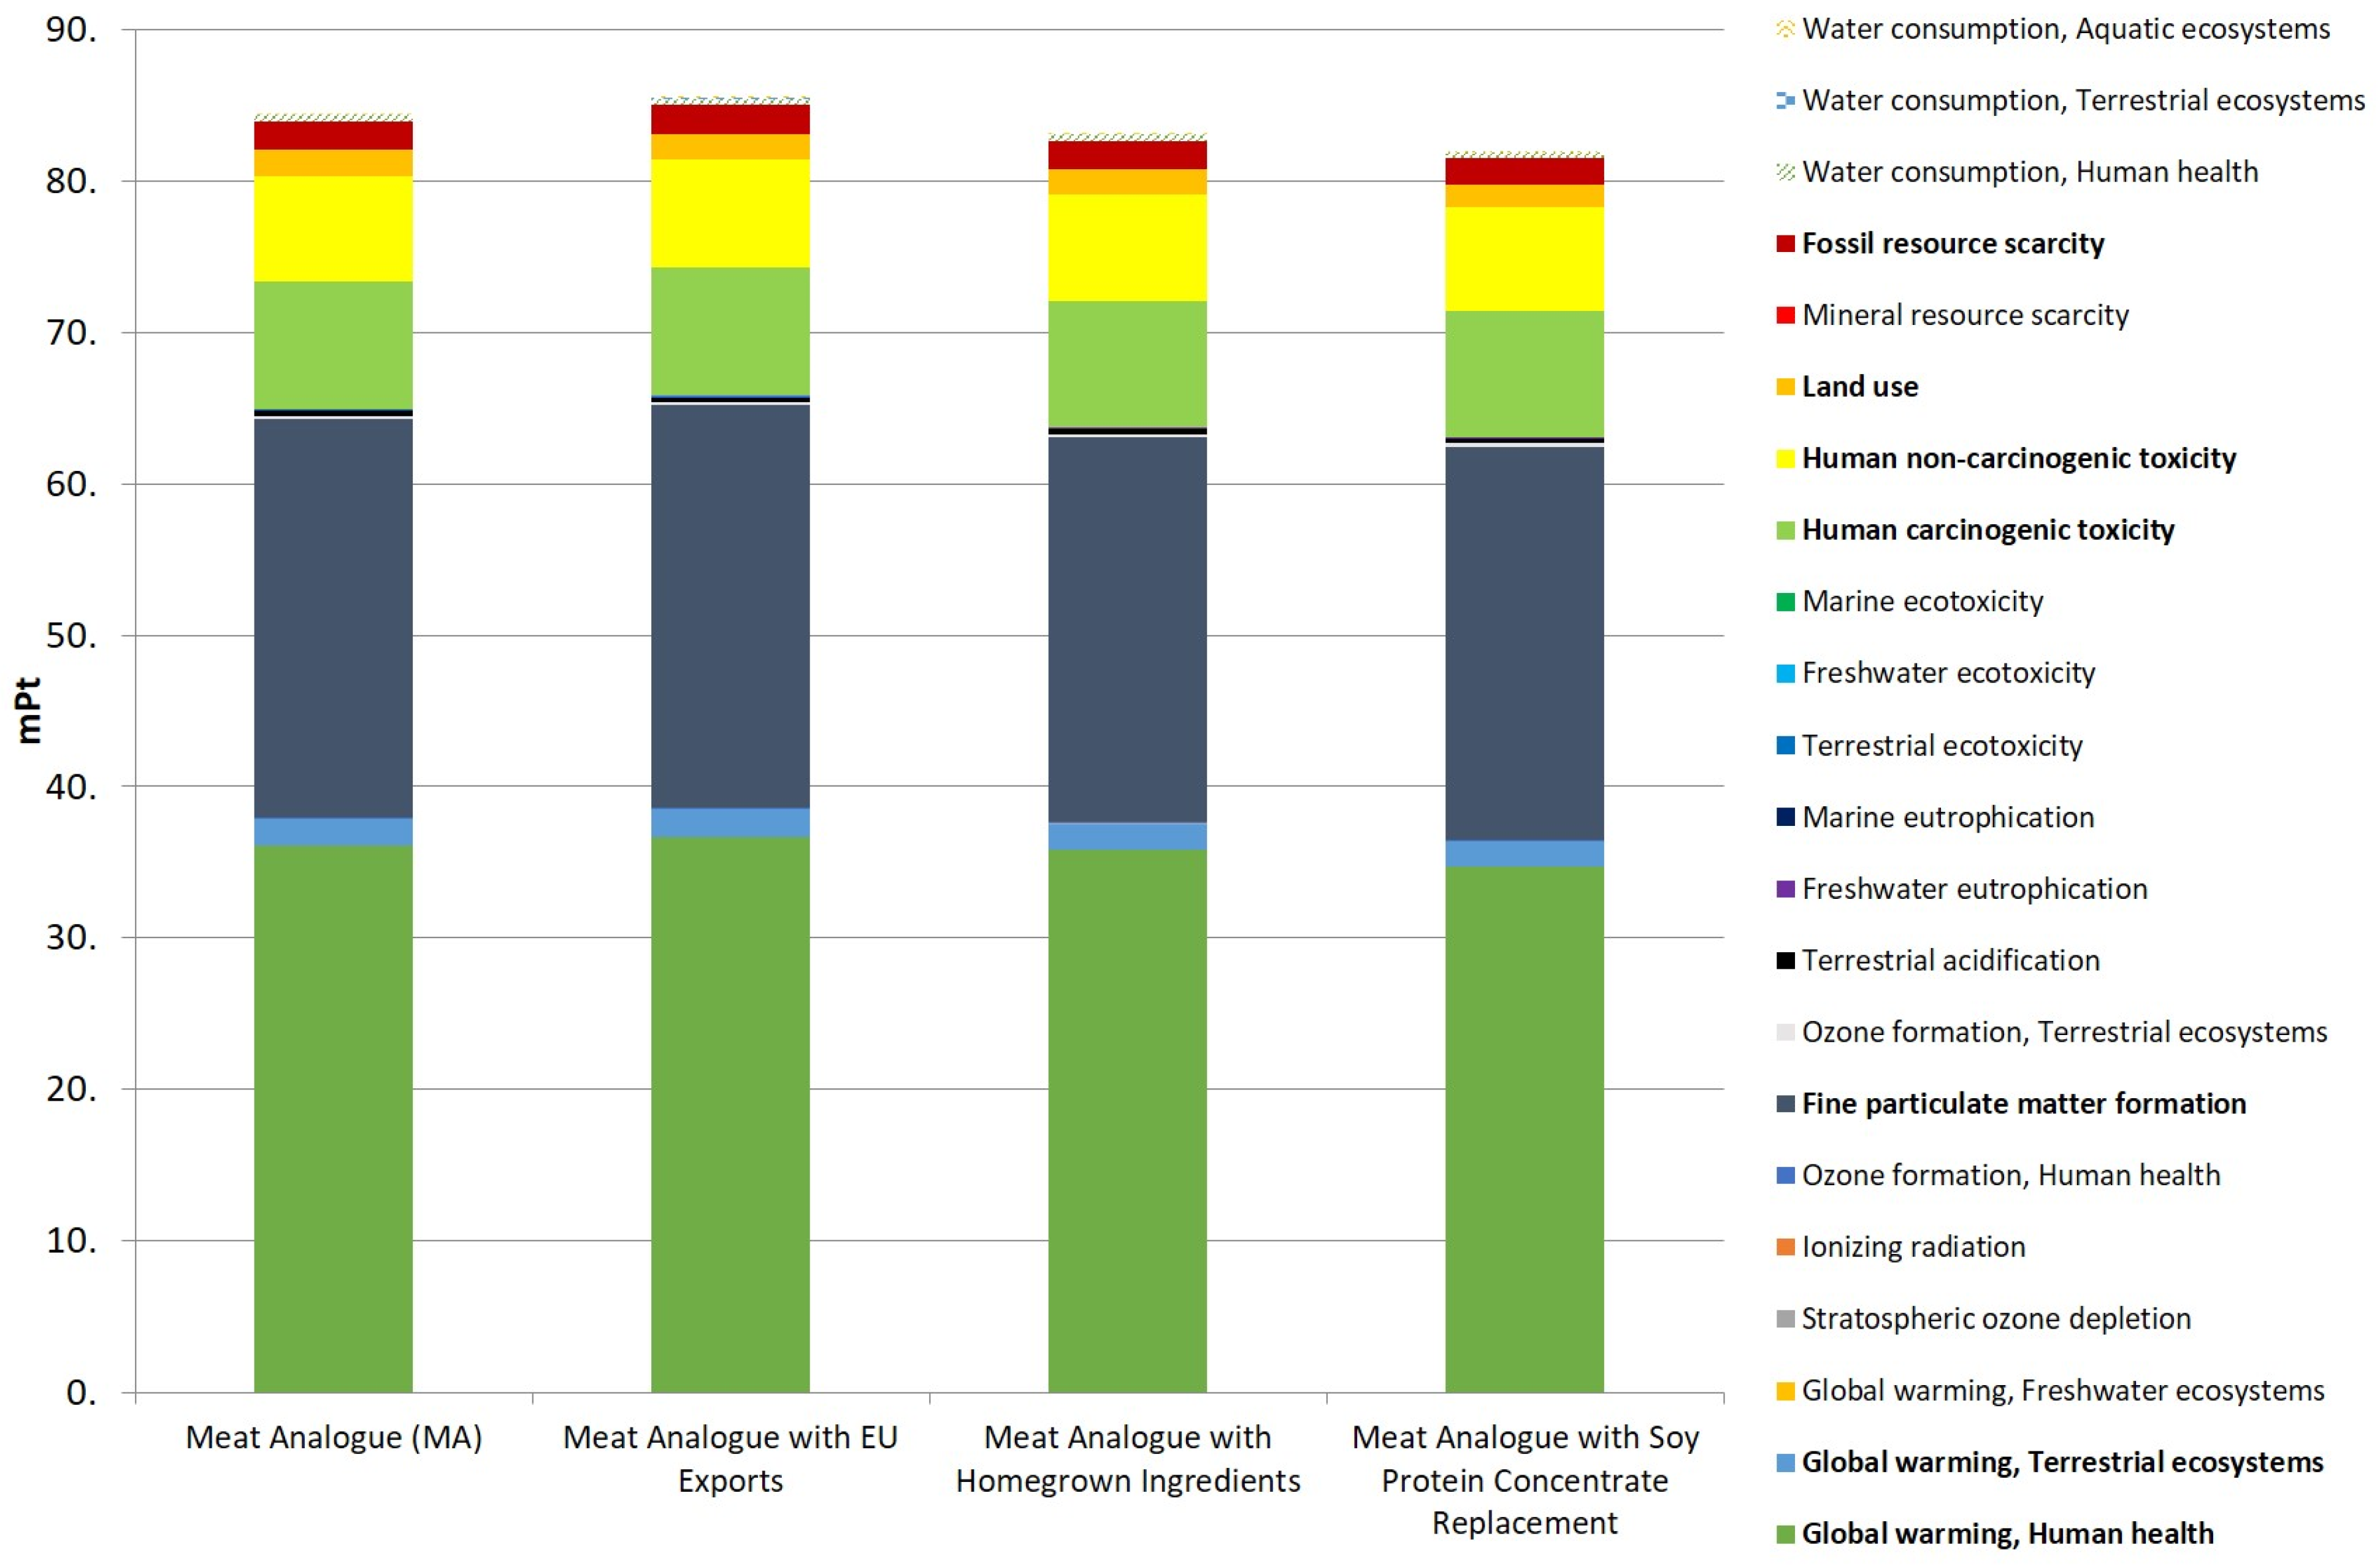
3.3. Extrapolation Scenario Results
3.4. Sensitivity and Scenario Analyses
3.4.1. Exporting to EU
3.4.2. Homegrown Ingredients
3.4.3. Replacing Soy Protein Isolate (SPI) with Soy Protein Concentrate (SPC)
3.4.4. Statistical Assessment of Scenario Analyses
3.4.5. Alternative Characterisation Method
3.5. Uncertainty Analysis
4. Conclusions
4.1. Summary
4.2. Relevance, Validity and Limitations
4.3. Further Research
Author Contributions
Funding
Institutional Review Board Statement
Informed Consent Statement
Data Availability Statement
Conflicts of Interest
References
- United Nations/Framework Convention on Climate Change. In Adoption of the Paris Agreement, Proceedings of the 21st Conference of the Parties, Paris, France, 12 December 2015; UN: Paris, France, 2015.
- Tubiello, F.N.; Rosenzweig, C.; Conchedda, G.; Karl, K.; Gütschow, J.; Xueyao, P.; Obli-Laryea, G.; Wanner, N.; Qiu, S.Y.; De Barros, J. Greenhouse gas emissions from food systems: Building the evidence base. Environ. Res. Lett. 2021, 16, 065007. [Google Scholar] [CrossRef]
- Clark, M.A.; Domingo, N.G.G.; Colgan, K.; Thakrar, S.K.; Tilman, D.; Lynch, J.; Azevedo, I.L.; Hill, J.D. Global food system emissions could preclude achieving the 1.5° and 2 °C climate change targets. Science 2020, 370, 705–708. [Google Scholar] [CrossRef] [PubMed]
- United Nations Department of Economic and Social Affairs. World Population Prospects 2022: Summary of Results; UN DESA/POP/2022/TR/NO. 3.; United Nations Publication: New York, NY, USA, 2022. [Google Scholar]
- Andreani, G.; Sogari, G.; Marti, A.; Froldi, F.; Dagevos, H.; Martini, D. Plant-Based Meat Alternatives: Technological, Nutritional, Environmental, Market, and Social Challenges and Opportunities. Nutrients 2023, 15, 452. [Google Scholar] [CrossRef] [PubMed]
- Tamasiga, P.; Miri, T.; Onyeaka, H.; Hart, A. Food Waste and Circular Economy: Challenges and Opportunities. Sustainability 2022, 14, 9896. [Google Scholar] [CrossRef]
- Tchonkouang, R.D.; Onyeaka, H.; Miri, T. From Waste to Plate: Exploring the Impact of Food Waste Valorisation on Achieving Zero Hunger. Sustainability 2023, 15, 10571. [Google Scholar] [CrossRef]
- OECD/FAO. 6. Meat. In OECD-FAO Agricultural Outlook 2021–2030; OECD Publishing: Paris, France, 2021; pp. 163–177. [Google Scholar]
- Alessandrini, R.; Brown, M.K.; Pombo-Rodrigues, S.; Bhageerutty, S.; He, F.J.; MacGregor, G.A. Nutritional quality of plant-based meat products available in the UK: A cross-sectional survey. Nutrients 2021, 13, 4225. [Google Scholar] [CrossRef] [PubMed]
- Lee, H.J.; Yong, H.I.; Kim, M.; Choi, Y.-S.; Jo, C. Status of meat alternatives and their potential role in the future meat market—A review. Asian-Australas. J. Anim. Sci. 2020, 33, 1533–1543. [Google Scholar] [CrossRef] [PubMed]
- Kerslake, E.; Kemper, J.A.; Conroy, D. What’s your beef with meat substitutes? Exploring barriers and facilitators for meat substitutes in omnivores, vegetarians, and vegans. Appetite 2022, 170, 105864. [Google Scholar] [CrossRef] [PubMed]
- Ahmad, M.; Qureshi, S.; Akbar, M.H.; Siddiqui, S.A.; Gani, A.; Mushtaq, M.; Hassan, I.; Dhull, S.B. Plant-based meat alternatives: Compositional analysis, current development and challenges. Appl. Food Res. 2022, 2, 100154. [Google Scholar] [CrossRef]
- Finnveden, G.; Potting, J. Life Cycle Assessment. In Encyclopedia of Toxicology, 3rd ed.; Wexler, P., Ed.; Academic Press: Oxford, UK, 2014; pp. 74–77. [Google Scholar]
- Curran, M.A. Life Cycle Assessment: A review of the methodology and its application to sustainability. Curr. Opin. Chem. Eng. 2013, 2, 273–277. [Google Scholar] [CrossRef]
- Listrat, A.; Lebret, B.; Louveau, I.; Astruc, T.; Bonnet, M.; Lefaucheur, L.; Picard, B.; Bugeon, J. How Muscle Structure and Composition Influence Meat and Flesh Quality. Sci. World J. 2016, 2016, 3182746. [Google Scholar] [CrossRef] [PubMed]
- He, J.; Evans, N.M.; Liu, H.; Shao, S. A review of research on plant-based meat alternatives: Driving forces, history, manufacturing, and consumer attitudes. Compr. Rev. Food Sci. Food Saf. 2020, 19, 2639–2656. [Google Scholar] [CrossRef] [PubMed]
- Kyriakopoulou, K.; Dekkers, B.; van der Goot, A.J. Chapter 6—Plant-Based Meat Analogues. In Sustainable Meat Production and Processing; Galanakis, C.M., Ed.; Elsevier: London, UK, 2019; pp. 103–126. [Google Scholar]
- van den Berg, L.A.; Mes, J.J.; Mensink, M.; Wanders, A.J. Protein quality of soy and the effect of processing: A quantitative review. Front. Nutr. 2022, 9, 1004754. [Google Scholar] [CrossRef] [PubMed]
- Qin, P.; Wang, T.; Luo, Y. A review on plant-based proteins from soybean: Health benefits and soy product development. J. Agric. Food Res. 2022, 7, 100265. [Google Scholar] [CrossRef]
- Kutzli, I.; Weiss, J.; Gibis, M. Glycation of plant proteins via maillard reaction: Reaction chemistry, technofunctional properties, and potential food application. Foods 2021, 10, 376. [Google Scholar] [CrossRef]
- Guo, M. Chapter 7—Soy Food Products and Their Health Benefits. In Functional Foods: Principles and Technology; Woodhead Publishing: Cambridge, UK, 2009; pp. 237–277. [Google Scholar]
- European Commission. Joint Statement: The United States is Europe’s Main Soya Beans Supplier with Imports up by 121%; IP/19/2154; European Commission: Brussels, Belgium, 2019. [Google Scholar]
- van Vliet, S.; Kronberg, S.L.; Provenza, F. Plant-Based Meats, Human Health, and Climate Change. Front. Sustain. Food Syst. 2020, 4, 555088. [Google Scholar] [CrossRef]
- Shireen, A.; Wright, A.J. The Meat of the Matter: Plant-Based Meat Analogue versus Traditional Meat Product Nutritional Quality. Food Sci. Hum. Wellness 2024, 13. [Google Scholar] [CrossRef]
- Tso, R.; Forde, C.G. Unintended Consequences: Nutritional Impact and Potential Pitfalls of Switching from Animal- to Plant-Based Foods. Nutrients 2021, 13, 2527. [Google Scholar] [CrossRef]
- Kinney, M.; Weston, Z.; Bauman, J. Overview of Plant-Based Meat Manufacturing—Plant-Based Meat Manufacturing by Extrusion; The Good Food Institute: Washington, DC, USA, 2019. [Google Scholar]
- Kazemzadeh, M.; Yacu, W.A. Introduction to Extrusion Technology; Extruder Selection, Design, and Operation for Different Food Applications. In Advances in Food Extrusion Technology, 1st ed.; Maskan, M., Altan, A., Eds.; CRC Press: Boca Raton, FL, USA, 2012; pp. 1–68. [Google Scholar]
- Zhang, J.; Chen, Q.; Kaplan, D.L.; Wang, Q. High-moisture extruded protein fiber formation toward plant-based meat substitutes applications: Science, technology, and prospect. Trends Food Sci. Technol. 2022, 128, 202–216. [Google Scholar] [CrossRef]
- Van Zuilichem, D.J.; Stolp, W.; Janssen, L.P.B.M. Engineering aspects of single-and twin-screw extrusion-cooking of biopolymers. J. Food Eng. 1983, 2, 157–175. [Google Scholar] [CrossRef]
- Saerens, W.; Smetana, S.; Van Campenhout, L.; Lammers, V.; Heinz, V. Life cycle assessment of burger patties produced with extruded meat substitutes. J. Clean. Prod. 2021, 306, 127177. [Google Scholar] [CrossRef]
- Farjana, S.H.; Parvez Mahmud, M.A.; Huda, N. Chapter 1—Introduction to Life Cycle Assessment. In Life Cycle Assessment for Sustainable Mining; LaFleur, M., Ed.; Elsevier: Amsterdam, The Netherlands, 2021; pp. 1–13. [Google Scholar]
- Muralikrishna, I.V.; Manickam, V. Chapter Five—Life Cycle Assessment. In Environmental Management—Science and Engineering for Industry; McCombs, K., Ed.; Butterworth-Heinemann: Oxford, UK, 2017; pp. 57–75. [Google Scholar]
- Saget, S.; Costa, M.P.; Santos, C.S.; Vasconcelos, M.; Styles, D.; Williams, M. Comparative life cycle assessment of plant and beef-based patties, including carbon opportunity costs. Sustain. Prod. Consum. 2021, 28, 936–952. [Google Scholar] [CrossRef]
- Heller, M.C.; Keoleian, G.A. Beyond Meat’s Beyond Burger Life Cycle Assessment: A Detailed Comparison between a Plant-Based and an Animal-Based Protein Source; CSS Report No. CSS18-10; University of Michigan: Ann Arbor, MI, USA, 2018; pp. 1–38. [Google Scholar]
- Allotey, D.K.; Kwofie, E.M.; Adewale, P.; Lam, E.; Ngadi, M. Life cycle sustainability assessment outlook of plant-based protein processing and product formulations. Sustain. Prod. Consum. 2023, 36, 108–125. [Google Scholar] [CrossRef]
- Smetana, S.; Mathys, A.; Knoch, A.; Heinz, V. Meat alternatives: Life cycle assessment of most known meat substitutes. Int. J. Life Cycle Assess 2015, 20, 1254–1267. [Google Scholar] [CrossRef]
- Department for Business, Energy & Industrial Strategy UK Becomes First Major Economy to Pass Net Zero Emissions Law. Available online: https://www.gov.uk/government/news/uk-becomes-first-major-economy-to-pass-net-zero-emissions-law (accessed on 12 November 2023).
- Szenderák, J.; Fróna, D.; Rákos, M. Consumer Acceptance of Plant-Based Meat Substitutes: A Narrative Review. Foods 2022, 11, 1274. [Google Scholar] [CrossRef] [PubMed]
- UKRI. Innovate UK Alternative Proteins Roadmap: Identifying UK Priorities; UKRI: London, UK, 2022. [Google Scholar]
- De Marchi, M.; Costa, A.; Pozza, M.; Goi, A.; Manuelian, C.L. Detailed characterization of plant-based burgers. Sci. Rep. 2021, 11, 2049. [Google Scholar] [CrossRef] [PubMed]
- PRé Sustainability, B.V. SimaPro Database Manual—Methods Library; PRé Sustainability B.V.: Amersfoort, The Netherlands, 2023; pp. 5–58. [Google Scholar]
- Blonk, H.; van Paassen, M.; Draijer, N.; Tyszler, M.; Braconi, N.; van Rijn, J. Agri-Footprint 6 Methodology Report; Blonk: Gouda, The Netherlands, 2023; pp. 1–13. [Google Scholar]
- Auberger, J.; Ayari, N.; Ceccaldi, M.; Cornelus, M.; Geneste, C. Agribalyse Change Report 3.0/3.1/3.1.1; ADEME: Angers, France, 2022; pp. 7–29. [Google Scholar]
- FitzGerald, D.; Sonderegger, T. Documentation of Changes Implemented in the Ecoinvent Database v3.9.1; Ecoinvent Association: Zürich, Switzerland, 2022; pp. 4–15. [Google Scholar]
- Laboratory, N.R.E.U.S. Life Cycle Inventory Database. Available online: https://www.lcacommons.gov/lca-collaboration/National_Renewable_Energy_Laboratory/USLCI_Database_Public/datasets (accessed on 5 February 2024).
- Nemecek, T.; Bengoa, X.; Lansche, J.; Roesch, A.; Faist-Emmenegger, M.; Rossi, V.; Humbert, S. Methodological Guidelines for the Life Cycle Inventory of Agricultural Products—Version 3.5; Quantis & Agroscope: Lausanne & Zurich, Switzerland, 2019; pp. 9–72. [Google Scholar]
- Huijbregts, M.A.J.; Steinmann, Z.J.N.; Elshout, P.M.F.; Stam, G.; Verones, F.; Vieira, M.; Zijp, M.; Hollander, A.; van Zelm, R. ReCiPe2016: A harmonised life cycle impact assessment method at midpoint and endpoint level. Int. J. Life Cycle Assess. 2017, 22, 138–147. [Google Scholar] [CrossRef]
- Samard, S.; Maung, T.T.; Gu, B.Y.; Kim, M.H.; Ryu, G.H. Influences of extrusion parameters on physicochemical properties of textured vegetable proteins and its meatless burger patty. Food Sci. Biotechnol. 2021, 30, 395–403. [Google Scholar] [CrossRef]
- Smetana, S.; Profeta, A.; Voigt, R.; Kircher, C.; Heinz, V. Meat substitution in burgers: Nutritional scoring, sensorial testing, and Life Cycle Assessment. Future Foods 2021, 4, 100042. [Google Scholar] [CrossRef]
- Tsirigotis-Maniecka, M. Alginate-, Carboxymethyl Cellulose-, and κ-Carrageenan-Based Microparticles as Storage Vehicles for Cranberry Extract. Molecules 2020, 25, 3998. [Google Scholar] [CrossRef]
- Domínguez-Courtney, M.F.; López-Malo, A.; Palou, E.; Jiménez-Munguía, M.T. Optimization Of Mechanical Properties Of Carboxymethyl Cellulose, Carrageenan And/Or Xanthan Gum Gels As Alternatives Of Gelatin Softgels Capsules. J. Multidiscip. Eng. Sci. Technol. 2015, 2, 3132–3140. [Google Scholar]
- Nitcheu Ngemakwe, P.H.; Le Roes-Hill, M.; Jideani, V.A. Advances in gluten-free bread technology. Food Sci. Technol. Int. 2014, 21, 256–276. [Google Scholar] [CrossRef]
- Adnett, P. Commodity in Focus: Salt. Available online: https://www.export.org.uk/insights/trade-news/commodity-in-focus-salt/ (accessed on 28 February 2024).
- Government Office for Science. Understanding the UK Freight Transport System; Government Office for Science: London, UK, 2019; pp. 11–20.
- European Commission. European Commission PEFCR Guidance Document—Guidance for the Development of Product Environmental Footprint Category Rules (PEFCRs), Version 6.3; European Commission: Brussels, Belgium, 2018; pp. 44–139. [Google Scholar]
- SeaRates Distance & Time. Available online: https://www.searates.com/services/distances-time/ (accessed on 3 February 2024).
- Samard, S.; Gu, B.-Y.; Ryu, G.-H. Effects of extrusion types, screw speed and addition of wheat gluten on physicochemical characteristics and cooking stability of meat analogues. J. Sci. Food Agric. 2019, 99, 4922–4931. [Google Scholar] [CrossRef]
- Grommers, H.E.; van der Krogt, D.A. Chapter 11—Potato Starch: Production, Modifications and Uses. In Starch, 3rd ed.; BeMiller, J., Whistler, R., Eds.; Academic Press: Oxford, UK, 2009; pp. 511–539. [Google Scholar]
- Tran, D.M.; Nguyen, T.H.; Huynh, T.U.; Do, T.O.; Nguyen, Q.-V.; Nguyen, A.D. Analysis of endophytic microbiome dataset from roots of black pepper (Piper nigrum L.) cultivated in the Central Highlands region, Vietnam using 16S rRNA gene metagenomic next-generation sequencing. Data Brief 2022, 42, 108108. [Google Scholar] [CrossRef]
- Mogensen, L.; Hermansen, J.E.; Nguyen, L.; Preda, T. Environmental Impact of Beef by Life Cycle Assessment (LCA)—13 Danish Beef Production Systems; DCA Rapport No. 061; Danish Centre for Food and Agriculture: Aarhus, Denmark, 2015. [Google Scholar]
- SPX Corporation. CIP and Sanitation of Process Plant; SPX Corporation: Charlotte, NC, USA, 2013; pp. 4–19. [Google Scholar]
- Piecyk, M.; Allen, J.; Woodburn, A.; Cao, M. Online Grocery Shopping and Last-Mile Deliveries—Summary Report; Technical Report ENG-TR.022; Centre for Sustainable Road Freight: Cambridge, UK, 2021; pp. 1–6. [Google Scholar]
- EPD International. AB Preserves and Preparations of Meat (Including Meat Offal or Blood)—Product Category Classification: UN CPC 2118; PCR 2016:05, Version 2.0; EPD International: Stockholm, Sweden, 2021; pp. 10–19. [Google Scholar]
- Nguyen, V.L. Spread of Phytophthora capsici in Black Pepper (Piper nigrum) in Vietnam. Engineering 2015, 7, 506–513. [Google Scholar] [CrossRef]
- Philip, M.; Attwood, J.; Hulme, A.; Williams, G.; Shipton, P. Evaluation of Weathering in Mixed Polyethylene and Polypropylene Products; PLA0007—008; The Waste & Resources Action Programme: Banbury, UK, 2004. [Google Scholar]
- United States Agency for International Development Soy Protein Ingredients Commodity Fact Sheet. Available online: https://2012-2017.usaid.gov/what-we-do/agriculture-and-food-security/food-assistance/resources/soy-protein-ingredients-commodity (accessed on 29 January 2024).
- Ortolan, F.; Steel, C.J. Protein Characteristics that Affect the Quality of Vital Wheat Gluten to be Used in Baking: A Review. Compr. Rev. Food Sci. Food Saf. 2017, 16, 369–381. [Google Scholar] [CrossRef]
- Scott, P.; Pratt, R.C.; Hoffman, N.; Montgomery, R. Chapter 10—Specialty Corns. In Corn, 3rd ed.; Serna-Saldivar, S.O., Ed.; Woodhead Publishing: Duxford, UK, 2019; pp. 289–303. [Google Scholar]
- Abao, L.N. Oilseeds and Products Annual—Philippines; RP2022-0021; United States Department of Agriculture: Washington, DC, USA, 2022; pp. 2–18.
- Slotte, S. Production Process of Carboxymethyl Cellulose. Bachelor’s Thesis, University of Oulu, Oulu, Finland, 2021. [Google Scholar]
- Cisse, L.; Mrabet, T. World Phosphate Production: Overview and Prospects. Phosphorus Res. Bull. 2004, 15, 21–25. [Google Scholar] [CrossRef]
- Dong, L.; Li, Y.; Wang, P.; Feng, Z.; Ding, N. Cleaner production of monosodium glutamate in China. J. Clean. Prod. 2018, 190, 452–461. [Google Scholar] [CrossRef]
- The Food and Drink Federation, Food & Drink Exporters Association H1 2023 Trade Snapshot. Available online: https://www.fdf.org.uk/globalassets/resources/publications/reports/trade-reports/trade-snapshot-h1-2023.pdf (accessed on 1 March 2024).
- Institut National de L’information Géographique et Forestière Après le Brexit, Quel est Désormais le Centre Géographique de l’UE? Available online: https://www.ign.fr/reperes/apres-le-brexit-quel-est-desormais-le-centre-geographique-de-lue (accessed on 24 February 2024).
- Owsianiak, M.; Laurent, A.; Bjørn, A.; Hauschild, M.Z. IMPACT 2002+, ReCiPe 2008 and ILCD’s recommended practice for characterization modelling in life cycle impact assessment: A case study-based comparison. Int. J. Life Cycle Assess. 2014, 19, 1007–1021. [Google Scholar] [CrossRef]
- Jolliet, O.; Margni, M.; Charles, R.; Humbert, S.; Payet, J.; Rebitzer, G.; Rosenbaum, R. IMPACT 2002+: A new life cycle impact assessment methodology. Int. J. Life Cycle Assess. 2003, 8, 324–330. [Google Scholar] [CrossRef]
- Shapiro, A. Monte Carlo Sampling Methods. In Handbooks in Operations Research and Management Science—Volume 10; Ruszczynski, A., Shapiro, A., Eds.; Elsevier Science: Amsterdam, The Netherlands, 2003; pp. 353–425. [Google Scholar]
- Ciroth, A.; Muller, S.; Weidema, B.; Lesage, P. Empirically based uncertainty factors for the pedigree matrix in ecoinvent. Int. J. Life Cycle Assess. 2013, 21, 1338–1348. [Google Scholar] [CrossRef]
- Berardy, A.; Costello, C.; Seager, T. Life Cycle Assessment of Soy Protein Isolate; International Symposium on Sustainable Systems and Technologies: Dearborn, MI, USA, 2015. [Google Scholar]
- Chamba, M.V.M.; Hua, Y.; Murekatete, N.; Chen, Y. Effects of synthetic and natural extraction chemicals on yield, composition and protein quality of soy protein isolates extracted from full-fat and defatted flours. J. Food Sci. Technol. 2013, 52, 1016–1023. [Google Scholar] [CrossRef] [PubMed]
- Deng, Y.; Achten, W.M.J.; Van Acker, K.; Duflou, J.R. Life cycle assessment of wheat gluten powder and derived packaging film. Biofuels Bioprod. Biorefining 2013, 7, 429–458. [Google Scholar] [CrossRef]
- Matthews, H.S.; Hendrickson, C.T.; Matthews, D.H. Chapter 5: Data Acquisition and Management for Life Cycle Inventory Analysis. In Life Cycle Assessment: Quantitative Approaches for Decisions That Matter. Open Access Textbook. 2016, pp. 100–161. Available online: https://www.scribd.com/document/285038425/LCA-Book-Chapter-5 (accessed on 23 February 2024).
- Khan, S.; Loyola, C.; Dettling, J.; Hester, J.; Moses, R. Comparative Environmental LCA of the Impossible Burger with Conventional Ground Beef Burger; Impossible Foods: Lausanne, Switzerland, 2019; pp. 12–48. [Google Scholar]
- Collett, K.; O’Callaghan, B.; Mason, M.; Godfray, C.; Hepburn, C. The Climate Impact of Alternative Proteins; Oxford Smith School of Enterprise and the Environment: Oxford, UK, 2021; pp. 5–22. [Google Scholar]
- Roy, P.; Nei, D.; Orikasa, T.; Xu, Q.; Okadome, H.; Nakamura, N.; Shiina, T. A review of life cycle assessment (LCA) on some food products. J. Food Eng. 2009, 90, 1–10. [Google Scholar] [CrossRef]
- Hristov, A.N.; Hanigan, M.; Cole, A.; Todd, R.; McAllister, T.A.; Ndegwa, P.M.; Rotz, A. Review: Ammonia emissions from dairy farms and beef feedlots. Can. J. Anim. Sci. 2011, 91, 1–35. [Google Scholar] [CrossRef]
- Johnson, K.A.; Johnson, D.E. Methane emissions from cattle. J. Anim. Sci. 1995, 73, 2483–2492. [Google Scholar] [CrossRef] [PubMed]
- Broom, D.M. Land and Water Usage in Beef Production Systems. Animals 2019, 9, 286. [Google Scholar] [CrossRef]
- Wu, J.; Li, Q.; Liu, G.; Xie, R.; Zou, Y.; Scipioni, A.; Manzardo, A. Evaluating the impact of refrigerated transport trucks in China on climate change from the life cycle perspective. Environ. Impact Assess. Rev. 2022, 97, 106866. [Google Scholar] [CrossRef]
- Yang, Z.; Tate, J.E.; Morganti, E.; Shepherd, S.P. Real-world CO2 and NOX emissions from refrigerated vans. Sci. Total Environ. 2021, 763, 142974. [Google Scholar] [CrossRef]
- Li, Z.; Cui, S.; Zhang, Q.; Xu, G.; Feng, Q.; Chen, C.; Li, Y. Optimizing Wheat Yield, Water, and Nitrogen Use Efficiency With Water and Nitrogen Inputs in China: A Synthesis and Life Cycle Assessment. Front. Plant Sci. 2022, 13, 930484. [Google Scholar] [CrossRef]
- Willaarts, B.; Flachsbarth, I.; Garrido, A. Land and Water Requirements for Soybean Cultivation in Brazil: Environmental Consequences of Food Production and Trade; XIVth IWRA World Water Congress: Porto de Galinhas, Brazil, 2011. [Google Scholar]
- Putman, B.; Rotz, C.A.; Thoma, G. A comprehensive environmental assessment of beef production and consumption in the United States. J. Clean. Prod. 2023, 402, 136766. [Google Scholar] [CrossRef]
- Thangavel, P.; Park, D.; Lee, Y.-C. Recent Insights into Particulate Matter (PM2.5)-Mediated Toxicity in Humans: An Overview. Int. J. Environ. Res. Public Health 2022, 19, 7511. [Google Scholar] [CrossRef] [PubMed]
- California Air Resources Board Fact Sheet for 2022 Amendments to the Airborne Toxic Control Measure for In-Use Diesel-Fueled Transport Refrigeration Units (TRU) and TRU Generator Sets, and Facilities Where TRUs Operate. Available online: https://ww2.arb.ca.gov/sites/default/files/2022-03/TRU%20ATCM%202022%20Amendments%20Fact%20Sheet_0.pdf (accessed on 6 March 2024).
- Department for Environment, Food & Rural Affairs, Family Food Dataset: UK—Household Purchases. Available online: https://assets.publishing.service.gov.uk/media/653a696280884d000df71b93/UKHHcons-14Sept2023i.ods (accessed on 6 March 2024).
- Office for National Statistics (ONS) Population Estimates for the UK, England, Wales, Scotland and Northern Ireland: Mid-2021. Available online: https://www.ons.gov.uk/peoplepopulationandcommunity/populationandmigration/populationestimates/bulletins/annualmidyearpopulationestimates/mid2021 (accessed on 7 March 2024).
- Department for Energy Security and Net Zero 2022 UK Greenhouse Gas Emissions: Final Figures—Statistical Summary. Available online: https://assets.publishing.service.gov.uk/media/65c0cf2e70428200137521cd/2022-final-emissions-statistics-one-page-summary.pdf (accessed on 7 March 2024).
- Department for Energy Security & Net Zero. Net Zero Government Initiative—UK Roadmap to Net Zero Government Emissions; Department for Energy Security & Net Zero: London, UK, 2023; pp. 4–20. [Google Scholar]
- Pardoe, L. Raising the Steaks: Developing a Market for Alternative Protein in the UK; Social Market Foundation: London, UK, 2021. [Google Scholar]
- du Plessis, M.J.; van Eeden, J.; Goedhals-Gerber, L.; Else, J. Calculating Fuel Usage and Emissions for Refrigerated Road Transport Using Real-World Data. Transp. Res. Part D Transp. Environ. 2023, 117, 103623. [Google Scholar] [CrossRef]
- Almena, A.; Fryer, P.J.; Bakalis, S.; Lopez-Quiroga, E. Centralized and distributed food manufacture: A modeling platform for technological, environmental and economic assessment at different production scales. Sustain. Prod. Consum. 2019, 19, 181–193. [Google Scholar] [CrossRef]
- Coleman, K.; Whitmore, A.P.; Hassall, K.L.; Shield, I.; Semenov, M.A.; Dobermann, A.; Bourhis, Y.; Eskandary, A.; Milne, A.E. The potential for soybean to diversify the production of plant-based protein in the UK. Sci. Total Environ. 2021, 767, 144903. [Google Scholar] [CrossRef] [PubMed]
- Benton, T.G.; Froggatt, A.; Wright, G.; Thompson, C.E.; King, R. Food Politics and Policies in Post-Brexit Britain; Energy, Environment and Resources Department and the Europe Programme, Chatham House: London, UK, 2019. [Google Scholar]
- Kyriakopoulou, K.; Keppler, J.K.; van der Goot, A.J. Functionality of Ingredients and Additives in Plant-Based Meat Analogues. Foods 2021, 10, 600. [Google Scholar] [CrossRef]
- Mendoza Beltran, A.; Prado, V.; Font Vivanco, D.; Henriksson, P.J.G.; Guinée, J.B.; Heijungs, R. Quantified Uncertainties in Comparative Life Cycle Assessment: What Can Be Concluded? Environ. Sci. Technol. 2018, 52, 2152–2161. [Google Scholar] [CrossRef] [PubMed]
- Quinn, G.P.; Keough, M.J. 9.1—Nested (Hierarchical) Designs. In Experimental Design and Data Analysis for Biologists; Cambridge University Press: Cambridge, UK, 2002; pp. 208–220. [Google Scholar]
- Pushkar, S.; Yezioro, A. Life Cycle Assessment Meeting Energy Standard Performance: An Office Building Case Study. Buildings 2022, 12, 157. [Google Scholar] [CrossRef]
- Verbitsky, O.; Pushkar, S. Eco-Indicator 99, ReCiPe and Anova FOR Evaluating Building Technologies under LCA uncertainties. Environ. Eng. Manag. J. 2018, 17, 2549–2559. [Google Scholar] [CrossRef]
- Infanger, D.; Schmidt-Trucksäss, A. P value functions: An underused method to present research results and to promote quantitative reasoning. Stat. Med. 2019, 38, 4189–4197. [Google Scholar] [CrossRef]
- Reed, G.F.; Lynn, F.; Meade, B.D. Use of Coefficient of Variation in Assessing Variability of Quantitative Assays. Clin. Vaccine Immunol. 2002, 9, 1235–1239. [Google Scholar] [CrossRef] [PubMed]
- Zeeb, C.N.; Burns, P.J. A Comparison of Failure Probability Estimates by Monte Carlo Sampling and Latin Hypercube Sampling; Colorado State University: Fort Collins, CO, USA, 1998; pp. 1–30. [Google Scholar]


| Patty | Ingredient | Mass (g) |
|---|---|---|
| Meat Analogue (MA) | Soy protein isolate (SPI) | 36.8 |
| Vital wheat gluten (WG) | 29.4 | |
| Cornstarch (CS) | 7.4 | |
| Water | 9.0 | |
| Coconut oil | 12.5 | |
| Carboxymethyl cellulose (CMC) | 3.0 | |
| Sodium phosphate | 0.5 | |
| Salt | 0.1 | |
| Monosodium glutamate (MSG) | 0.5 | |
| Black pepper | 0.4 | |
| Beef Burger (BB) | Beef meat (20% fat) | 90.5 |
| Potato starch | 4.0 | |
| Salt | 1.0 | |
| Black pepper | 0.5 | |
| Water | 4.0 |
| Impact Category | Unit | Beef Burger (BB) | Meat Analogue (MA) |
|---|---|---|---|
| Global warming | kg CO2 eq | 6.67 | 2.33 |
| Stratospheric ozone depletion | kg CFC11 eq | 3.19 × 10⁻⁵ | 2.30 × 10⁻⁶ |
| Ionising radiation | kBq Co-60 eq | 0.17 | 0.099 |
| Ozone formation, Human health | kg NOx eq | 0.015 | 0.006 |
| Fine particulate matter formation | kg PM2.5 eq | 0.0059 | 0.0025 |
| Ozone formation, Terrestrial ecosystems | kg NOx eq | 0.015 | 0.0057 |
| Terrestrial acidification | kg SO2 eq | 0.024 | 0.0055 |
| Freshwater eutrophication | kg P eq | 0.0009 | 0.0004 |
| Marine eutrophication | kg N eq | 0.003 | 0.0003 |
| Terrestrial ecotoxicity | kg 1,4-DCB | 9.35 | 10.24 |
| Freshwater ecotoxicity | kg 1,4-DCB | 0.15 | 0.19 |
| Marine ecotoxicity | kg 1,4-DCB | 0.18 | 0.20 |
| Human carcinogenic toxicity | kg 1,4-DCB | 0.14 | 0.15 |
| Human non-carcinogenic toxicity | kg 1,4-DCB | 1.58 | 1.85 |
| Land use | m2a crop eq | 4.02 | 0.71 |
| Mineral resource scarcity | kg Cu eq | 0.04 | 0.01 |
| Fossil resource scarcity | kg oil eq | 0.81 | 0.68 |
| Water consumption | m3 | 0.05 | 0.03 |
| Scenario | i/i | h/h | e/e | i/a | h/a | e/a | Mean |
|---|---|---|---|---|---|---|---|
| Original | 50.1 | 65.7 | 452.7 | 39.1 | 84.4 | 587.4 | 213.2 |
| EU Export | 51.1 | 67.4 | 462.3 | 39.9 | 85.5 | 600.0 | 217.7 |
| Homegrown | 49.6 | 64.7 | 449.5 | 38.7 | 83.1 | 583.4 | 211.5 |
| Concentrate | 48.6 | 63.7 | 443.5 | 37.8 | 81.9 | 575.7 | 208.5 |
| Scenario | Original | EU Export | Homegrown | Concentrate |
|---|---|---|---|---|
| Original | X | 0.975 | 0.990 | 0.974 |
| EU Export | X | 0.966 | 0.949 | |
| Homegrown | X | 0.983 | ||
| Concentrate | X |
| Impact Category | Unit | Beef Burger | Meat Analogue | ||||
|---|---|---|---|---|---|---|---|
| Mean | SD | CV | Mean | SD | CV | ||
| Global warming | kg CO2 eq | 6.7 | 0.74 | 11% | 2.3 | 0.27 | 15% |
| Stratospheric ozone depletion | kg CFC11 eq | 0.00003 | 0.000003 | 10% | 2 × 10⁻⁶ | 2 × 10⁻⁷ | 9% |
| Ionising radiation | kBq Co-60 eq | 0.17 | 0.07 | 17% | 0.1 | 0.01 | 10% |
| Ozone formation, Human health | kg NOx eq | 0.02 | 0.002 | 12% | 0.006 | 0.0005 | 15% |
| Fine particulate matter formation | kg PM2.5 eq | 0.006 | 0.001 | 12% | 0.003 | 0.0003 | 14% |
| Ozone formation, Terrestrial ecosystems | kg NOx eq | 0.02 | 0.002 | 12% | 0.006 | 0.0004 | 11% |
| Terrestrial acidification | kg SO2 eq | 0.02 | 0.002 | 10% | 0.006 | 0.0008 | 17% |
| Freshwater eutrophication | kg P eq | 0.001 | 0.0001 | 16% | 0.0004 | 0.00004 | 13% |
| Marine eutrophication | kg N eq | 0.003 | 0.0003 | 10% | 0.0003 | 0.00002 | 7% |
| Terrestrial ecotoxicity | kg 1,4-DCB | 9.1 | 1.7 | 15% | 10.2 | 0.89 | 11% |
| Freshwater ecotoxicity | kg 1,4-DCB | 0.14 | 0.03 | 9% | 0.19 | 0.009 | 9% |
| Marine ecotoxicity | kg 1,4-DCB | 0.18 | 0.05 | 19% | 0.19 | 0.019 | 12% |
| Human carcinogenic toxicity | kg 1,4-DCB | 0.14 | 0.06 | 19% | 0.15 | 0.022 | 17% |
| Human non-carcinogenic toxicity | kg 1,4-DCB | 1.3 | 24.1 | 1796% | 2.1 | 25.5 | 1199% |
| Land use | m2a crop eq | 4.1 | 0.41 | 10% | 0.71 | 0.02 | 3% |
| Mineral resource scarcity | kg Cu eq | 0.04 | 0.005 | 12% | 0.01 | 0.002 | 19% |
| Fossil resource scarcity | kg oil eq | 0.8 | 0.1 | 13% | 0.67 | 0.08 | 12% |
| Water consumption | m3 | 0.05 | 0.008 | 15% | 0.03 | 0.004 | 12% |
Disclaimer/Publisher’s Note: The statements, opinions and data contained in all publications are solely those of the individual author(s) and contributor(s) and not of MDPI and/or the editor(s). MDPI and/or the editor(s) disclaim responsibility for any injury to people or property resulting from any ideas, methods, instructions or products referred to in the content. |
© 2024 by the authors. Licensee MDPI, Basel, Switzerland. This article is an open access article distributed under the terms and conditions of the Creative Commons Attribution (CC BY) license (https://creativecommons.org/licenses/by/4.0/).
Share and Cite
Tang, M.; Miri, T.; Soltani, F.; Onyeaka, H.; Al-Sharify, Z.T. Life Cycle Assessment of Plant-Based vs. Beef Burgers: A Case Study in the UK. Sustainability 2024, 16, 4417. https://doi.org/10.3390/su16114417
Tang M, Miri T, Soltani F, Onyeaka H, Al-Sharify ZT. Life Cycle Assessment of Plant-Based vs. Beef Burgers: A Case Study in the UK. Sustainability. 2024; 16(11):4417. https://doi.org/10.3390/su16114417
Chicago/Turabian StyleTang, Meshach, Taghi Miri, Fakhteh Soltani, Helen Onyeaka, and Zainab T. Al-Sharify. 2024. "Life Cycle Assessment of Plant-Based vs. Beef Burgers: A Case Study in the UK" Sustainability 16, no. 11: 4417. https://doi.org/10.3390/su16114417
APA StyleTang, M., Miri, T., Soltani, F., Onyeaka, H., & Al-Sharify, Z. T. (2024). Life Cycle Assessment of Plant-Based vs. Beef Burgers: A Case Study in the UK. Sustainability, 16(11), 4417. https://doi.org/10.3390/su16114417