
Study Roadmap Selection Based on the Thermal Comfort of Street Trees in Summer: A Case Study from a University Campus in China


Abstract
1. Introduction
2. Methods
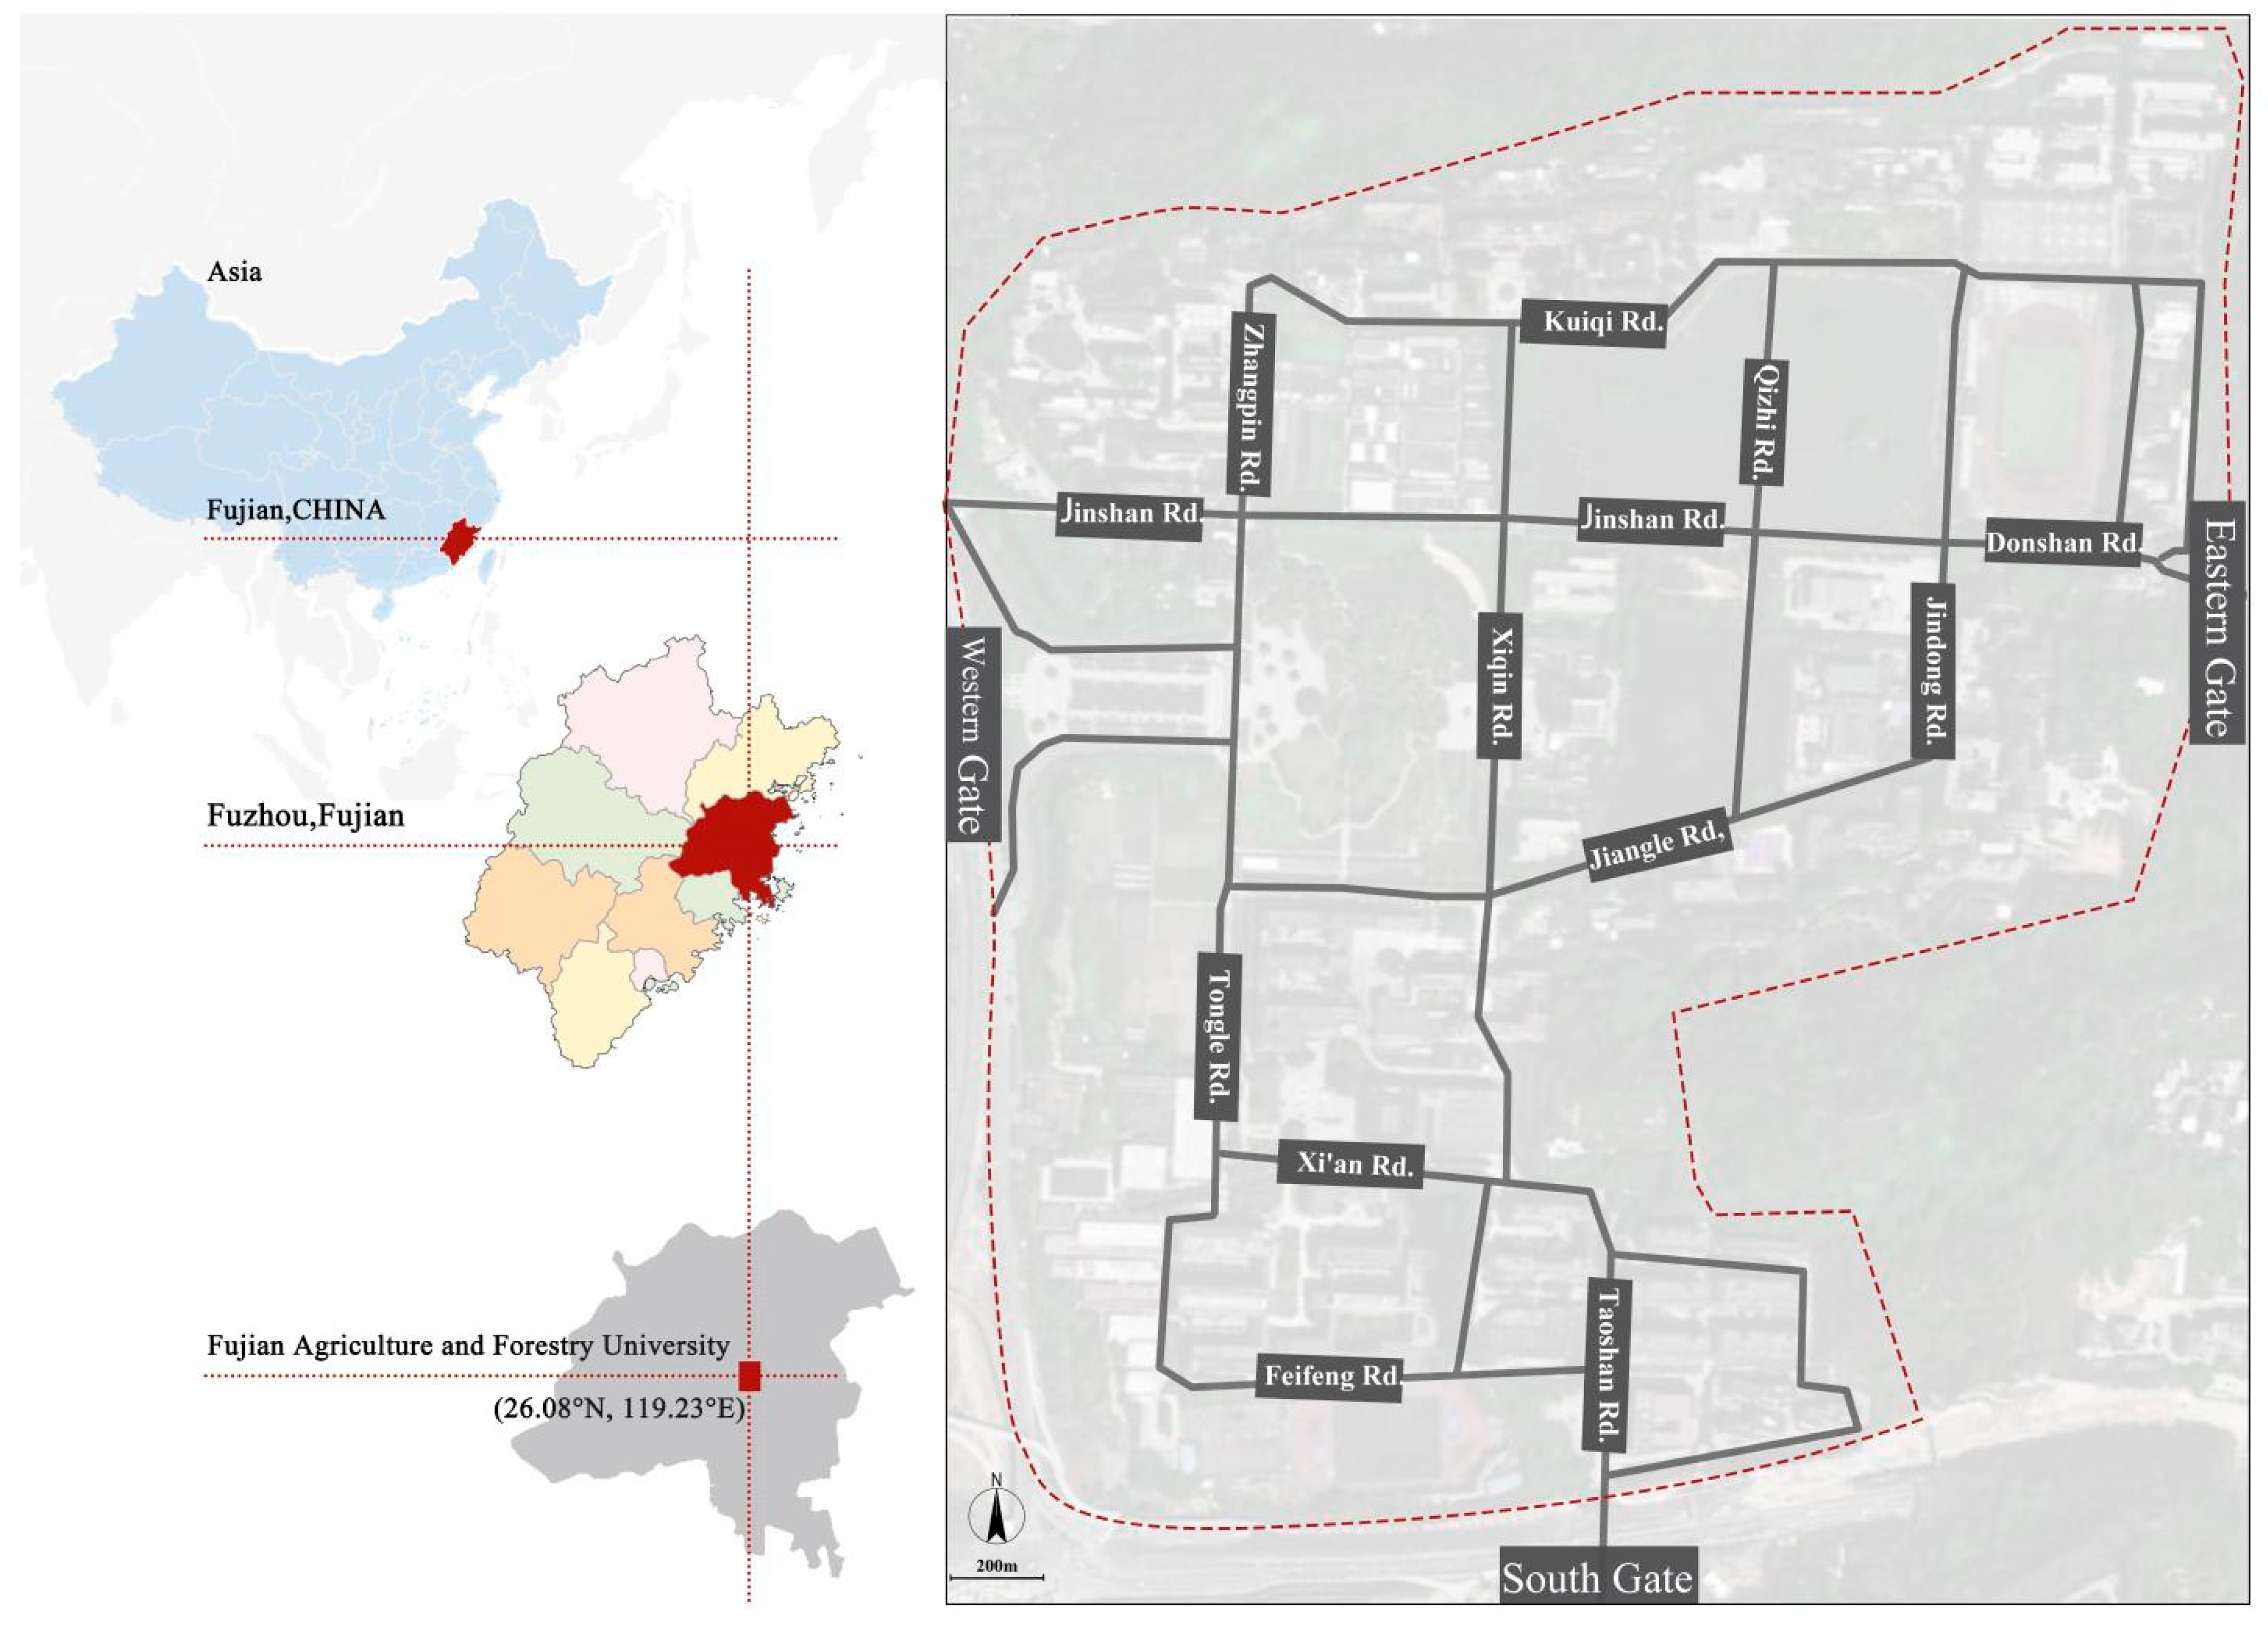
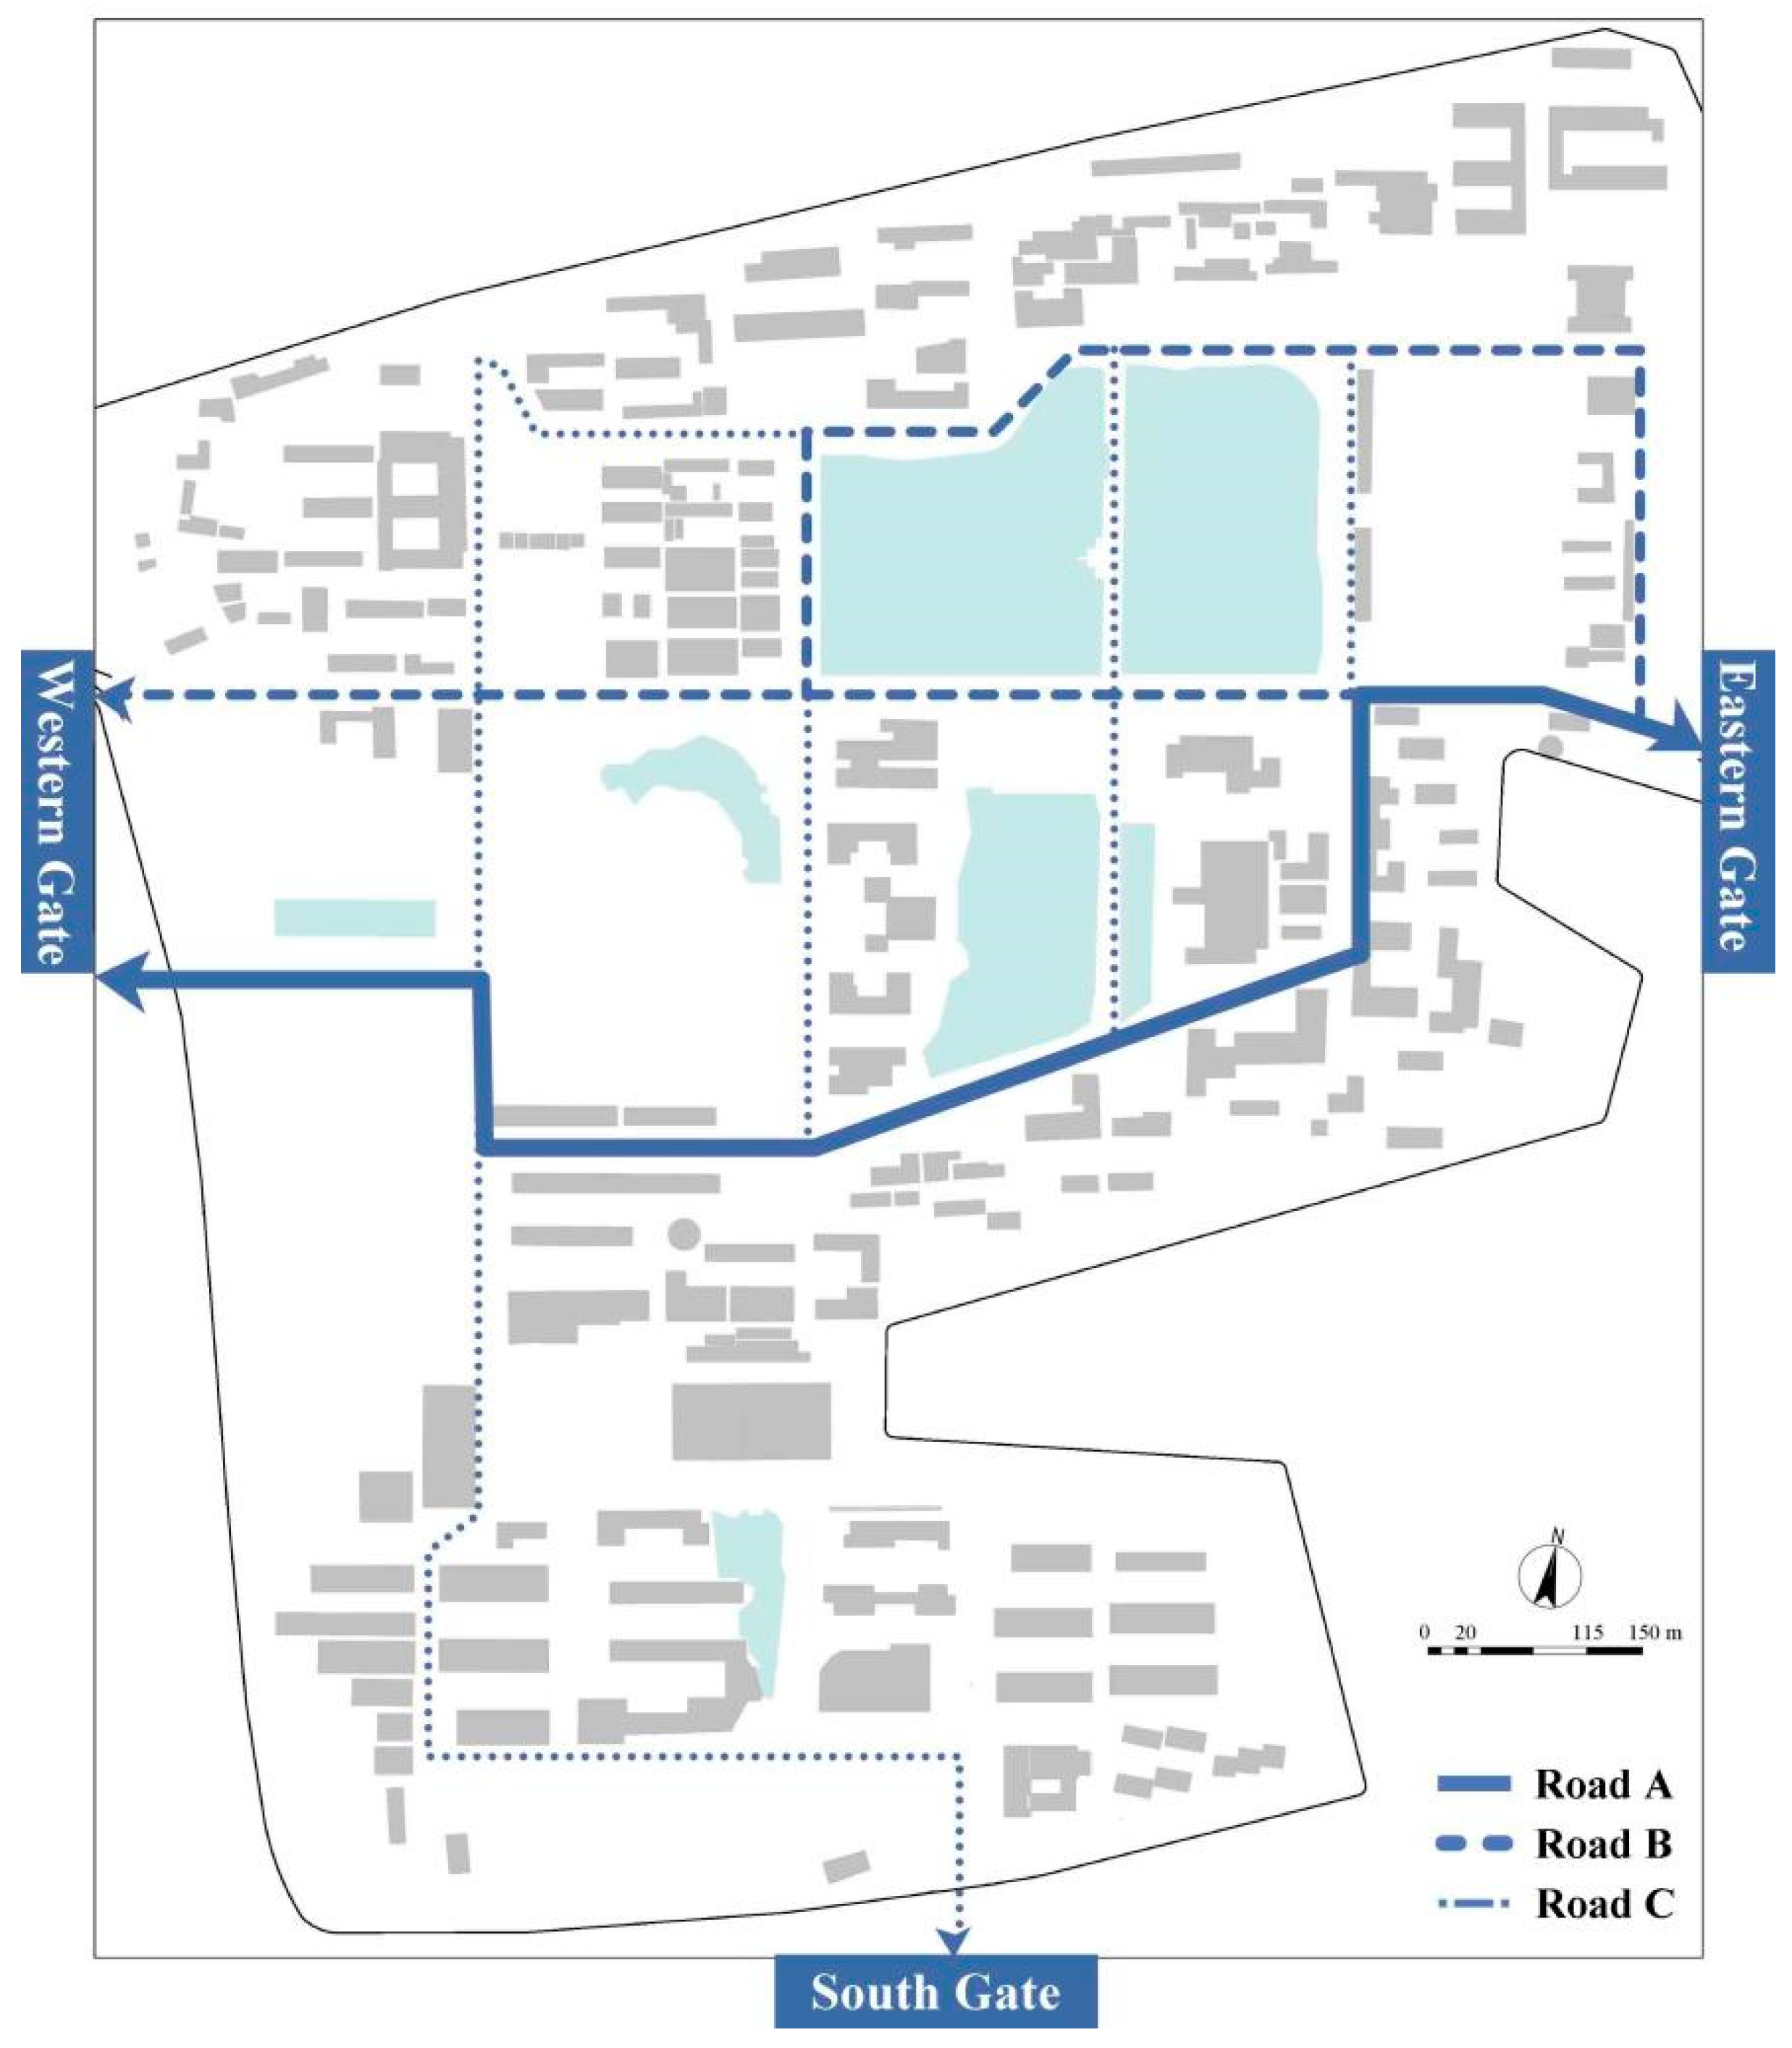
2.1. Study Sites
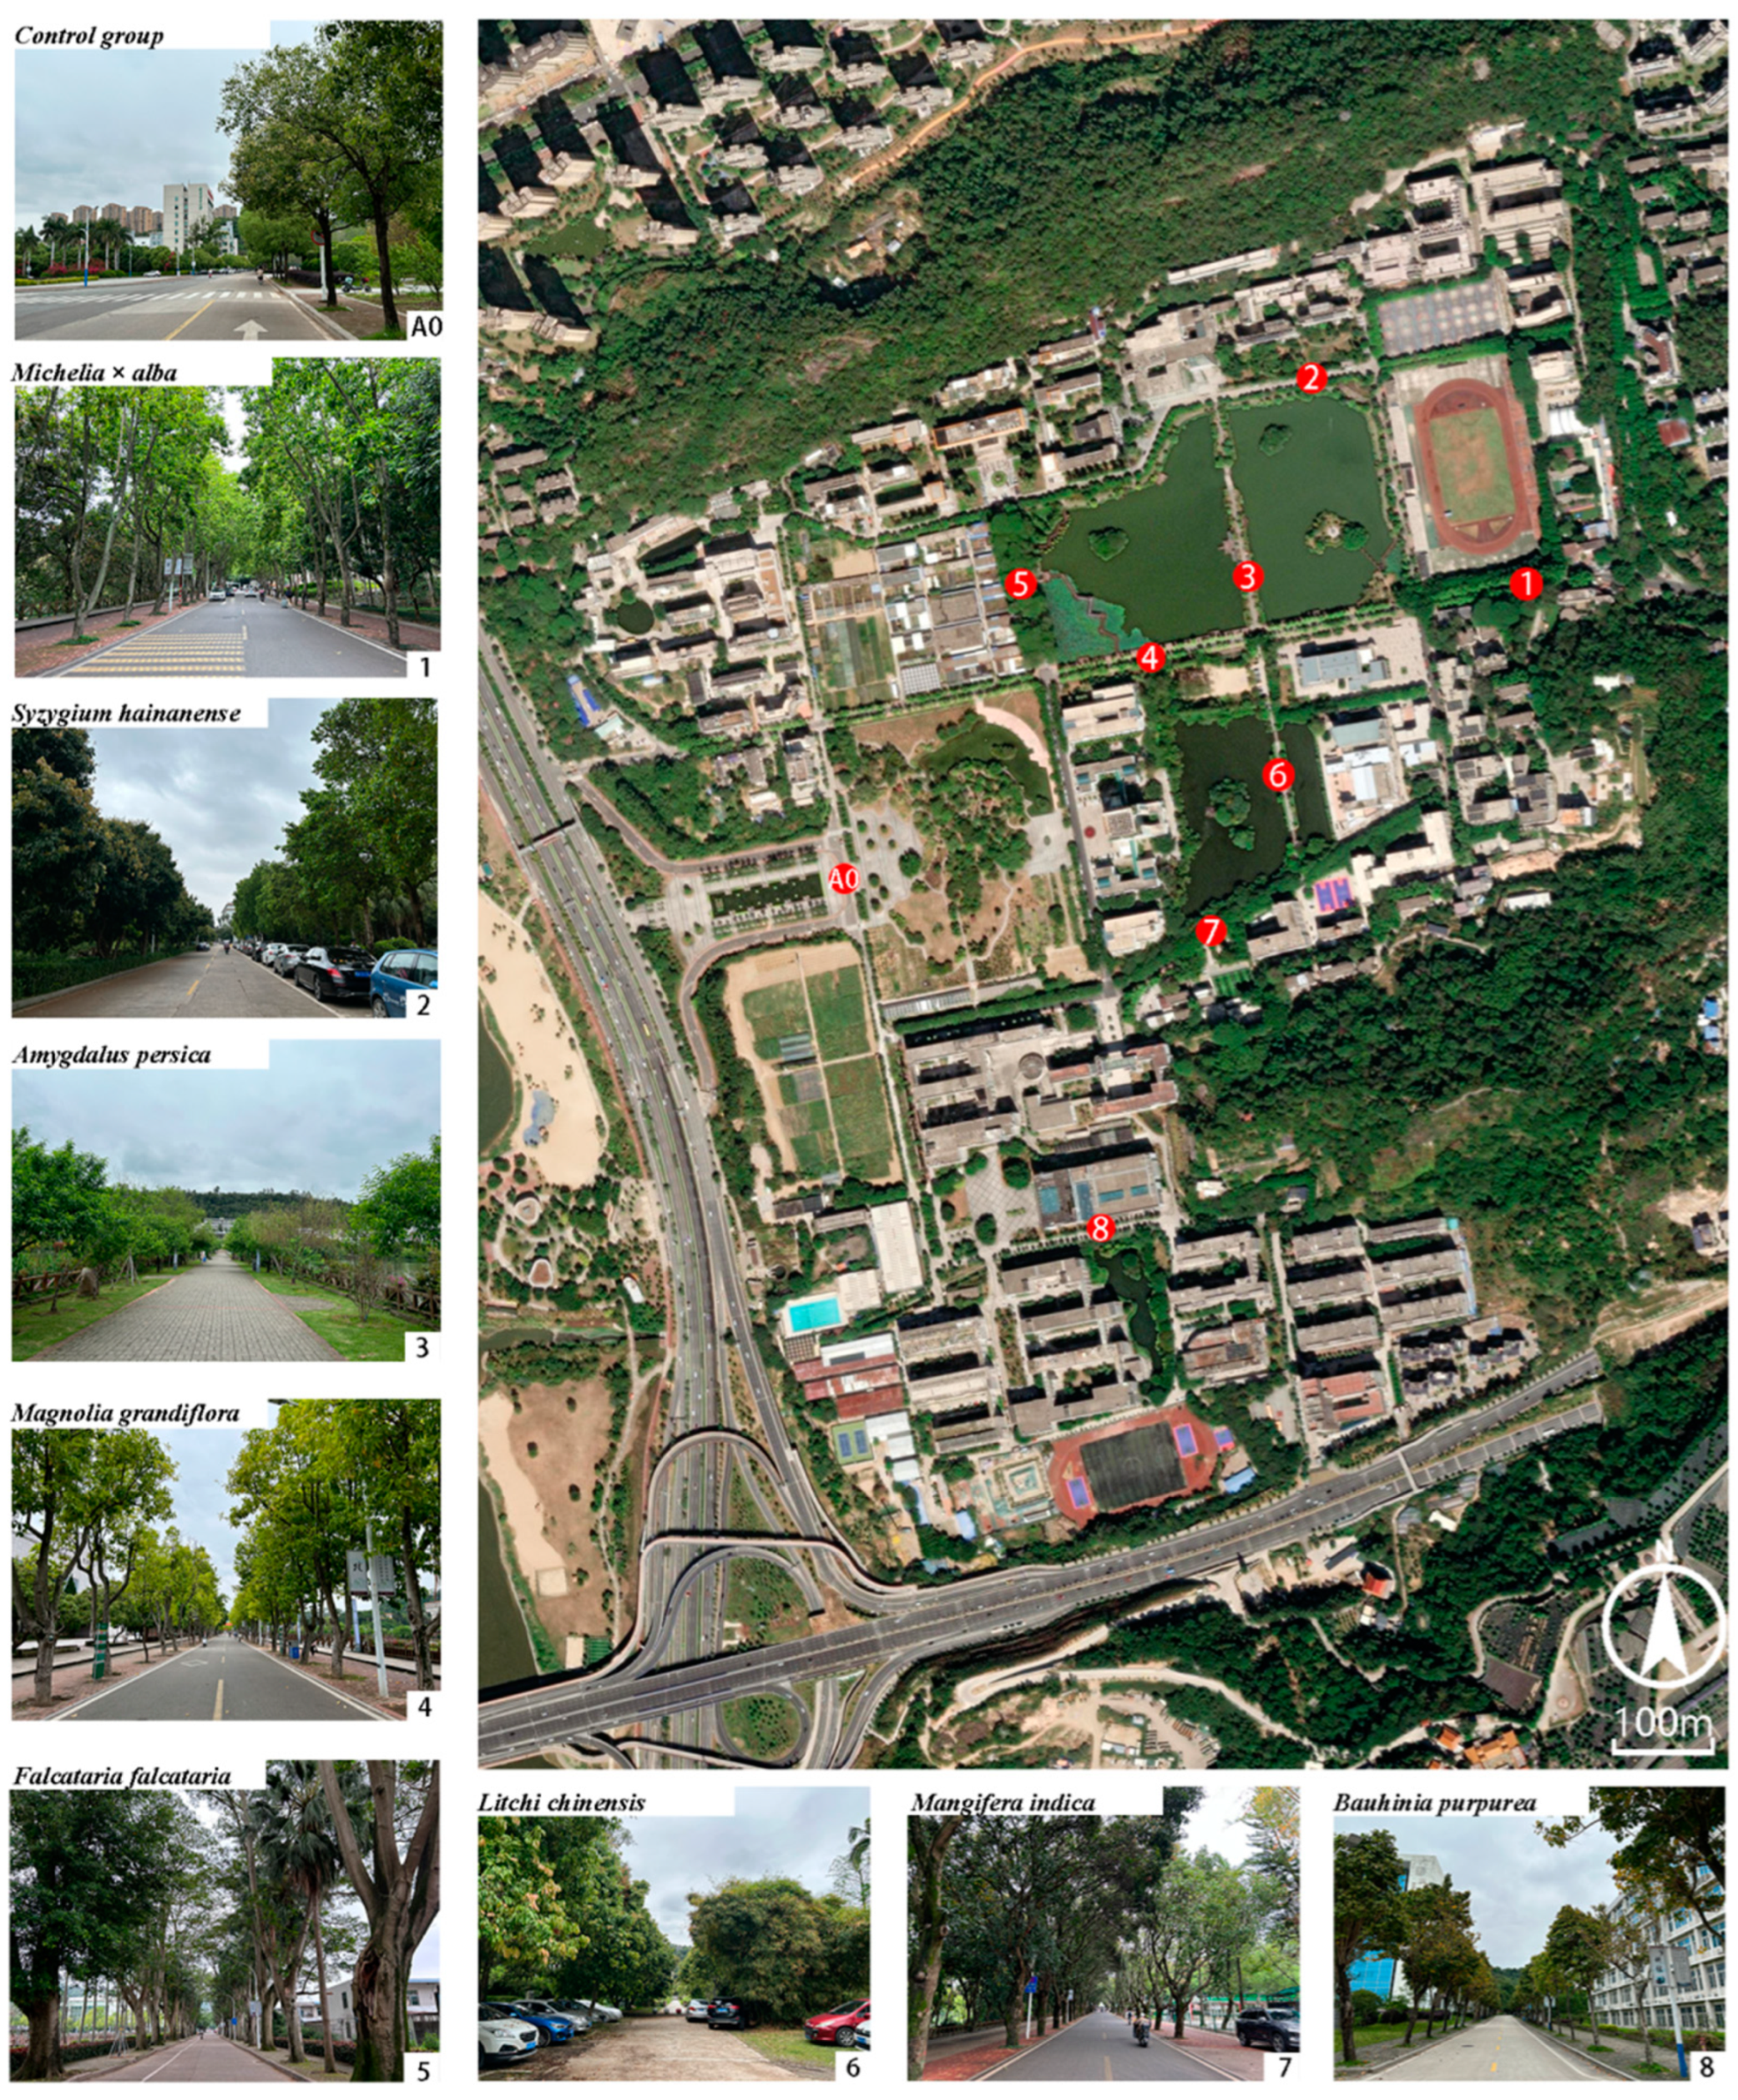
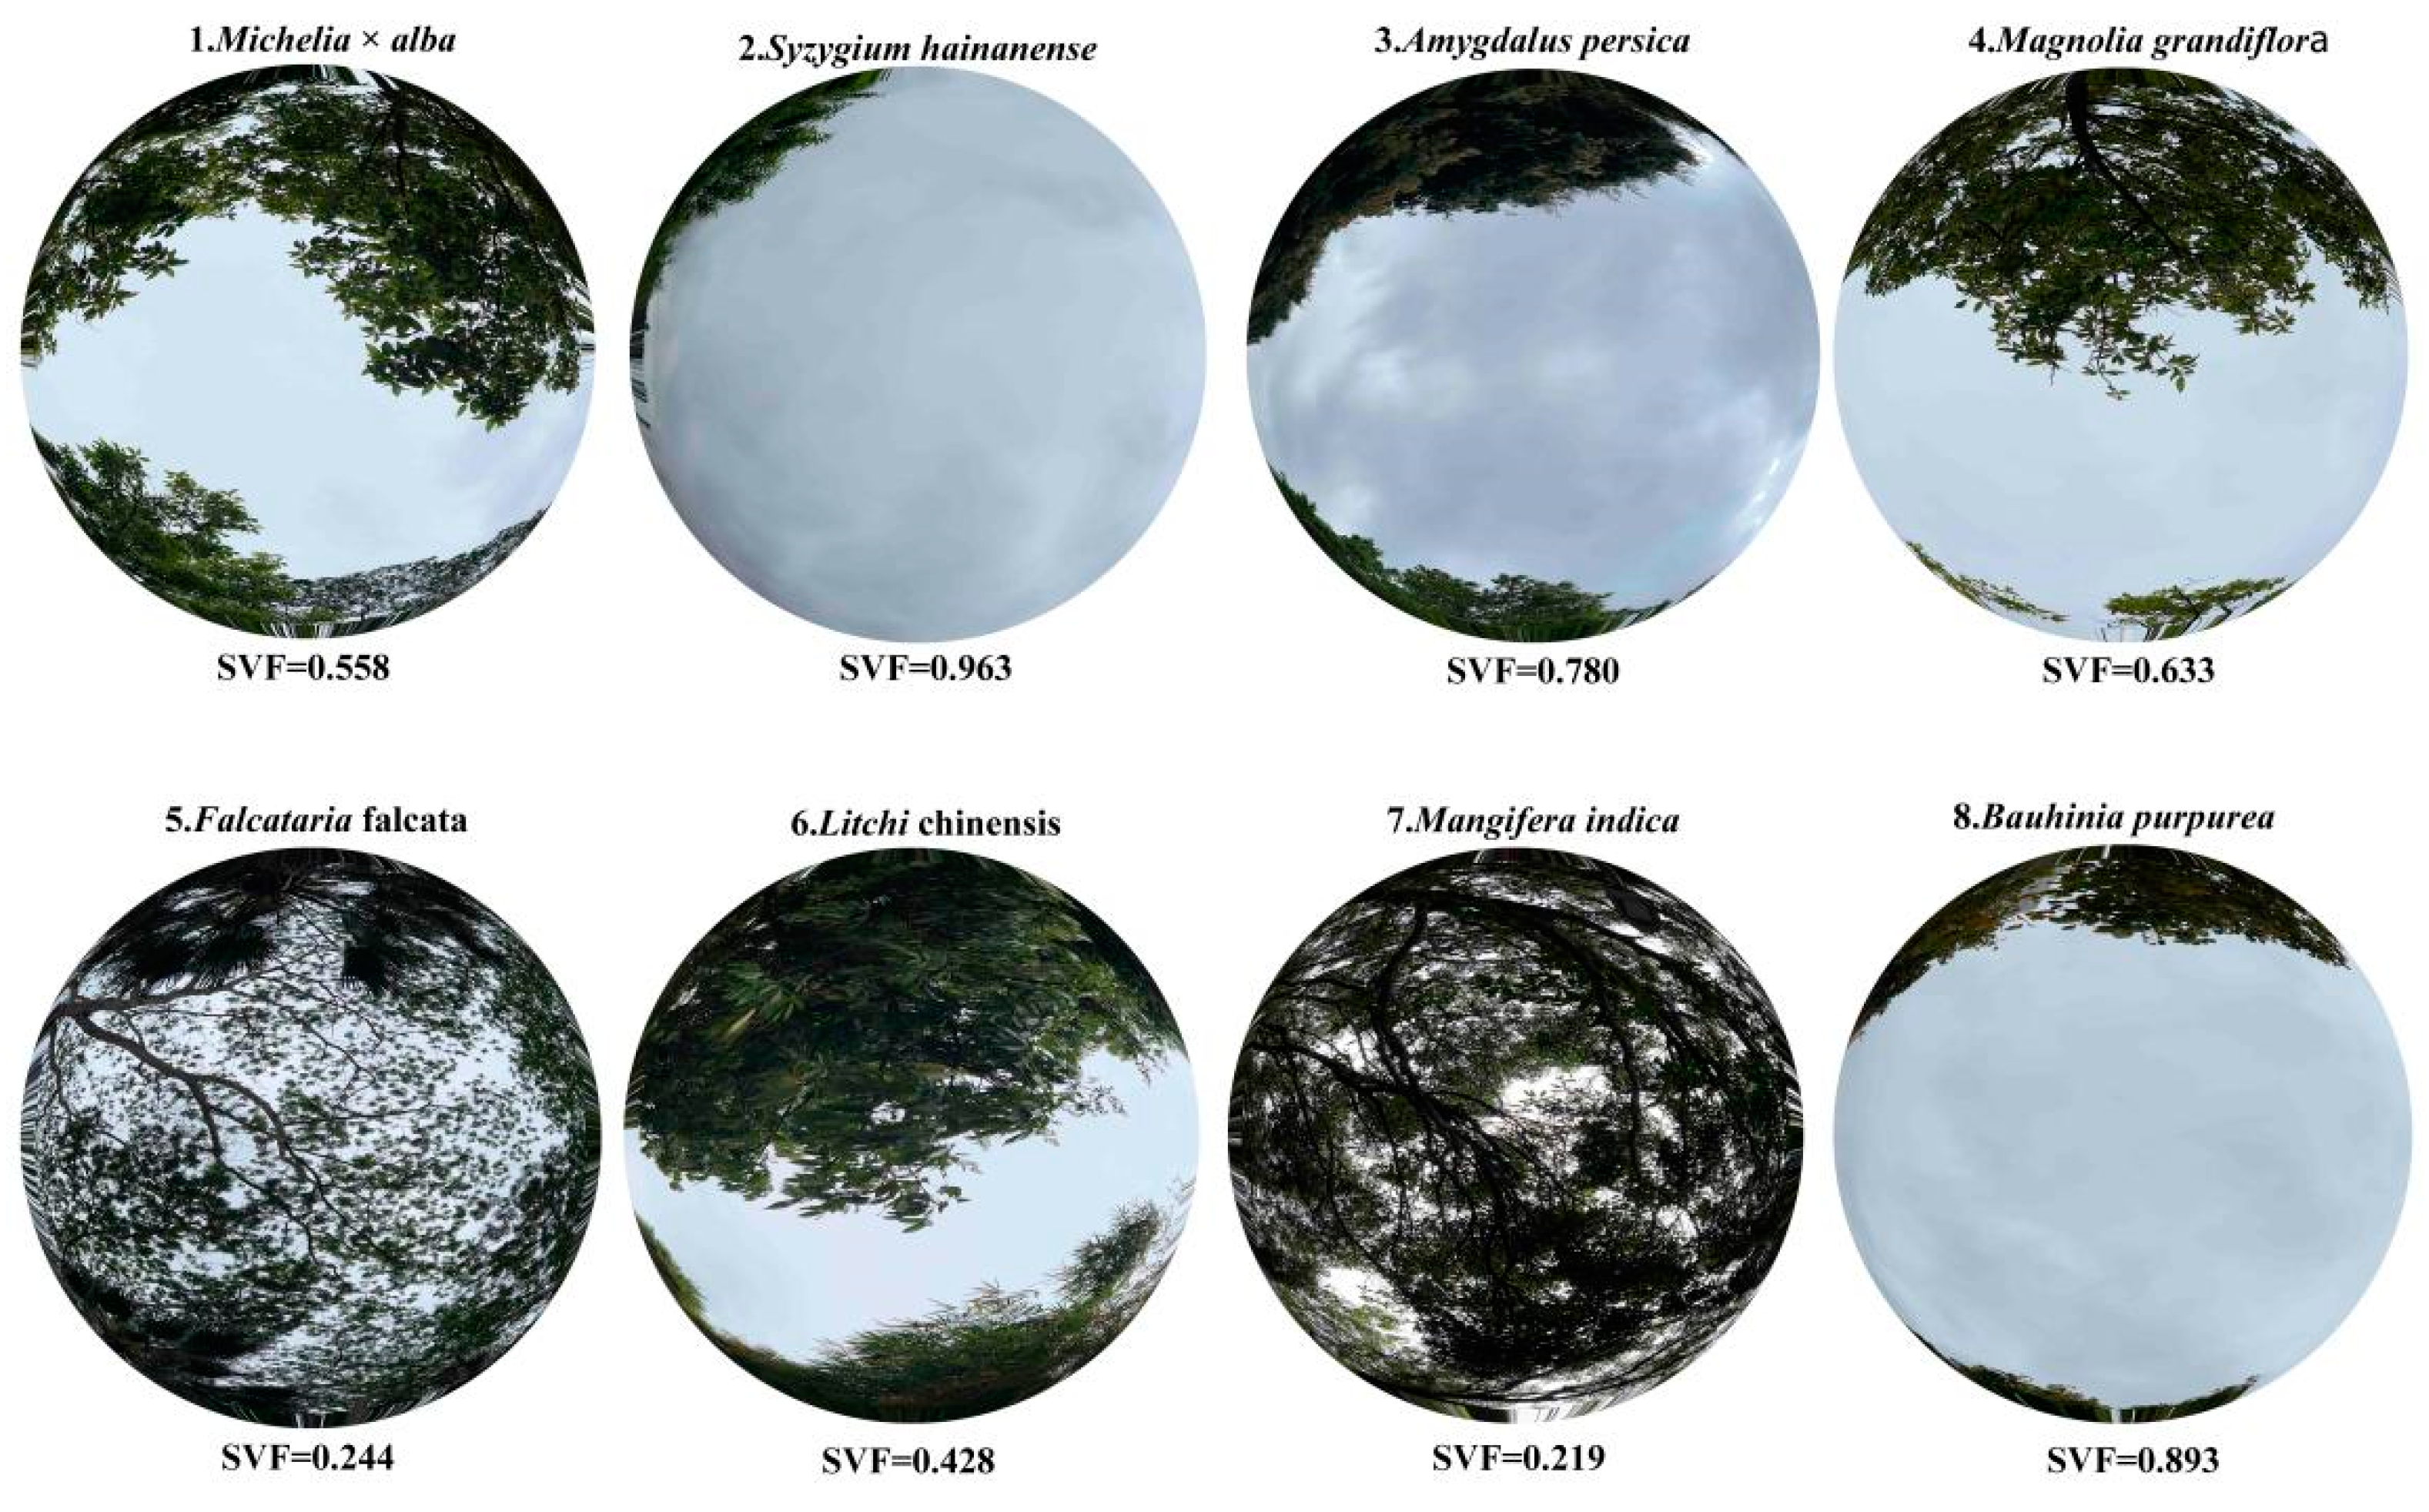
2.2. Sample Site Selection
2.3. Field Measurement
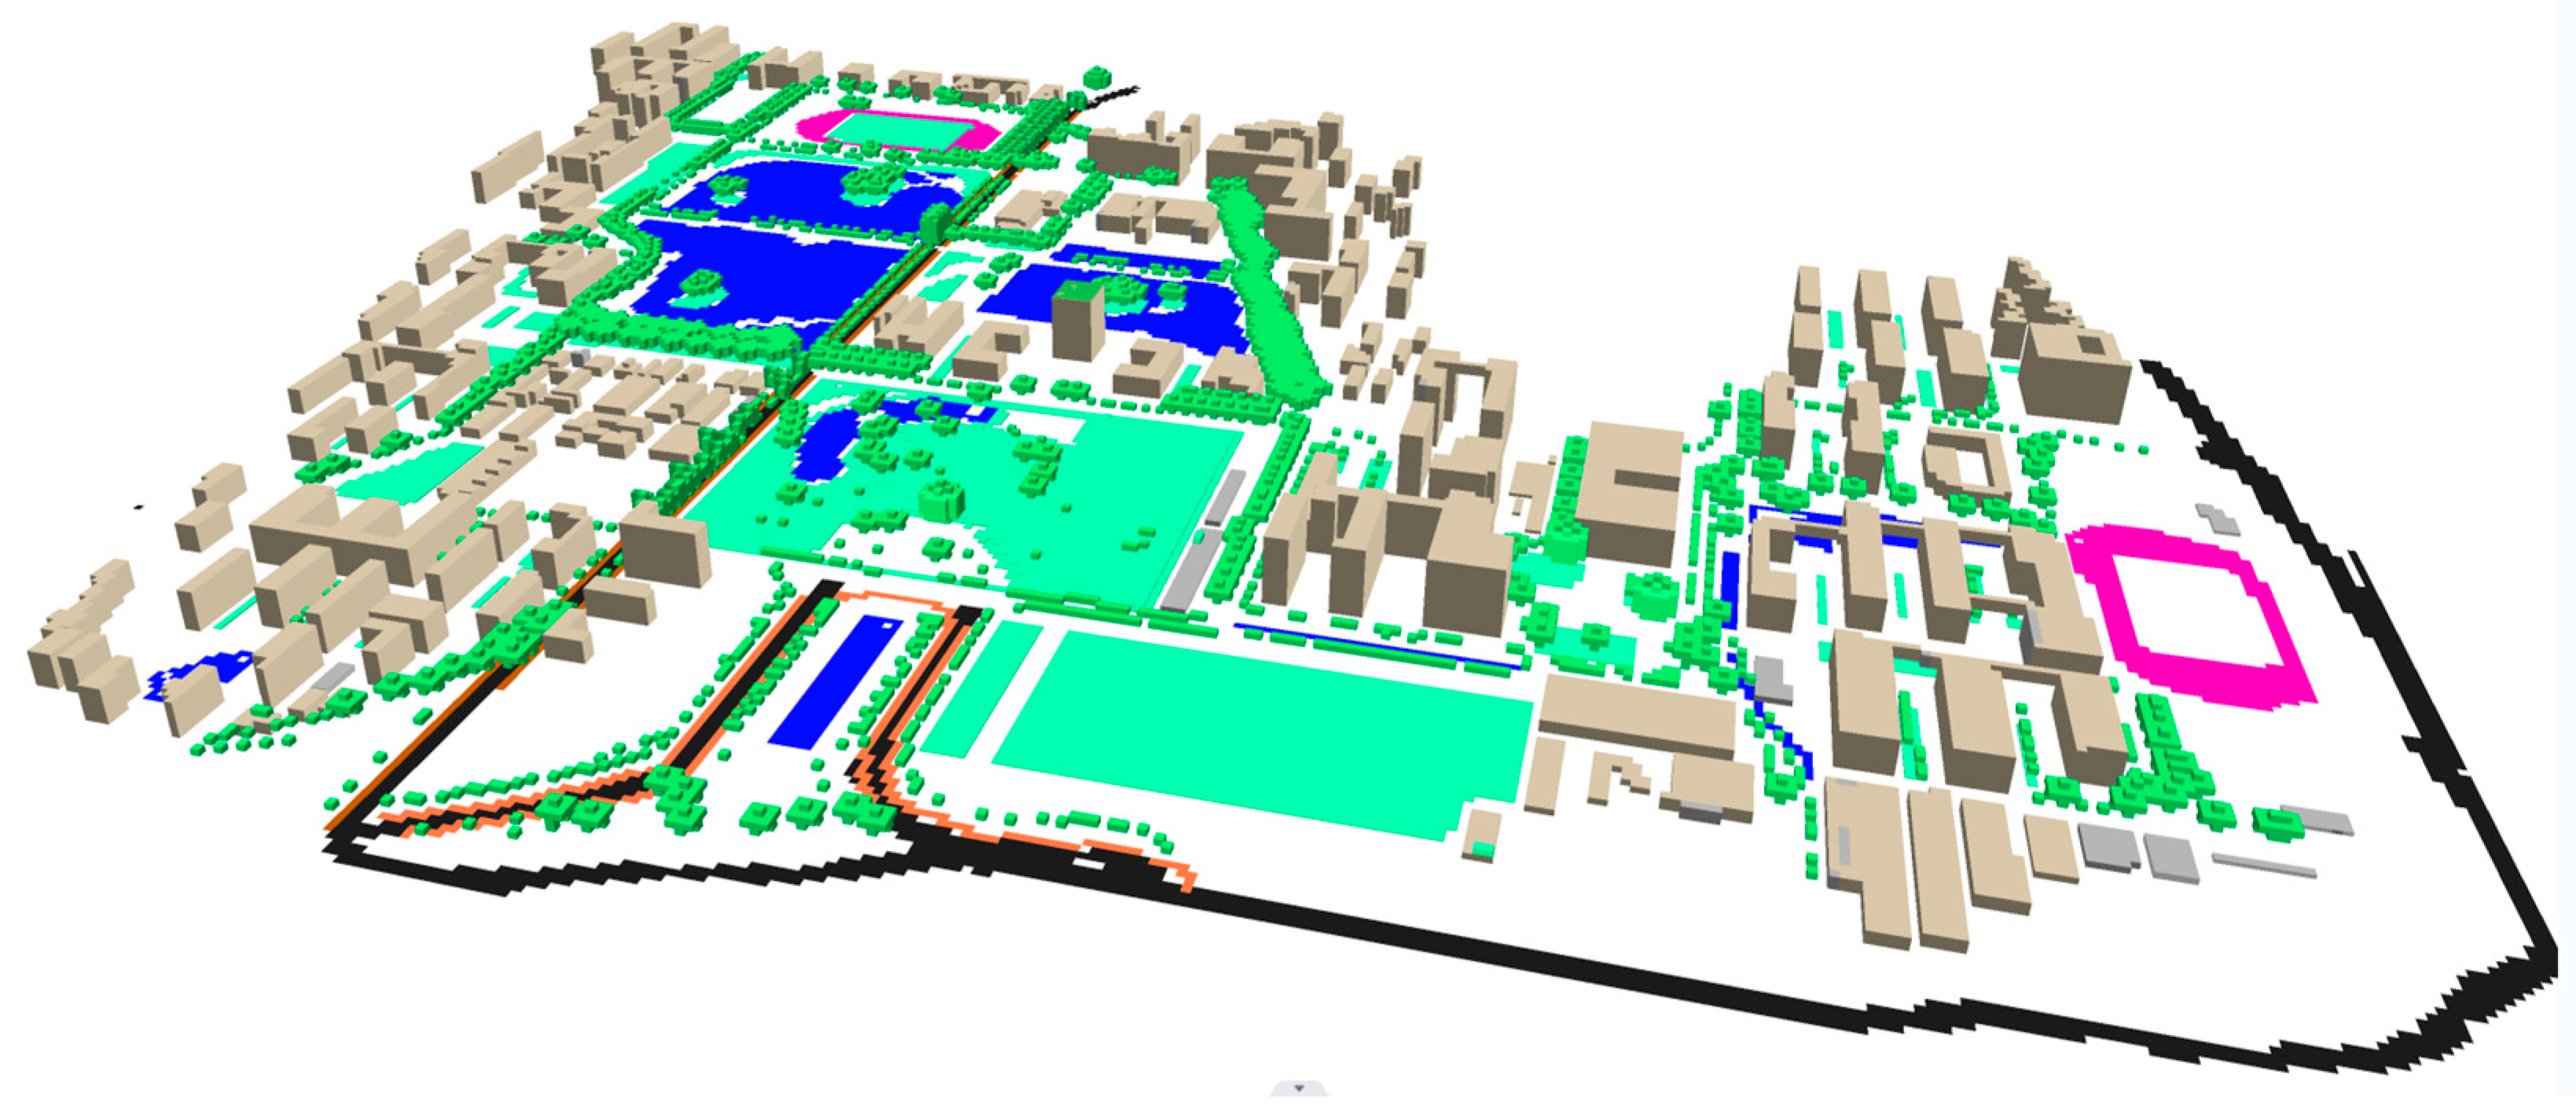
2.4. ENVI-Met Simulation
2.4.1. Model Validation Parameter Settings
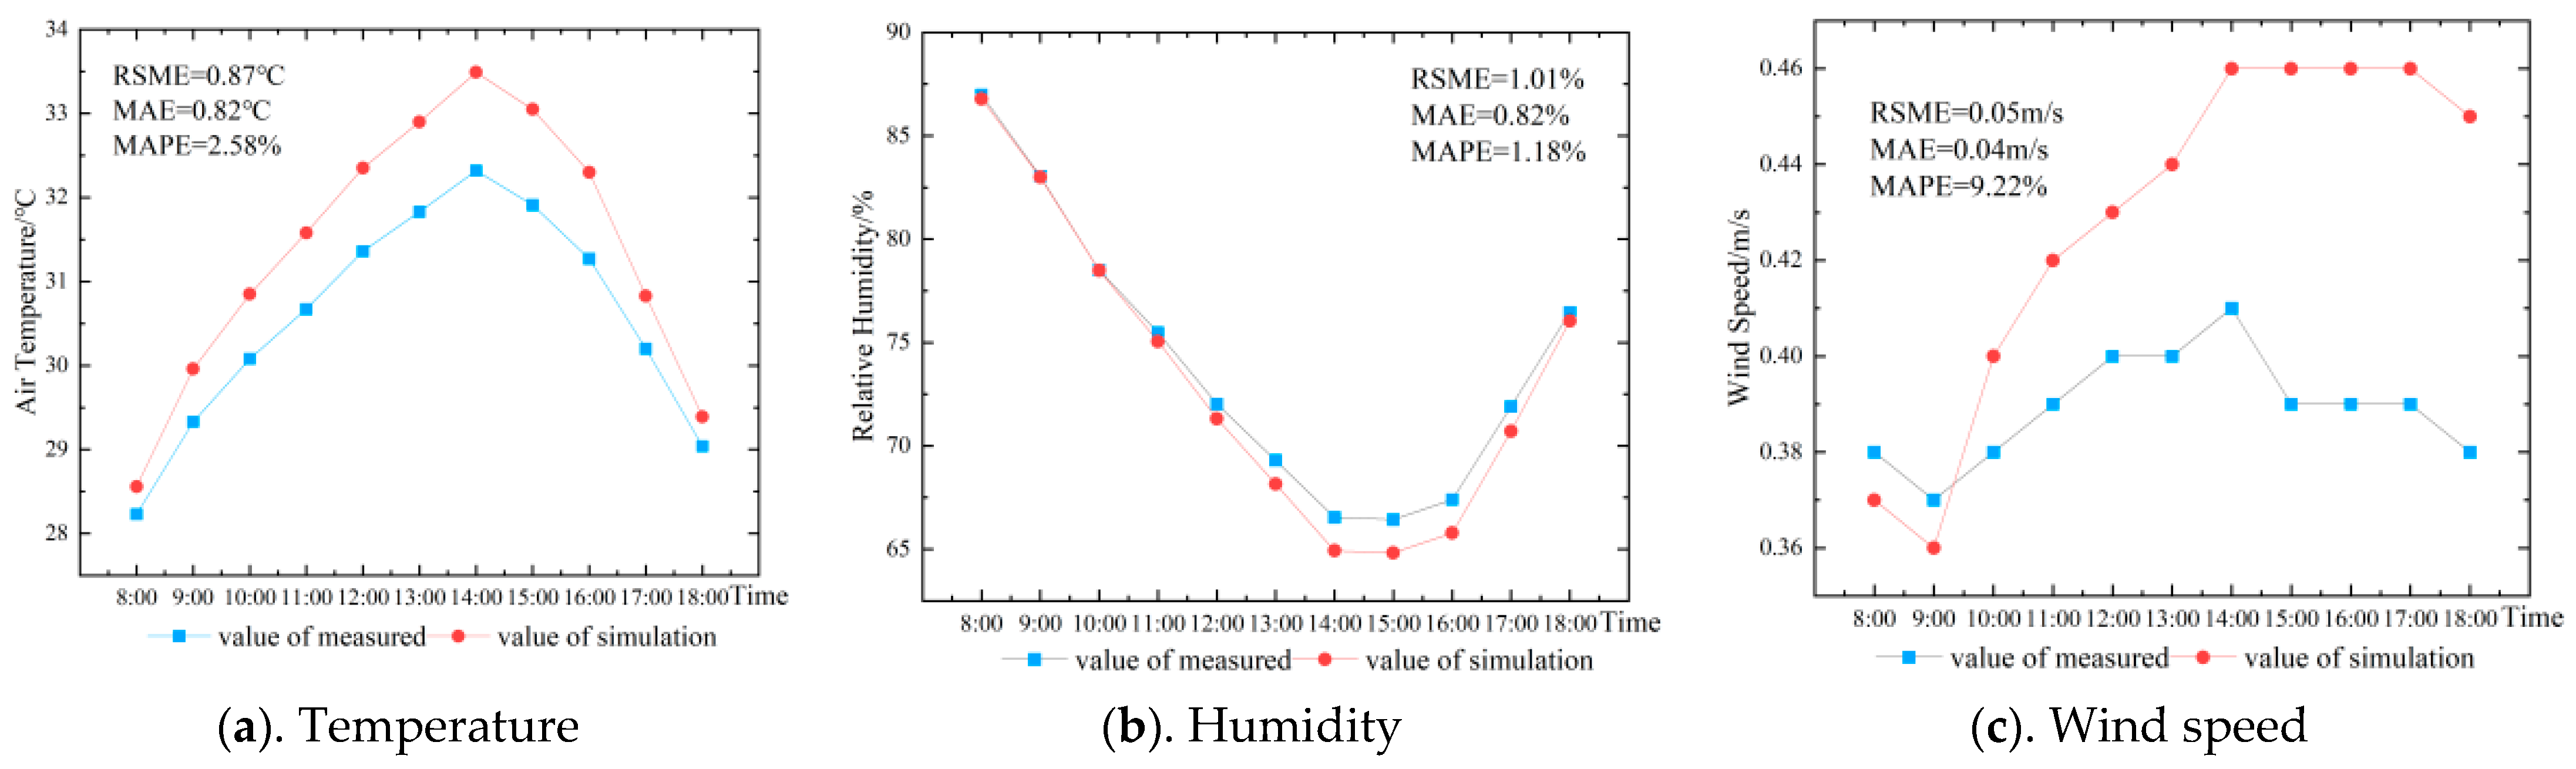
2.4.2. Validation of Model Validity

| Number | Formula | Meaning | Symbol and Its Representation | Reference |
|---|---|---|---|---|
| 1 | Evaluate the accuracy of the model, compare the error between the measured and simulated values, and reflect the applicability of the model. | xi denotes the simulated value; xi’ denotes the measured value; n denotes the number of tests. | [49] | |
| 2 | ||||
| 3 |
2.4.3. Parameters of Street Tree Models
2.5. Spatial Statistical Tools
2.5.1. ArcGIS
2.5.2. Combination of ArcGIS and ENVI-Met
2.6. Data Analysis
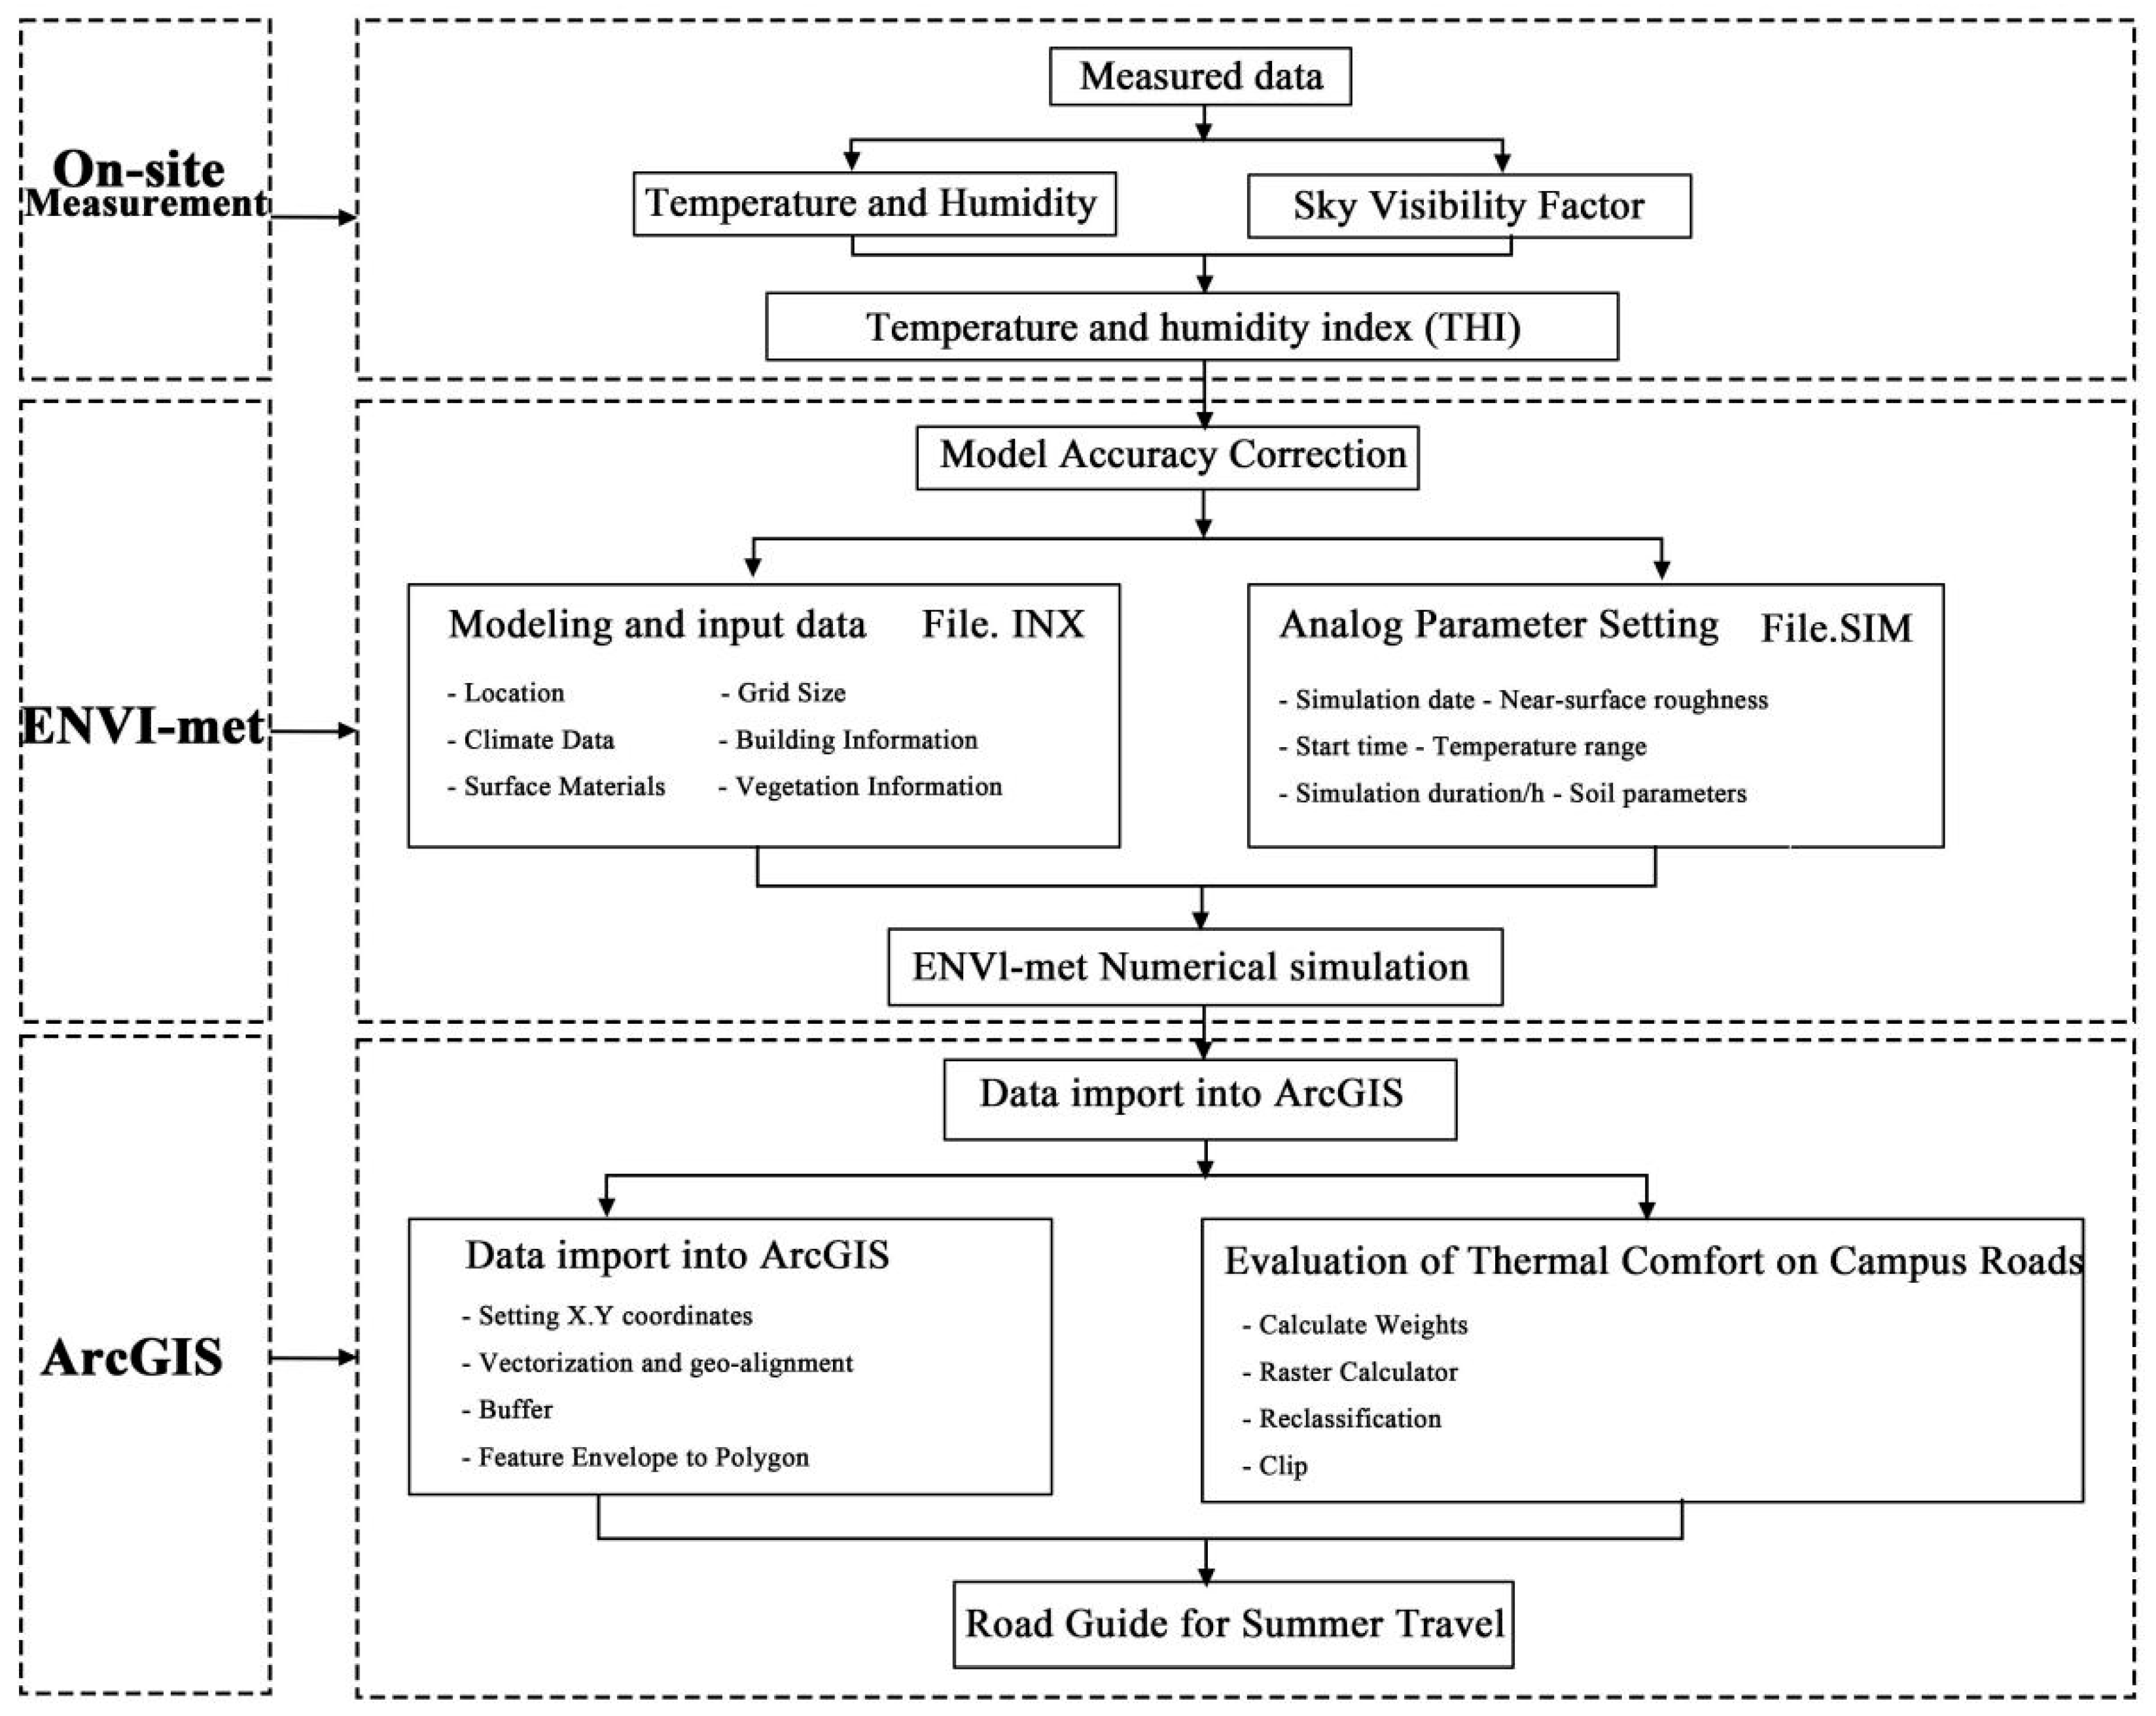
2.7. Technical Lines
3. Results
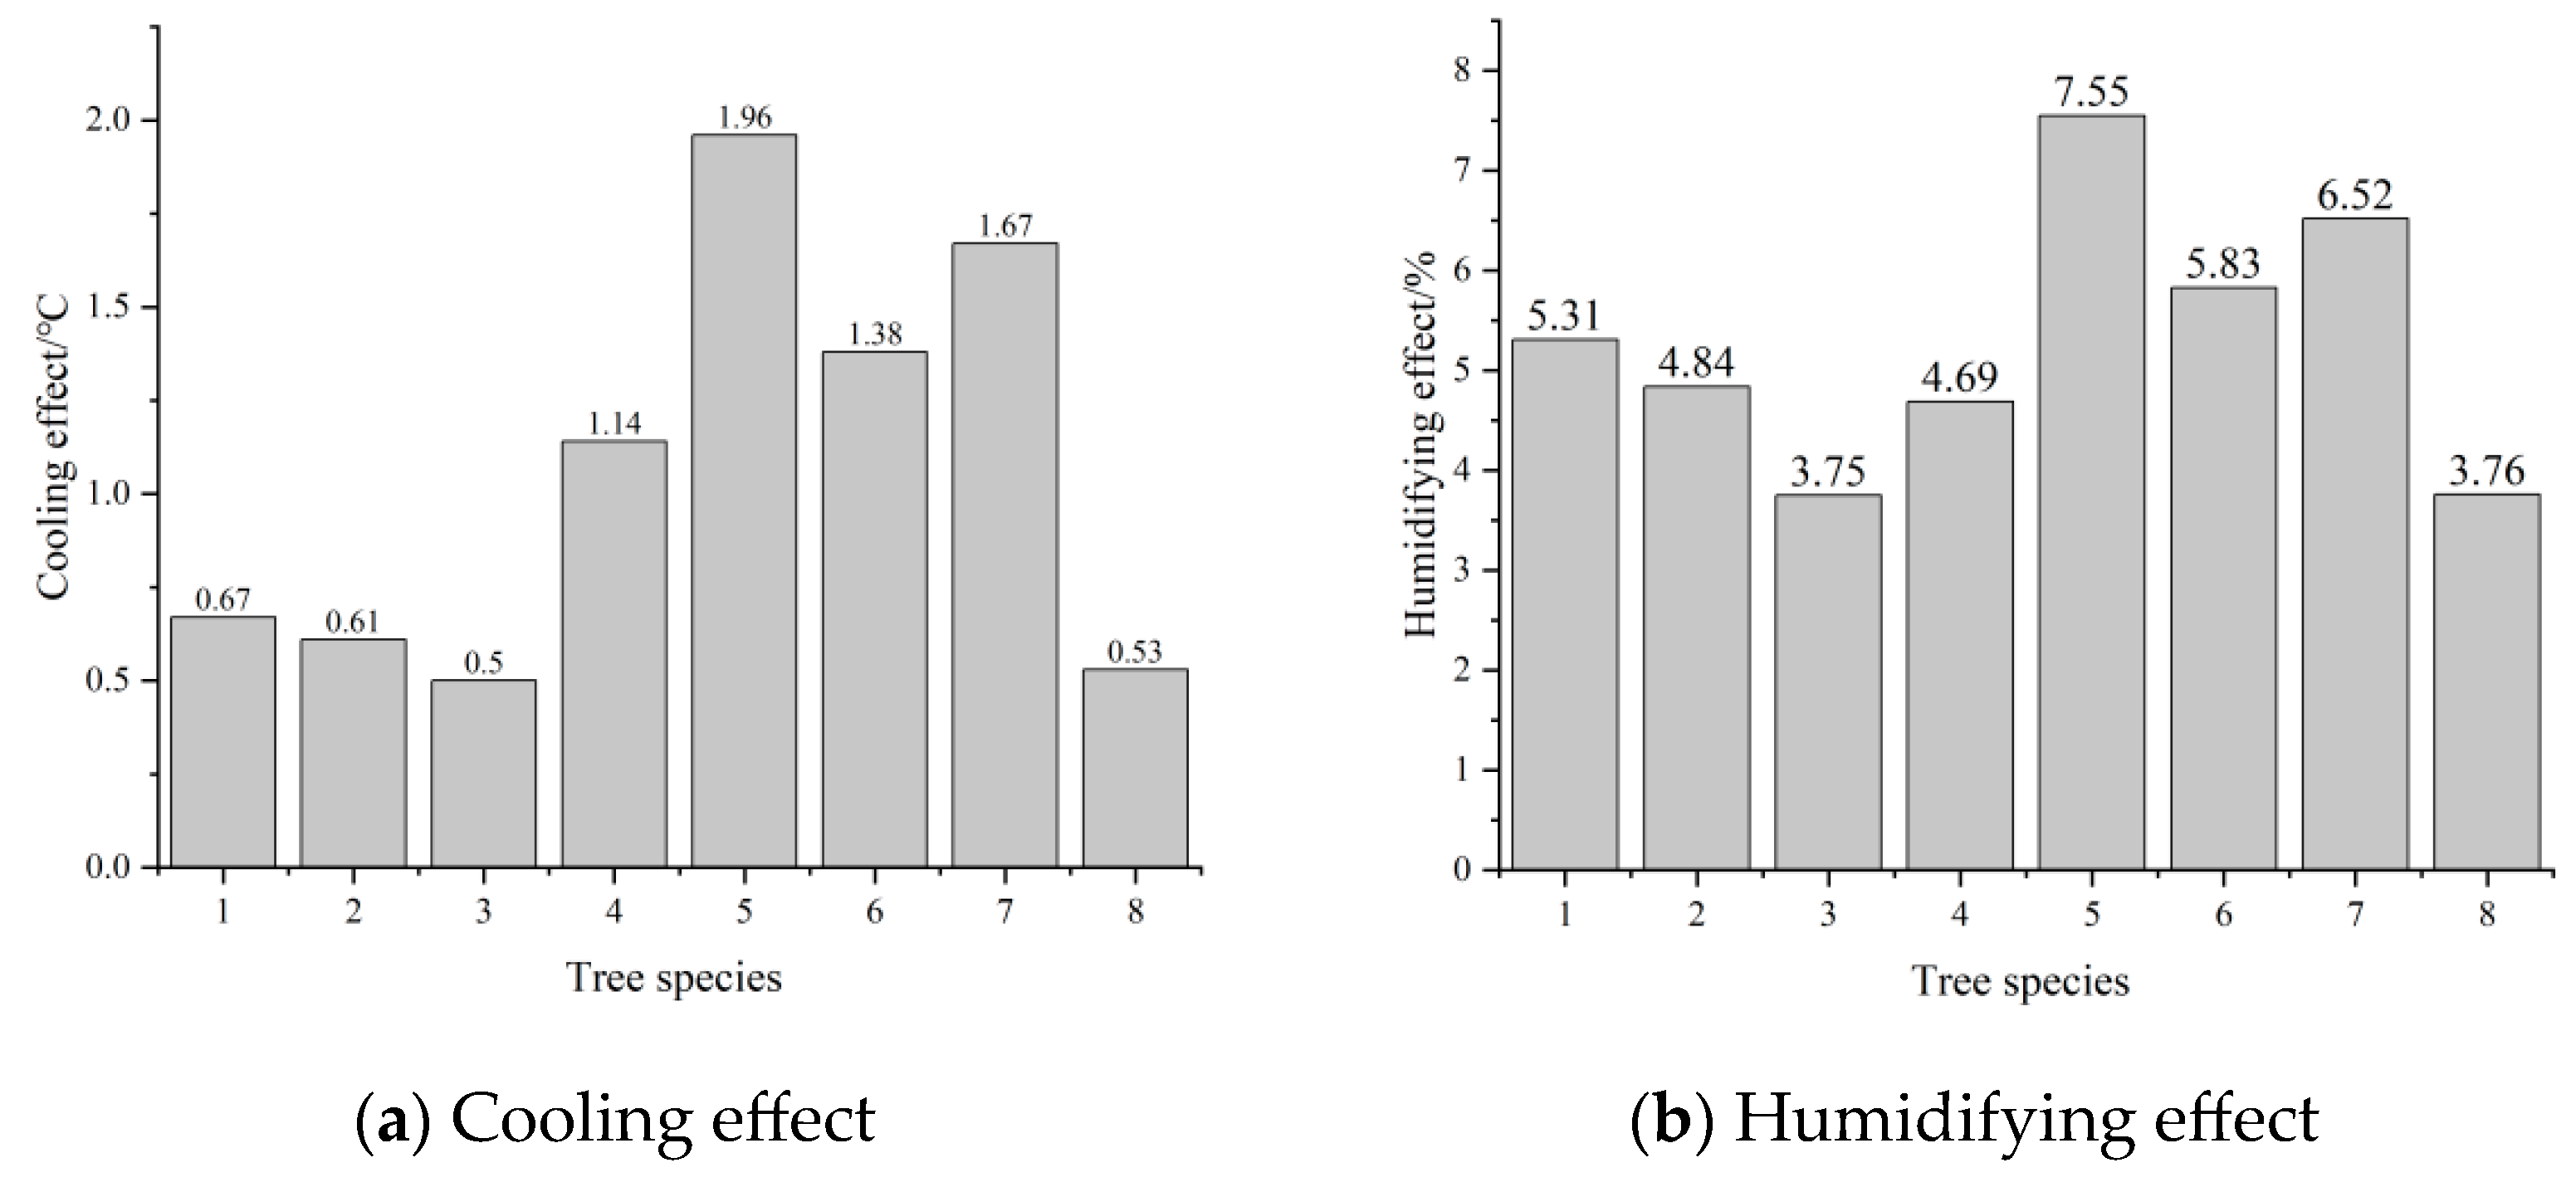
3.1. Influence of Street Tree Species on Thermal Comfort
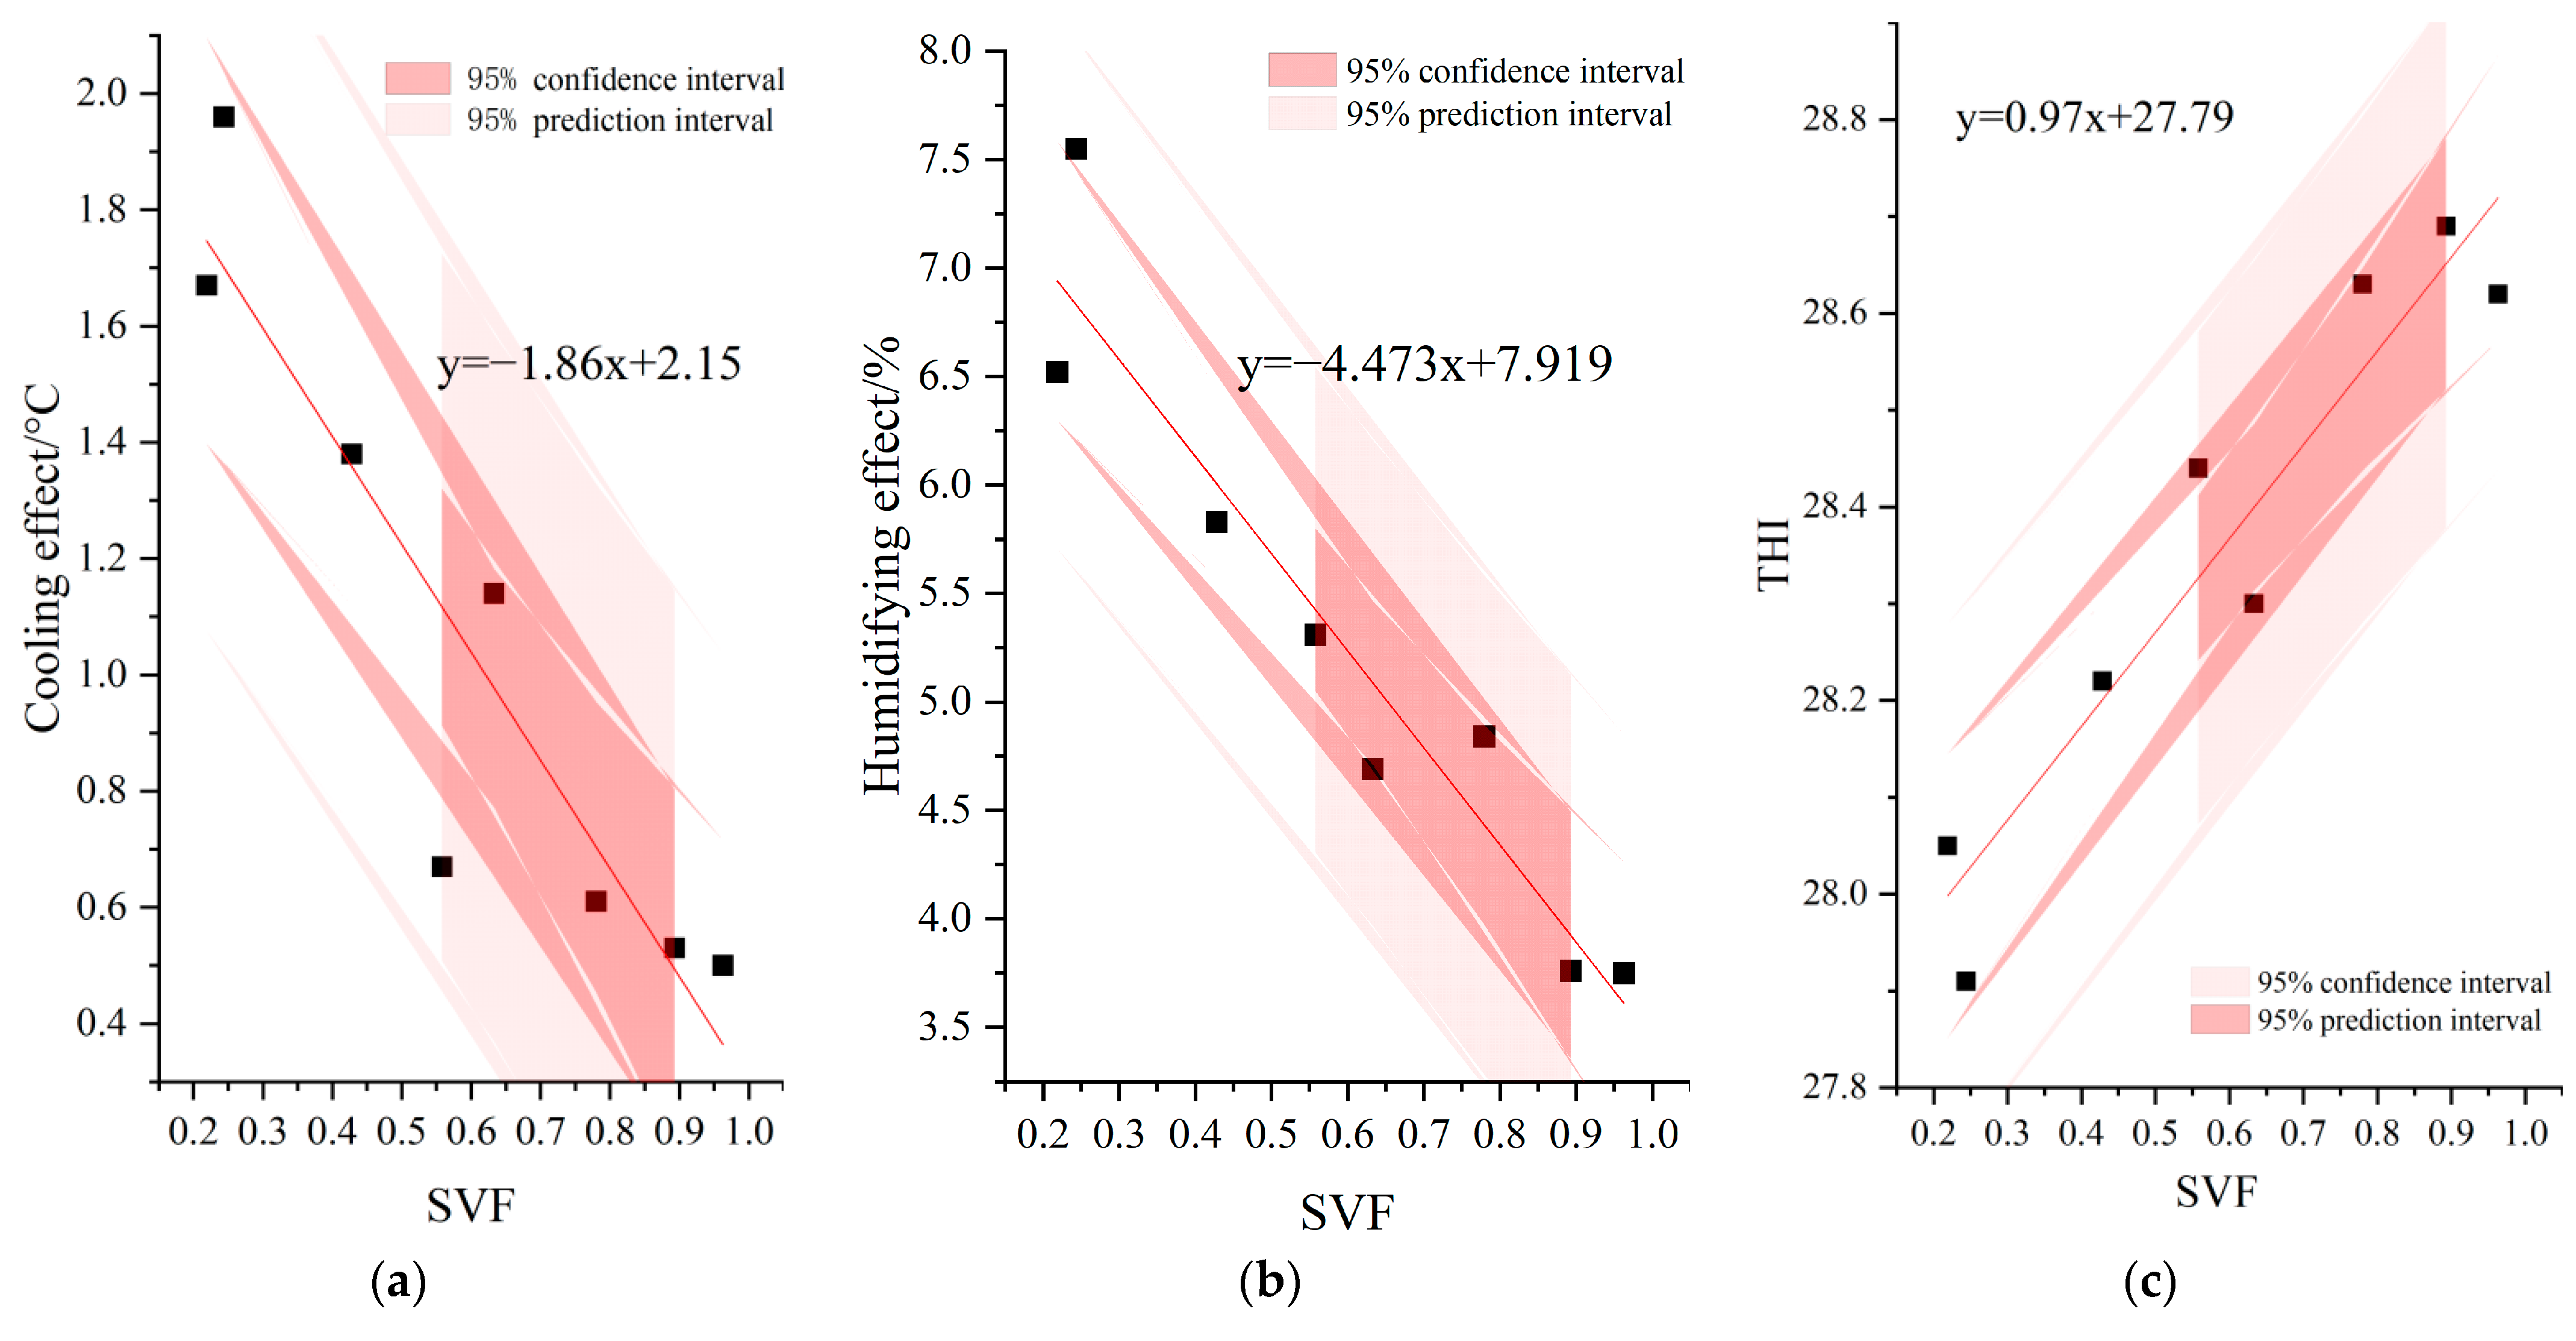
3.2. Influence of Street Tree Characteristics on Thermal Comfort
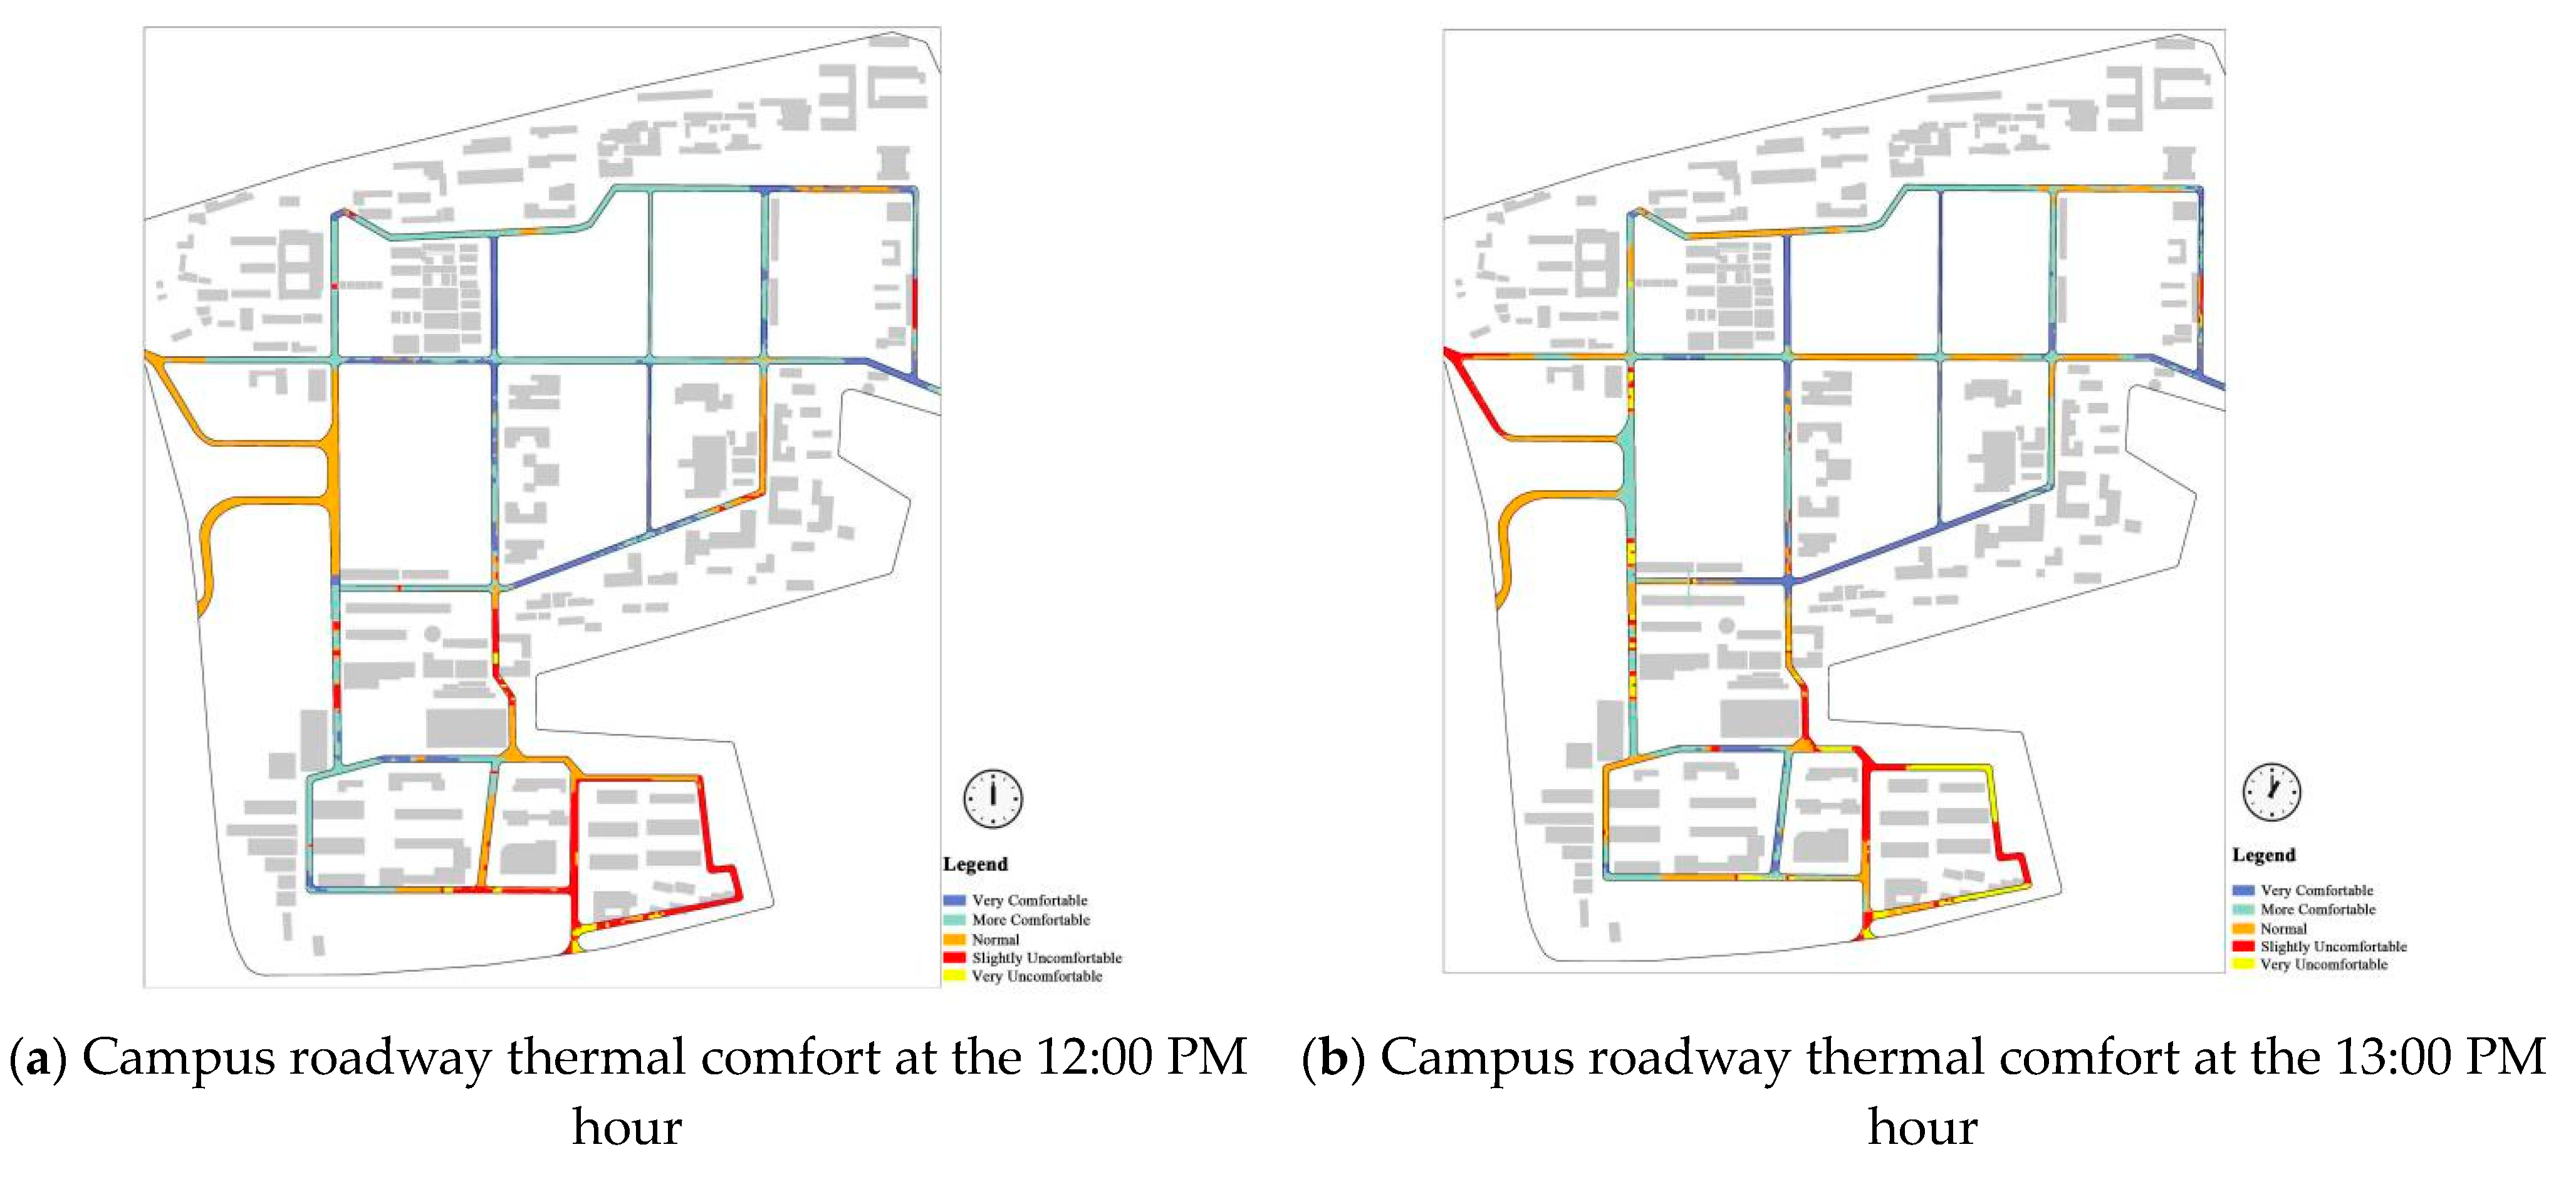
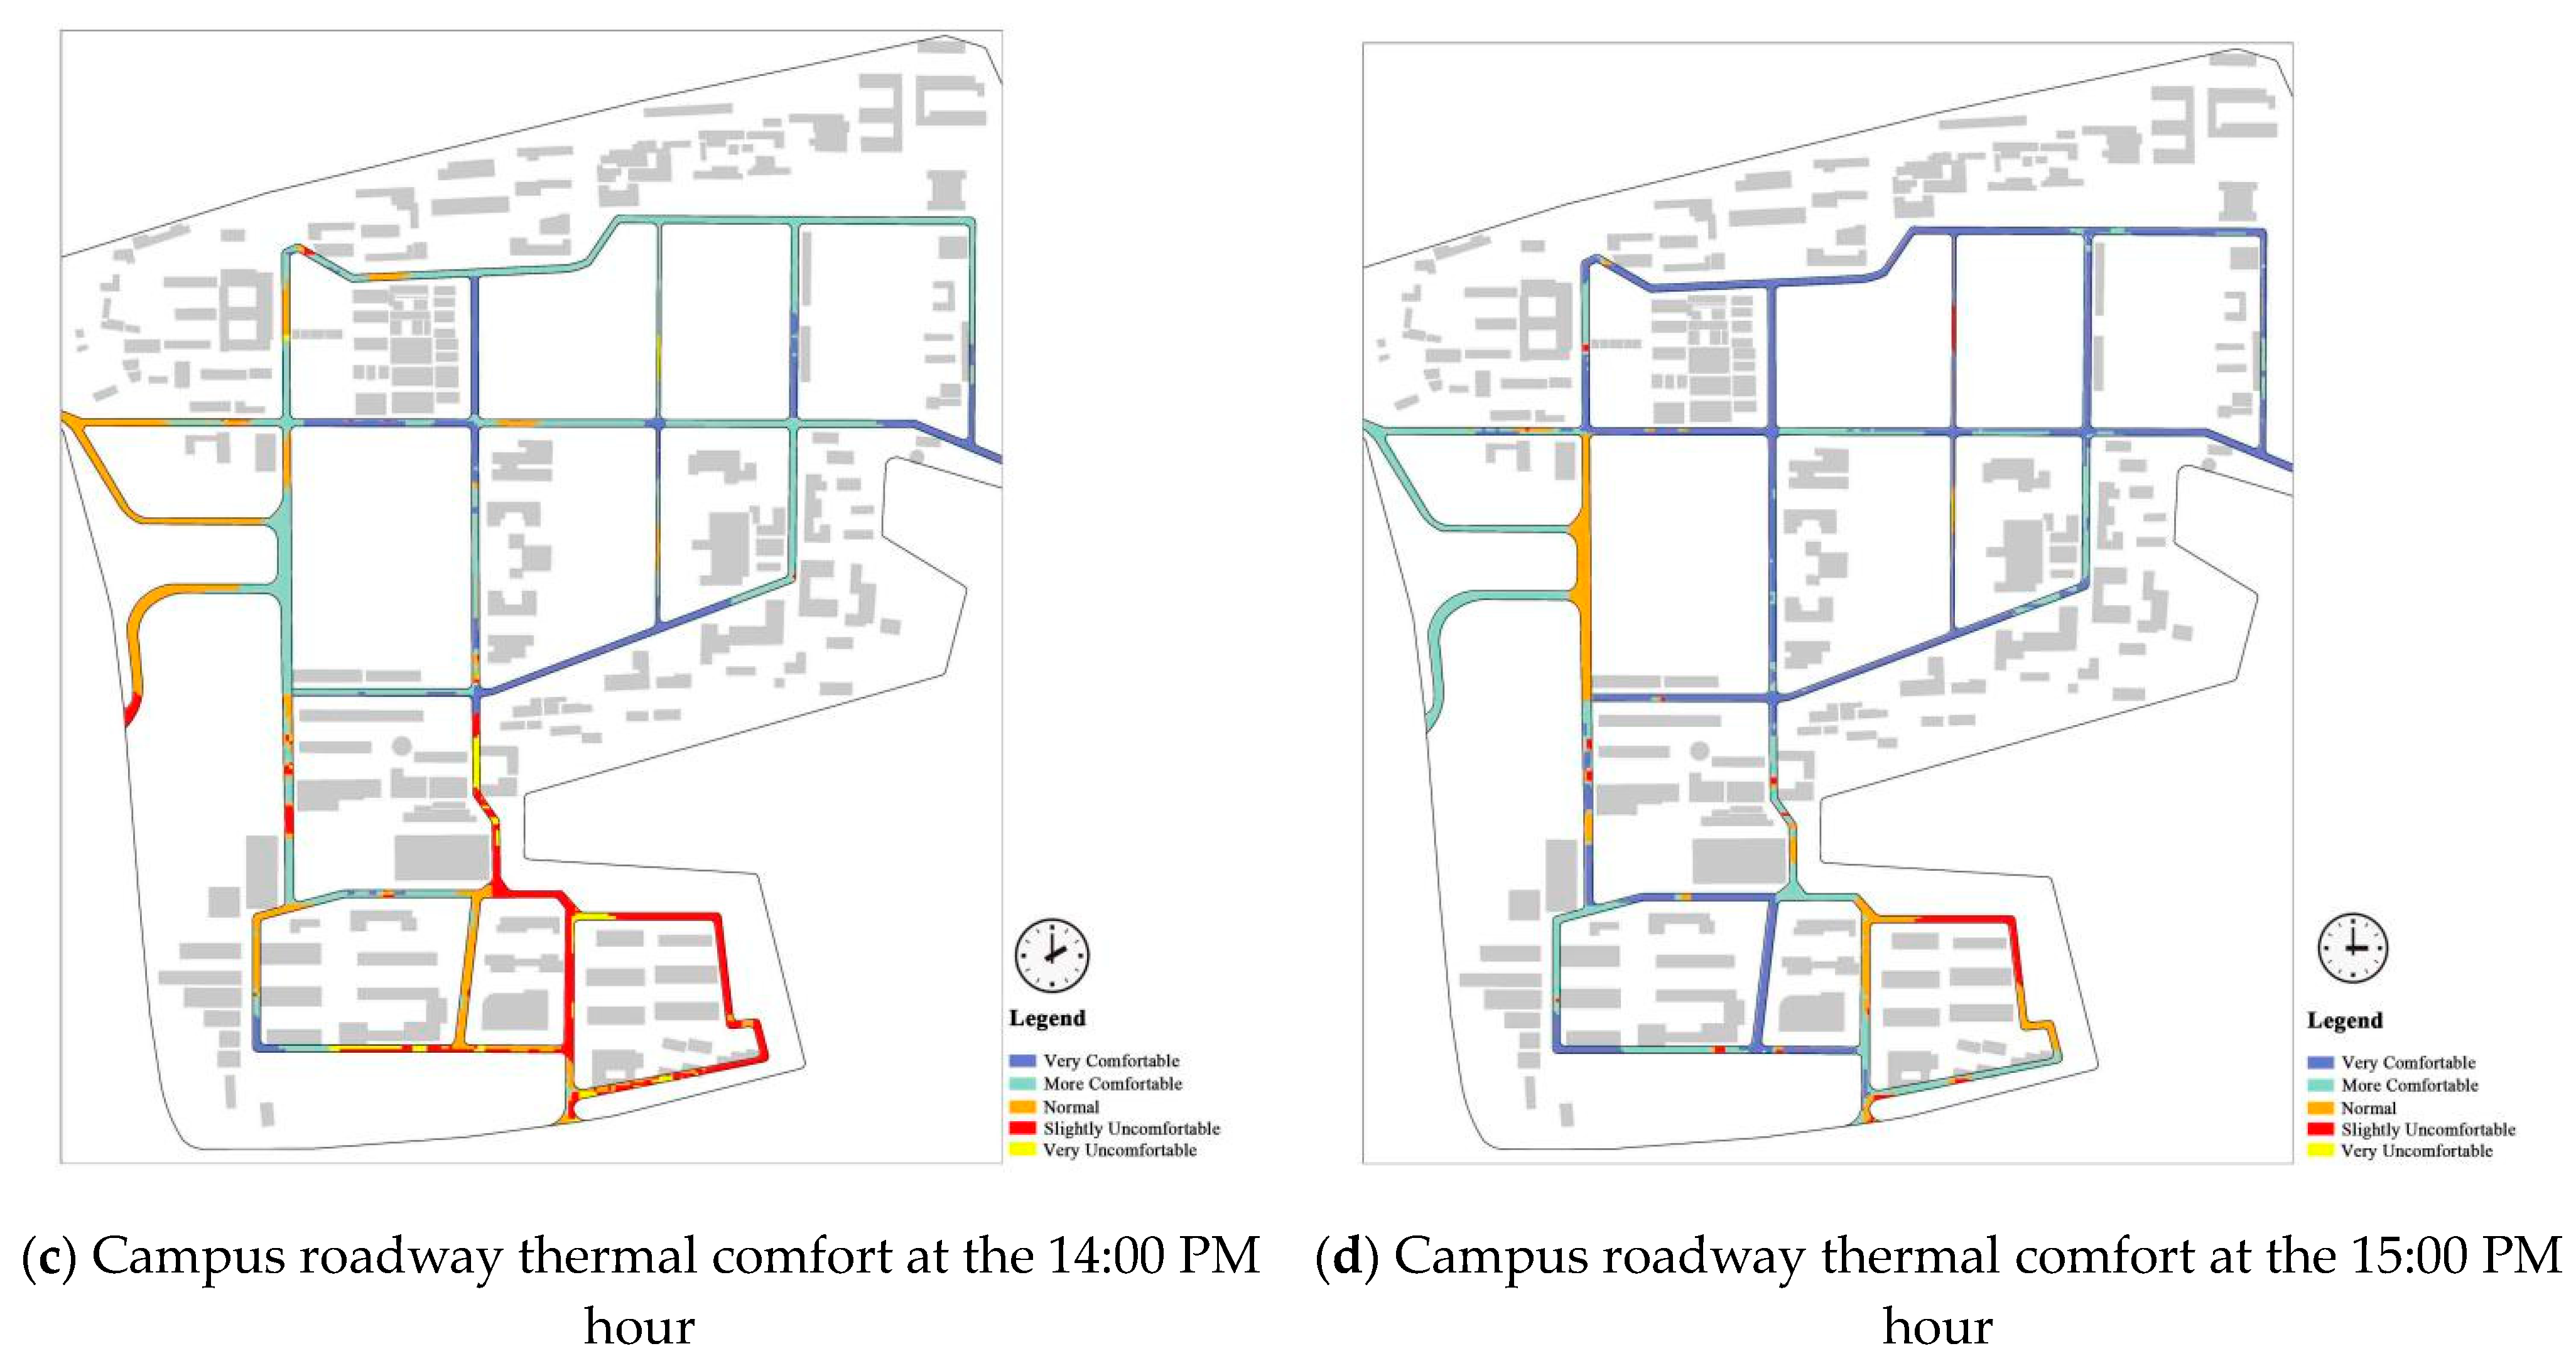
3.3. Evaluation of Campus Traveling Comfort
4. Discussion
4.1. Street Trees and Campus Road Thermal Comfort
4.2. Street Trees and Urban Planning
4.3. Campus Road Thermal Comfort Assessment
4.4. Applicability of Combining ENVI-Met with ArcGIS
5. Conclusions
Author Contributions
Funding
Institutional Review Board Statement
Informed Consent Statement
Data Availability Statement
Conflicts of Interest
References
- Bador, M.; Terray, L.; Boe, J.; Somot, S.; Dubuisson, B.J.E.R.L. Future summer mega-heatwave and record-breaking temperatures in a warmer France climate. Environ. Res. Lett. 2017, 12, 074025. [Google Scholar] [CrossRef]
- Heisler, G.M.; Brazel, A.J. The urban physical environment: Temperature and urban heat islands. Chapter 2. In Urban Ecosystem Ecology; Wiley: Hoboken, NJ, USA, 2010; Volume 55, pp. 29–56. [Google Scholar]
- Gillner, S.; Vogt, J.; Tharang, A.; Dettmann, S.; Roloff, A.J.L.; Planning, U. Role of street trees in mitigating effects of heat and drought at highly sealed urban sites. Landsc. Urban Plan. 2015, 143, 33–42. [Google Scholar] [CrossRef]
- Karimi, A.; Mohammad, P.; García-Martínez, A.; Moreno-Rangel, D.; Gachkar, D.; Gachkar, S.J.E. New developments and future challenges in reducing and controlling heat island effect in urban areas. Dev. Sustain. 2022, 25, 10485–10531. [Google Scholar] [CrossRef]
- Mohammad, P.; Aghlmand, S.; Fadaei, A.; Gachkar, S.; Karimi, A.J.U.C. Evaluating the role of the albedo of material and vegetation scenarios along the urban street canyon for improving pedestrian thermal comfort outdoors. Urban Clim. 2021, 40, 100993. [Google Scholar] [CrossRef]
- Lau, K.L.; Choi, C.Y.J.B. The influence of perceived aesthetic and acoustic quality on outdoor thermal comfort in urban environment. Build. Environ. 2021, 206, 108333. [Google Scholar] [CrossRef]
- Klemm, W.; Heusinkveld, B.G.; Lenzholzer, S.; van Hove, B.J.L. Street greenery and its physical and psychological impact on thermal comfort. Landsc. Urban Plan. 2015, 138, 87–98. [Google Scholar] [CrossRef]
- Souch, C.; Souch, C.J.J.A. The effect of trees on summertime below canopy urban climates: A case study Bloomington, Indiana. J. Arboric 1993, 19, 303–312. [Google Scholar] [CrossRef]
- Xu, M.; Hong, B.; Jiang, R. Effects of Avenue Trees on Human Outdoor Thermal Comfort during Summer on Campus. Chin. Landsc. Archit. 2020, 36, 139. [Google Scholar]
- Ma, X.; Li, C.; Chen, G.; Ba, Y.; Wang, C. Study on cooling and humidification effect of different tree species of street trees in campus. J. Inn. Mong. Agric. Univ. (Nat. Sci. Ed.) 2011, 32, 125–130. [Google Scholar]
- Karimi, A.; Bayat, A.; Mohammadzadeh, N.; Mohajerani, M.; Yeganeh, M.J.B. Microclimatic analysis of outdoor thermal comfort of high-rise buildings with different configurations in Tehran: Insights from field surveys and thermal comfort indices. Build. Environ. 2023, 240, 110445. [Google Scholar] [CrossRef]
- Dokhanian, F.; Mohajerani, M.; Estaji, H.; Nikravan, M. Shading design optimization in a semi-arid region: Considering energy consumption, greenhouse gas emissions, and cost. J. Clean. Prod. 2023, 428, 139293. [Google Scholar] [CrossRef]
- Karimi, A.; Mohammad, P. Effect of outdoor thermal comfort condition on visit of tourists in historical urban plazas of Sevilla and Madrid. Environ. Sci. Pollut. Res. 2022, 29, 60641–60661. [Google Scholar] [CrossRef]
- Wei, W.; Meixia, S.; Suming, G. Research Progress and Prospects of Outdoor Microclimate in Chinese Cities Based on Bibliometrics and Content Analysis. Landsc. Archit. Acad. J. 2023, 40, 92–98. [Google Scholar]
- Chen, L.; Wen, Y.; Zhang, L.; Xiang, W.-N. Studies of thermal comfort and space use in an urban park square in cool and cold seasons in Shanghai. Build. Environ. 2015, 94, 644–653. [Google Scholar] [CrossRef]
- Lin, T.-P.; Tsai, K.-T.; Liao, C.-C.; Huang, Y.-C. Effects of thermal comfort and adaptation on park attendance regarding different shading levels and activity types. Build. Environ. 2013, 59, 599–611. [Google Scholar] [CrossRef]
- Zhifeng, W.; Liding, C. Thermal comfort assessment and urban thermal environment research: Review and prospective. Chin. J. Ecol. 2016, 35, 8. [Google Scholar]
- Zhang, Y.; Chen, H.; Wang, J.; Meng, Q. Thermal comfort of people in the hot and humid area of China—Impacts of season, climate, and thermal history. Indoor Air 2016, 26, 820–830. [Google Scholar] [CrossRef]
- Gagge, A.P.; Fobelets, A.; Berglund, L. A standard predictive index of human response to the thermal environment. Ashrae. Trans. 1986, 92, 709–731. [Google Scholar]
- Bröde, P.; Fiala, D.; Błażejczyk, K.; Holmér, I.; Jendritzky, G.; Kampmann, B.; Tinz, B.; Havenith, G. Deriving the operational procedure for the Universal Thermal Climate Index (UTCI). Int. J. Biometeorol. 2012, 56, 481–494. [Google Scholar] [CrossRef] [PubMed]
- Nikolopoulou, M.; Lykoudis, S.J.B. Use of outdoor spaces and microclimate in a Mediterranean urban area. Build. Environ. 2007, 42, 3691–3707. [Google Scholar] [CrossRef]
- Fiala, D.; Lomas, K.J.; Stohrer, M. Computer prediction of human thermoregulatory and temperature responses to a wide range of environmental conditions. Int. J. Biometeorol. 2001, 45, 143–159. [Google Scholar] [CrossRef]
- Sanusi, R.; Johnstone, D.; May, P.; Livesley, S.J.J.L.; Planning, U. Microclimate benefits that different street tree species provide to sidewalk pedestrians relate to differences in Plant Area Index. Landsc. Urban Plan. 2017, 157, 502–511. [Google Scholar] [CrossRef]
- Fanger, P.O.; Comfort, T. Analysis and applications in environmental engineering. Therm. Comfort. Anal. Appl. Environ. Eng. 1970. [Google Scholar]
- Yan, H.; Liu, Q.; Zhao, W.; Pang, C.; Dong, M.; Zhang, H.; Gao, J.; Wang, H.; Hu, B.; Yang, L.J.B.; et al. The coupled effect of temperature, humidity, and air movement on human thermal response in hot–humid and hot–arid climates in summer in China. Build. Environ. 2020, 177, 106898. [Google Scholar] [CrossRef]
- Sumunar, D.R.S.; Hadi, B.S.; Sariyono, K.E.; Arif, N. Analysis of thermal comfort of settlements based on urban humidity index in Yogyakarta City. In Proceedings of the IOP Conference Series: Earth and Environmental Science, Online, 8 December 2023; p. 012025. [Google Scholar]
- Yi, H.; Wang, G.; Yang, W.; Chen, S.; Tan, G. Evaluation of Human Comfort in Outdoor Garden Space in the Old City of Guangzhou in Summer. Chin. J. Trop. Agric. 2020, 40, 6. [Google Scholar]
- Wu, Z.; Kong, F.; Wang, Y.; Sun, R.; Chen, L. The impact of greenspace on thermal comfort in a residential quarter of Beijing, China. Int. J. Environ. Res. Public Health 2016, 13, 1217. [Google Scholar] [CrossRef]
- Oliveira, S.; Andrade, H.; Vaz, T. The cooling effect of green spaces as a contribution to the mitigation of urban heat: A case study in Lisbon. Build. Environ. 2011, 46, 2186–2194. [Google Scholar] [CrossRef]
- Goldberg, M.S.; Gasparrini, A.; Armstrong, B.; Valois, M.-F. The short-term influence of temperature on daily mortality in the temperate climate of Montreal, Canada. Environ. Res. 2011, 111, 853–860. [Google Scholar] [CrossRef]
- Xu, M.; Hong, B.; Mi, J.; Yan, S. Outdoor thermal comfort in an urban park during winter in cold regions of China. Sustain. Cities Soc. 2018, 43, 208–220. [Google Scholar] [CrossRef]
- Lai, D.; Guo, D.; Hou, Y.; Lin, C.; Chen, Q. Studies of outdoor thermal comfort in northern China. Build. Environ. 2014, 77, 110–118. [Google Scholar] [CrossRef]
- Shooshtarian, S.; Ridley, I. The effect of physical and psychological environments on the users thermal perceptions of educational urban precincts. Build. Environ. 2017, 115, 182–198. [Google Scholar] [CrossRef]
- Meng, H.; Xiu, Y.; Yu, S.; Liu, M.; Zhou, Z. Research on Thermal Comfort of Outdoor Environment in Jinan Elderly Care Institutions in Winter Based on ENVI-met—Taking Jinan Zhonghai Jinnian Fuju Health Center as an Example. J. Green Sci. Technol. 2022, 24, 8–14. [Google Scholar]
- Lu, J.; Li, Q.; Zeng, L.; Chen, J.; Liu, G.; Li, Y.; Li, W.; Huang, K. A micro-climatic study on cooling effect of an urban park in a hot and humid climate. Sustain. Cities Soc. 2017, 32, 513–522. [Google Scholar] [CrossRef]
- Nazarian, N.; Fan, J.; Sin, T.; Norford, L.; Kleissl, J. Predicting outdoor thermal comfort in urban environments: A 3D numerical model for standard effective temperature. Urban Clim. 2017, 20, 251–267. [Google Scholar] [CrossRef]
- Antoniadis, D.; Katsoulas, N.; Tsirogiannis, I.; Kittas, C. Effects of planting and structural configurations on human thermal comfort in a schoolyard. In Proceedings of the VI International Conference on Landscape and Urban Horticulture 1189, Athens, Greece, 20–25 June 2016; pp. 229–234. [Google Scholar]
- Hongjian, T.; Rongshuo, C. New Characteristics of Heat Extremes in Fuzhou Since 2000 and the Possible Causes. Chin. J. Atmos. Sci. 2015, 39, 12. [Google Scholar]
- Huiming, Y.; Xiuhua, Y.; Xiaoling, C.; Yantao, W.; Dongjin, H. Integrated Evaluation and Selection of Street tree Species in Fuzhou City. J. Chin. Urban For. 2009, 7, 15–17. [Google Scholar]
- Emmanuel, R.; Loconsole, A. Green infrastructure as an adaptation approach to tackling urban overheating in the Glasgow Clyde Valley Region, UK. Landsc. Urban Plan. 2015, 138, 71–86. [Google Scholar] [CrossRef]
- Ebrahimabadi, S.; Johansson, C.; Rizzo, A.; Nilsson, K. Microclimate assessment method for urban design—A case study in subarctic climate. 2018, 23, 116–131. Urban Des. Int. 2018, 23, 116–131. [Google Scholar] [CrossRef]
- Oke, T.R. The urban energy balance. Prog. Phys. Geogr. 1988, 12, 471–508. [Google Scholar] [CrossRef]
- Xi, T.; Li, Q.; Mochida, A.; Meng, Q. Study on the outdoor thermal environment and thermal comfort around campus clusters in subtropical urban areas. Build. Environ. 2012, 52, 162–170. [Google Scholar] [CrossRef]
- Du, Y.; Mak, C.M.; Kwok, K.; Tse, K.T.; Lee, T.C.; Ai, Z.; Liu, J.; Niu, J. New criteria for assessing low wind environment at pedestrian level in Hong Kong. Build. Environ. 2017, 123, 23–36. [Google Scholar] [CrossRef]
- Ayyad, Y.; Sharples, S. Envi-MET validation and sensitivity analysis using field measurements in a hot arid climate. In Proceedings of the IOP Conference Series: Earth and Environmental Science, Cardiff, Wales, 24–25 September 2019; p. 012040. [Google Scholar]
- Bande, L.; Afshari, A.; Al Masri, D.; Jha, M.; Norford, L.; Tsoupos, A.; Marpu, P.; Pasha, Y.; Armstrong, P.J.S. Validation of UWG and ENVI-met models in an Abu Dhabi District, based on site measurements. Sustainability 2019, 11, 4378. [Google Scholar] [CrossRef]
- Song, D.; Zhang, X.; Zhou, X.; Shi, X.; Jin, X. Influences of wind direction on the cooling effects of mountain vegetation in urban area. Build. Environ. 2022, 209, 108663. [Google Scholar] [CrossRef]
- Chow, W.T.; Pope, R.L.; Martin, C.A.; Brazel, A.J. Observing and modeling the nocturnal park cool island of an arid city: Horizontal and vertical impacts. Theor. Appl. Climatol. 2011, 103, 197–211. [Google Scholar] [CrossRef]
- Guo, Y.; Wang, A. Study on the Regulation Effect of Spatial Characteristics of Urban Square on Microclimate in the Transitional Season in Semi-arid Area. Chin. Landsc. Archit. 2021, 37, 6. [Google Scholar]
- Du, J.; Zhu, J.; Jie, J.; Ma, Z. An overview of urban land use research based on GIS. Overv. Urban Land Use Res. Based GIS 2018, 30, 9. [Google Scholar]
- Chi, Z.; Ning, Z. Study on Land Use and lts Driving Forces in Changshu City. J. Hebei Agric. Sci. 2008, 4, 79–82. [Google Scholar]
- Shi, Y.; Ren, C.; Zheng, Y.; Ng, E. Mapping the urban microclimatic spatial distribution in a sub-tropical high-density urban environment. Archit. Sci. Rev. 2016, 59, 370–384. [Google Scholar] [CrossRef]
- Bao, J.; Xu, L.; Shi, Y.; Ma, Q.; Lu, Z. The Influence of Street Morphology on Thermal Environment Based on ENVI-met Simulation: A Case Study of Hangzhou Core Area, China. ISPRS Int. J. Geo-Inf. 2023, 12, 303. [Google Scholar] [CrossRef]
- Chatzinikolaou, E.; Chalkias, C.; Dimopoulou, E. Urban microclimate improvement using ENVI-MET climate model. Int. Arch. Photogramm. Remote Sens. Spat. Inf. Sci. 2018, 42, 69–76. [Google Scholar] [CrossRef]
- Hien, W.N.; Ignatius, M.; Eliza, A.; Jusuf, S.K.; Samsudin, R. Comparison of STEVE and ENVI-met as temperature prediction models for Singapore context. Int. J. Sustain. Build. Technol. Urban Dev. 2012, 3, 197–209. [Google Scholar] [CrossRef]
- Meng, Q.; Wang, P.; Li, Q. Evaluation Methods of Urban Thermal Environment. Chin. Landsc. Archit. 2014, 30, 13–16. [Google Scholar]
- Xue, S.; Xiao, Y.; Wang, K. The Effects of Landscape Element Configuration on Garden Thermal Environment in Hot and Humid Regions. Chin. Landsc. Archit. 2018, 34, 29–33. [Google Scholar]
- Wu, S.; Dong, L.; Fan, S. Effect of land cover types on lowering air temperature and increasing humidity and human comfort level. J. Fujian Agric. For. Univ. (Nat. Sci. Ed.) 2020, 49, 533–539. [Google Scholar]
- Li, Y.; Song, Y. Optimization of Vegetation Arrangement to Improve Microclimate and Thermal Comfort in an Urban Park. Int. Rev. Spat. Plan. Sustain. Dev. 2019, 7, 18–30. [Google Scholar] [CrossRef] [PubMed]
- Zhenwei, L.; Li, L.; Jie, M.; Wenfeng, H. Study on the ecological effects of different afforestation tree species in the campus. J. Anhui Agric. Sci. 2005, 33, 822–823. [Google Scholar]
- Dimoudi, A.; Nikolopoulou, M. Vegetation in the urban environment: Microclimatic analysis and benefits. Energy Build. 2003, 35, 69–76. [Google Scholar] [CrossRef]
- Shashua-Bar, L.; Tsiros, I.X.; Hoffman, M.E. A modeling study for evaluating passive cooling scenarios in urban streets with trees. Case study: Athens, Greece. Build. Environ. 2010, 45, 2798–2807. [Google Scholar] [CrossRef]
- Jendritzky, G.; de Dear, R.; Havenith, G. UTCI—Why another thermal index? Int. J. Biometeorol. 2012, 56, 421–428. [Google Scholar] [CrossRef]
- Matzarakis, A.; Rutz, F.; Mayer, H. Modelling radiation fluxes in simple and complex environments—Application of the RayMan model. Int. J. Biometeorol. 2007, 51, 323–334. [Google Scholar] [CrossRef]
- Zheng, Z. Study on Road Greening Structure and Improving Microclimate Function in Harbin. Master’s Thesis, Northeast Forestry University, Harbin, China, 2007. [Google Scholar]
- Yan, S. To Estimate the Microclimate Effect of Green Space on Campus of Anhui Agricultural University Based on ENVI-Met Simulation. Master’s Thesis, Anhui Agricultural University, Hefei, China, 2023. [Google Scholar]
- Xiong, C. Study on the Impact of Green Space on Microclimate Based on ENVI-Met; Shanghai Institute of Technology: Shanghai, China, 2021. [Google Scholar]
- Thorsson, S.; Honjo, T.; Lindberg, F.; Eliasson, I.; Lim, E.-M. Thermal comfort and outdoor activity in Japanese urban public places. Environ. Behav. 2007, 39, 660–684. [Google Scholar] [CrossRef]
- Chen, J.; Rong, L.; Gao, Y.; Qian, D.; Ma, A.; Huang, Z.; Wu, B. Temperature and Humidity Effects of Different Shaditng Environments and Their Effects on Human Comfort. J. Northwest For. Univ. 2022, 3, 254–260. [Google Scholar]
- Lin, T.-P.; Matzarakis, A.; Hwang, R.-L. Shading effect on long-term outdoor thermal comfort. Build. Environ. 2010, 45, 213–221. [Google Scholar] [CrossRef]
- Afsharzadeh, M.; Khorasanizadeh, M.; Norouzian-Maleki, S.; Karimi, A. Identifying and prioritizing the design attributes to improve the use of Besat Park of Tehran, Iran. Int. J. Archit. Eng. Urban Plan. 2021, 31, 1–24. [Google Scholar]
- Lau, K.L.; Tan, Z.; Morakinyo, T.E.; Ren, C. Effect of Tree Species on Outdoor Thermal Comfort. In Outdoor Thermal Comfort in Urban Environment; Springer: Berlin/Heidelberg, Germany, 2022; pp. 101–123. [Google Scholar]
- Mahdavi Estalkhsari, B.; Mohammad, P.; Karimi, A. Land use and land cover change dynamics and modeling future urban growth using cellular automata model over isfahan metropolitan area of Iran. In Ecological Footprints of Climate Change: Adaptive Approaches and Sustainability; Springer: Berlin/Heidelberg, Germany, 2023; pp. 495–516. [Google Scholar]
| Parameter Name | Parameter Name | Parameter Values |
|---|---|---|
| Grid Settings | Model dimensions /Size of grid cell in meter | 260 × 314 × 30/4 × 4 × 3 |
| Model Location | Base settings | Fujian Agriculture and Forestry University. (26.08° N, 119.23° E) |
| Microscale roughness length of surface (m) | 0.01 | |
| Time and date | Start date | 21 June 2022 |
| Start time | 5:00 am | |
| Total simulation time | 14 | |
| Meteorological data | Specific humidity in 2500 m (g/kg) | 7 |
| Wind direction | 135 degrees (south-east) | |
| windspeed (m/s) | 2.5 | |
| temperature range | 17–28 | |
| Soil Section | Upper layer (0–20 cm) | 65 °C/50%RH |
| Middle layer (20–50 cm) | 70 °C/50%RH | |
| Deep layer (50–200 cm) | 75 °C/50%RH |
| Accuracy Value | Temperature/°C | Humidity/% | Wind Speed/m/s |
|---|---|---|---|
| RSME | 0.87 | 1.01 | 0.05 |
| MAE | 0.82 | 0.82 | 0.44 |
| MAPE | 2.58 | 1.18 | 9.22 |
| Plant Models | Code | MA | Plant Models | Code | SH |
|---|---|---|---|---|---|
 | Name | Michelia × alba |  | Name | Syzygium hainanense |
| Plant height/m | 15 | Plant height/m | 9 | ||
| Crown width/m | 6 | Crown width/m | 6 | ||
| Height below branch/m | 6 | Height below branch/m | 3 | ||
| Plant models | Code | AP | Plant models | Code | MG |
 | Name | Amygdalus persica | 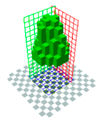 | Name | Magnolia grandiflora |
| Plant height/m | 3 | Plant height/m | 15 | ||
| Crown width/m | 4 | Crown width/m | 7 | ||
| Height below branch/m | 0.8 | Height below branch/m | 3 | ||
| Plant models | Code | FF | Plant models | Code | LC |
 | Name | Falcataria falcata | 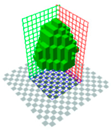 | Name | Litchi chinensis |
| Plant height/m | 20 | Plant height/m | 16 | ||
| Crown width/m | 15 | Crown width/m | 8 | ||
| Height below branch/m | 10 | Height below branch/m | 6 | ||
| Plant models | Code | MI | Plant models | Code | BP |
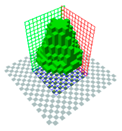 | Name | Mangifera indica |  | Name | Bauhinia purpurea |
| Plant height/m | 16 | Plant height/m | 10 | ||
| Crown width/m | 9 | Crown width/m | 5 | ||
| Height below branch/m | 6 | Height below branch/m | 4 |
| Equations | Formulas | Definition | Symbols and Their Meanings | Reference |
|---|---|---|---|---|
| 1 | ΔT = t0 − t | Cooling effect | ΔT denotes the temperature drop; t0 denotes the control temperature; t denotes the measurement point temperature. | [58] |
| 2 | ΔH = h − h0 | Humidifying strength | ΔH denotes incremental humidity; h0 denotes control group degree; h denotes measurement point humidity. | [49] |
| 3 | Evaluation of human comfort in different meteorological conditions | THI refers to temperature and humidity number, t is the average temperature, and f is the relative humidity. | [59] |
| THI Value Range | Thermal Comfort Assessment |
|---|---|
| <21.1 | Comfortable |
| 21.1–23.8 | Comparatively comfortable |
| 23.9–26.6 | Normal |
| 26.7–29.4 | Less comfortable |
| ≥29.5 | Uncomfortable |
Disclaimer/Publisher’s Note: The statements, opinions and data contained in all publications are solely those of the individual author(s) and contributor(s) and not of MDPI and/or the editor(s). MDPI and/or the editor(s) disclaim responsibility for any injury to people or property resulting from any ideas, methods, instructions or products referred to in the content. |
© 2024 by the authors. Licensee MDPI, Basel, Switzerland. This article is an open access article distributed under the terms and conditions of the Creative Commons Attribution (CC BY) license (https://creativecommons.org/licenses/by/4.0/).
Share and Cite
Zheng, G.; Xu, H.; Liu, F.; Lin, X.; Wang, S.; Dong, J. Study Roadmap Selection Based on the Thermal Comfort of Street Trees in Summer: A Case Study from a University Campus in China. Sustainability 2024, 16, 4407. https://doi.org/10.3390/su16114407
Zheng G, Xu H, Liu F, Lin X, Wang S, Dong J. Study Roadmap Selection Based on the Thermal Comfort of Street Trees in Summer: A Case Study from a University Campus in China. Sustainability. 2024; 16(11):4407. https://doi.org/10.3390/su16114407
Chicago/Turabian StyleZheng, Guorui, Han Xu, Fan Liu, Xinya Lin, Suntian Wang, and Jianwen Dong. 2024. "Study Roadmap Selection Based on the Thermal Comfort of Street Trees in Summer: A Case Study from a University Campus in China" Sustainability 16, no. 11: 4407. https://doi.org/10.3390/su16114407
APA StyleZheng, G., Xu, H., Liu, F., Lin, X., Wang, S., & Dong, J. (2024). Study Roadmap Selection Based on the Thermal Comfort of Street Trees in Summer: A Case Study from a University Campus in China. Sustainability, 16(11), 4407. https://doi.org/10.3390/su16114407