Article

Fully Integrated Hybrid Solid Oxide Fuel Cell–Rankine Cycle System with Carbon Capture, Utilisation, and Storage for Sustainable Combined Heat and Power Production

Faculty of Chemistry and Chemical Engineering, University of Maribor, Smetanova 17, 2000 Maribor, Slovenia
*
Author to whom correspondence should be addressed.
Sustainability 2024, 16(11), 4389; https://doi.org/10.3390/su16114389
Submission received: 25 April 2024 / Revised: 16 May 2024 / Accepted: 20 May 2024 / Published: 22 May 2024
(This article belongs to the Special Issue Energy Storage and Sustainable Power Supply)

Abstract

:
The imperative to combat climate change necessitates the rapid implementation of technologically advanced, zero-emission renewable energy solutions, particularly considering the mounting energy demands and the pressing need to mitigate global warming. The proposed SOFC system, integrated with a modified Rankine Cycle and CCUS technology, offers a highly efficient, renewable system with a net-zero carbon footprint, utilising green biogas as an alternative. The fully integrated system at continuous operation does not require outside heat sources and, besides, its main electricity production can supply 231 households with hot sanitary water. A base case and sensitivity analysis of the system was conducted studying different operating parameters. The base case simulation, conducted at SOFC/reformer operating temperatures of 850 °C/650 °C and operating parameters S/C = 2.5, Uf = 0.70 Ua = 0.1806, yielded an overall efficiency of 71.64%, with a 67.70% electrical efficiency. Further simulations demonstrated that a 1.60% and 1.53% increase in the overall and electrical efficiencies of the proposed alternative, respectively, would be achieved at SOFC/reformer operating temperatures of 950 °C/650 °C. The simulated hybrid system represents a competitive installation in the renewable energy market, which offers a viable and sustainable alternative to traditional forms of energy generation.

1. Introduction

Fossil fuels have played a significant role in shaping modern civilisation and powering its progress. They are indispensable in meeting the world’s growing energy demands [1]. It is estimated that they provided over 80% of the total energy supply in 2022 [2]. In recent decades, the increase in emissions, primarily carbon dioxide (CO2), along with additional greenhouse gases (GHGs) such as methane (CH4), nitrous oxide (N2O), and chlorofluorocarbons (CFCs) has been identified as a leading cause of global warming and climate change. This poses a threat to the sustainability of the ecosystem [3]. A report by the Joint Research Centre (JRC) states that around 90% of the world’s CO2 emissions are caused by the combustion of fossil fuels [4]. Considering the pressing necessity to reduce carbon dioxide emissions and address the environmental consequences of global climate change, policymakers are currently confronted with a dual challenge. In addition to this, they must also consider the potential impact of lower emission targets on the oil market [5]. The apparent trade-off between economic growth and CO2 emissions is at the heart of these issues. Improving environmental outcomes can sometimes come at the expense of economic growth [6]. While fossil fuels play a significant role in global energy generation, renewable energy is essential for decarbonising the economy, addressing climate change, and achieving global carbon neutrality [7,8]. As a result, economies have ratified the Paris Climate Agreement and Kyoto Protocol [6], both of which aim to reduce greenhouse gas emissions [4].
Carbon capture, utilisation, and storage (CCUS) represents a viable strategy for the decarbonisation of fossil-based power and industrial sectors. It has been identified as the most effective method for reducing CO2 emissions [9]. By the year 2050, it is projected that CCUS will contribute 10% to the cumulative global emission reduction [10], as well as a means of facilitating a long-term transition to a zero-emission future [9] within this century [11]. To achieve this, renewable energy solutions also need to be implemented, while also considering energy diversification. To enable that, various studies are conducted on alternative fuels, like biogas, biochar, biodiesel, and hydrogen [12], and other various biomass-derived synthetic fuels [13]. Efficient heat production and heat management for heating systems is also of great importance [14,15].
Global research has focused on utilising renewable energy sources and improving energy efficiency [16], hydrogen being of particular interest. Hydrogen is a fuel with a high energy density that is clean and has a calorific value 2.7 times greater than that of fossil fuels, such as natural gas and gasoline. Furthermore, it produces almost zero pollution [17]. Fuel cells have emerged as an alternative to internal combustion engines in recent years due to their high efficiency, fuel flexibility, and reliable, clean energy [16]. They are considered an alternative energy source due to their advantages [18], which include low emissions compared to fossil fuels [16,18,19]. There is a variety of fuel cell types, namely Polymer Electrolyte Membrane Fuel Cells (PEMFCs), Molten Carbonate Fuel Cells (MCFCs), Direct Methanol Fuel Cells (DMFCs), Alkaline Fuel Cells (AFCs), Phosphoric Acid Fuel Cells (PAFCs), and Solid Oxide Fuel Cells (SOFCs) [20]. They can be classified as either low-temperature or high-temperature fuel cells, with SOFCs belonging to the latter [21,22].
SOFCs are one of the most promising power generation technologies for high energy conversion efficiency, while also being strongly adaptive to various carbon-containing fuels, which provides the potential for integration with biomass gasification [23], and further improves the adaptability of SOFCs in multi-generation systems [20]. They utilise hydrogen or hydrogen carriers such as biogas, natural gas, e-fuels or e-fuel, and ammonia [24,25,26,27] as a fuel. Among the zero-carbon fuels, ammonia is also considered a potential SOFC fuel. It has the potential of being produced through green routes, i.e., from hydrogen via electrolysis using electricity from renewable sources [24]. Other advantages, besides fuel flexibility, include the low greenhouse gas emissions, no moving parts, and good part-load performance [28]. While SOFCs come with a variety of advantages, the disadvantages should also be considered. A high operating start-up temperature and chemical and mechanical problems need to be taken into consideration when designing SOFCs [29]. To achieve a commercial breakthrough, it is also necessary to address the challenge of their durability and stability [30].
Another problem that SOFCs tackle is the balancing of high energy demand in times of power shortages. This trend is seen in recent years, due to the rapid adoption of wind and solar power generation capacities, causing unpredictable supply and demand [31]. This trend is set to continue and even accelerate in line with climate change objectives, when more renewables are adopted [32]. Even if solar energy is considered as an effective solution for transition to renewable energy, due to its carbon-neutral characteristics, the operational down-time between power generation constraints large-scale application. To overcome these challenges and to ensure the sustainability of future energy systems, energy storage and production technologies are needed to balance the supply and demand [23]. Because of renewable energy adoption, conventional coal and nuclear power plants are harder to adapt to sudden supply and demand changes. Considering the mentioned problems, fuel cells play a crucial role in supplying energy during times of peak energy demands.
SOFCs can reach total electric efficiencies up to 45–60% [19,33,34,35,36], while high-efficiency SOFC hybrid systems can be even higher [20,37,38,39]. The overall heat and electric efficiency of those combined heat and power (CHP) systems can reach 90–95% [18,28,40]. These high efficiencies are due to the high operating temperature of the SOFC, which allows for the recovery of exhaust heat using various technologies. A study using a double-effect absorption refrigeration cycle and multi-effect distillation with thermal vapor compression unit technologies to recover exhaust heat from the SOFC-GT system was carried out and found the electrical efficiencies can be raised up to 65.77% [39]. In a former study, the overall efficiency of a fuel cell system was successfully raised by pairing it with a high-temperature heat pump, where the exhaust heat was used as a preheating method of water [41]. Recent studies also tried different alternatives to couple a SOFC with a classic or organic Rankine cycle [42,43,44,45]. The Rankine cycle (RC) is an important technical method for recovering waste heat and improving energy efficiency [46].
The objective of this study is to simulate a SOFC-RC-CCUS hybrid system that utilises biogas whose flowrate is approximated from the operating data of a real biogas plant. For this purpose, computer simulations using Aspen Plus V12.1 software were conducted. The system aims to assess the feasibility of fully utilising generated waste heat of high SOFC operating temperatures, enabling utilisation of hot exhaust gases for additional power production [35] in a modified RC, while also fully integrating the process. After heat utilisation, vacuum swing adsorption is used to capture CO2 from exhaust gases, which is then compressed, liquefied, and stored, while the generated heat from this process is used to generate sanitary hot water. Carbon capture contributes to sustainability of the system, which also comes directly from the choice of sustainable biogas as a fuel [47]. The fuel has an advantage over the fossil fuel-powered SOFCs. Although fossil fuels have a negative impact on the environment due to their carbon emissions, their use in SOFCs can reduce emissions [41], as fuel cells are more efficient in producing electricity compared to conventional power generation methods [35]. SOFCs produce less SOx and CO2 emissions compared to traditional combustion methods, while SOFC plants have higher efficiency and lower emissions compared to other fossil-fuelled energy systems [19].
The use of biogas as an alternative has great advantages, since coupling with CC means that the process could even be considered carbon negative, since CO2 would not be released into the atmosphere. A disadvantage of biogas, however, is that it has a lower methane content than natural gas, while also impurities, mainly H2S, should be considered, since the process in this case requires additional purification before fuel can enter the system. H2S should not be present in the system, since it is corrosive, poisons reformer catalysts, and is not tolerable by SOFCs [47].
A system’s operation is reliant upon energy demand and is cycled upon that demand. In real-time operation, the system would operate at full capacity at peaks of power demand, while the output of the system would drop at times of low energy demand. Captured CO2 would be stored for potential later use, to produce synthetic fuels, like synthetic natural gas, when excess electricity would be available. The process, with a combination of synthetic fuel production, would in this way contribute to balancing the periods of low and high energy demand. Due to cycling, the system is considered as more reliable in comparison to conventional energy generation methods, like nuclear and thermal powerplants, and even when comparing the system to solar and wind power, since the former systems cannot effectively respond to variable energy supply and demand. Wind and solar can generate power only when their respective natural resources are available, while nuclear and thermal power plants can adjust their power output, but rapid changes are not desired.
The significance, contribution, and novelty of the system comes from the next key aspects of the process:
  • The process can operate at times when variable renewable solutions like solar cannot provide enough constant energy supply. In this way, the process provides a solution to balance out the peaks of high energy demand and increases energy reliability.
  • A common practice of biogas plants is to provide heat and power [31]. The adoption of the system would help to raise the power output of the biogas plants, since biogas is commonly burned on site through various types of engines, gas, and steam turbines [47], which have lower efficiencies. Replacing those would increase the efficiency of existing biogas power plants.
  • Biogas plants are commonly placed in more rural areas, which usually do not have, or have a smaller, industry sector. The adoption of process would bring additional job opportunities and provide hot sanitary water to smaller local districts.
  • There is a potential to couple the process with synthetic fuel production in periods of low energy demand, e.g., synthetic natural gas, which could be used as a green alternative for local fuel demand, contributing to sustainable energy solutions.
  • An improved and modified version of a classic RC is adopted in a current study, increasing the efficiency of the RC, due to steam reheating between a high- and low-pressure turbine.
  • The process is fully integrated, making it self-sufficient and decreasing the reliability on outside heat sources, where heat losses can occur between transferring the heat to the specific process units. This also increases the efficiency and lowers the environmental impact and operating costs.
  • As the last step of the process, CC was considered, making the current proposed process carbon negative.
  • The proposed system uses biogas as a green alternative to fossil fuels.
It should be noted that the combination of a SOFC and RC is not a new concept, as previously mentioned, but at the time of writing, the authors are not aware of any studies or research papers that have simulated the process using a such-modified version of RC, while also fever studies exist on similar biogas fed hybrid systems. The authors also are not aware of studies that integrate biogas-fed SOFC, modified RC, post-RC carbon capture, liquefaction, and storage/usage in such way, while providing extensive study of the proposed system. Novelty and innovation also come from a utilisation of waste heat in the CCUS section, while the process offers a great alternative of completely utilising hot exhaust gases provided by the SOFC.

2. Materials and Methods

Aspen Plus is the market leader in process simulators with over 40 years of experience and information. It is used by many of the world’s largest chemical companies because of its flexibility and wide range of applications. Built-in process modelling, cost estimation, energy management, safety analysis, and process improvement with built-in artificial intelligence are just some of the features of the software [48].
Figure 1 presents the simplified flowchart of the proposed process, while Figure 2 shows a detailed flowsheet of the simulated process.
The process is consisting of four main components: steam reforming, SOFC, integrated modified Rankine cycle, and CO2 separation and liquefaction. The former includes the pre-treatment and steam reforming.
The aim of the system is to achieve higher efficiencies than conventional systems, while using a green fuel as an alternative to fossil fuel-driven SOFCs. In the proposed system, biogas is first reformed and then fed to the SOFC, which was chosen as the main power generation method because SOFCs offer higher electrical efficiency compared to other conventional power generation methods. This is possible because electricity is generated directly from the electrochemical reaction. The process is thus not limited by the Carnot cycle, compared to traditional thermal power plants [35]. SOFCs are flexible in the fuels they can use, and can be considered sustainable when operating on biofuels [33]. For the current study, biogas, a sustainable fuel, was chosen, contributing to the sustainability of the SOFC and the whole system.
Since the fuel in SOFCs is not fully utilised, it is partially recycled, while the remaining fuel is burned. Part of the resulting hot flue gases is used to supply heat to the system, which eliminates the need for hot utilities in continuous operation, thus eliminating operating costs and reducing the system’s dependence on external sources, increasing reliability. Since SOFC provides hot flue gases, due to a high operating temperature, there is a possibility to utilise this remaining heat. The remaining hot flue gases are therefore sent to a modified RC, which uses the heat from the gases to generate additional power, increasing overall and electrical efficiencies. Cooled flue gases are then sent to the CCUS section where CO2 is captured, compressed, and liquefied. The electrical efficiency is slightly reduced in this section due to the compression, but the overall efficiency is increased due to the useful heat generated by the compression. Carbon capture is also preferred because it prevents the release of CO2 into the atmosphere, thus contributing to the sustainability of the system.
At the beginning of the process, biogas inflow is introduced, with properties and composition based on a real-life example, and is presented in Section 2.1. The biogas then passes through a separator (VLS-1), which separates condensed water (WS-1) from the vapour phase. The fuel stream FS-1 is then fed into a compressor (C-1), where the discharge pressure is set to the operating pressure of 1.2 bar [49], and the appropriate isentropic and mechanical efficiencies are set based on existing compressors on the market. In the process, heat losses and pressure drops were neglected. The pressurised vapour then passes into a stream mixer (E-1), combining with the recycled depleted fuel (A-EXH-11) from the SOFC. The outlet mixer flow (FS-4) is then fed into a plug–flow reactor (R-1) where the steam-reforming process occurs. Since reforming is endothermic, additional heat is supplied with SOFC hot flue gases (FG-12). The flowrate is adjusted with the splitter (SS-3) to set the desired outlet temperature of stream FS-5, representing reformed SOFC fuel. In the reformer, reactions with appropriate kinetics are defined and are discussed later in Section 2.2. The resulting hydrogen rich stream (FS-5) is supplied into the SOFC anode, while the cathode is supplied with pre-heated air that is first compressed in C-2 to a pressure of 1.2 bar. Preheating occurs in a heat exchanger (AS-HE-1), where heat is supplied with a stream of flue gases FG-15. The amount of air needed is calculated using air utilisation (Ua) and fuel utilisation (Uf) values which are used to model the SOFC. The values were selected from a range of plausible options: the Uf values in the literature vary from 0.68 to 0.95 [20,40,50,51], while the values of Ua are commonly around 0.20 [51,52,53,54]. Since there is no direct way to simulate a fuel cell in Aspen Plus, SOFC was replicated with the available process units. The anode is represented with SOFC-A, and cathode is represented with SOFC-C and AS-HE-2. The modelling is discussed in more detail later in Section 2.3.
The fuel cell anode exhaust gases are represented by stream A-EXH-1, and the depleted air from the SOFC is stream C-EXH-2. The splitter SS-1 is used to separate the anode exhaust into stream A-EXH-11, which is recycled into E-1, while the rest (stream A-EXH-21) is fed into combustor (R-2). This split ratio between streams is set in a way to achieve the specified steam-to-carbon ratio (S/C) in a reformer [55]. The combustor is simulated with an RSTOIC unit (R-2) and is explained in Section 2.3.
Hot flue gases (FG-1) of combustor outlets are split into two streams, FG-11 and FG-21, where the FG-11 stream is used to supply the heat demand of the reformer R-1 and air preheater AS-HE-1. To ensure the adequate preheating of air, a design specification that varies the split fraction of FG-11 in SS-2 until the temperature of stream FG-16 is 10 °C higher than the temperature of stream AS-2 is set. To supply heat to the reformer, a design specification of splitter SS-3 is set in a way that the specified temperature at the reformer outlet is achieved by varying the split fraction of stream FG-12.
The remaining flue gases (stream FG-21) are led through a modified RC, which is used to utilise the remaining heat for power production. A modified version of the classic Rankine cycle is used to achieve a higher efficiency. Flue gases (FG-21 through FG-25) pass through a series of heat exchangers in a counter-current flow with water/steam. In the first heat exchanger (RC-HPHW), pressurised water (HPW-2) is first heated to its boiling point. The exiting stream HPW-3 is then led through the boiler (RC-HPSG), used to generate saturated high-pressure steam (HPS-1), which is further superheated in RC-SHPSG. The stream SHPS-1 is then passed through high-pressure turbine RC-HPT. The exiting low-pressure steam (LPS-1) is reheated in RC-LPSR to generate superheated low-pressure steam (SLPS-1), then passed through low-pressure turbine RC-LPT. Saturated steam in a vacuum (VPS-1) is then condensed and pressurised in RC-COND and RC-P-1, respectively. To achieve condensation, river water (CW-1) at 9 °C is pumped into the condenser with a pump (RC-P-2), which raises its pressure to 5 bar. In accordance with the law, the outlet water temperature (CW-3) is heated by a temperature difference of 3 °C in comparison to CW-1. This is achieved with a design specification that varies the flowrate of stream CW-1. The pressurised water (HPW-1) then re-enters the RC, which is also represented in Figure 3 in a form of temperature–entropy diagram.
To achieve proper heat utilisation in the RC, the design specification varies the flowrate of HPW-2 to achieve a 10 °C temperature difference between streams FG-25 and HPW-2. If the error for hot and cold stream temperature crossover was present, the temperature difference was gradually raised by 5 °C, until the crossover was resolved.
The exhausted flue gases (FG-25) and (FG-16) enter the carbon capture part of the process, where the condensed water (WS-2) is first removed in separator VLS-2. For the carbon capture process, the vacuum swing adsorption was assumed. The process was not simulated since it requires dynamic simulations and is based on a great amount of experimental data. Instead, it was modelled with a simple separator unit (VSA), where the CO2 was separated from the flue gases FG-3. The remaining gases, N2, H2O, and O2, are represented with a stream WS-3. For this purpose, the split fraction of CO2, N2, O2, and H2O to stream CC-1 were specified to the values of 0.98, 0.0001, 0.0001, and 0.0001, respectively, assuming 98% of CO2 would be captured, along with smaller amounts of other gasses (1%).
To store captured CO2, multistage compression was added, with an additional liquefication. CO2 is compressed in the compressors connected in series (C-3, C-4, C-5, C-6) to a pressure of 69 bar then liquefied by cooling the stream CC-9 to 18 °C [56]. The liquefication is achieved with a simple ammonia (R717) refrigeration cycle, where the compression heat pump was set up in a way, that it could produce water at 60 °C.
To utilise the heat produced from the process of captured CO2 compression and liquefaction, the production of hot water for domestic use in a nearby district was assumed. The streams SHW-C-1 through SHW-C-4 are used to cool hot CO2 after each compression stage, while the heat from the refrigeration cycle is used to heat up stream SHW-C-5. The heated streams (SHW-H-1 through SHW-H-5) are then combined in the mixer SM-3.
The temperature of the hot water was assumed to be 60 °C, according to fourth generation district heating systems [57]. To supply the water, an additional pump DH-P was placed on a flowsheet, which raises the pressure to 6 bar (stream SHW-1) [58]. For the inlet temperature of the water, a value of 30 °C was taken from research of Lund et al. The value represents an approximated average return temperature of the domestic hot water tanks in their study [59]. The same temperature difference of 10 °C was set between hot and cold streams in heat exchangers RC-HPWH, and CC-HE-1 through CC-HE-6.
The following limitations and assumptions were considered in the construction and modelling of the process.
  • A range of operating parameters was chosen by the review of literature data.
  • The process is a conceptual design, and therefore not optimised.
  • A workaround to simulate SOFC was made in Aspen Plus.
  • Heat and pressure losses were neglected.
  • The process was simulated in a steady-state and continuous mode.

2.1. Biogas Flowrate

The total biogas flowrate of the biogas plant was taken to be the same as in the previous study conducted by Rola et al. [31]. It was assumed that impurities are removed before the power plant, and so the biogas at the inlet consists of only CH4, CO2, and H2O, with molar flows of 16.67 kmol/h, 8.97 kmol/h, and 1.35 kmol/h, respectively. The temperature of the inlet was assumed to be 35 °C, while the pressure was set to 1 atm. Since the SOFC would be operated at times of high electricity demand, the SOFC capacity must be higher than the biogas production rate. For this purpose, a capacity of 3 days’ worth of biogas production was assumed, and so all the molar flowrates were multiplied by a factor of 3, while each simulation was set to run under this same biogas feed flowrate, 80.97 kmol/h.

2.2. Reactor and Reaction Kinetics

Prior to SOFC, carbon fuel is first reformed with water steam. Reforming is primarily described with three reactions, namely steam methane reforming (SMR), water–gas shift (WGS), and direct steam methane reforming (DSMR) reaction, represented with Equations (1)–(3), respectively [53]. Only these reactions were considered in the reactor model, while the coking was explored outside of the Aspen Plus environment.
CH 4 + H 2 O   3 H 2 + CO
CO   +   H 2 O   H 2 + CO 2
CH 4 + 2 H 2 O     4 H 2 + CO 2
To model the reforming of biogas, the Langmuir–Hinshelwood–Hougen–Watson (LHHW) mathematical model developed by Xu and Froment [60] was used. Even though the model was developed in 1989, it still stands as one of the most widely used mathematical models to describe kinetics over nickel–alumina catalysts. The proof of this is that many of the papers compare, cite, and even use the same kinetics to model SR even in recent years [53,61,62,63,64,65]. The model is described by the following Equations (4)–(6), representing the kinetics of SMR, WGS, and DSMR reactions, respectively.
r SMR kmol kg cat   s = k SMR   p CH 4   p H 2 O p H 2 2.5 1 K eq ,   SMR p H 2 0.5 p CO 1 + K CO   p CO + K H 2   p H 2 + K C H 4   p C H 4 + K H 2 O   p H 2 O p H 2 2
r WGS kmol kg cat   s = k WGS p CO p H 2 O p H 2 1 K eq ,   WGS   p CO 2 1 + K CO   p CO + K H 2   p H 2 + K C H 4   p C H 4 + K H 2 O   p H 2 O p H 2 2
r DSMR kmol kg cat   s = k DSMR   p CH 4   p H 2 O 2 p H 2 3.5 1 K eq ,   DSMR   p H 2 0.5 p CO 2 1 + K CO   p CO + K H 2   p H 2 + K C H 4   p C H 4 + K H 2 O   p H 2 O p H 2 2
In the model, the rate of corresponding reaction is represented by r, p is partial pressure of the respective component (methane (CH4), water (H2O), hydrogen (H2), carbon monoxide (CO) or carbon dioxide (CO2)), k is the rate constant of the corresponding reaction, following the Arrhenius equation, K is the adsorption constant of the denoted component, following Van’t Hoff’s equation, and Keq is the equilibrium constant of the respective reaction. The parameters for rate, adsorption, and equilibria constants are represented in Table 1.
The model was used in a plug–flow reactor (PFR), modelled in a co-current flow with reactants and combustion products of R-2, where the combustion flue gases supply the heat to the PFR. In a reactor, a constant overall heat transfer coefficient of 20 W/(m2K) was assumed from a study [66]. The density of the catalyst and porosity were set to 2179 kg/m3 and 0.39, respectively, according to [53]. The reactor’s length, number of tubes, and their diameter were set to be 10 m, 500, and 0.1 m, respectively. The dimensions were chosen arbitrarily, so that the reaction mixture reaches equilibrium at a specified temperature of the SOFC anode inlet. For simplicity reasons, this temperature is denoted as reformer operating temperature. The temperature is reached with a design specification that varies the split fraction of stream FG-12 in a stream splitter SS-2.
An additional calculator was set to provide a specified steam-to-carbon ratio (S/C) at the reformer inlet, calculated with Equation (7), from respective molar flowrates of the molecules. The S/C ratio was then achieved by adjusting the split fraction of stream A-EXH-11 in stream splitter SS-1.
S / C   ( ) = n ˙ H 2 O n ˙ CO 2 +   n ˙ CO + n ˙ CH 4

2.3. SOFC and Combustion

Since Aspen Plus does not have readily available models to simulate fuel cells, a workaround was made. The anode (SOFC-A) and cathode (SOFC-C with AS-HE-2) were modelled separately as an equilibrium reactor and component splitter with heat exchanger, respectively. The splitter serves to reproduce the oxygen consumption/reduction in the fuel cell. The oxygen ion is the charge carrier in the SOFC. It is transported through the electrolyte to the anode side where it reacts with H2 to produce electrons. This transfer cannot be simulated in Aspen Plus, so the overall reaction of the cell half reactions was used [52], in accordance with Equation (8).
To simulate fuel consumption in SOFC, the anode was modelled as an equilibrium reactor, where the SMR, WGS (Equations (1) and (2)), and overall electrochemical reaction of the SOFC, described by Equation (8) [40], were defined. Additionally, the exhaust temperature of stream A-EXH-1 was defined in SOFC-A, to simulate the heat up of the anode fuel stream inside the SOFC stack.
H 2 + 0.5 O 2   H 2 O
To model the oxygen consumption, and therefore fuel consumption in SOFC, a component splitter was used as a cathode, where the split fraction of oxygen to the stream SOFC-M was taken as the air utilisation of the SOFC [52]. To ensure that specific fuel utilisation of SOFC is achieved, Equation (9) was derived and set in a calculator block. The block calculates the required air flowrate ( n ˙ Air ) from the specified Uf, defined by Equation (10), where n ˙ H 2   eq .   consumed and n ˙ H 2   eq .   fresh are consumed fuel in SOFC and fresh fuel at the SOFC inlet, respectively, in a form of equivalent hydrogen flowrate [54], which is calculated from the molar flowrates of CH4, H2, and CO ( n ˙ H 2 , n ˙ C H 4 , and n ˙ CO ), according to Equation (11) [52]. The numbers 0.79 and 0.21 represent the mole fractions of nitrogen and oxygen in air, respectively.
n ˙ air   ( k m o l / h ) = U f 2 U a   ×   n ˙ H 2   eq .   fresh   ×   1 + 0.79 0.21
U f     ( ) = n ˙ H 2   eq .   consumed n ˙ H 2   eq .   fresh
n ˙ H 2   eq .   ( k m o l / h ) = n ˙ H 2 + 4 n ˙ CH 4 + n ˙ CO
To calculate the power of the SOFC, another calculator block was set up. The power output in the SOFC (PSOFC) can be calculated by multiplying the voltage (VSOFC) and current (ISOFC), according to Equation (12).
The reversible voltage (VSOFC, rev) was calculated from Equation (13) [40], where ∆G° is standard Gibbs free energy of electrochemical reaction (Equation (8)); F is the Faraday constant, with a value of 96,485 As/mol; Tavg is the average temperature between the SOFC inlet and outlet; p is pressure; p0 reference pressure of 1 atm; and xavg represents the average mole fraction between the inlet and outlet of the SOFC for the corresponding molecule (H2, O2, or H2O) [49].
The current was calculated by Equation (14). Substituting Equations (13) and (14) into Equation (12) gives Equation (15), which represents the reversible power of the cell (PSOFC, rev) [67]. To account for voltage losses in a fuel cell, the reversible power was multiplied by a factor of 0.65, which was held constant through the simulations.
P SOFC   ( W ) = V SOFC   ×   I SOFC
V SOFC ,   rev   ( V ) = Δ G ° 2   F + R   T avg 2   F   ×   ln p p 0 0.5 x H 2   avg   x O 2   avg 0.5 x H 2 O   avg
I SOFC   ( A ) = 2   F n ˙ H 2   eq .   consumed
P SOFC ,   rev   ( W ) = n ˙ H 2   eq .   consumed   ×   Δ G ° + R   T avg   ln p p 0 0.5 x H 2   avg   x O 2   avg 0.5 x H 2 O   avg
The calculated power was set to be written on the heat stream SOFC-P in the heat splitter HS. This stream represents the power output of the SOFC, while the heat flow Q-3 was adjusted to a low value of 1 kW through a design specification that varies the air utilisation or split fraction in cathode SOFC-C. This simulates the removal of generated heat through heating up the depleted air (C-EXH-1) in the SOFC, represented by the heater AS-HE-2, where the temperature is specified to be the same as the defined temperature of block SOFC-A.
The value of heat stream Q-1 is subtracted from the heat generated by reactions taking place in the SOFC, and the only value that is close to the calculated power of the SOFC remains in stream Q-2. In this way, energy balance of the fuel cell is established. The decision to set the value of the heat stream Q-3 to 1 kW, rather than 0 kW, can be attributed to convergence reasons. To help with the convergence of the design specification, a looser solution interval between 0.9 kW and 1.1 kW was also specified.
The remaining fuel, which is not recycled with generated water in the SOFC, was combusted in block R-2. The combustion was modelled as a stoichiometric reactor, where oxidation reactions of H2, CO, and CH4 were specified, according to Equations (8), (16), and (17), respectively [68,69].
2 CO + O 2   2 C O 2
C H 4 + 2 O 2   C O 2 + 2 H 2 O
It was assumed that the remaining fuel would be completely oxidised, and the combustor was set to be adiabatic. In this way, the flue gases are heated up by the generated heat in combustion.

2.4. Base Case Simulation

In all simulations, the temperature of the stream AS-3 was set to be the same as the reformer-specified operating temperature (temperature of stream FS-5). The temperature of the SOFC operation was set in block SOFC-A, and the depleted air heater AS-HE-2 was set to heat up the air to that same temperature. Like stream AS-3, stream C-EXH-2 was therefore set up to be the same as the temperature of stream A-EXH-1.
First, the base case of the process was run, where the reformer operating temperature was set to 650 °C, and the SOFC exhaust temperature was set to 850 °C. For simplicity, this specified outlet temperature is denoted as the operating temperature of the SOFC.
In this simulation, the S/C of 2.5 was specified in the calculator that varies the split fraction of stream A-EXH-11 in SS-1, and the fuel utilisation was specified to the value of 0.70 in a calculator that calculates the air flowrate AS-1.
After a successful run, the temperature, pressure, vapour fraction, flowrate, and composition of each stream, and heat and work duty of process units were recorded. Additionally, results from relevant design specifications and calculators, like SOFC power, air utilisation, and S/C ratio were taken from the run. After the run S/C, SOFC power, fuel utilisation, and temperature difference in relevant heat exchangers was checked manually, through calculation in excel to make sure that calculators and design specifications were properly converged, and no error was made.
System performance indicators, like the SOFC’s electrical efficiency, system’s overall efficiency, and system’s electrical efficiency were calculated. For the reformer, calculation of total methane conversion was carried out, while the danger of catalyst coking due to Boudouard reaction (Equation (18)) [23] was investigated. Since the idea of the process is to also provide heat in a form of domestic hot water, while utilising the residual heat of captured carbon compression, the number of consumer households was estimated.
2 CO   C O 2 + C

2.5. Sensitivity Analysis

After the base case, the simulation was carried out at different operating parameters. In the first sensitivity analysis, the effect of the reformer operating temperature at different SOFC operating temperatures was investigated, as shown in Table 2. For the analysis, the S/C ratio and fuel utilisation were kept constant at 2.5 and 0.70, respectively.
In the second analysis, the effect of fuel utilisation was investigated, at various SOFCs. Fuel utilisation was varied between 0.60 and 0.90 with a step of 0.10. The investigated SOFC/reformer operating temperatures were 750 °C/550 °C, 800 °C/600 °C, 850 °C/650 °C, 900 °C/700 °C, and 950 °C/750 °C. The S/C ratio was kept constant at 2.5.
The third analysis was conducted while varying the S/C ratio between 1.5 and 3.5 with a step of 0.5, for the selected SOFC/reformer temperatures of 750 °C/550 °C, 850 °C/650 °C, and 950 °C/750 °C, to cover the SOFC and reformer operating temperature range. In this analysis, the fuel utilisation was constant, with a value of 0.70.
Like in the case of base case simulation, various parameters were calculated in excel to confirm successful runs, and selected efficiencies, coking potential, and air utilisation were presented. The number of consumer households was not presented in the analysis, since the biogas flowrate, and therefore the number, stayed the same.

2.6. Results Analysis

2.6.1. Performance Indicators

To assess the system and SOFC performance, three efficiencies were calculated with Equations (19) [70], (20) [40], and (21) [70], representing SOFC electrical (ηSOFC), system electrical (ηel), and system overall efficiency (ηoverall), respectively.
η SOFC   ( % ) = P SOFC n ˙ biogas   ×   L H V biogas   ×   100 %
η el   ( % ) = W out W in n ˙ biogas   ×   L H V biogas   ×   100 %
η overall % = W out W in + Q ˙ useful n ˙ biogas   ×   L H V biogas   ×   100 %
where PSOFC represents the power output of SOFC, n ˙ biogas molar flowrate of biogas, LHVbiogas lower heating value of biogas, Win total inputted work in the system, Wout is generated work, and Q ˙ useful useful output heat from the system. The latter is calculated as a sum of exchanged heat in heat exchangers CC-HE-1 through CC-HE-4, and CC-HE-6, used to produce domestic hot water.
Wout is calculated as a sum of the produced power of SOFC and turbines RC-HPT and RC-LPT, while Win is a sum of the required work to run the compressors, C-1 through C-7, and pumps, RC-P-1, RC-P-2, and DH-P.

2.6.2. Coking Potential and Methane Conversion

Since it is known that the Ni catalysts, used in SOFCs and reforming reactors, are susceptible to coking (Equation (18)) [33], its danger was explored in a way of calculating the equilibrium constant of coking reaction (Kp) and comparing it to the reaction quotient (Qp) of the reformer outlet composition. The equilibrium constant and reaction quotient were calculated from Equations (22) and (23) [71], respectively, where xj is the mole fraction of the respective molecule, p absolute pressure, and p0 reference pressure of 1 atm.
To obtain the Gibbs free energy (∆Gr) of coking reaction, Gibbs free energies of the species j (∆Gj) were first calculated from the corresponding enthalpies (∆Hj) and entropies (∆Sj), by Equation (24) [72]. Those were calculated by the Shomate equation and parameters, which are available online for each species: CO [73], CO2 [74], and C [75]. The ∆Gr was then calculated from Equation (25) [72].
To assess the danger of coking, the ratio Kp/Qp was calculated. If the ratio is higher than 1 (Kp > Qp), it is considered that the equilibrium is shifted towards products [71], and therefore carbon formation, while the values below 1 (Kp < Qp) indicate that the equilibrium is shifted towards reactants [71], and coking would therefore not be present.
K p   ( ) = e Δ G r R T
Q p   ( ) = x CO 2 x CO 2   ×   p 0 p
Δ G j   J / mol = Δ H j T Δ S j
Δ G r   J / mol =   Δ G CO 2 + Δ G C 2 Δ G CO
The conversion of methane ( X CH 4 ) in reformer was calculated from Equation (26), where n ˙ CH 4 ,   in and n ˙ CH 4 ,   out are molar flowrates at the inlet and outlet of the reactor, respectively.
X CH 4   ( ) = n ˙ CH 4 ,   in n ˙ CH 4 ,   out n ˙ CH 4 ,   in

2.6.3. Hot Sanitary Water

It was assumed that an average household has an area of 234 m2, with energy consumption of 160 kWh/(m2a), of which 14.8% is used for the production of domestic hot water. Assuming a half-year SOFC operation and considering that the simulated process operates at a full capacity of 3 days’ worth of stored biogas 1 day, the number of possible consumer households (N) was then approximated by Equation (27).
N   ( ) = Q ˙ useful   ×   182   days / a   ×   24   h 3   days   ×   234   m 2   ×   160   kWh / ( m 2 a )   ×   0.148   ×   0.5

3. Results

3.1. Results of Base Case Simulation

The stream results of the base case simulation are presented in Appendix A, in Table A1, while the energy streams are presented in Table A2. In Table 3, key parameters and results of the simulation are presented.
From the energy stream results, the efficiencies were calculated. The results show that the electrical and overall efficiency of the system are 67.70% and 71.64%, respectively, while the SOFC has an electrical efficiency of 61.18%. These results show major improvements in comparison with other power generation systems implemented currently. Geothermal power plants have an average conversion efficiency of 12% [76] and nuclear power plants reach a thermal efficiency of 33–35% and dispose of 60% of waste heat into nearby waterbeds and air [77]. The efficiency of gas turbine cycles can reach only up to 40% [78,79]. Akay et al. [80] made an efficiency analysis of solar farms by UAV-based thermal monitoring and found the highest achievable efficiency being 18.25% in the afternoon. Nishinaga et al. [81] studied Polycrystalline Cu(In,Ga)Se2 (CIGS) solar cells with a conversion efficiency of more than 21%. Additionally, the obtained results are comparable with the literature with other hybrid systems, where Hao et al. [82] had a similar 70.94% efficiency in their SOFC hybrid system, Meng et al. [37] simulated a system with 69.25% cooling and power efficiency, and Tan et al. [38] reached over 65% electrical efficiency with their integrated SOFC-GT system. Chuahy and Kokjohn [83] achieved higher electrical efficiencies, but no CCUS was considered. Some of the alternatives mentioned are considered carbon neutral, while the proposed hybrid system can be considered carbon negative, as it captures carbon instead of releasing it into the atmosphere, while being better or equal at generating electricity efficiently.
While utilising the waste heat from compression of CO2 and its liquefication, the heat can be used to produce 11.66 m3/h of hot water, when the system operates at full capacity. According to estimates, this would be enough to supply around 231 households with hot water for domestic use.
The system’s susceptibility to coking was assessed primarily with a calculation of ratio Kp/Qp. The value at the reformer and SOFC anode outlet shows that the equilibrium of coking is shifted towards reactants, with values of 0.3112 and 0.0008, respectively. Additionally, for this case, the profile of Kp/Qp in the reformer was investigated. The results were plotted on Figure 4a, along with a composition profile. It is observed that the profile forms a peak at a length of 1 m. When comparing the ratio profile to temperature profile at Figure 4b, it is clear the two are connected, since the temperature of the reaction mixture drops rapidly in the same reactor section. A similar profile was observed by other works, like Abbas et al. [62] and Rashid et al. [53].
The drop of temperature is caused by the endothermic steam reforming reactions, which are more rapid in the starting section of a reactor. This is evident by a fast drop of H2O mole fraction and increase in H2 fraction. Even though the heat for reactions is supplied by a very hot stream of flue gases, the temperature drops by nearly 120 °C. It can be assumed this is a result of poor heat transfer, represented by a low overall heat transfer coefficient of 20 W/(m2K), adapted from Yun et al. [66]. The second reason is the even distribution of catalyst in the reactor. It is assumed that, with proper catalyst distribution, the cold spot would be eliminated [31]. Rashid et al. also showed that proper integration of reformer and combustion can eliminate such cold spots [53]. A smooth transition of the reactor profiles is observed after reaching the cold point in the reactor due to the deceleration of the reactions, approaching the equilibrium.
The main findings of the base case simulations are that the current reformer setup in the process generates a cold spot in the reactor, which at lower temperatures poses a danger to coking. The efficiencies are comparable to the literature, and the amount of generated heat is enough to supply a smaller district with heat for the production of hot sanitary water. The RC effectively raises the amount of produced power since it represents 18.70% of total generated power.

3.2. Sensitivity Analysis

3.2.1. Effect of Reformer Temperature at Different SOFC Operating Temperatures

Various cases were studied, where the effect of reformer temperature was investigated. The results are presented on Figure 5, where each colour of the curve represents a different SOFC operating temperature: 750 °C, 800 °C, 850 °C, 900 °C, and 950 °C. For each operating temperature, the reformer temperature was varied.
The system’s efficiencies, represented on Figure 5a, were observed to be higher at lower reactor temperatures. Since the fuel flowrate was kept constant, the amount of produced useful heat for hot water production also stayed relatively constant. The result is the same curve shape when comparing the overall efficiency to electrical efficiency at the same SOFC operating temperature.
When looking at individual curves, it is speculated that higher efficiencies at lower reactor temperatures are a result of lower heat demand, since both reforming reactions (SR and DSR) are endothermic, 206.1 kJ/mol and 164.9 kJ/mol, respectively, and are less favourable at lower temperatures, where the conversion of methane is lower [84].
The second factor for efficiency decrease can be attributed to air utilisation, represented on Figure 5b. At lower reformer temperatures, the air utilisation is higher, indicating that less heat is removed from the SOFC, and therefore generated. The result is also a lower flowrate of depleted air, shown on Figure 5c, which increases the required work input for air compression, and therefore lowers the total efficiency.
The reason for lower air utilisation and higher air flowrate at higher reformer temperatures are most likely caused by the lower temperature difference between SOFC inlet and outlet, and because of this, the fuel carries less heat from the SOFC. To balance this, the air utilisation must be lowered, and its flowrate increased. Due to higher flowrates of depleted air, the combustion temperature at R-2 also decreases at higher reformer temperatures.
The positive effect of higher reformer temperatures is mitigated risk of coking, represented by Figure 5d. It has been established that elevated temperatures have the effect of reducing the probability of the Boudouard reaction, which is significant for SOFC operation safety. The CO formation is strongly favoured at temperatures above 974.2 K [85]. For the observed reformer outlet, all Kp/Qp values were lower than 1, which indicates that solid carbon would not exist, as discussed in Section 2.6.2. Since the coking is mostly affected by the temperature and concentrations of CO2 and CO, the temperature and composition profile of the reactor is of great importance in practice. Due to the endothermic nature of the system, there is a risk of the formation of cold spots in reactor, leading to an increased danger of coking, as observed in the reformer profiles of the base case simulation.
Considering the observed effects of reformer operating temperature, the main finding of this part of the sensitivity analysis could be contributed to a decrease in system efficiencies.

3.2.2. Effect of Fuel Utilisation

The effect of fuel utilisation on the system was investigated, where the utilisation was varied between 0.60 and 0.90, for the various operational temperatures of the SOFC/reformer.
Figure 6 represents the specific case when the temperature of the reformer and SOFC were set to 650 °C and 850 °C, respectively. Increasing the fuel utilisation caused the decrease in combustion temperature, since more fuel was consumed in the SOFC. This caused the generation of more water, and to satisfy the S/C of 2.5, a smaller recycle flowrate of stream A-EXH-11 was needed, consequently causing the flowrate of the recycled fuel to drop.
Fuel utilisation also causes an increase in both electrical and overall efficiencies, since more power is produced in the SOFC instead of in the RC, where the latter has lower efficiency. This drop can also be seen on Figure 6b, where the line representing the produced power of both turbines is decreasing with fuel utilisation.
For the selected case, the conversion of CH4 in the reformer is mostly constant, which is shown on Figure 6c. At lower operational temperatures, however, conversion increases with fuel utilisation, which could be considered as a main finding of this part, since the effect is opposite to the study of Doherty et al. [51], where the conversion decreased. It is assumed that the difference is due to the different model setup, which assumes a constant exhaust temperature of SOFC, while varying the air utilisation, whereas the temperature of the SOFC was not constant in their study, and modelled to be dependent on the amount of available fuel [51]. In this work, the fuel flowrate is assumed to be constant. Since the component mixture reaches equilibrium in the PFR, it can be assumed that the increase in conversion is caused by the decrease of recycled fuel flowrate. When less of the reforming products are present in the PFR, the equilibrium can be shifted further to the products, according to Le Chatelier’s principle. At higher reforming temperatures, it is apparent that this effect becomes less impactful.
On Figure 6d, it is shown that the air utilisation decreases, when the fuel utilisation increases. When a higher amount of fuel is consumed in the SOFC, more power is produced, which directly influences the amount of released heat that must be removed from the fuel cell. Some of it is removed by heating up the depleted fuel during the electrochemical reaction, while the rest of it is removed by the air passing through the cathode. When more heat is produced, more air is passed through the cathode, and the air utilisation is lowered, until the heat is used up for heating up the depleted air. The observed effect is similar to the effect of the reformer temperature, discussed in Section 3.2.1.

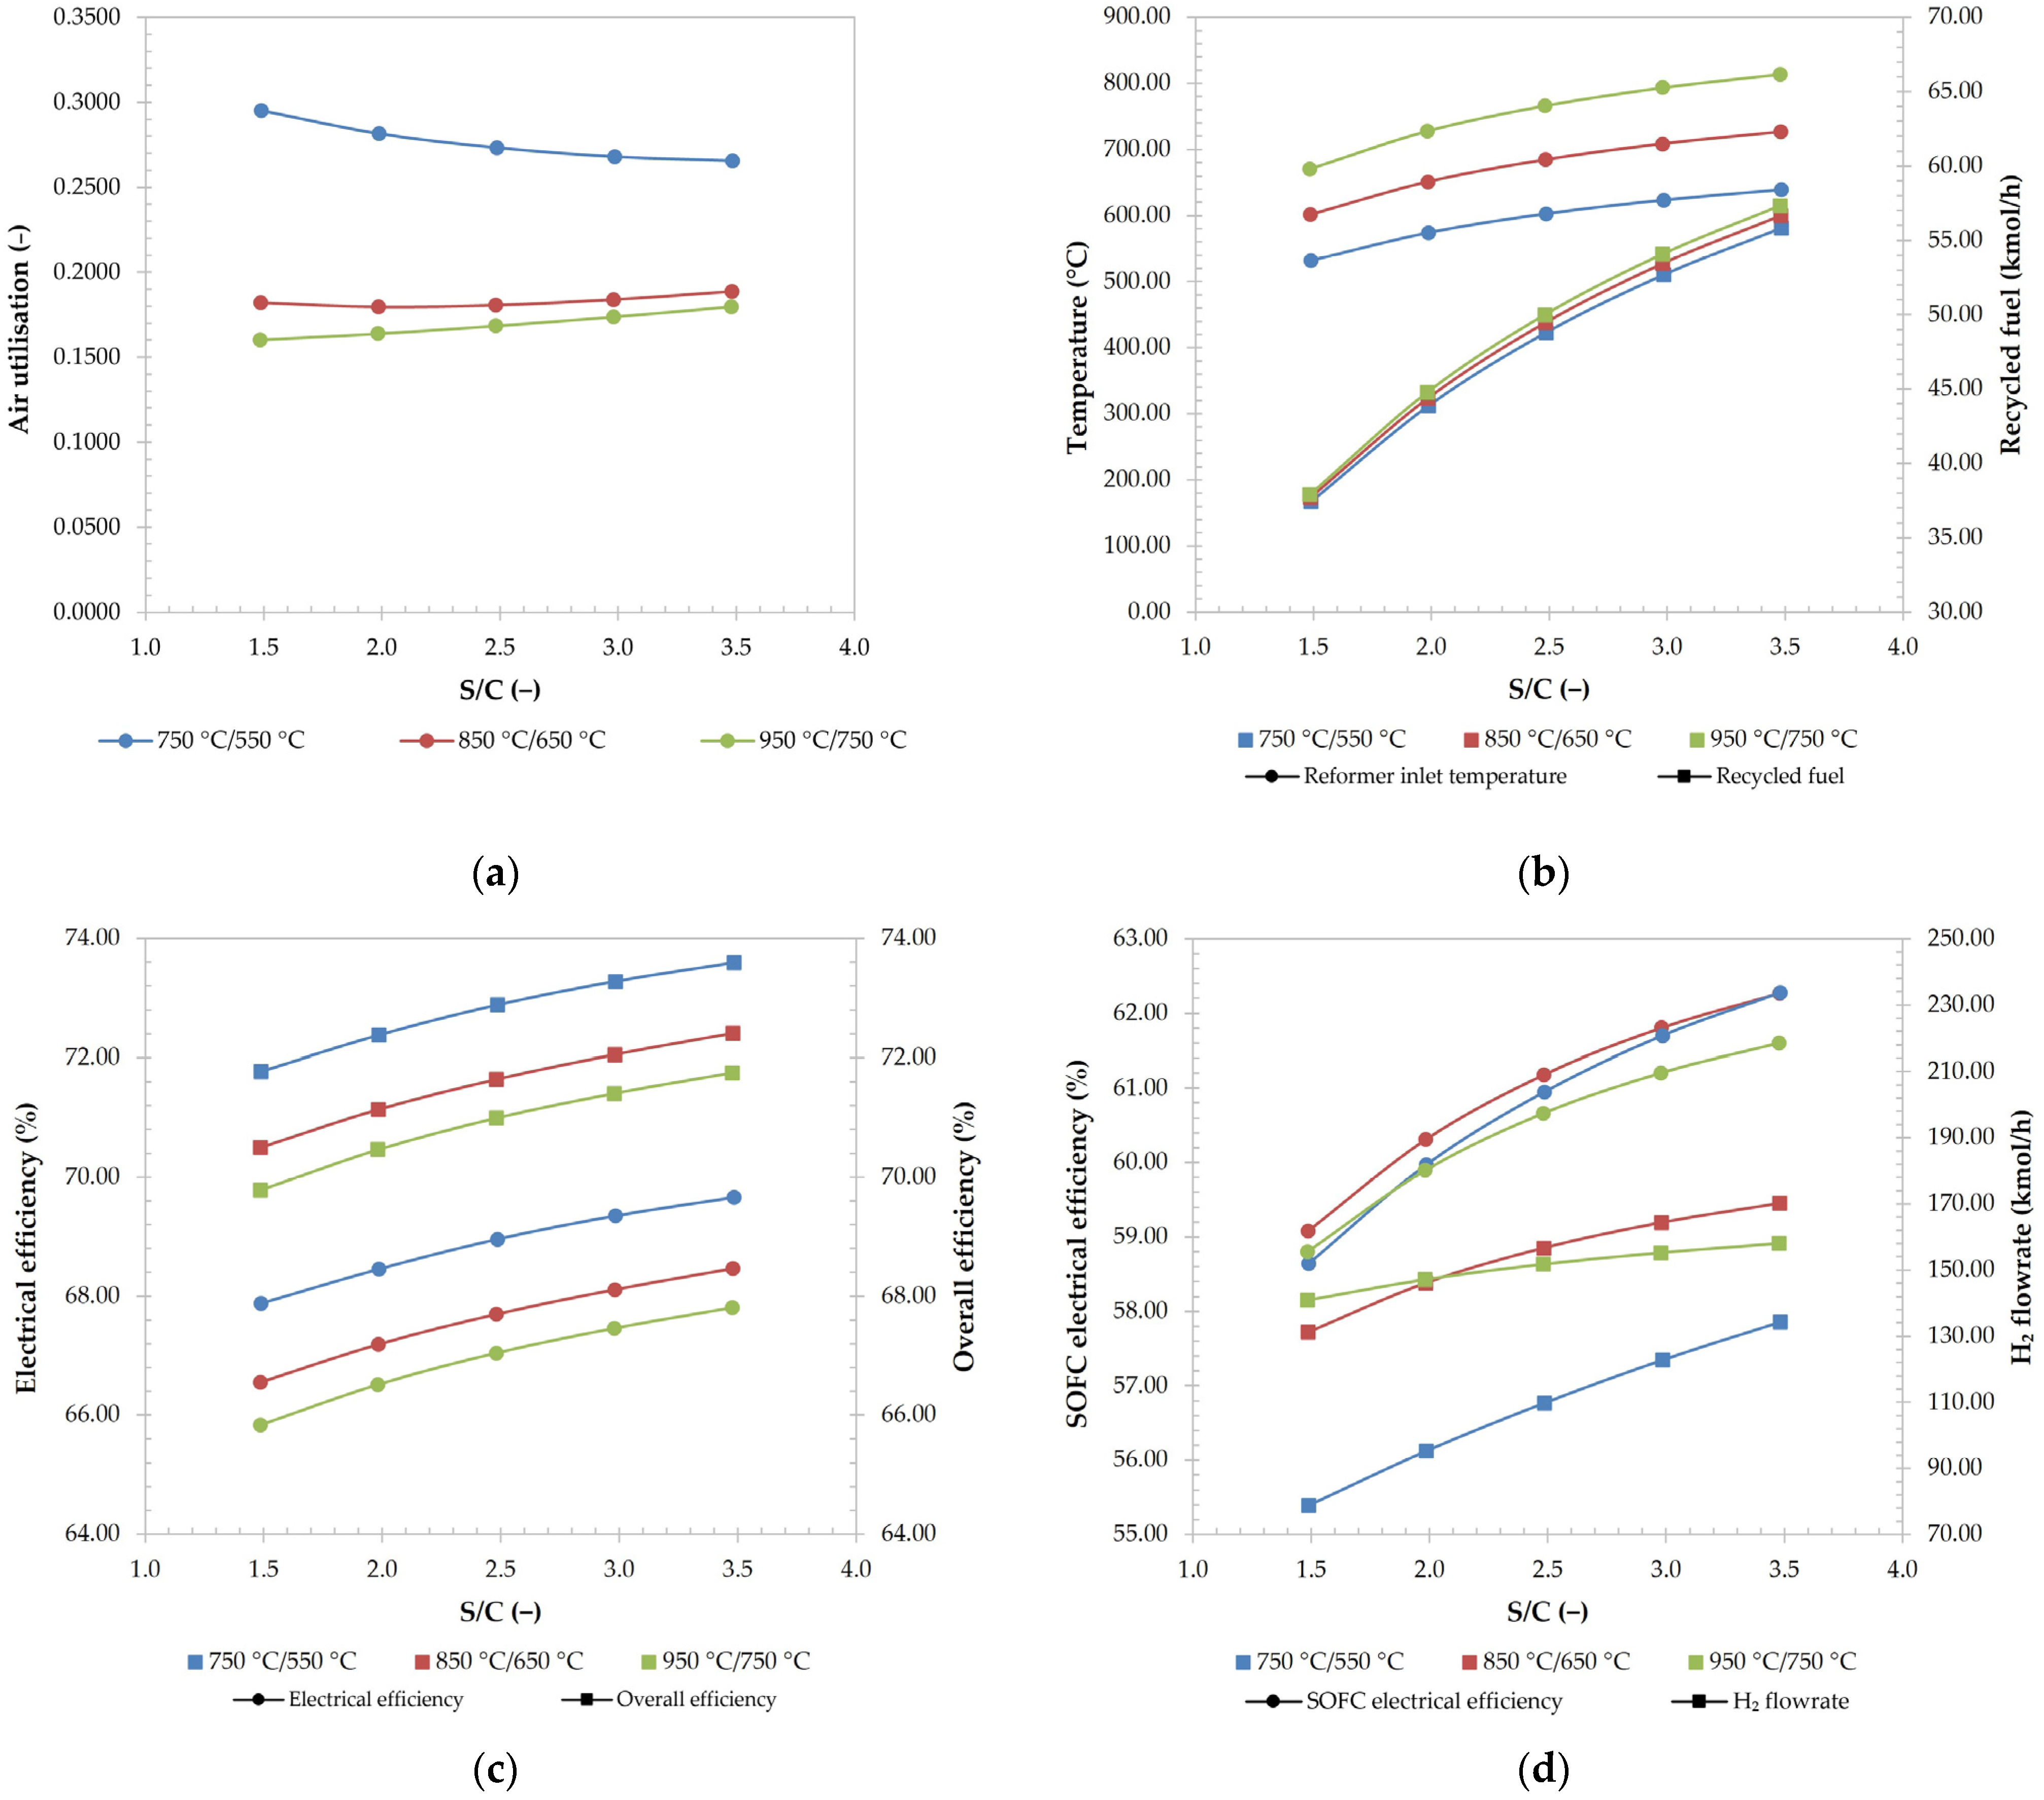
3.2.3. Effect of S/C Ratio

The effect on reformer outlet composition, Kp/Qp ratio, and CH4 conversion were observed and shown on Figure 7. The diagrams express the same behaviour for all the tested operation temperatures. Increasing S/C increased the fraction of CO2 at the reformer outlet, while also increasing the conversion of CH4. This can be contributed to Le Chatelier’s principle, where a higher amount of reactants pushes the reaction equilibrium towards reaction products. Because of this, the CH4 fraction is decreasing with S/C.
Even though the fraction of hydrogen is dropping with S/C, its flowrate is increasing, which is caused and evident by increasing CH4 conversions and consequently its mole fraction. The decrease in the hydrogen mole fraction can be explained by the increasing water flow rates, which dilute the hydrogen flow rate. For the same reason, the H2O fraction is increasing on Figure 7. Higher hydrogen flowrates at the SOFC inlet are also favourable since they increase the generated power in SOFC, as shown on Figure 8d.
Higher S/C ratios are also favourable, since they significantly decrease the danger of coking, as seen on Figure 7. At higher temperatures, this danger is significantly decreased, whereas the solid carbon at S/C below 2.5 in a case of 750 °C/550 °C would exist, even when looking at only the reactor outlet.
While comparing Figure 7a–c, it can be seen that at higher operational temperatures, the reforming reactions are more favourable, since the methane conversions are higher.
Air utilisation, reformer inlet fuel temperature, and recycled fuel flowrate were analysed and are shown in Figure 8. The effect on air utilisation, shown on Figure 8a, is more complex. It was found that the air utilisation in a case of lower operational temperatures (750 °C/550 °C) decreases, which indicates that more heat is removed by air at higher S/C ratios. For higher temperatures of 950 °C/750 °C, the opposite can be said.
Higher S/C ratios increase the efficiencies of the system. This is most likely partially caused by the increase of temperature at the reformer inlet, which is further caused by higher recycle flowrates to achieve the specified S/C ratio. Both temperature and recycled fuel rate are shown on Figure 8b. The higher inlet temperatures decrease the reformer’s heat demand, and therefore higher flowrates of flue gasses are utilised in RC, relative to the reformer and air preheating. The second cause for higher overall and electrical efficiencies, as shown on Figure 8c, are caused by better SOFC electrical efficiency. The latter is further caused by better CH4 reforming and therefore higher hydrogen flowrates, as seen on Figure 8d.
On Figure 8c, it is observed that a higher operation temperature decreased the efficiency of the system, in accordance with air utilisation. The reason for this is the same as discussed previously and is caused by the fact that the heat demand of the reformer is increased with the operating temperature of the reformer.
Even though the SOFC electrical efficiency increases with S/C, comparing the combination of SOFC/reformer temperatures showed that an equal increase in the temperatures from 750 °C/550 °C to 850 °C/650 °C increases the SOFC electrical efficiency, according to increase of hydrogen flowrates. Increasing the temperatures to 950 °C/750 °C unexpectedly showed both the decrease of efficiency and hydrogen flowrate at S/C ratios higher than 2.0. It is likely that the cause is the WGS reaction, which is exothermic, and therefore unfavourable at higher temperatures [84]. Furthermore, the endothermic reverse WGS reaction is more favourable; it prevents a further shift of CO, developed by the SMR reaction, to CO2 and H2 [62].

4. Conclusions

This study introduces a novel fully integrated SOFC-RC system with CCUS. The base case simulation at SOFC/reformer operating temperatures of 850 °C/650 °C and operating parameters S/C = 2.5, Uf = 0.70 Ua = 0.1806 provided an overall efficiency of 71.64%, with a 67.70% electrical efficiency and a refrigerant COP of 3.55. The latter is quite low compared to other SOFC systems, the reason being that this scheme is completely integrated. The advantage of the proposed system is that no outside sources of heat and electricity are needed and it is a net zero-emission process when it operates continuously.
A sensitivity analysis was performed, where a temperature range from 750 to 950 °C for the SOFC revealed that operating at the high temperature and low reactor temperatures was adequate for higher efficiencies, reaching up to 73.24% overall and 69.23% electrical efficiency at an operating temperature of 950 °C/650 °C. The main findings of the sensitivity analysis were that the efficiencies decrease along with air utilisation when raising the reformer operating temperature, due to increasing heat demand. Operating at an SOFC temperature of 950 °C, a 4.36% decrease in overall efficiency and a 15.34% decrease in air utilisation were noted when the reformer temperature was raised from 650 °C to 800 °C. However, the temperature has a positive effect on coking since higher temperatures decrease the Kp/Qp ratio. Increasing the reformer temperature at high operating temperatures shows a bigger drop off in efficiency than lower operating temperatures but pose a more suitable operating condition to avoid coking.
An unexpected observation could be attributed to the S/C ratio, which increased the system efficiencies in a more complex way. An increase of 1.91% in overall and electrical efficiency was found, when increasing the S/C ratio from 1.5 to 3.5 at operating temperatures of 850 °C/650 °C. It enhanced the conversion of methane to hydrogen, which was thought to increase the efficiency of the SOFC. Raising the operating temperatures unexpectedly lowered the efficiencies, which is likely due to the WGS reaction.
To achieve better performance, the importance of a fuel utilisation factor was studied within the sensitivity analysis. The simulations found that increasing it directly benefits the overall and electrical efficiency, since more power is produced in the SOFC and less in the RC, which has a lower efficiency. A peak overall efficiency of 74.26% was calculated for the fuel utilisation factor of 0.9, while lowering it to 0.6 gradually lowered the efficiency to 70.53%, for the base case scenario. Increasing fuel utilisation has a mostly positive effect on the system, increasing its efficiencies and methane conversion in the reformer. The ratio S/C gave some insight into the system operation, showing that increasing it displays better performance, meaning higher efficiencies. The reason being that it raises the inlet temperature into the reactor, and less heat is needed to satisfy its heat demand.
The proposed SOFC-RC with integrated CCUS system shows good electrical and overall efficiencies for a conceptual fully integrated project. It can provide 231 households with hot sanitary water from the surplus heat of CCUS, while mainly producing electricity in the SOFC and modified RC. A possible alteration to the scheme is utilising the WS-3 stream for the generation of additional hot sanitary water. In the future, optimisation of the system should be undertaken, while also considering different alternations to the scheme. To make the system even more reliable, and provide higher energy reliability, short-term battery storage could be considered in the future. An economic analysis of the final system layout would demonstrate its feasibility in large-scale implementation, while the current limitations and assumptions of the hybrid system should also be considered.
Hybrid SOFC systems are still a subject of extensive research, as evidenced by many articles that are published each year. Despite numerous studies, the investments are reported to be high, and several challenges regarding the technology persist. Nevertheless, it is predicted that the investment costs will decrease in future, leading to easier adoption of SOFCs and their hybrid systems. To help with advancement and to drive down investment costs, numerous studies exploring SOFC systems are still needed, while the implementation of such systems can be achieved with a help of subsidies and various funding programmes, granted to green energy alternatives.

Author Contributions

Conceptualisation, methodology, software, validation, investigation, formal analysis, writing—original draft: S.G.; conceptualisation, methodology, software, validation, investigation, formal analysis, writing—original draft: K.R.; review and editing, supervision: D.U.; supervision: D.G. All authors have read and agreed to the published version of the manuscript.

Funding

This research received no external funding.

Institutional Review Board Statement

Not applicable.

Data Availability Statement

Data is contained within the article.

Conflicts of Interest

The authors declare no conflict of interest.

Abbreviations

AFCAlkaline Fuel Cell
CCUSCarbon Capture, Utilisation, and Storage
CFCChlorofluorocarbons
CHPCombined Heat and Power
COPCoefficient of Performance
DMFCDirect Methanol Fuel Cell
DSMRDirect Steam Methane Reforming
JRCJoint Research Centre
LHHWLangmuir–Hinshelwood–Hougen–Watson
LHVLower Heating Value
GHGGreenhouse Gases
MCFCMolten Carbonate Fuel Cell
PAFCPhosphoric Acid Fuel Cell
PEMFCPolymer Electrolyte Membrane Fuel Cell
PFRPlug Flow Reactor
RCRankine Cycle
SMRSteam Methane Reforming
SOFCSolid Oxide Fuel Cell
SOFC-GTSolid Oxide Fuel Cell Gas Turbine
VSAVacuum Swing Adsorption
WGSWater Gas Shift

Appendix A

Table A1. Stream results of base case simulation.
Stream NameTemperature (°C)Pressure (bar)Molar Vapour Fraction (−)Mole Flow (kmol/h)Mole Fraction of Component
CH4CO2H2H2ON2COO2NH3
Fuel streamsFS-135.001.010.996980.970.61750.332500.05000000
FS-235.001.011.000080.720.61940.333500.04700000
FS-350.011.201.000080.720.61940.333500.04700000
A-EXH-11850.001.201.0000352.1100.36360.07840.496000.062100
FS-4684.421.201.0000432.820.11550.35800.06380.412200.050500
FS-5649.991.201.0000525.150.00730.27700.29830.269800.147500
A-EXH-1850.001.201.0000532.8200.36360.07840.496000.062100
A-EXH-21850.001.201.0000180.7200.36360.07840.496000.062100
Air streamsAS-125.001.001.00002301.7600000.790000.21000
AS-244.871.201.00002301.7600000.790000.21000
AS-3650.001.201.00002301.7600000.790000.21000
SOFC-M650.001.201.000087.310000001.00000
C-EXH-1650.001.201.00002214.4900000.821100.17890
C-EXH-2850.001.201.00002214.4900000.821100.17890
Flue gas streamsFG-1930.121.201.00002382.5200.032300.04360.763200.16090
FG-11930.121.201.00001859.1800.032300.04360.763200.16090
FG-12930.121.201.00001043.5700.032300.04360.763200.16090
FG-13930.121.201.0000815.6100.032300.04360.763200.16090
FG-14652.761.201.00001043.5700.032300.04360.763200.16090
FG-15776.021.201.00001859.1800.032300.04360.763200.16090
FG-1654.871.201.00001859.1800.032300.04360.763200.16090
FG-21930.121.201.0000523.3400.032300.04360.763200.16090
FG-22727.651.201.0000523.3400.032300.04360.763200.16090
FG-23654.151.201.0000523.3400.032300.04360.763200.16090
FG-24367.641.201.0000523.3400.032300.04360.763200.16090
FG-2544.941.201.0000523.3400.032300.04360.763200.16090
FG-252.691.201.00002382.5200.032300.04360.763200.16090
FG-352.691.201.00002382.5200.032300.04360.763200.16090
CC and liqueficationCC-152.691.201.000075.6100.997000.00010.002400.00050
CC-2147.253.301.000075.6100.997000.00010.002400.00050
CC-340.003.301.000075.6100.997000.00010.002400.00050
CC-4132.889.101.000075.6100.997000.00010.002400.00050
CC-540.009.101.000075.6100.997000.00010.002400.00050
CC-6134.3525.061.000075.6100.997000.00010.002400.00050
CC-740.0025.061.000075.6100.997000.00010.002400.00050
CC-8137.3969.001.000075.6100.997000.00010.002400.00050
CC-940.0069.001.000075.6100.997000.00010.002400.00050
CC-1018.0069.001.000075.6100.997000.00010.002400.00050
HP cycle streamsHP-18.015.680.19758.8000000001.0000
HP-28.015.681.00008.8000000001.0000
HP-3145.7223.861.00008.8000000001.0000
HP-456.4623.8608.8000000001.0000
Hot water for sanitary useSHW-C-130.001.000135.140001.00000000
SHW-H-160.001.000135.140001.00000000
SHW-C-230.001.000118.960001.00000000
SHW-H-260.001.000118.960001.00000000
SHW-C-330.001.000129.830001.00000000
SHW-H-360.001.000129.830001.00000000
SHW-C-430.001.000184.140001.00000000
SHW-H-460.001.000184.140001.00000000
SHW-C-530.001.00079.130001.00000000
SHW-H-560.001.00079.130001.00000000
SHW-160.001.000647.200001.00000000
SHW-260.046.000647.200001.00000000
RC streamsHPW-134.94100.000200.510001.00000000
HPW-234.94100.000200.510001.00000000
HPW-3310.09100.000200.510001.00000000
HPS-1310.09100.001.0000200.510001.00000000
SHPS-1700.00100.001.0000200.510001.00000000
LPS-1288.795.001.0000200.510001.00000000
SLPS-1463.005.001.0000200.510001.00000000
VPS-135.680.051.0000200.510001.00000000
VPW-134.200.050200.510001.00000000
CW-19.001.00037,577.170001.00000000
CW-29.025.00037,577.170001.00000000
CW-312.005.00037,577.170001.00000000
Waste streamsWS-135.001.0100.250001.00000000
WS-2 0.0000000000
WS-352.691.201.00002306.9000.000700.04500.788200.16620
Table A2. Energy streams of base case simulation.
Process Unit (−)Heat or Work (kW)
Consumed powerC-112.99
C-2390.09
C-384.06
C-480.02
C-577.73
C-671.45
C-711.96
RC-P-113.40
RC-P-298.06
DH-P2.22
Generated powerSOFC6821.81
RC-HPT770.84
RC-LPT797.88
Integrated heatR-12772.07
SOFC—Air heating4085.11
AS-HE-111,905.43
CC-HE-542.41
RC-HPWH1431.95
RC-HPSG1359.18
RC-SHPSG1021.27
RC-LPSR362.10
UtilitiesRC-COND2535.94
Useful heatCC-HE-191.83
CC-HE-280.84
CC-HE-388.22
CC-HE-4125.12
CC-HE-653.77

References

  1. Jiang, Z.; Rahman Mahmud, A.; Maneengam, A.; Nassani, A.A.; Haffar, M.; The Cong, P. Non Linear Effect of Biomass, Fossil Fuels and Renewable Energy Usage on the Economic Growth: Managing Sustainable Development through Energy Sector. Fuel 2022, 326, 124943. [Google Scholar] [CrossRef]
  2. Mirza, Z.T.; Anderson, T.; Seadon, J.; Brent, A. A Thematic Analysis of the Factors That Influence the Development of a Renewable Energy Policy. Renew. Energy Focus 2024, 49, 100562. [Google Scholar] [CrossRef]
  3. Sheng, M.S.; Sharp, B.; Yi, M.; Wen, L.; Suomalainen, K. A Cointegration Analysis of New Zealand’s Economic Development, Fossil Fuel Usage and Transport Emissions. Case Stud. Transp. Policy 2022, 10, 2497–2505. [Google Scholar] [CrossRef]
  4. Liu, G.; Ofori, C.; Ampong, S.A.; Appiah-Twum, F.; Alhassan, E.A. Towards a Sustainable Environment: Examining the Spatial VARIATIONS of Renewable Energy, Environmental Pollution, and Economic Growth in Europe. Energy Strategy Rev. 2023, 50, 101231. [Google Scholar] [CrossRef]
  5. Herwartz, H.; Theilen, B.; Wang, S. Unraveling the Structural Sources of Oil Production and Their Impact on CO2 Emissions. Energy Econ. 2024, 132, 107488. [Google Scholar] [CrossRef]
  6. Cary, M.; Stephens, H.M. Economic, Environmental, and Technical Gains from the Kyoto Protocol: Evidence from Cement Manufacturing. Resour. Policy 2024, 91, 104926. [Google Scholar] [CrossRef]
  7. Nyangchak, N. Assessing Renewable Energy Efficiency and Policies: A Combined Analysis of LMDI, Super-SBM, and Fieldwork in Qinghai, China. Energy Sustain. Dev. 2024, 80, 101420. [Google Scholar] [CrossRef]
  8. Xu, G.; Yang, M.; Li, S.; Jiang, M.; Rehman, H. Evaluating the Effect of Renewable Energy Investment on Renewable Energy Development in China with Panel Threshold Model. Energy Policy 2024, 187, 114029. [Google Scholar] [CrossRef]
  9. Nath, F.; Mahmood, M.N.; Yousuf, N. Recent Advances in CCUS: A Critical Review on Technologies, Regulatory Aspects and Economics. Geoenergy Sci. Eng. 2024, 238, 212726. [Google Scholar] [CrossRef]
  10. Zhang, Q.; Liu, J.; Wang, G.; Gao, Z. A New Optimization Model for Carbon Capture Utilization and Storage (CCUS) Layout Based on High-Resolution Geological Variability. Appl. Energy 2024, 363, 123065. [Google Scholar] [CrossRef]
  11. Gupta, N.C.; Tanwar, R.; Dipesh; Kaushik, A.; Singh, R.; Patra, A.K.; Sar, P.; Khakharia, P. Perspectives on CCUS Deployment on Large Scale in India: Insights for Low Carbon Pathways. Carbon Capture Sci. Technol. 2024, 12, 100195. [Google Scholar] [CrossRef]
  12. Petrovič, A.; Stergar, J.; Škodič, L.; Rašl, N.; Cenčič Predikaka, T.; Čuček, L.; Goričanec, D.; Urbancl, D. Thermo-Kinetic Analysis of Pyrolysis of Thermally Pre-Treated Sewage Sludge from the Food Industry. Therm. Sci. Eng. Prog. 2023, 42, 101863. [Google Scholar] [CrossRef]
  13. Trop, P.; Agrez, M.; Urbancl, D.; Goricanec, D. Co-Gasification of Torrefied Wood Biomass and Sewage Sludge. In Computer Aided Chemical Engineering; Elsevier: Portorož, Slovenia, 2016; Volume 38, pp. 2229–2234. ISBN 978-0-444-63428-3. [Google Scholar]
  14. Goričanec, D.; Ivanovski, I.; Krope, J.; Urbancl, D. The Exploitation of Low-Temperature Hot Water Boiler Sources with High-Temperature Heat Pump Integration. Energies 2020, 13, 6311. [Google Scholar] [CrossRef]
  15. Babaharra, O.; Choukairy, K.; Faraji, H.; Hamdaoui, S. Improved Heating Floor Thermal Performance by Adding PCM Microcapsules Enhanced by Single and Hybrid Nanoparticles. Heat Trans. 2023, 52, 3817–3838. [Google Scholar] [CrossRef]
  16. Kahraman, H.; Akın, Y. Recent Studies on Proton Exchange Membrane Fuel Cell Components, Review of the Literature. Energy Convers. Manag. 2024, 304, 118244. [Google Scholar] [CrossRef]
  17. Guo, X.; Hu, X.; Zhang, S. Application Status of Variable-Frequency Drive in Hydrogen Fuel Cell Air Compressors from an Industrial Viewpoint: A Review. Sustain. Energy Technol. Assess. 2024, 64, 103716. [Google Scholar] [CrossRef]
  18. Tariq, A.H.; Kazmi, S.A.A.; Hassan, M.; Muhammed Ali, S.A.; Anwar, M. Analysis of Fuel Cell Integration with Hybrid Microgrid Systems for Clean Energy: A Comparative Review. Int. J. Hydrogen Energy 2024, 52, 1005–1034. [Google Scholar] [CrossRef]
  19. Sinha, A.A.; Srivastava, K.; Rajpoot, A.S.; Choudhary, T.; Pandey, S.P.; Sanjay. A Thermodynamic Approach to Analyze Energy, Exergy, Emission, and Sustainability (3E-S) Performance by Utilizing Low Temperature Waste Heat in SOFC–CHP-TEG System. Int. J. Hydrogen Energy 2024, 63, 1088–1104. [Google Scholar] [CrossRef]
  20. Zhang, X.; Liu, W.; Pan, J.; Zhao, B.; Yi, Z.; He, X.; Liu, Y.; Li, H. Comprehensive Performance Assessment of a Novel Biomass-Based CCHP System Integrated with SOFC and HT-PEMFC. Energy 2024, 295, 131112. [Google Scholar] [CrossRef]
  21. Wang, N.; Wang, D.; Xing, Y.; Shao, L.; Afzal, S. Application of Co-Evolution RNA Genetic Algorithm for Obtaining Optimal Parameters of SOFC Model. Renew. Energy 2020, 150, 221–233. [Google Scholar] [CrossRef]
  22. Salam, A.; Zholobko, O.; Wu, X.-F. Roles of Functionalized Nanoparticles in the Performance Improvement of Proton-Exchange Membranes Used in Low- and Intermediate-Temperature Hydrogen Fuel Cells: A Review. Prog. Nat. Sci. Mater. Int. 2024; in press. [Google Scholar] [CrossRef]
  23. Liang, W.; Han, J.; Zhu, W.; Yang, J.; Lv, W.; Liu, C. A Novel Pathway for Achieving Efficient Integration of SOFC/SOEC and Addressing Photovoltaic Duck Curve Challenge. Energy Convers. Manag. 2024, 306, 118326. [Google Scholar] [CrossRef]
  24. Hagen, A.; Caldogno, R.; Sun, X. Direct Ammonia SOFC—A Potential Technology for Green Shipping. Fuel 2024, 365, 131238. [Google Scholar] [CrossRef]
  25. Yang, P.; Zhang, Y.; Yang, C.; Chen, J.; Liu, Z.; Deng, C.; Yang, S. Thermodynamic Performance Comparison of a SOFC System Integrated with Steam Reforming and Dry Reforming by Utilizing Different Fuels. Energy Convers. Manag. 2024, 300, 117981. [Google Scholar] [CrossRef]
  26. Liu, L.; Duan, L.; Zheng, N.; Wang, Q.; Zhang, M.; Xue, D. Thermodynamic Performance Evaluation of a Novel Solar-Assisted Multi-Generation System Driven by Ammonia-Fueled SOFC with Anode Outlet Gas Recirculation. Energy 2024, 294, 130845. [Google Scholar] [CrossRef]
  27. Kim, H.; Lee, J.; Gokbayrak, A.A.; Seo, Y.; Oh, S.; Oh, M.J.; Jun, Y.; Son, J.-W.; Yang, S. Characterization of Direct-Ammonia Solid Oxide Fuel Cells (DA-SOFCs) at 650–750 °C in a Single-Repeating Unit Stack: Effects of Metallic Components and Residual Ammonia. Int. J. Hydrogen Energy 2024, 68, 1312–1321. [Google Scholar] [CrossRef]
  28. Narayanan, M.; Mengedoht, G.; Commerell, W. Evaluation of SOFC-CHP’s Ability to Integrate Thermal and Electrical Energy System Decentrally in a Single-Family House with Model Predictive Controller. Sustain. Energy Technol. Assess. 2021, 48, 101643. [Google Scholar] [CrossRef]
  29. Ismael, I.; El-Fergany, A.A.; Gouda, E.A.; Kotb, M.F. Cooperation Search Algorithm for Optimal Parameters Identification of SOFCs Feeding Electric Vehicle at Steady and Dynamic Modes. Int. J. Hydrogen Energy 2024, 50, 1395–1407. [Google Scholar] [CrossRef]
  30. Zarabi Golkhatmi, S.; Asghar, M.I.; Lund, P.D. A Review on Solid Oxide Fuel Cell Durability: Latest Progress, Mechanisms, and Study Tools. Renew. Sustain. Energy Rev. 2022, 161, 112339. [Google Scholar] [CrossRef]
  31. Rola, K.; Gruber, S.; Urbancl, D.; Goričanec, D. Utilisation of Renewable Electricity to Produce Synthetic Methane. Energies 2023, 16, 6871. [Google Scholar] [CrossRef]
  32. Energy Security–Topics. Available online: https://www.iea.org/topics/energy-security (accessed on 15 May 2024).
  33. Corigliano, O.; Pagnotta, L.; Fragiacomo, P. On the Technology of Solid Oxide Fuel Cell (SOFC) Energy Systems for Stationary Power Generation: A Review. Sustainability 2022, 14, 15276. [Google Scholar] [CrossRef]
  34. Dell, R.M.; Moseley, P.T.; Rand, D.A.J. Hydrogen, Fuel Cells and Fuel Cell Vehicles. In Towards Sustainable Road Transport; Elsevier: Oxford, UK, 2014; pp. 260–295. ISBN 978-0-12-404616-0. [Google Scholar]
  35. Zhou, J.; Wang, Z.; Han, M.; Sun, Z.; Sun, K. Optimization of a 30 kW SOFC Combined Heat and Power System with Different Cycles and Hydrocarbon Fuels. Int. J. Hydrogen Energy 2022, 47, 4109–4119. [Google Scholar] [CrossRef]
  36. Alaedini, A.H.; Tourani, H.K.; Saidi, M. A Review of Waste-to-Hydrogen Conversion Technologies for Solid Oxide Fuel Cell (SOFC) Applications: Aspect of Gasification Process and Catalyst Development. J. Environ. Manag. 2023, 329, 117077. [Google Scholar] [CrossRef] [PubMed]
  37. Meng, T.; Cui, D.; Shi, Y.; Ji, Y.; Cheng, M.; Tu, B.; Lan, Z. Performance Evaluation of High-Efficiency SOFC-PEMFC Hybrid System Fueled by Liquid Ammonia. Int. J. Hydrogen Energy 2023, 48, 30887–30898. [Google Scholar] [CrossRef]
  38. Tan, L.; Chen, C.; Gong, Z.; Xia, L. Performance Evaluation on a Novel Combined Cool/Heat and Power (CCP/CHP) System Integrating an SOFC-GT Plant with a Solar-Assisted LiBr Absorption Cooling/Heating Unit. Energy 2023, 283, 129102. [Google Scholar] [CrossRef]
  39. Liang, W.; Han, J.; Ge, Y.; Zhu, W.; Yang, J.; Lv, W.; Liu, C. Investigation on Combining Multi-Effect Distillation and Double-Effect Absorption Refrigeration Cycle to Recover Exhaust Heat of SOFC-GT System. Energy Convers. Manag. 2024, 301, 118054. [Google Scholar] [CrossRef]
  40. Roy, D.; Samanta, S.; Roy, S.; Smallbone, A.; Roskilly, A.P. Techno-Economic Analysis of Solid Oxide Fuel Cell-Based Energy Systems for Decarbonising Residential Power and Heat in the United Kingdom. Green Chem. 2024, 26, 3979–3994. [Google Scholar] [CrossRef]
  41. Gruber, S.; Rola, K.; Urbancl, D.; Goričanec, D. Carbon-Free Heat Production for High-Temperature Heating Systems. Sustainability 2023, 15, 15063. [Google Scholar] [CrossRef]
  42. Yang, S.; Wang, G.; Liu, Z.; Deng, C.; Xie, N. Energy, Exergy and Exergo-Economic Analysis of a Novel SOFC Based CHP System Integrated with Organic Rankine Cycle and Biomass Co-Gasification. Int. J. Hydrogen Energy 2024, 53, 1155–1169. [Google Scholar] [CrossRef]
  43. Sun, S.; Guo, X.; Zhang, H.; Li, Y.; He, Z.; Li, C. Design and Sensitivity Analysis of a Multistage Solid Oxide Fuel Cell Hybrid System with an Inter-Cooled-Recuperated Gas Turbine and Organic Rankine Cycle. Energy 2024, 286, 129561. [Google Scholar] [CrossRef]
  44. Nourpour, M.; Khoshgoftar Manesh, M.H. Availability and 6E Assessment and Optimal Design of a Novel Cogeneration System Based on Integrated Turbo Compressor Station-SOFC-Solar-Geothermal-Steam and Organic Rankine Cycles with Machine Learning. Renew. Energy 2023, 215, 118908. [Google Scholar] [CrossRef]
  45. Singh, U.R.; Bhogilla, S. Exergy Analysis of Reversible Sofc Coupled with Organic Rankine Cycle and Hydrogen Storage for Renewable Energy Storage. Int. J. Hydrogen Energy 2023, 48, 39169–39181. [Google Scholar] [CrossRef]
  46. Wang, J.; Tian, H.; Wang, X.; Li, L.; Sun, R.; Bian, X.; Shu, G.; Liang, X. Process Design Methodology for Rankine Cycle Based on Heat Matching. Renew. Sustain. Energy Rev. 2024, 193, 114295. [Google Scholar] [CrossRef]
  47. Kabeyi, M.J.B.; Olanrewaju, O.A. Biogas Production and Applications in the Sustainable Energy Transition. J. Energy 2022, 2022, 8750221. [Google Scholar] [CrossRef]
  48. AspenTech. Available online: https://www.aspentech.com/ (accessed on 10 March 2024).
  49. Athanasiou, C.; Drosakis, C.; Booto, G.K.; Elmasides, C. Economic Feasibility of Power/Heat Cogeneration by Biogas–Solid Oxide Fuel Cell (SOFC) Integrated Systems. Energies 2022, 16, 404. [Google Scholar] [CrossRef]
  50. He, V.; Gaffuri, M.; Van Herle, J.; Schiffmann, J. Readiness Evaluation of SOFC-MGT Hybrid Systems with Carbon Capture for Distributed Combined Heat and Power. Energy Convers. Manag. 2023, 278, 116728. [Google Scholar] [CrossRef]
  51. Doherty, W.; Reynolds, A.; Kennedy, D. Computer Simulation of a Biomass Gasification-Solid Oxide Fuel Cell Power System Using Aspen Plus. Energy 2010, 35, 4545–4555. [Google Scholar] [CrossRef]
  52. Doherty, W. Modelling and Simulation of a Biomass Gasification-Solid Oxide Fuel Cell Combined Heat and Power Plant Using Aspen Plus. In Proceedings of the 22nd International Conference on Efficiency, Cost, Optimization, Simulation and Environmental Impact of Energy Systems, Foz Do Iguaçu, Brazil, 30 August–3 September 2009. [Google Scholar] [CrossRef]
  53. Rashid, K.; Dong, S.K.; Mehran, M.T.; Lee, D.W. Design and Analysis of Compact Hotbox for Solid Oxide Fuel Cell Based 1 kW-Class Power Generation System. Appl. Energy 2017, 208, 620–636. [Google Scholar] [CrossRef]
  54. Duan, L.; Zhang, X.; Yang, Y. Exergy Analysis of a Novel SOFC Hybrid System with Zero-CO2 Emission. In Advances in Gas Turbine Technology; Benini, E., Ed.; InTech: London, UK, 2011; ISBN 978-953-307-611-9. [Google Scholar]
  55. Großmann, K.; Treiber, P.; Karl, J. Steam Methane Reforming at Low S/C Ratios for Power-to-Gas Applications. Int. J. Hydrogen Energy 2016, 41, 17784–17792. [Google Scholar] [CrossRef]
  56. General Information about CO2. Available online: https://www.ascoco2.com/us/co2-production-and-co2-recovery-plants/general-information-about-co2 (accessed on 24 April 2024).
  57. ISEP. The 4th Generation District Heating and Japan’s Thermal Policy; Institute for Sustainable Energy Policies: Kyoto, Japan, 2022. [Google Scholar]
  58. Sommer, T.; Mennel, S.; Sulzer, M. Lowering the Pressure in District Heating and Cooling Networks by Alternating the Connection of the Expansion Vessel. Energy 2019, 172, 991–996. [Google Scholar] [CrossRef]
  59. Lund, H.; Thorsen, J.E.; Jensen, S.S.; Madsen, F.P. Fourth-Generation District Heating and Motivation Tariffs. ASME Open J. Eng. 2022, 1, 011002. [Google Scholar] [CrossRef]
  60. Xu, J.; Froment, G.F. Methane Steam Reforming, Methanation and Water-gas Shift: I. Intrinsic Kinetics. AIChE J. 1989, 35, 88–96. [Google Scholar] [CrossRef]
  61. Pashchenko, D.; Mustafin, R.; Mustafina, A. Steam Methane Reforming in a Microchannel Reformer: Experiment, CFD-Modelling and Numerical Study. Energy 2021, 237, 121624. [Google Scholar] [CrossRef]
  62. Abbas, S.Z.; Dupont, V.; Mahmud, T. Kinetics Study and Modelling of Steam Methane Reforming Process over a NiO/Al2O3 Catalyst in an Adiabatic Packed Bed Reactor. Int. J. Hydrogen Energy 2017, 42, 2889–2903. [Google Scholar] [CrossRef]
  63. Hou, K.; Hughes, R. The Kinetics of Methane Steam Reforming over a Ni/α-Al2O Catalyst. Chem. Eng. J. 2001, 82, 311–328. [Google Scholar] [CrossRef]
  64. Wójcik, M.; Szabłowski, Ł.; Dybiński, O. Comparison of Mathematical Models of Steam Methane Reforming Process for the Needs of Fuel Cells. Int. J. Hydrogen Energy 2024, 52, 965–982. [Google Scholar] [CrossRef]
  65. Fan, L.; Mokhov, A.; Saadabadi, S.A.; Brandon, N.; Aravind, P.V. Methane Steam Reforming Reaction in Solid Oxide Fuel Cells: Influence of Electrochemical Reaction and Anode Thickness. J. Power Sources 2021, 507, 230276. [Google Scholar] [CrossRef]
  66. Yun, J.; Kim, Y.; Yu, S. Interactive Heat Transfer Characteristics of 5 kW Class Shell-and-Tube Methane Steam Reformer with Intermediate Temperature Heat Source. Int. J. Hydrogen Energy 2020, 45, 21767–21778. [Google Scholar] [CrossRef]
  67. Thermodynamics. Available online: https://www.doitpoms.ac.uk/tlplib/fuel-cells/sofc_thermodynamics.php (accessed on 16 April 2024).
  68. Liu, J.; Ma, C.; Zhu, Q.; Wang, H.; Huo, D.; Zhao, J. Study on Optimization Characteristics of Methanol Combustion Cooker Based on Porous Media. Case Stud. Therm. Eng. 2024, 58, 104269. [Google Scholar] [CrossRef]
  69. Hossan, Md.N.; Ahmed, M.M.; Siddhpura, M.; Ananno, A.A.; Masud, M.H. Methanol Production From Biogas: Current Status and Future Prospects. In Reference Module in Chemistry, Molecular Sciences and Chemical Engineering; Elsevier: Amsterdam, The Netherlands, 2023; p. B9780443157400000033. ISBN 978-0-12-409547-2. [Google Scholar]
  70. Wang, J.; Al-attab, K.A.; Yew Heng, T. Techno-Economic and Thermodynamic Analysis of Solid Oxide Fuel Cell Combined Heat and Power Integrated with Biomass Gasification and Solar Assisted Carbon Capture and Energy Utilization System. Energy Convers. Manag. 2023, 280, 116762. [Google Scholar] [CrossRef]
  71. 11 Gibbs Free Energy and Equilibrium. Available online: https://chem.libretexts.org/Courses/Grand_Rapids_Community_College/CHM_120_-_Survey_of_General_Chemistry(Neils)/7%3A_Equilibrium_and_Thermodynamics/7.11%3A_Gibbs_Free_Energy_and_Equilibrium (accessed on 24 April 2024).
  72. Gibbs (Free) Energy. Available online: https://chem.libretexts.org/Bookshelves/Physical_and_Theoretical_Chemistry_Textbook_Maps/Supplemental_Modules_(Physical_and_Theoretical_Chemistry)/Thermodynamics/Energies_and_Potentials/Free_Energy/Gibbs_(Free)_Energy (accessed on 24 April 2024).
  73. Carbon Monoxide. Available online: https://webbook.nist.gov/cgi/cbook.cgi?ID=C630080&Units=SI&Mask=1#Thermo-Gas (accessed on 17 April 2024).
  74. Carbon Dioxide. Available online: https://webbook.nist.gov/cgi/cbook.cgi?Source=1927LOW%2FERI2729-2734&Units=SI&Mask=7 (accessed on 17 April 2024).
  75. Mika, M.T. Synthesis of Carbide Derived Carbon by Reactive Anode Electrolysis in Molten Chloride Salts. Ph.D. Thesis, University of Illinois at Chicago, Chicago, IL, USA, 2018. [Google Scholar]
  76. Ozbek, B.B.; Aydın, H.; Merey, Ş. Ground Source Cooling to Increase Power Generation from Geothermal Power Plants. Energy 2024, 292, 130649. [Google Scholar] [CrossRef]
  77. Srivastava, M.; Sarkar, J.; Sarkar, A.; Maheshwari, N.K.; Antony, A. Thermo-Economic Feasibility Study to Utilize ORC Technology for Waste Heat Recovery from Indian Nuclear Power Plants. Energy 2024, 298, 131338. [Google Scholar] [CrossRef]
  78. Zhang, M.; Chen, H.; Zoghi, M.; Habibi, H. Comparison between Biogas and Pure Methane as the Fuel of a Polygeneration System Including a Regenerative Gas Turbine Cycle and Partial Cooling Supercritical CO2 Brayton Cycle: 4E Analysis and Tri-Objective Optimization. Energy 2022, 257, 124695. [Google Scholar] [CrossRef]
  79. Xu, L.; Chauhan, B.S.; Salah, B.; Thinh, P.-H. Development of an Innovative High-Performance Poly-Generation Plant for Efficient Multi-Level Heat Recovery of a Biogas-Powered Micro Gas Turbine: Environmental and Multi-Criteria Analysis. Process Saf. Environ. Prot. 2023, 178, 748–764. [Google Scholar] [CrossRef]
  80. Akay, S.S.; Özcan, O.; Özcan, O.; Yetemen, Ö. Efficiency Analysis of Solar Farms by UAV-Based Thermal Monitoring. Eng. Sci. Technol. Int. J. 2024, 53, 101688. [Google Scholar] [CrossRef]
  81. Nishinaga, J.; Kamikawa, Y.; Sugaya, T.; Ishizuka, S. Comparison of Polycrystalline and Epitaxial Cu(In, Ga)Se2 Solar Cells with Conversion Efficiencies of More than 21%. Sol. Energy Mater. Sol. Cells 2024, 269, 112791. [Google Scholar] [CrossRef]
  82. Hao, Q.; Zhu, L.; Fan, J.; Wang, Y.; Yang, Z.; Yang, H.; Huang, Y. Zero-Energy Penalty Carbon Capture and Utilization System Based on CLHG Integrating SOFC for Power and Methanol Cogeneration. Energy Convers. Manag. 2023, 295, 117658. [Google Scholar] [CrossRef]
  83. Chuahy, F.D.F.; Kokjohn, S.L. Solid Oxide Fuel Cell and Advanced Combustion Engine Combined Cycle: A Pathway to 70% Electrical Efficiency. Appl. Energy 2019, 235, 391–408. [Google Scholar] [CrossRef]
  84. Lim, T.-W.; Hwang, D.-H.; Choi, Y.-S. Design and Optimization of a Steam Methane Reformer for Ship-Based Hydrogen Production on LNG-Fueled Ship. Appl. Therm. Eng. 2024, 243, 122588. [Google Scholar] [CrossRef]
  85. Jiao, Y.; Wang, C.; Zhang, L.; An, W.; Zhou, N.; Yang, G.; Wang, W.; Zhou, W.; Li, S. A Steel Slag–Derived Boudouard Reaction Catalyst for Improved Performance of Direct Carbon Solid Oxide Fuel Cells. Int. J. Energy Res. 2019, 43, 6970–6982. [Google Scholar] [CrossRef]
Figure 1. Flowchart of the proposed scheme.
Sustainability 16 04389 g001
Figure 2. Aspen Plus flowsheet of the proposed process scheme. The different stream colours represent the fresh and exhausted fuel (purple), air and depleted air (turquoise), flue gases and captured CO2 (red), water in RC (blue), hot water for domestic use (dark blue), and refrigerant R717 cycle (green).
Sustainability 16 04389 g002
Figure 3. Temperature–entropy diagram of the RC, generated with Aspen Plus V12.1, used in simulations. The numbers beside the isobars represent the pressure of the corresponding isobar in bar.
Sustainability 16 04389 g003
Figure 4. Reactor composition and Kp/Qp ratio profile (a), and temperature profile of reactor (b).
Sustainability 16 04389 g004
Figure 5. Electrical and overall efficiency of the system (a), air utilisation (b), combustion temperature and flowrate of depleted air (c), and Kp/Qp ratio (d) at different SOFC operating temperatures (the curves of the same colours indicate the same SOFC operating temperature, while the circular and square data markers represent data sets for the primary and secondary axis, respectively).
Sustainability 16 04389 g005
Figure 6. The effect of fuel utilisation on combustion temperature and flowrate of recycled fuel (a), electrical and overall efficiency, and produced power in RC (b), total CH4 conversion in reformer (c), and air utilisation (d) (on figures (c,d), the curves of the same colour indicate the same SOFC operating temperature).
Sustainability 16 04389 g006aSustainability 16 04389 g006b
Figure 7. The effect of S/C ratio on reformer outlet composition, total CH4 conversion, and Qp/Kp ratio at operating temperatures of 750 °C/550 °C (a), 850 °C/650 °C (b), and 950 °C/750 °C (c).
Sustainability 16 04389 g007
Figure 8. Air utilisation (a), combustion temperature and flowrate recycled fuel in hydrogen equivalents (b), electrical and overall efficiency of the system (c), and SOFC electrical efficiency and H2 flowrate at anode inlet (d), at different SOFC/reformer operating temperatures (the curves of the same colours indicate the same SOFC/reformer operating temperature, while the circular and square data markers represent data sets for primary and secondary axis, respectively).
Sustainability 16 04389 g008
Table 1. Parameters used to model the reformer, adapted from Xu and Froment [60].
Kinetic parameters; represented by Arrhenius equation: k i =   k 0 ,   i   e E a , i R   T
Reaction i k 0 ,   i  (kmol/(kgcat s)) E a , i  (kJ/mol)
SMR 3.71   ×   10 14 Pa0.5240.10
WGS 5.43   × 10 3 Pa−167.13
DSMR 8.96   ×   10 13 Pa0.5243.90
Adsorption parameters; represented by Van’t Hoff equation: K j =   K 0 ,   j e Δ H j R   T
Component j K 0 ,   j Δ H j  (kJ/mol)
CO 8.23   × 10 10 Pa−1−70.65
H2 6.12   ×   10 14 Pa−1−82.90
CH4 6.65   × 10 9 Pa−1−38.28
H2O 1.77   ×   10 5 88.68
Reaction equilibria
Reaction iEquilibrium equation
SMR K eq ,   SMR   = 1.198   ×   10 23   e 26 , 830   K T Pa 2
WGS K eq ,   WGS = 1.767   ×   10 2   e 4   400   K T  
DSMR K eq ,   D SMR = 2.117   ×   10 21   e   22 , 430   K T Pa 2
Where k0, i, and Ea, i are pre-exponential factors of reaction and activation energy of reaction i, respectively; R is universal gas constant; T is temperature; K0, j, and ΔHj are the pre-exponential factors of adsorption constant expression, and enthalpy change of adsorption of component j, respectively.
Table 2. Investigated reformer temperatures for different SOFC operating temperatures.
SOFC Operating Temperature (°C)Investigated Reformer Temperatures (°C)
750550, 575, 600
800575, 600, 625, 650
850600, 625, 650, 675, 700
900625, 650, 675, 700, 725, 750
950650, 700, 750, 800
Table 3. Key results of the base simulation.
ParameterValueUnit
Biogas flowrate80.97kmol/h
CH4 fraction0.6175
CO2 fraction0.3325
H2O fraction0.0500
Reformer inlet temperature684.42°C
Reformer CH4 conversion0.9233
S/C2.5
Reformer operating/SOFC inlet fuel temperature649.99°C
SOFC inlet air temperature650°C
SOFC exhaust temperature850°C
SOFC fuel utilisation0.70
SOFC air utilisation0.1806
Produced power in SOFC6821.81kW
Produced power in RC1568.72kW
SOFC electrical efficiency61.18%
System electrical efficiency67.70%
System overall efficiency71.64%
Refrigerant cycle COP3.55
Flowrate of produced sanitary water11.66m3
Number of possible consumer households231
Disclaimer/Publisher’s Note: The statements, opinions and data contained in all publications are solely those of the individual author(s) and contributor(s) and not of MDPI and/or the editor(s). MDPI and/or the editor(s) disclaim responsibility for any injury to people or property resulting from any ideas, methods, instructions or products referred to in the content.

