Article

A Knowledge Graph-Driven Analysis of the Interlinkages among the Sustainable Development Goal Indicators in Different Spatial Resolutions

by
Christina Maria Androna
,
Ioanna Mandilara
,
Eleni Fotopoulou
,
Anastasios Zafeiropoulos
* and
Symeon Papavassiliou
Institute of Communication and Computer Systems, National Technical University of Athens, 15773 Athens, Greece
*
Author to whom correspondence should be addressed.
Sustainability 2024, 16(11), 4328; https://doi.org/10.3390/su16114328
Submission received: 13 April 2024 / Revised: 16 May 2024 / Accepted: 20 May 2024 / Published: 21 May 2024

Abstract

:
The way towards sustainable development is paved through the commitment to the 17 Sustainable Development Goals (SDGs), which encompass a wide range of global challenges. The successful progress of these goals depends on the identification and understanding of their interconnected nature. A plethora of data is made available for tracking targets related to the SDGs at country, regional and urban levels. However, various challenges are identified to semantically align and homogeneously represent such data to improve their interoperability, comparability and analysis. In the current work, we provide an innovative solution for analyzing SDG-oriented data based on the development of a Knowledge Graph that provides access to semantically aligned data for the SDGs. We consider Knowledge Graphs as a suitable technology for the representation of data related to the interlinkages among SDGs, since they provide a structured representation of knowledge that incorporates entities, relationships and attributes, organized in a graph format. We examine the interlinkages among indicators of the same SDG, as well as across indicators of the various SDGs. Such interlinkages are further evaluated as synergies or trade-offs. Our analysis is applied in country and regional levels, considering various constraints in terms of data quality and availability. In total 476 synergies are identified at the national level among the SDGs, compared to 140 trade-offs. The SDGs that mostly participate in the synergies are SDGs 17, 10, 9 and 8, while SDGs 7 and 16 participate in most of the trade-offs. At the regional level, SDGs 8, 4 and 9 are more active in terms of interlinkages.

1. Introduction

The Sustainable Development Goals (SDGs) are a collection of 17 global goals that were defined by the United Nations (UN) General Assembly in 2015, aiming to act as a blueprint to achieve a better and more sustainable future for all [1,2]. These goals are interconnected and tackle a wide range of social, economic and environmental challenges, including issues related to poverty, hunger, health, education, gender equality, clean water, sustainable energy, economic growth, infrastructure, climate action, peace and justice [1]. The SDGs are considered as interlinked goals, where synergies and trade-offs may exist between SDG pairs [3,4]. When examining the progress towards the achievement of the targets that are defined per SDG, it is important to shed some light in the interlinkages among them, since in this way we can have a holistic understanding of sustainable development challenges and opportunities, and design effective and integrated strategies that maximize positive impacts, minimize trade-offs and avoid unintended consequences [5].
However, even if there is a general consensus that the SDGs are interlinked and should be examined as an interconnected network, various challenges are faced to make network analysis an integral part of the SDG analysis frameworks [6]. One of the main challenges related to the assessment of SDGs in an individual or network-oriented way regards the lack of data in many of the defined SDG indicators. A small part of these indicators is considered to be widely available by the UN Statistical Commission [7]. Many of the indicators are not made available in a majority of countries, significantly reducing the potential for analysis offered by SDG assessment frameworks. Furthermore, another challenge regards the development of solutions that supports analysis of SDGs in different spatial resolutions. To promote the development of targeted solutions to mitigate the climate change impact, SDG analysis is required not only at the national level, but also at regional level and in smaller geographic areas (e.g., specific urban or rural areas). To achieve this, there is a need to monitor and assess SDG indicators based on their disaggregation in various geographical locations. Such a challenge is also highlighted in the SDGs geospatial roadmap provided by the UN Statistics Division [8]. It is stated that the SDG analysis in different geographical levels cannot be fully realized using official statistics alone, particularly when they are not produced in sufficient quality, detail and frequency.
Various enabling technologies can be adopted for this purpose, including spatial data management and machine learning (ML) techniques, combined with the collection of data from Internet of Things (IoT) devices [9,10,11] and satellite infrastructure [12,13]. The combination of IoT and ML technologies can provide solutions that contribute to local monitoring and assessment observatories for the SDGs. Independently of the spatial resolution of the data (national, regional, and local levels), proper data representation and management is crucial. Data have to be semantically aligned, while made available in open, extensible and interoperable repositories [14]. In this way, data quality assessment and re-usability by interdisciplinary scientists can be promoted, enabling the provision of data analysis solutions that can be interoperable, extensible, replicable and comparable.
Under this perspective, in the current manuscript we detail an approach for SDG data analysis over a Knowledge Graph that we have developed, called the SustainGraph [15]. A Knowledge Graph enables us to manage time-series data for various indicators, while examining their relationships in different temporal and spatial resolutions. The SustainGraph supports the tracking of indicators at different spatial resolutions, while a set of data population mechanisms are provided based on data coming from diverse sources (e.g., UN SDG database open APIs, Eurostat, Copernicus, urban repositories). The SustainGraph is made openly available and is based on the provision of open and interoperable Application Programming Interfaces (APIs). To achieve this, various data population mechanisms to introduce data into the SustainGraph are developed [16].
Building upon the existing work around the SustainGraph, in the current work, SDG interlinkages are examined at different geographical levels, including national and regional levels, and a set of insights from the analysis results are presented. The main innovative characteristic of the proposed approach regards the development of SDG analysis mechanisms over an open-source Knowledge Graph that offer access to up-to-date and semantically aligned data. One further distinguishing characteristic of our approach is that it considers data for the SDG indicators provided from both the UN Statistical Commission and the European Union (EU) through Eurostat, while considering the association among the indicators provided by these organizations (e.g., SDG indicator pairs classified as identical or similar). In this way, advanced insights can be extracted based on different SDG monitoring frameworks, while enabling their comparability and potential convergence in the future. Furthermore, the provided methodology is applicable at both national and regional levels, facilitating its adoption by different stakeholders to extract insights and recommendations for sustainable policy making at different levels.
The structure of the manuscript is as follows. In Section 2, we shortly present the related work in the area of data analysis for the Sustainable Development Goals, emphasizing the need for the support of analysis in urban environments. In Section 3, we provide details for the developed framework for SDG data analysis at different spatial resolutions, along with a short overview of the SDG indicators and the structure of the SustainGraph. In Section 4, we describe the methodology that we have followed for the selection and the qualitative assessment of the available indicators, while in Section 5 we provide the produced analysis results for the examined geographical areas. Section 6 highlights some of the identified limitations of the current study, and presents the main outcomes of the analysis as well as a comparison of the produced results with relevant outcomes by other studies. Finally, Section 7 concludes the manuscript with the presentation of the main insights and open research areas.

2. Related Work

In this section, we shortly refer to existing works and approaches for the analysis of SDG indicators, considering the development of knowledge management solutions.

2.1. SDG Interlinkages

In [7], the interlinkages between the SDG indicators are examined based on the data provided through the UN Global SDG Database. Following a Multiple Factor Analysis (MFA) and a Hierarchical Cluster Analysis (HCA), it is detailed that the performance of various countries towards the achievement of the SDG targets is highly related to their income level. A set of synergies and trade-offs between SDG indicators are examined, where a synergy is associated with a positive correlation between the indicators, while a trade-off with a negative correlation. Such synergies and trade-offs are also examined in [17], where focus is given on the effects of urbanization, especially the domains of energy consumption and economic growth, public health and social welfare equality, international cooperation for development, and natural resource use and ecological/environmental impacts. In [5], a review of 51 scientific articles that examine the SDG interlinkages is provided. A set of recurring patterns of SDG interlinkages are identified, once again considering the synergies (e.g., SDGs 4, 6 and 17) and trade-offs among SDGs (e.g., SDGs 14 and 15). In [3], a set of mathematical techniques are provide to quantitatively examine the extent to which these interlinkage networks point to the likelihood of greater progress on some SDGs than on others, while in [6], potential challenges related to data availability for empirical network analysis studies for the SDGs are detailed. It is stated that the SDGs are highly dependent on geographic location and time and, thus, such dimensions have to be considered by the developed frameworks. The study in [18] employs a semantic network analysis with text-mining and Word2Vec machine learning methodology to examine the interlinkages between the SDGs, where the network analysis of the entire SDG target network reveals that each community of closely connected targets comprises targets from multiple SDG goals, while targets within the same SDG goal also belong to different communities.

2.2. SDG Knowledge Management

In addition to the set of analyses that focus purely on the interlinkages, emerging works also appear that tackle aspects related to the knowledge management, openness and interoperability for the data around the SDGs. Such works focus on different spatial resolutions, including country-level, regional-level and city-level analysis (e.g., the work in [16] for spatial data integration in KGs, the work in [19] for spatial data management related to land use, land cover and climate change aspects). In [20], a Unified Urban Knowledge Graph is detailed for knowledge-enhanced urban spatio-temporal predictions, considering data from various sources. In [21], an urban knowledge graph system called as UrbanKG is detailed, which incorporates a knowledge graph with urban computing to support urban data fusion. In [22], KnowWhereGraph is presented as a Knowledge Graph that contains a wide range of integrated datasets at the human–environment interface, along with the development of a set of geospatial enrichment services. In [14], data from various SDG databases (e.g., UN, World Bank Group) are compiled into an unified SDG database, enabling the examination of SDG interactions. The work in [23] provides the outcomes from a systematic review of works that tackle monitoring and analysis of the SDGs. A set of challenges are highlighted related to the national monitoring of the SDGs, especially with regards to aspects related to skills development, sustainability and cost considerations, as well as potential trade-offs in terms of timeliness and quality.

2.3. Motivation and Main Contribution

By considering the existing works and the identified challenges in the areas of knowledge management and analysis for SDG data, our main motivation is to offer an open and interoperable knowledge management solution that can support analysis of SDG data, focusing on the identification of SDG interlinkages, synergies and trade-offs. We consider the Knowledge Graphs as an enabling technology for this purpose, and thus, we build our solution based on the SustainGraph [15]. This leads to analysis of semantically aligned data, boosting the replicability and extensibility of the developed analysis processes, as well as the comparability of the produced results among different geographical areas. Different spatial resolutions are supported to enable analysis at national, regional and local levels. A set of data population processes are supported in SustainGraph based on data coming from existing global or national databases. The data population processes can tackle time-series data, text analysis [24] and data managed in different spatial resolutions [16]. The developed solution is made available as open-source and can be easily adopted and extended to support SDG data analysis at the global and local levels. Interoperability with existing urban platforms can be also supported, given the specification of open Application Programming Interfaces (APIs) for managing the provided data.

3. SDG Interlinkage Analysis over a Knowledge Graph

3.1. SDG Indicators Overview

The 2030 Agenda for Sustainable Development led to the adoption of 248 indicators (231 of which are unique) by the UN Statistical Commission in 2017. This global indicator framework, which is annually updated, aims to monitor the progress towards the SDGs and their targets, as well as assess and inform national policies. In Europe, the European Commission committed to the 2030 Agenda and applied the “Whole-of-Government approach” to implement the SDGs. Eurostat, the statistical office of the European Union (EU), developed the EU SDG indicator set 2023 [25], composed of 102 indicators that are aligned with the UN SDGs. In total, 21 out of these 102 indicators provide data that are targeted also in lower territorial units. In the EU SDG indicator set, certain indicators are multi-purpose, since they are adopted to monitor more than one goal, while others provide a dis-aggregated view and are part of another indicator. The EU indicator set is regularly monitored and annually reviewed to assess the progress of EU countries towards the achievement of the SDG targets. In each review, the indicators, assigned per goal, are updated, including additions, deletions and re-locations among goals, while their relevance with corresponding indicators from the UN SDG indicator set is defined. To properly represent the relationships among the indicators provided by the UN and EU SDG frameworks, their semantic alignment is required. Such an alignment can be provided through a Knowledge Graph, along with the ability to store large time-series datasets in different spatial resolutions.

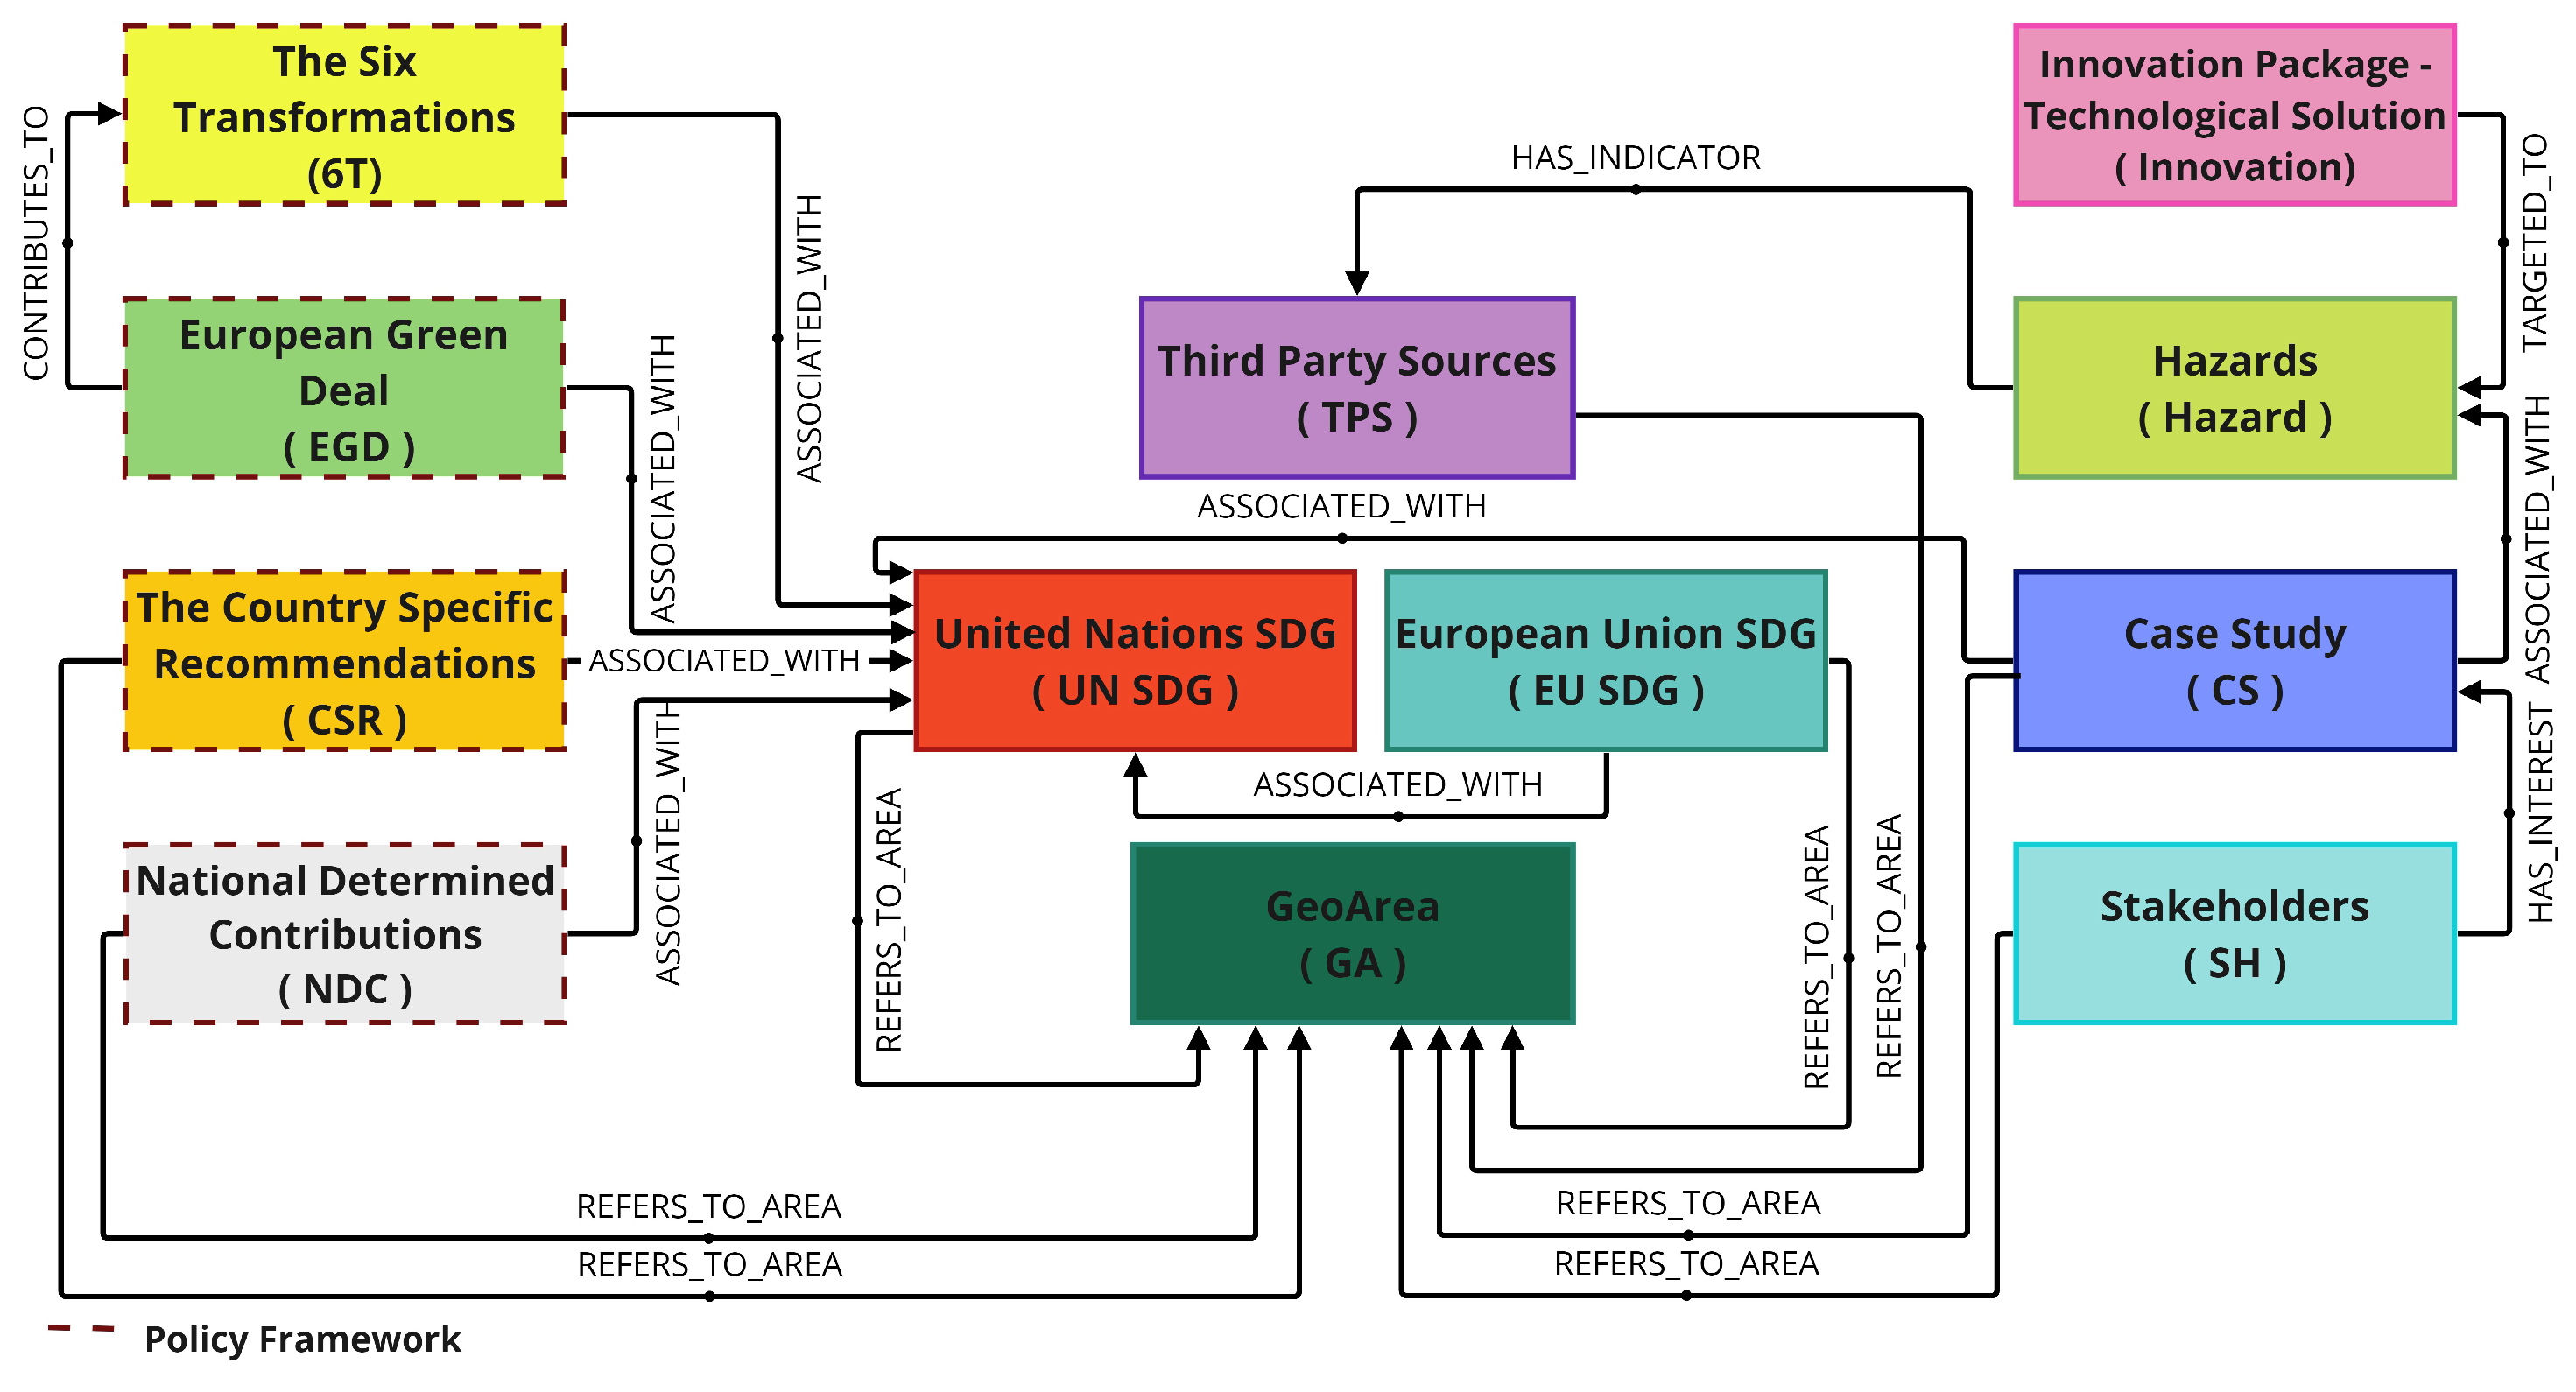
3.2. Overview of the SustainGraph

To monitor the progress toward the achievement of the SDGs and effectively track related data and policy documents, the SustainGraph knowledge graph has been developed. Centered around the SDGs, the SustainGraph interlinks data from diverse sources enabling the extraction of knowledge, insights and correlations across various dimensions of sustainable development, as elaborated in detail in [15].
Figure 1 provides a comprehensive overview of the main entities and relationships in the SustainGraph. At the core of the SustainGraph, time-series and spatio-temporal data coming from different sources, like open APIs from international databases and ground stations are integrated. Moving to the right side, data regarding the case studies implemented within the H2020 ARSINOE project [26] are hosted. These case studies regard the implementation of solutions for the development of climate-resilient regions. Text data regarding policy documents, strategies and directives are processed through the SDGDetector open-source Python library, which is presented in detail in [24]. These documents are associated with the SDGs through machine learning techniques and seamlessly integrated into the SustainGraph (left side of Figure 1). The SustainGraph offers at its core a semantic alignment of the two SDG indicator sets defined by the United Nations and the European Union and establishes the association between them as relationships among the indicators (<ASSOCIATED_ WITH>). Furthermore, it hosts indicators from third-party sources, to support analyses and decision-making processes.
Following the schema presented in Figure 2, all indicators are represented within the SustainGraph through one or a collection of Series. Each Series is measured as described in their respective SeriesMetadata through Observations representing time-series data. The spatial dimension of the observations is expressed via the GeoArea entity, which encompasses various scales, ranging from continents and countries to lower administrative units, i.e., NUTS 1, NUTS 2, NUTS 3, Cities and Postal Codes, reaching up to high-resolution local levels. The SustainGraph also considers the hierarchy among the GeoAreas, which is presented in detail in [16]. Eurostat has introduced a typology for the description of urban and rural areas [27], which is adopted within the SustainGraph and applied to NUTS 3 level GeoAreas. Based on this typology, the areas are classified as predominantly rural regions, intermediate regions and predominantly urban regions based on the distribution of their population.
A set of open Application Programming Interfaces (APIs) is made available to data scientists and application developers for consuming the data made available in the SustainGraph. Based on the usage of these APIs, data can be fed as input to various analysis processes, including correlation analysis that is used for the examination of the SDG interlinkages. It should be noticed that both the SustainGraph, the provided APIs and the correlation analysis are made available as open-source software through GitLab repositories [28,29,30].

4. Methodology

The examination of the interlinkages among the SDG indicators requires the formation of a list of accurate and high-quality indicators, considering the availability of data from the UN and EU SDG databases and the need to tackle the temporal and spatial resolution of data. To achieve so, our methodology is divided into four steps. The first step regards the selection of the most representative data series and series metadata per indicator, given that multiple data series may exist for the same indicator referring to a subset of the population sample (e.g., breakdown based on gender, age groups). The second step regards the quality assessment of each indicator in terms of data availability to introduce in the analysis only the indicators that provide data for most of the considered geographical areas and time period. The third step focuses on the provision of interpolation techniques to fill in missing values in the selected set of indicators in the second step. The fourth step regards the realization of correlation analysis for the examination of the relationship among the various indicators.

4.1. Selection of Representative Set of Indicators

In this step, we apply the selection of one series and series metadata node per indicator. The SDG indicators must meet particular criteria in order to be considered, given that they are measured for various sets of metadata and series (e.g., different time series based on the breakdown by gender, age, etc.). At first, the most representative series for each indicator is the one considered most coherent with the description of the indicator. Once one series is selected, for the selection of series metadata, preference is given in cases where total numbers are provided for the overall population instead of a specific subset (e.g., by age, gender, etc.), as well as in cases where the indicator is measured in the form of a percentage. Since we deal with data provided at the European level, in our analysis we consider data for the EU-27 countries at the national and regional levels, respectively. At the regional level, we consider the NUTS 2 regions that contain at least one NUTS 3 region classified as urban. The selected indicators have data over a wide range of years (not mandatory in all years) and also to at least half of the required geoAreas. Any indicators that provide data in a Boolean format are excluded, since they are not suitable for a correlation analysis.

4.2. Quality Data Assessment of Indicators

Following the selection of indicators, series and metadata, we proceed with a quality data assessment of the indicators in terms of data availability considering the temporal and spatial resolution. Our objective is to assure that the rate of missing values remains below a specified threshold for the targeted time period of the analysis. This threshold is defined in Equation (1).
d e s i r e d _ o b s e r v a t i o n s c u r r e n t _ o b s e r v a t i o n s d e s i r e d _ o b s e r v a t i o n s m a x _ m i s s i n g _ r a t e
( m a x _ g e o m a x _ y e a r s ) ( g e o _ w i t h _ d a t a y e a r s _ w i t h _ d a t a ) ( m a x _ g e o m a x _ y e a r s ) m a x _ m i s s i n g _ r a t e
y e a r s _ w i t h _ d a t a m a x _ g e o ( 1 m a x _ m i s s i n g _ r a t e ) g e o _ w i t h _ d a t a m a x _ y e a r s
y e a r s _ w i t h _ d a t a c m a x _ y e a r s
where max _ geo , the maximum number of available geoAreas ; max _ years , the examined range of years ; geo _ with _ data , the geoAreas with available data ; years _ with _ data , the years with available data .
Equation (4) indicates that the range of years with available data of one indicator must be greater than a percentage (namely, c) of the examined range of years. Solving Equation (4) yields the maximum missing rate as:
m a x _ m i s s i n g _ r a t e = 1 g e o _ w i t h _ d a t a m a x _ g e o c
As stated in Section 4.1, an indicator is accepted if it provides data for at least half of the maximum number of geoAreas it can cover.
m a x _ g e o 2 g e o _ w i t h _ d a t a m a x _ g e o
Under this constraint, Equation (5) is transformed into:
m a x _ m i s s i n g _ r a t e = 1 c if g e o _ w i t h _ d a t a = m a x _ g e o 1 c 2 if g e o _ w i t h _ d a t a = m a x _ g e o 2
By setting different values of c we define the possible values of the maximum missing rate.
However, a slightly modified approach is applied in the case of indicators that are reported periodically but with limited time coverage over a wide range of years (e.g., indicators measured every 4 years instead of every year). Since there is a constant reporting gap for these indicators, they should be treated differently. These indicators are identified through our approach and can be accepted in the examined time range when all of the following criteria are met:
  • Limited reporting years available: This type of indicator will not be accepted in any time range, if, even for the minimum examined time range do not satisfy the constraint (4).
  • Majority of data in the examined range: Indicators with reporting gaps can be accepted in the examined time range only if they have most of their data, namely over 60% of their total data, in this time range. This constraint verifies that there is no other range where the indicator can be accepted.
By applying these criteria, we detect indicators having reporting gaps, for which we will employ a less strict threshold for the maximum missing rate. Figure 3 illustrates the workflow of the quality data assessment of indicators, in which different maximum missing rate values are applied depending on the quality of the indicators’ data.

4.3. Imputation of Missing Values

In this step, we apply techniques to manage the missing values in the selected indicators at the national and regional levels. Upon the careful selection of indicators in the previous steps, we end up with indicators with small percentages of missing data. Therefore, we select appropriate techniques to ensure the original data integrity. For every indicator in each country or urban NUTS 2 region with missing data over time, a time-interpolation approach is carried out both forward and backward. When no data are available for a specific country or urban NUTS 2 region, an interpolation technique based on the k-nearest neighbors (KNN) imputation method [31] is applied. Based on this imputation technique, the missing values are replaced by computing the average indicator’s value from the neighboring geoAreas that constitute the k-nearest neighbors. The optimal value of k is computed by applying cross-validation and considering the average Root Mean Square Error (RMSE) metric.

4.4. Correlation Analysis

In the final step of our methodology, leveraging the knowledge infrastructure of the SustainGraph that enables various types of analysis, we examine correlations among the data. In particular, we conduct correlation analysis across all pairs of indicators from the UN and EU SDG datasets, at the national and regional NUTS 2 scale. Based on the quantitative analysis performed, the association of the EU with UN SDG indicators, as defined by Eurostat, is evaluated. Extending the level of our analysis, we examine and rank the SDGs interlinkages, as an outcome of their indicators’ associations originating from the EU SDG dataset, the UN SDG dataset and also their combination. To further investigate the interlinkages among the SDGs, we use a weighted graph representation and also classify them as synergies or trade-offs. The aforementioned approaches aid in the identification of the most central and influential SDGs at both geographical levels, revealing the prioritization of actions to be taken to achieve SDG collaboration. The results are evaluated at the two examined scales, national and NUTS 2 regions.

5. Analysis Results

The analysis of the interlinkages of the SDG indicators is focused in the time period from 2000 to 2023. Upon reviewing the available indicators, we have concluded with the set of indicators that is provided as input in the analysis. These indicators are detailed in Table A1 and Table A2 in the Appendix A. Following this, a correlation analysis has taken place, leading to useful insights with regards to the interlinkages among the SDG indicators.

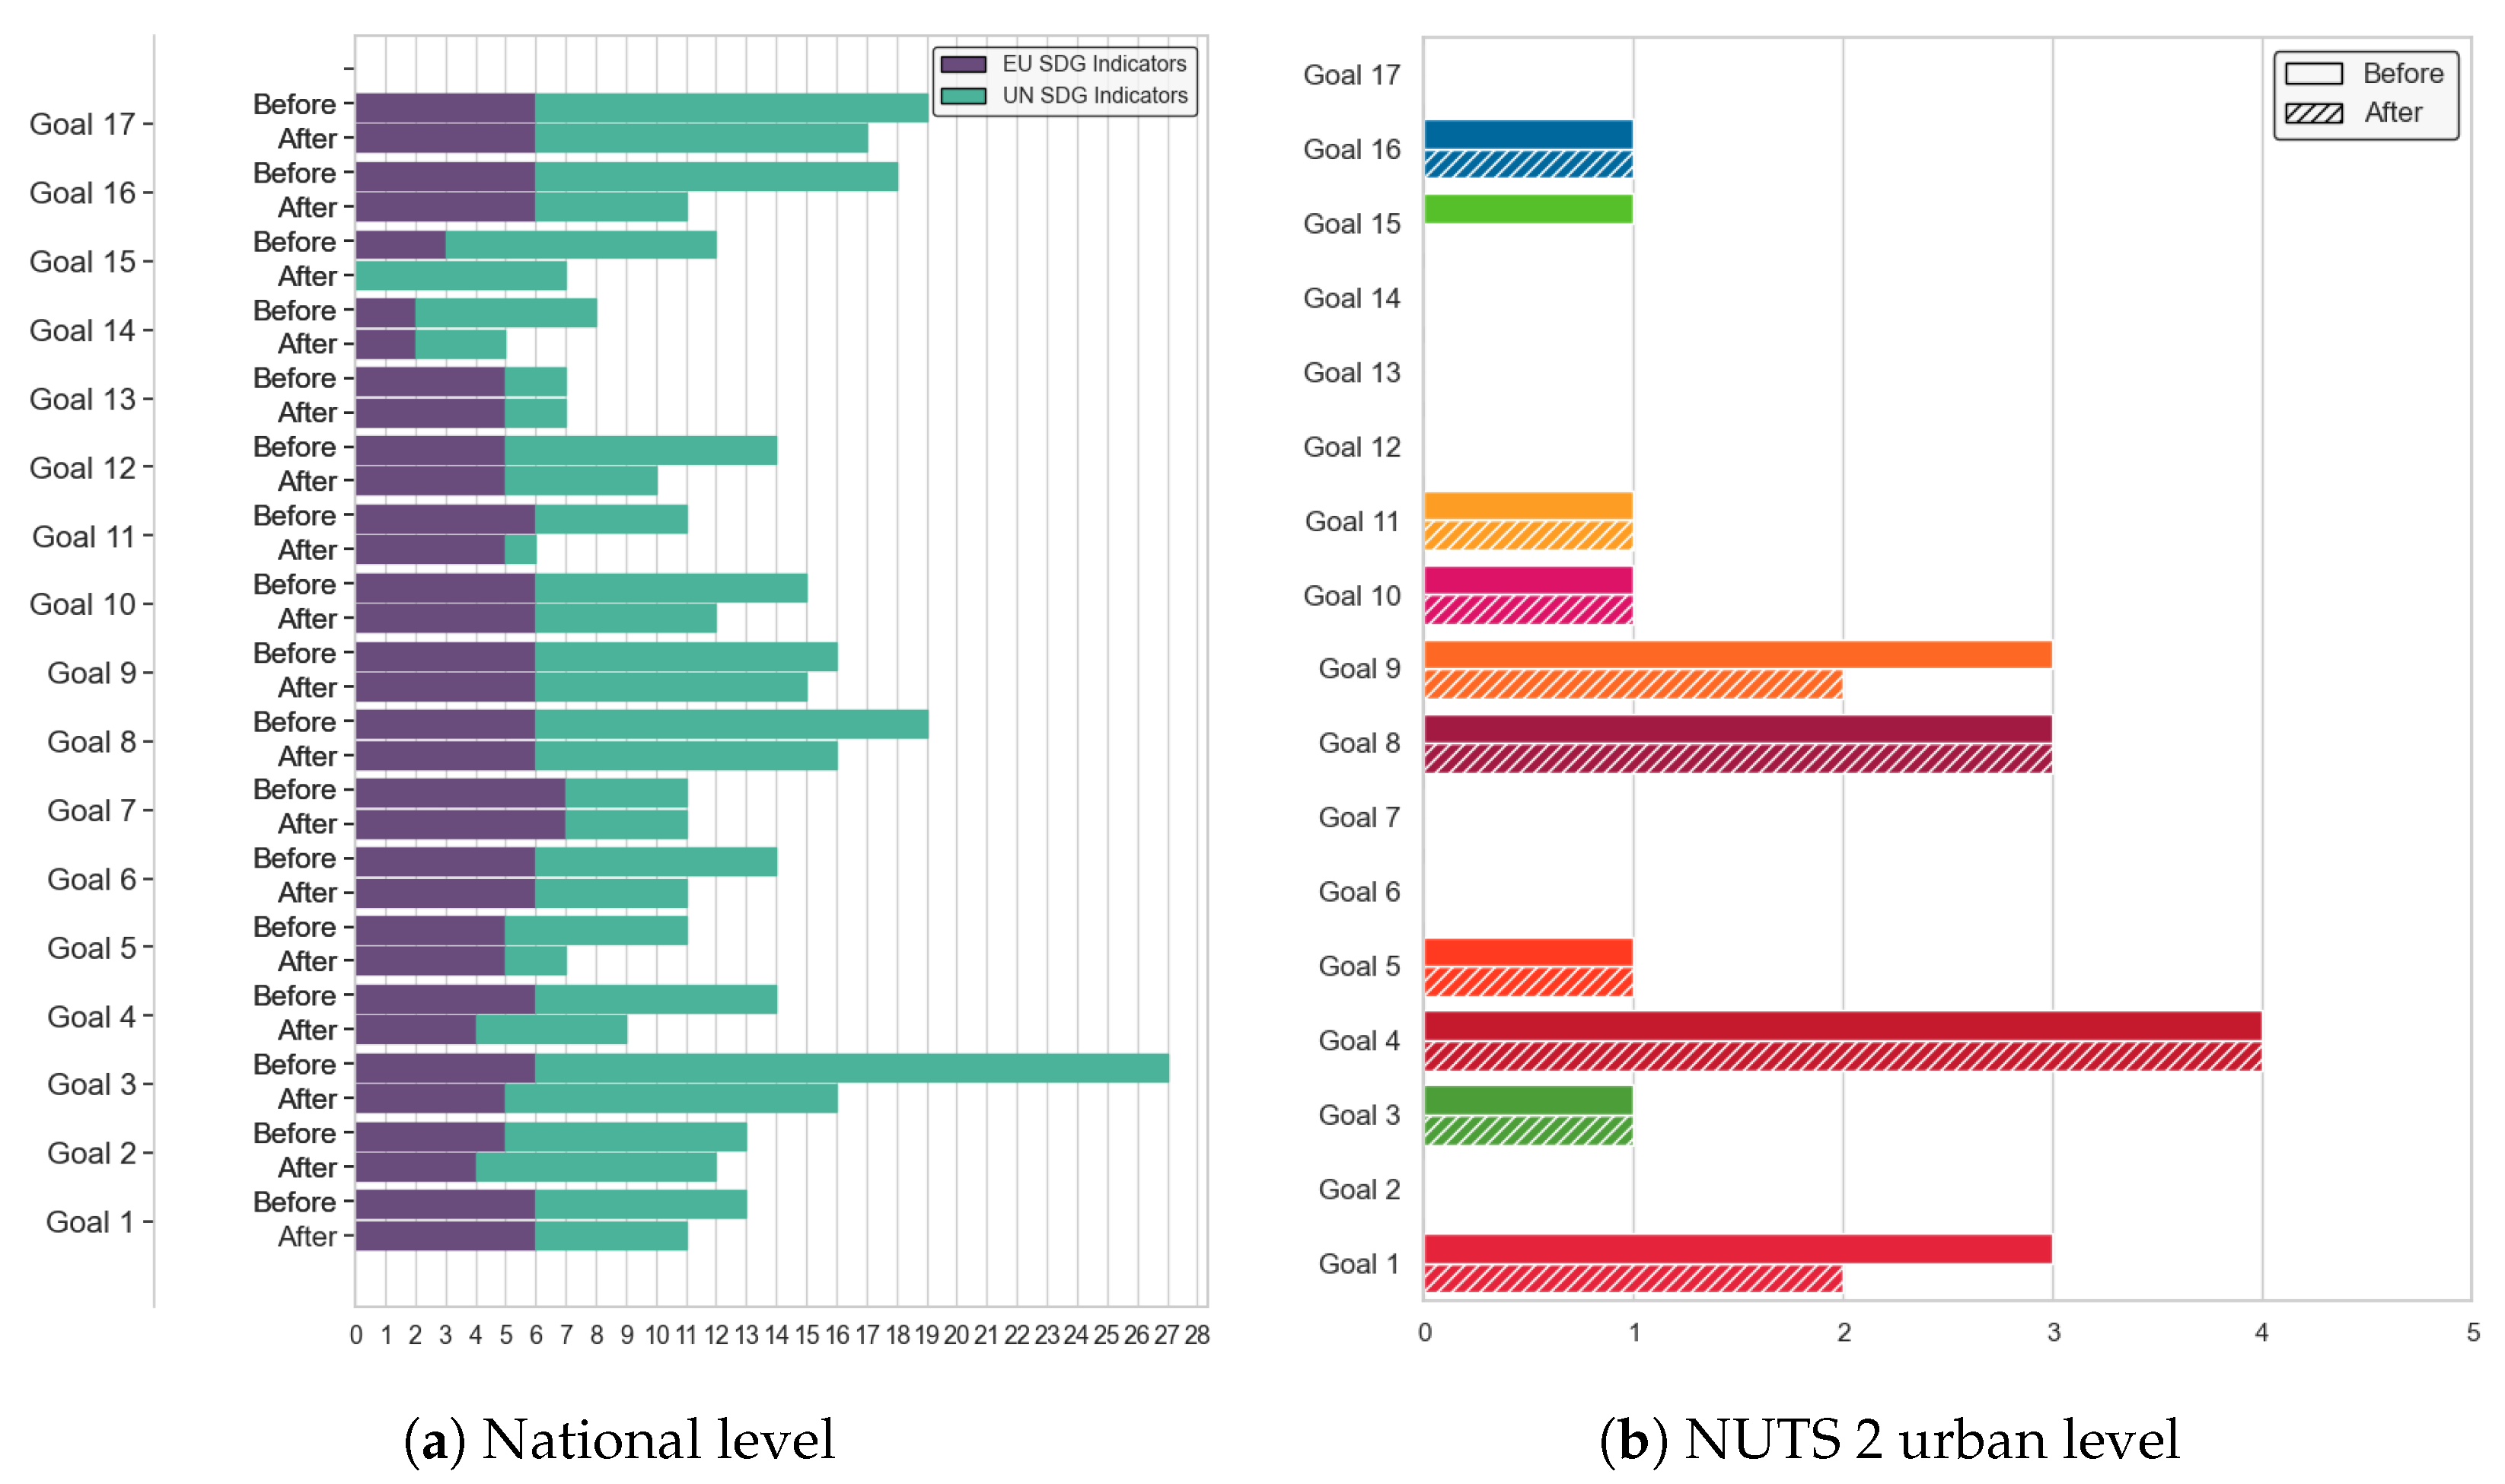
5.1. Selection of Indicators and Data Processing

Table 1 presents the number of indicators after the implementation of the first step of the methodology, as described in Section 4.1. We end up with 242 indicators at the national level with data availability in at least 13 out of 27 countries and 19 indicators at the NUTS 2 regional urban level with data availability in at least 50 out of 101 NUTS 2 urban regions.
In the qualitative data assessment step, we have examined the data availability in the time range from 2000 to 2023, having set a minimum 11-year period and a maximum 24-year period for analysis. We assume that an indicator has adequate data if even for the minimum range of years (11 years), it has at least 5 years of reporting data. Thus, according to Equation (5), c 1 = 5 11 = 0.46 . The range of the maximum missing rate according to Equation (7) is set to [0.54, 0.77]. For our analysis, we accept indicators with reported data in at least half of the maximum geoAreas, thus m a x _ m i s s i n g _ r a t e 1 = 0.54 . In the case of the indicators with reporting gaps, we apply a less strict threshold, where an indicator is accepted if it has at least 4 years of reporting data ( c 2 = 4 11 = 0.36 ). The range of the max missing rate for these indicators according to (7) is [0.64, 0.82], among which we set m a x _ m i s s i n g _ r a t e 2 = 0.64 .
Figure 4a,b depict the total number of selected indicators across the 105 possible time ranges at national and NUTS 2 urban levels. Our final set of indicators at the national level consists of 183 out of 242 indicators, for the period from 2010 to 2020, 84 of which are EU SDG indicators and 99 of which are UN SDG indicators. For the urban NUTS 2 level, 16 out of 19 EU SDG indicators were selected for the period from 2011 to 2021 (see Table 1).
Figure 5a shows the distribution of the SDG indicators in the EU and UN SDG context across the goals at national level before and after the implementation of the Quality data assessment step. As depicted, the selected 183 indicators at the national level cover the 17 SDGs. Regarding the regional scale, in Figure 5b the indicators with available data at the NUTS 2 regions, before and after the Quality data assessment step, do not cover all the SDGs.
In the third step of the methodology, interpolation techniques are used to handle the missing values of the indicators. Table 2 presents the percentage of missing values across all indicators after the implementation of the sequential imputation methods for national and regional levels.

5.2. Examination of Interlinkages at National Level

In this part of the analysis, we conducted a Spearman correlation analysis [32] among the selected indicators from the EU SDG and UN SDG indicators set respectively for the time period from 2010 to 2020. Only the statistically significant correlations with p-value 0.05 were considered in the analysis.

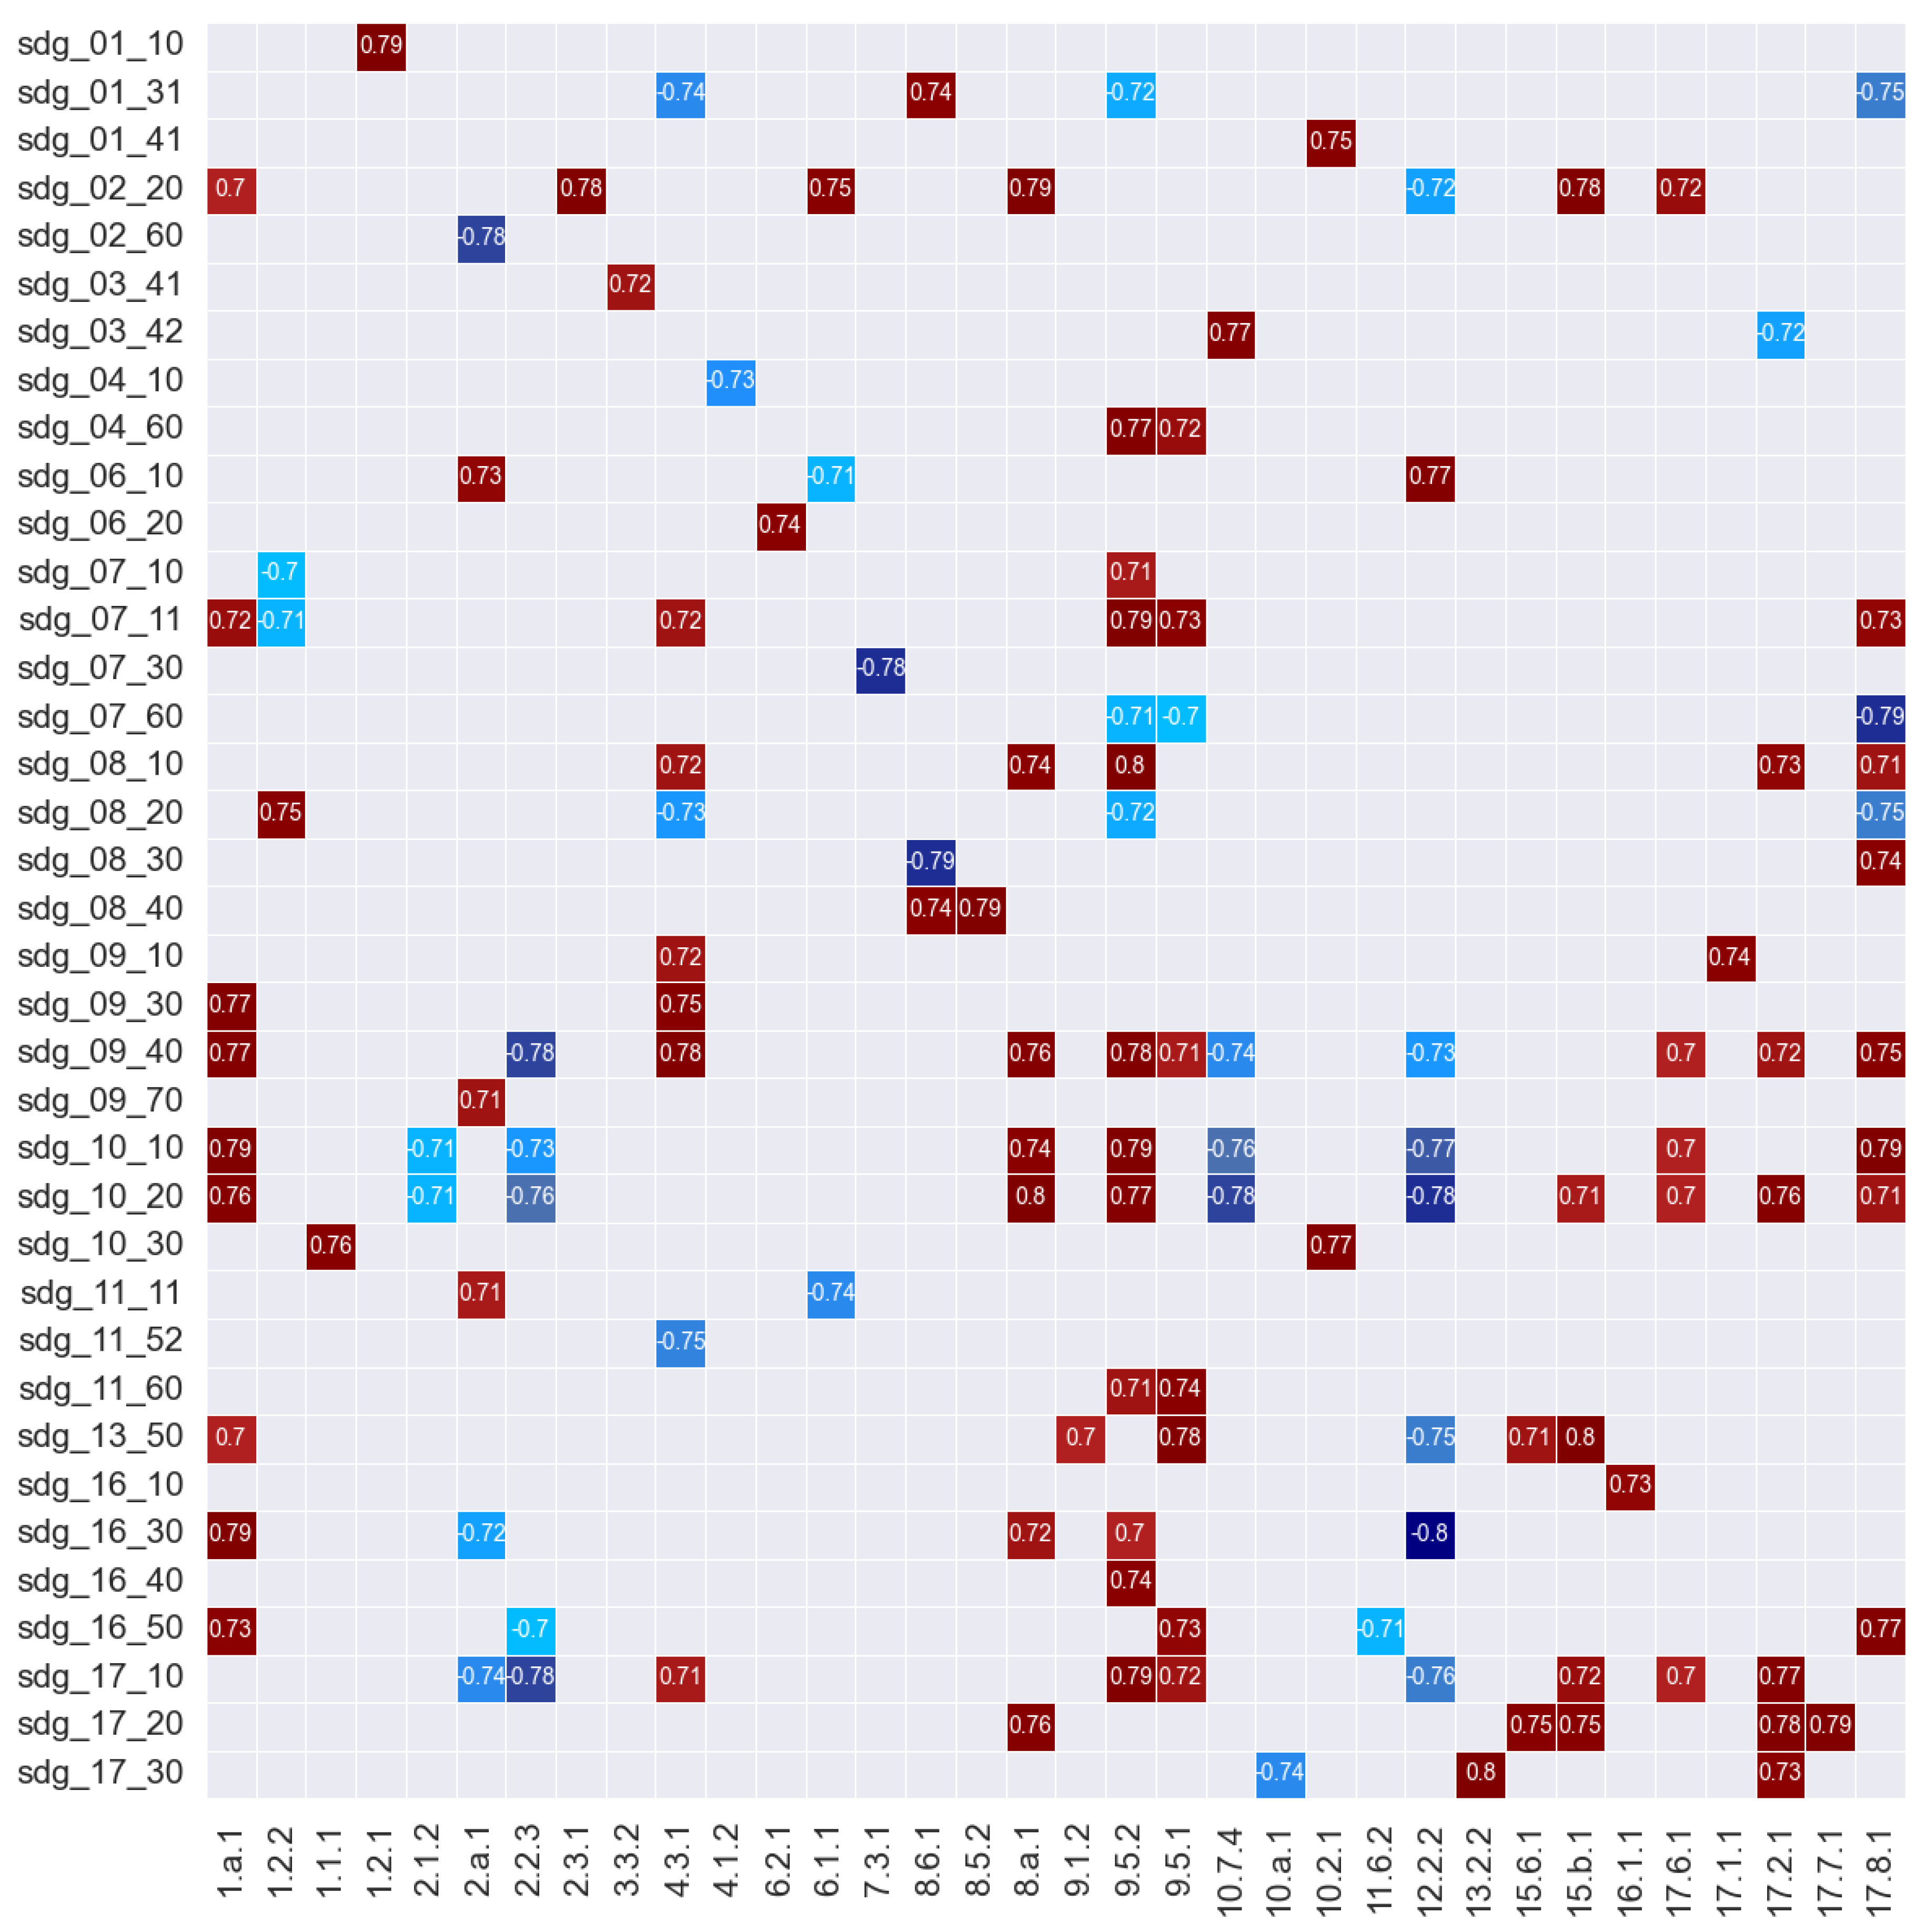
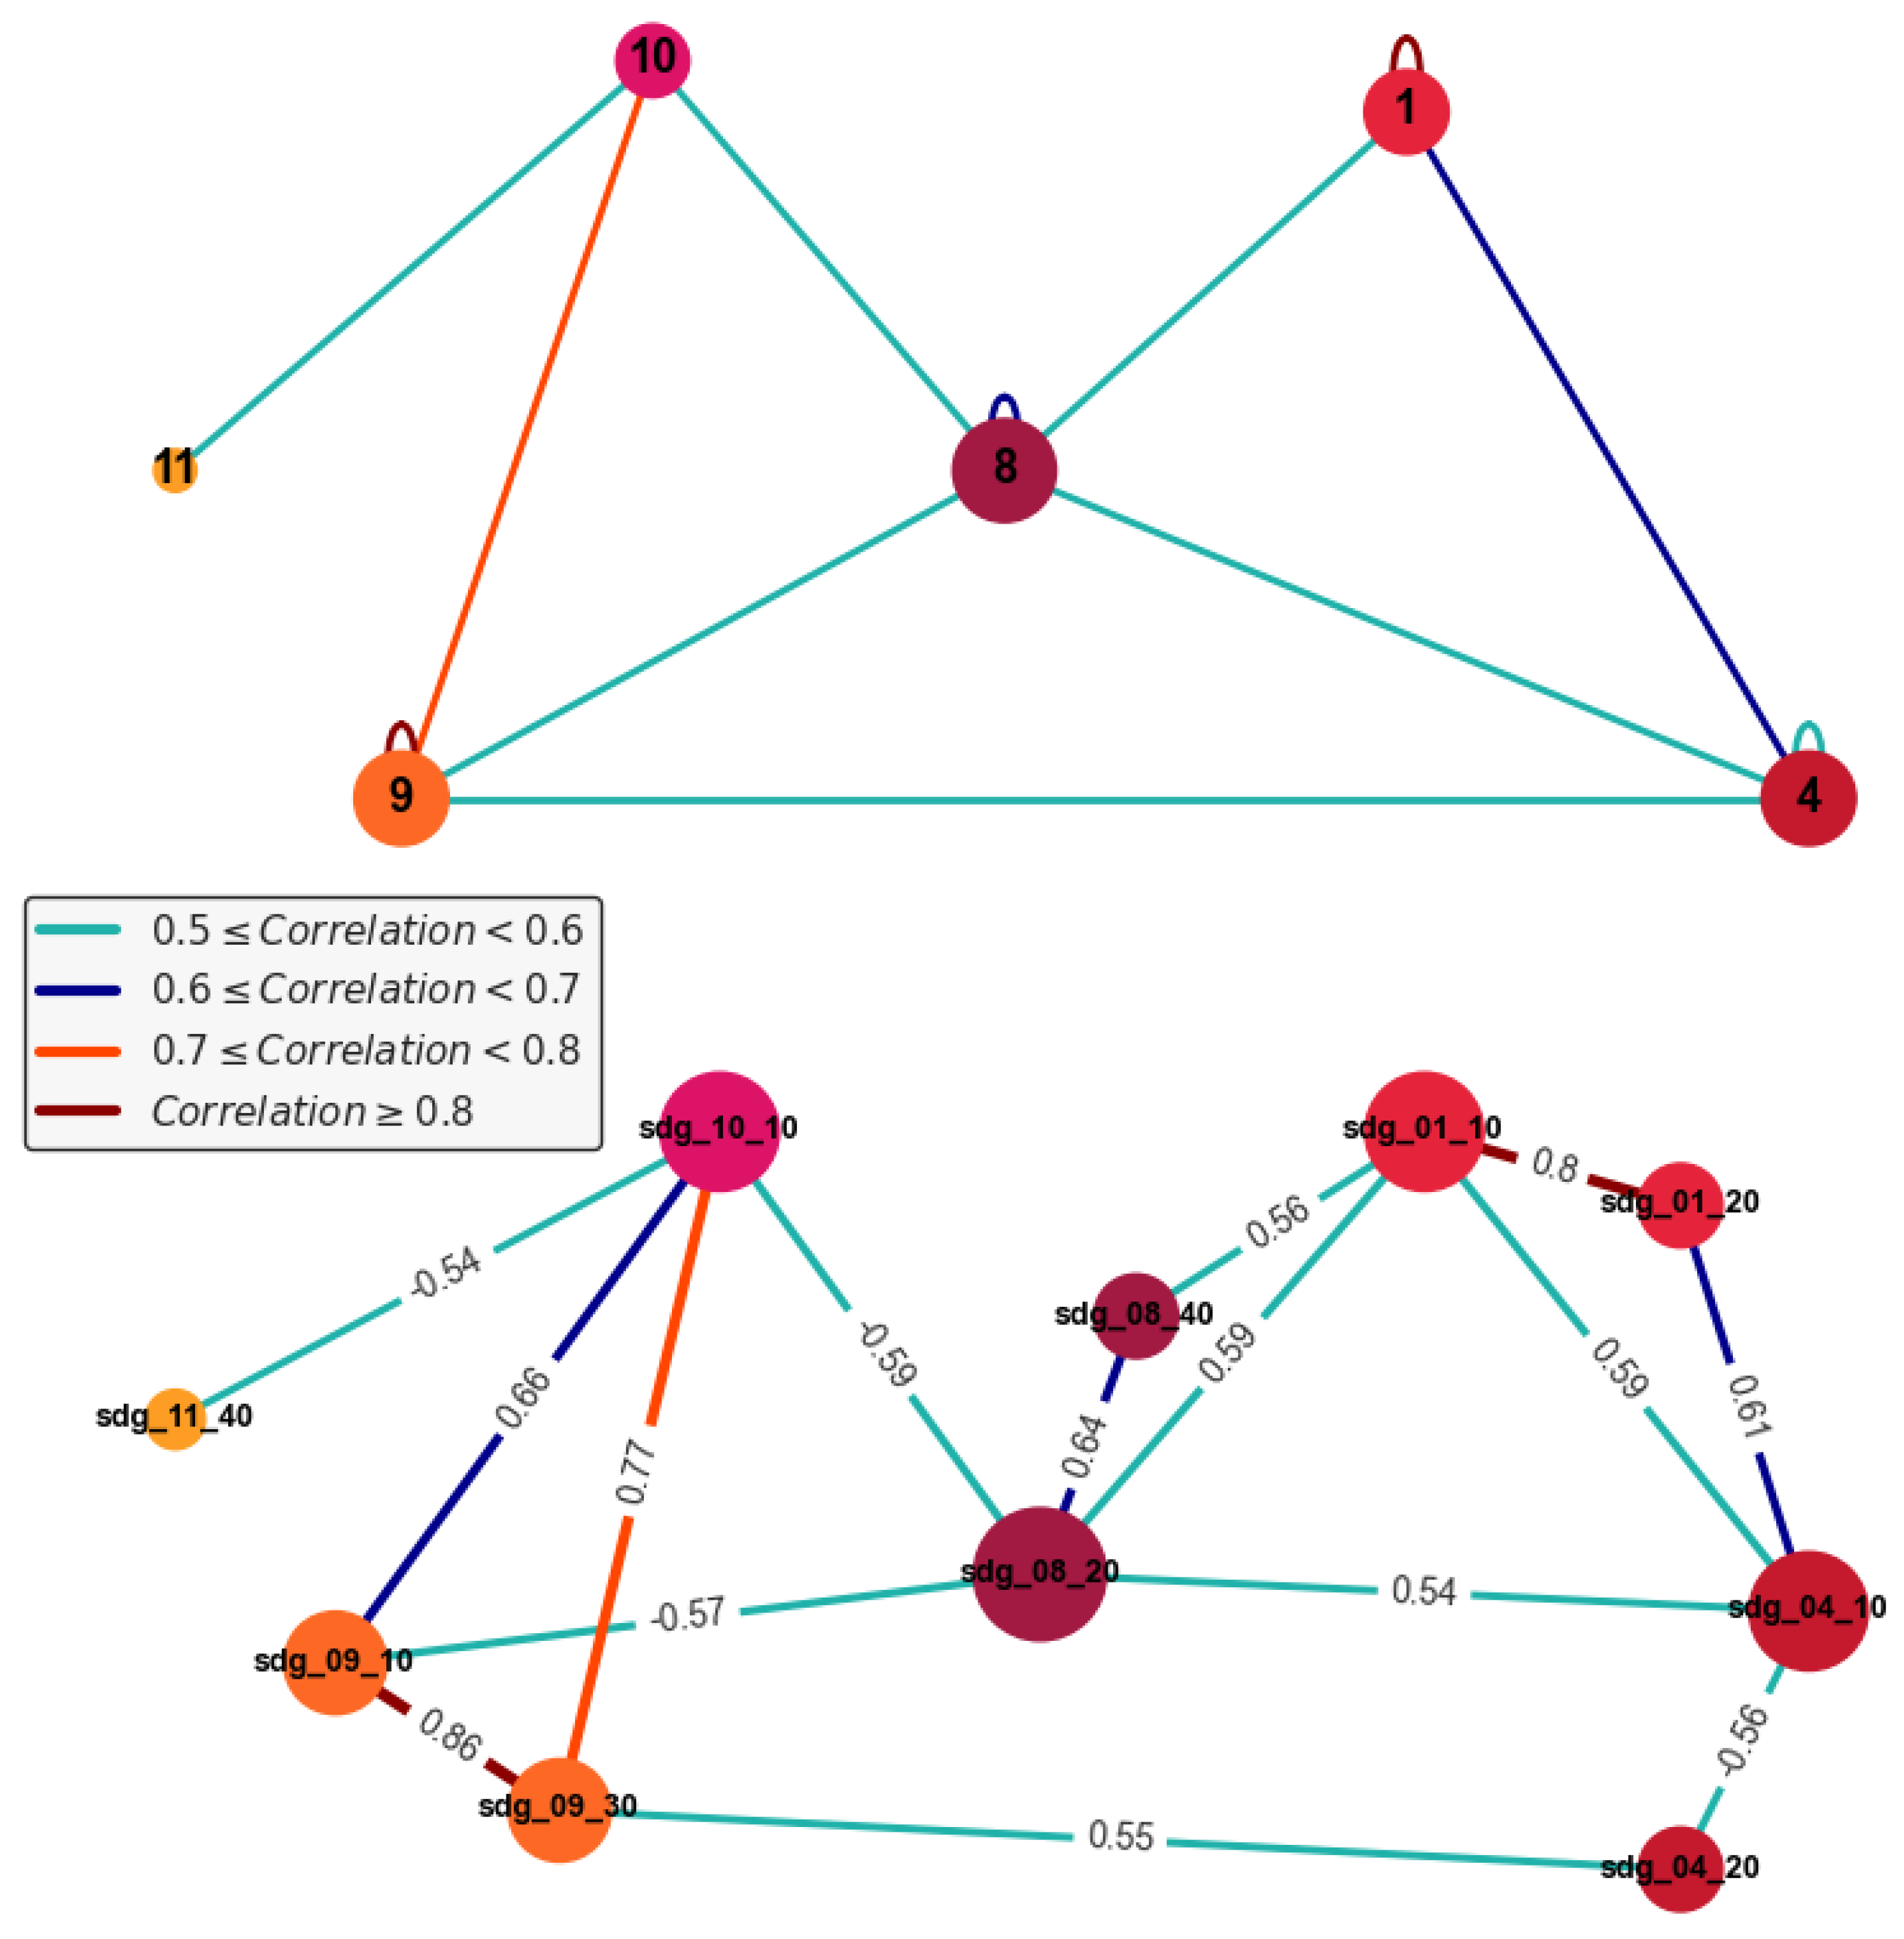
5.2.1. Correlation Analysis among the SDG indicators

Figure 6 presents the correlations between EU and UN SDG indicators evaluated as high ( 0.7 a b s ( ρ ) 0.8 ), and Figure 7 the correlations assessed as very high ( 0.8 < a b s ( ρ ) 1 ). There are 127 statistically significant high correlations, constituting 1.52% of the possible associations between EU SDG and UN SDG indicators. There are 48 statistically significant correlations with very high scores, with ρ values reaching up to 0.98.
The highest correlations ( ρ > 0.9 ) seem to appear between the EU SDG indicators and the UN SDG indicators with almost identical descriptions. Table 3 presents the indicator pairs classified as “identical”, according to the EU SDG indicator set 2023 [25]. This classification is confirmed by the very high correlation coefficients calculated. The only correlation coefficient that does not strongly fortify the classification as “identical” regards the indicator pair (sdg_17_1017.2.1) ( ρ = 0.77 ).
Regarding the indicator pairs classified as “similar” (see Table 4), high fluctuation in their correlation values is observed, with a b s ( ρ ) ranging from 0.22 to 0.97. On the one hand, there are indicator pairs classified as “similar”, with very high correlation coefficients and identical descriptions, namely (sdg_04_604.3.1), (sdg_08_208.6.1) and (sdg_17_20 (Goal 17)—10.b.1 (Goal 10)). Conversely, there are indicator pairs labeled as “similar” but the correlation coefficient calculated was very low: (sdg_04_314.2.2), (sdg_05_605.5.2), (sdg_08_108.1.1), (sdg_10_108.1.1) and (sdg_09_709.4.1).
In particular, the UN SDG indicator 8.1.1, measuring the annual growth rate of real Gross Domestic Product (GDP) per capita is not highly correlated with the Real GDP per Capita (sdg_08_10) itself. Moreover, GDP growth rate is not strongly correlated with the sdg_10_10: Purchasing Power Adjusted Gdp Per Capita either, since their relationship does not consider the income distribution inequalities and the impact of exchange rate fluctuations. The low correlation between (sdg_05_605.5.2) can be attributed to the different scopes of the indicators. Even though the UN indicator 5.5.2 measures the Proportion of women in managerial positions, the EU indicator sdg_05_60 is specified for board members, as defined by its selected series metadata. Finally, sdg_09_70 indicator measures the emissions intensity of particulate matter PM2.5 from the manufacturing sector. Despite its positive correlation ( ρ = 0.4 ) with indicator 9.4.1, they cannot be classified as “similar” since the latter mainly refers to CO2 emissions computed for the whole economy (total CO2 emissions/GDP) and not a specific sector.
In our analysis, highly correlated indicator pairs were identified that are not included in the EU indicator set or have a different relevance level than the one suggested by Eurostat. The indicator pairs with very high correlations ( ρ > 0.9 ) that could be classified as “identical” are (sdg_08_60: Fatal Accidents At Work Per 100 000 Workers, By Sex8.8.1: Fatal and non-fatal occupational injuries per 100,000 workers, by sex and migrant status) with ρ = 0.97 , (sdg_09_30: R&D Personnel By Sector9.5.2: Researchers (in full-time equivalent) per million inhabitants) with ρ = 0.91 and (sdg_11_52: Premature Deaths Due To Exposure To Fine Particulate Matter (Pm2.5)11.6.2: Annual mean levels of fine particulate matter (e.g., PM2.5 and PM10) in cities (population weighted)) with ρ = 0.92 . The first pair was assessed by Eurostat as part of, while the two latter were mentioned as possible correlations but not yet evaluated. Based on our analysis, indicator pairs with ρ values in the range [0.7–0.8] could be interlinked as similar indicators. Considering the ranges used to assess the relevance of indicator pairs, certain pairs exhibit correlation values that fall within these ranges but could be classified as “dependent” since they are not identical. For example, there are indicator pairs with high negative correlations, namely sdg_08_10: Gross Domestic Expenditure On R&D By Sector10.7.4: Number of refugees per 100,000 population, by country of origin (per 100,000 population) ( ρ = 0.82 ), for which their relationship could be characterized as “dependent”.

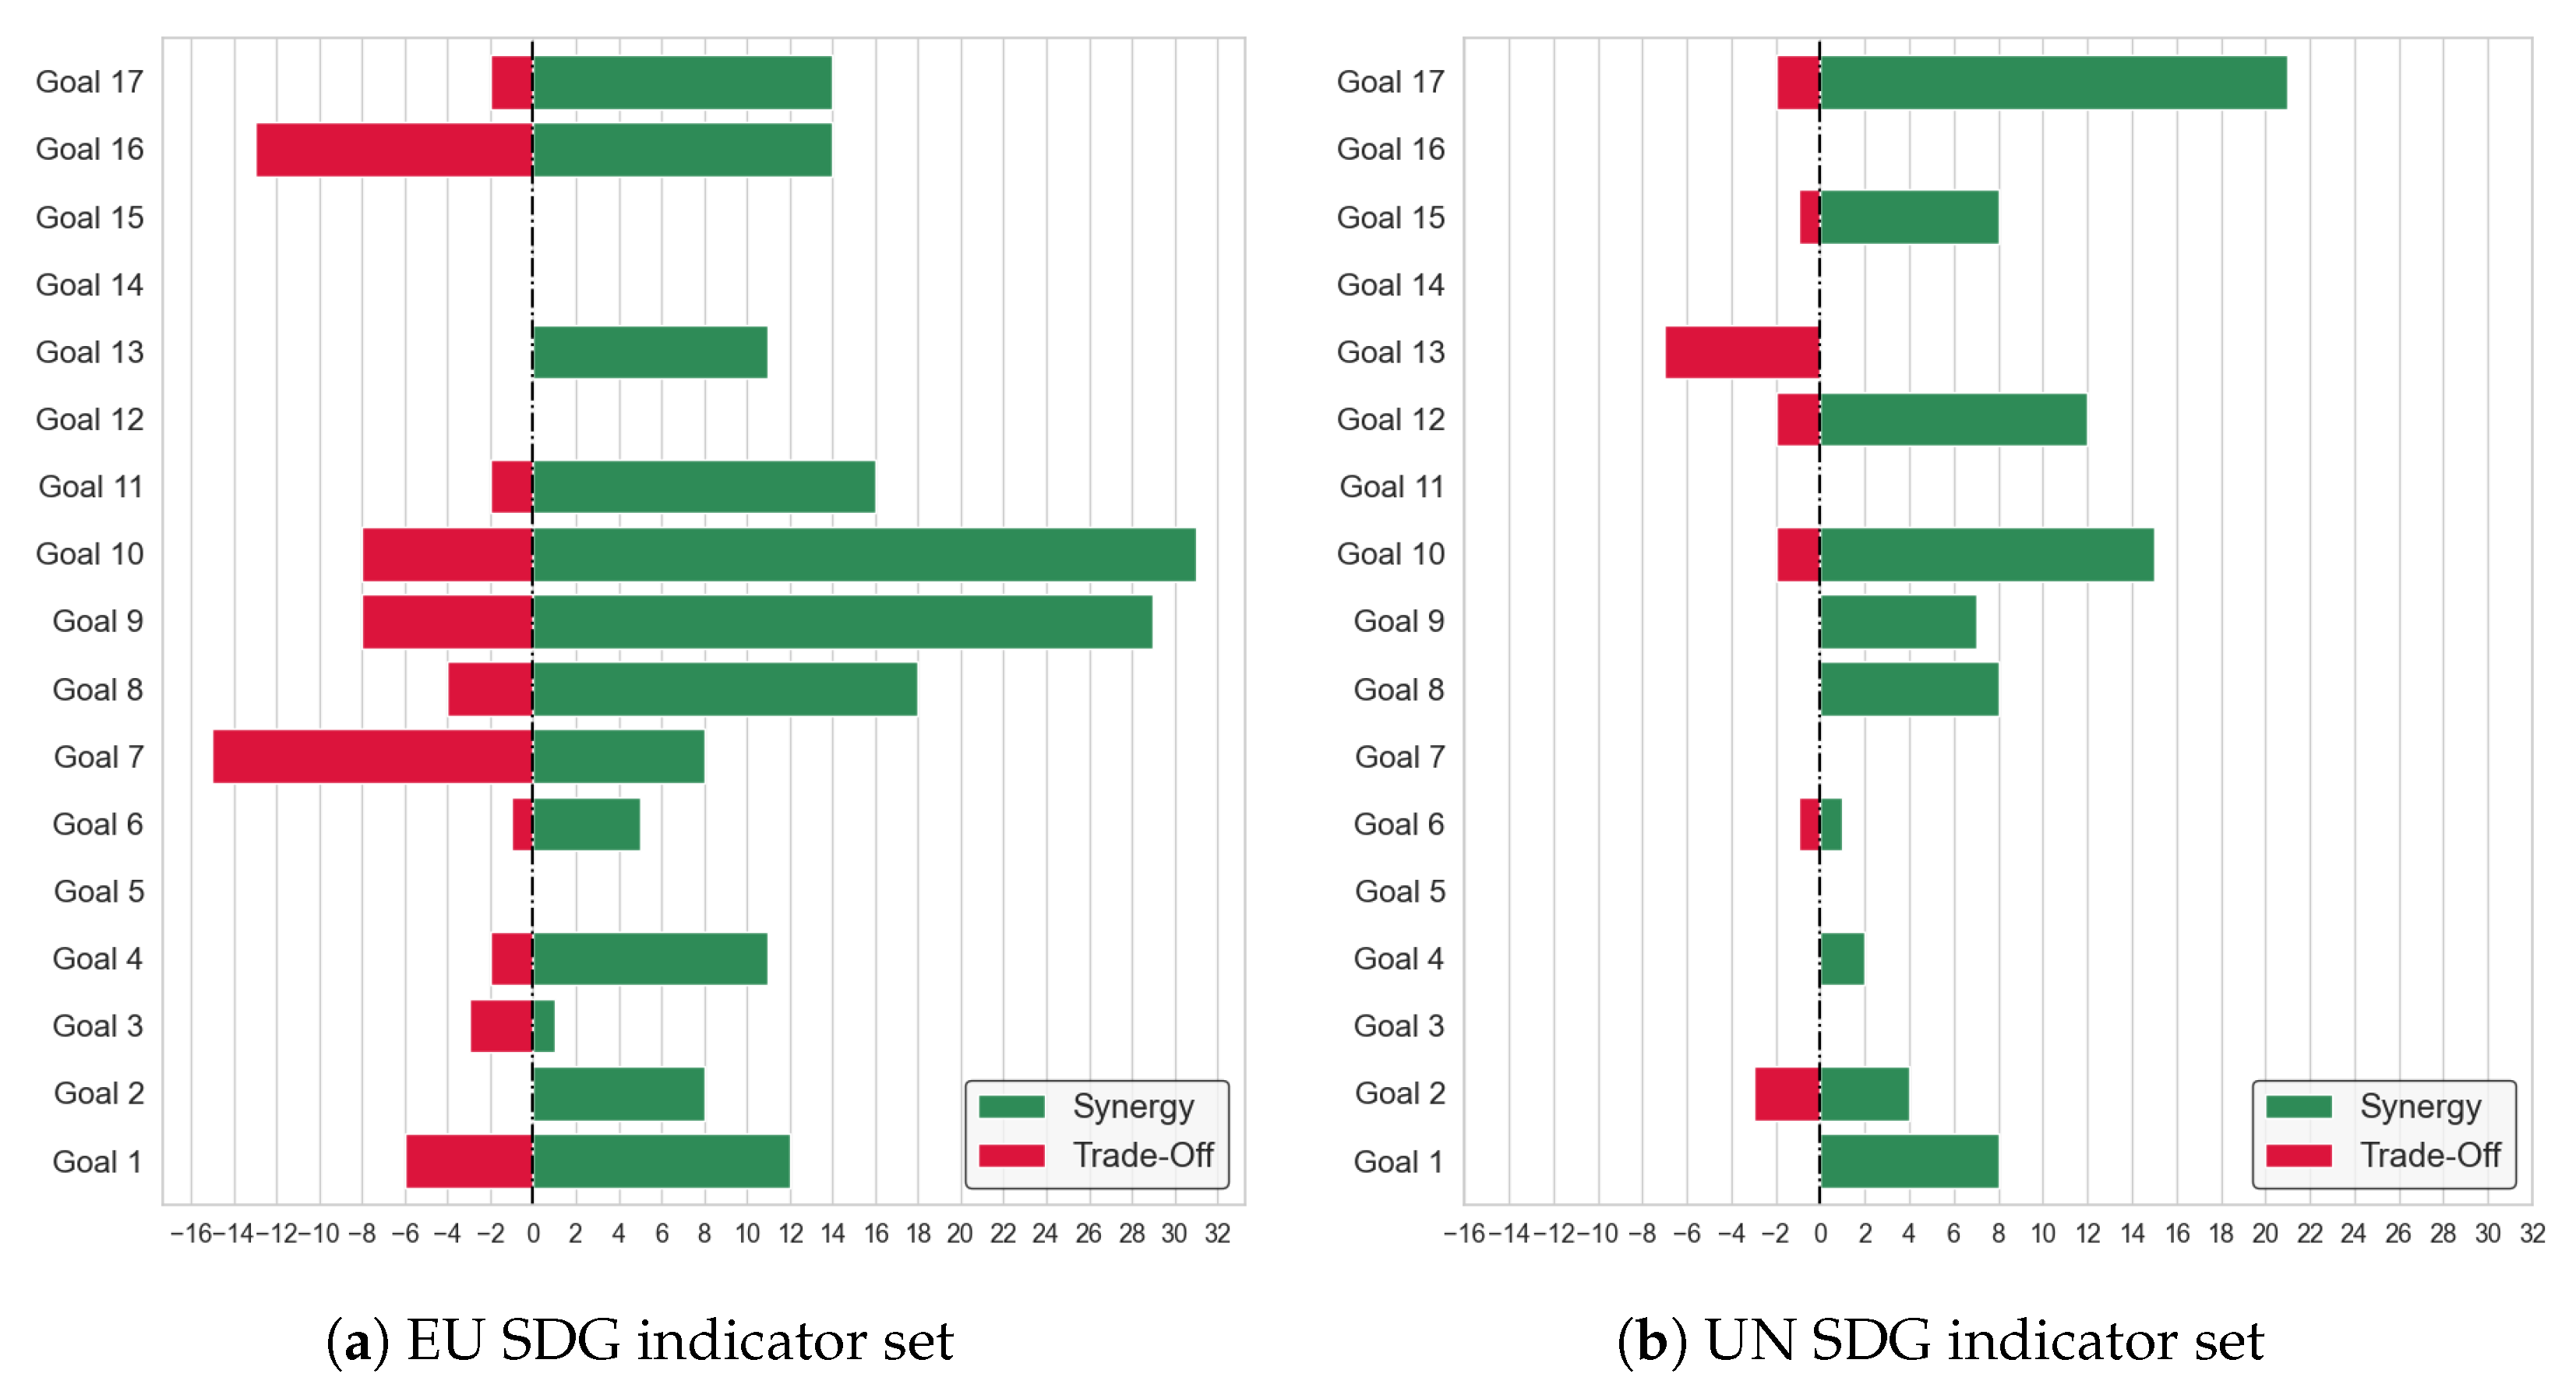
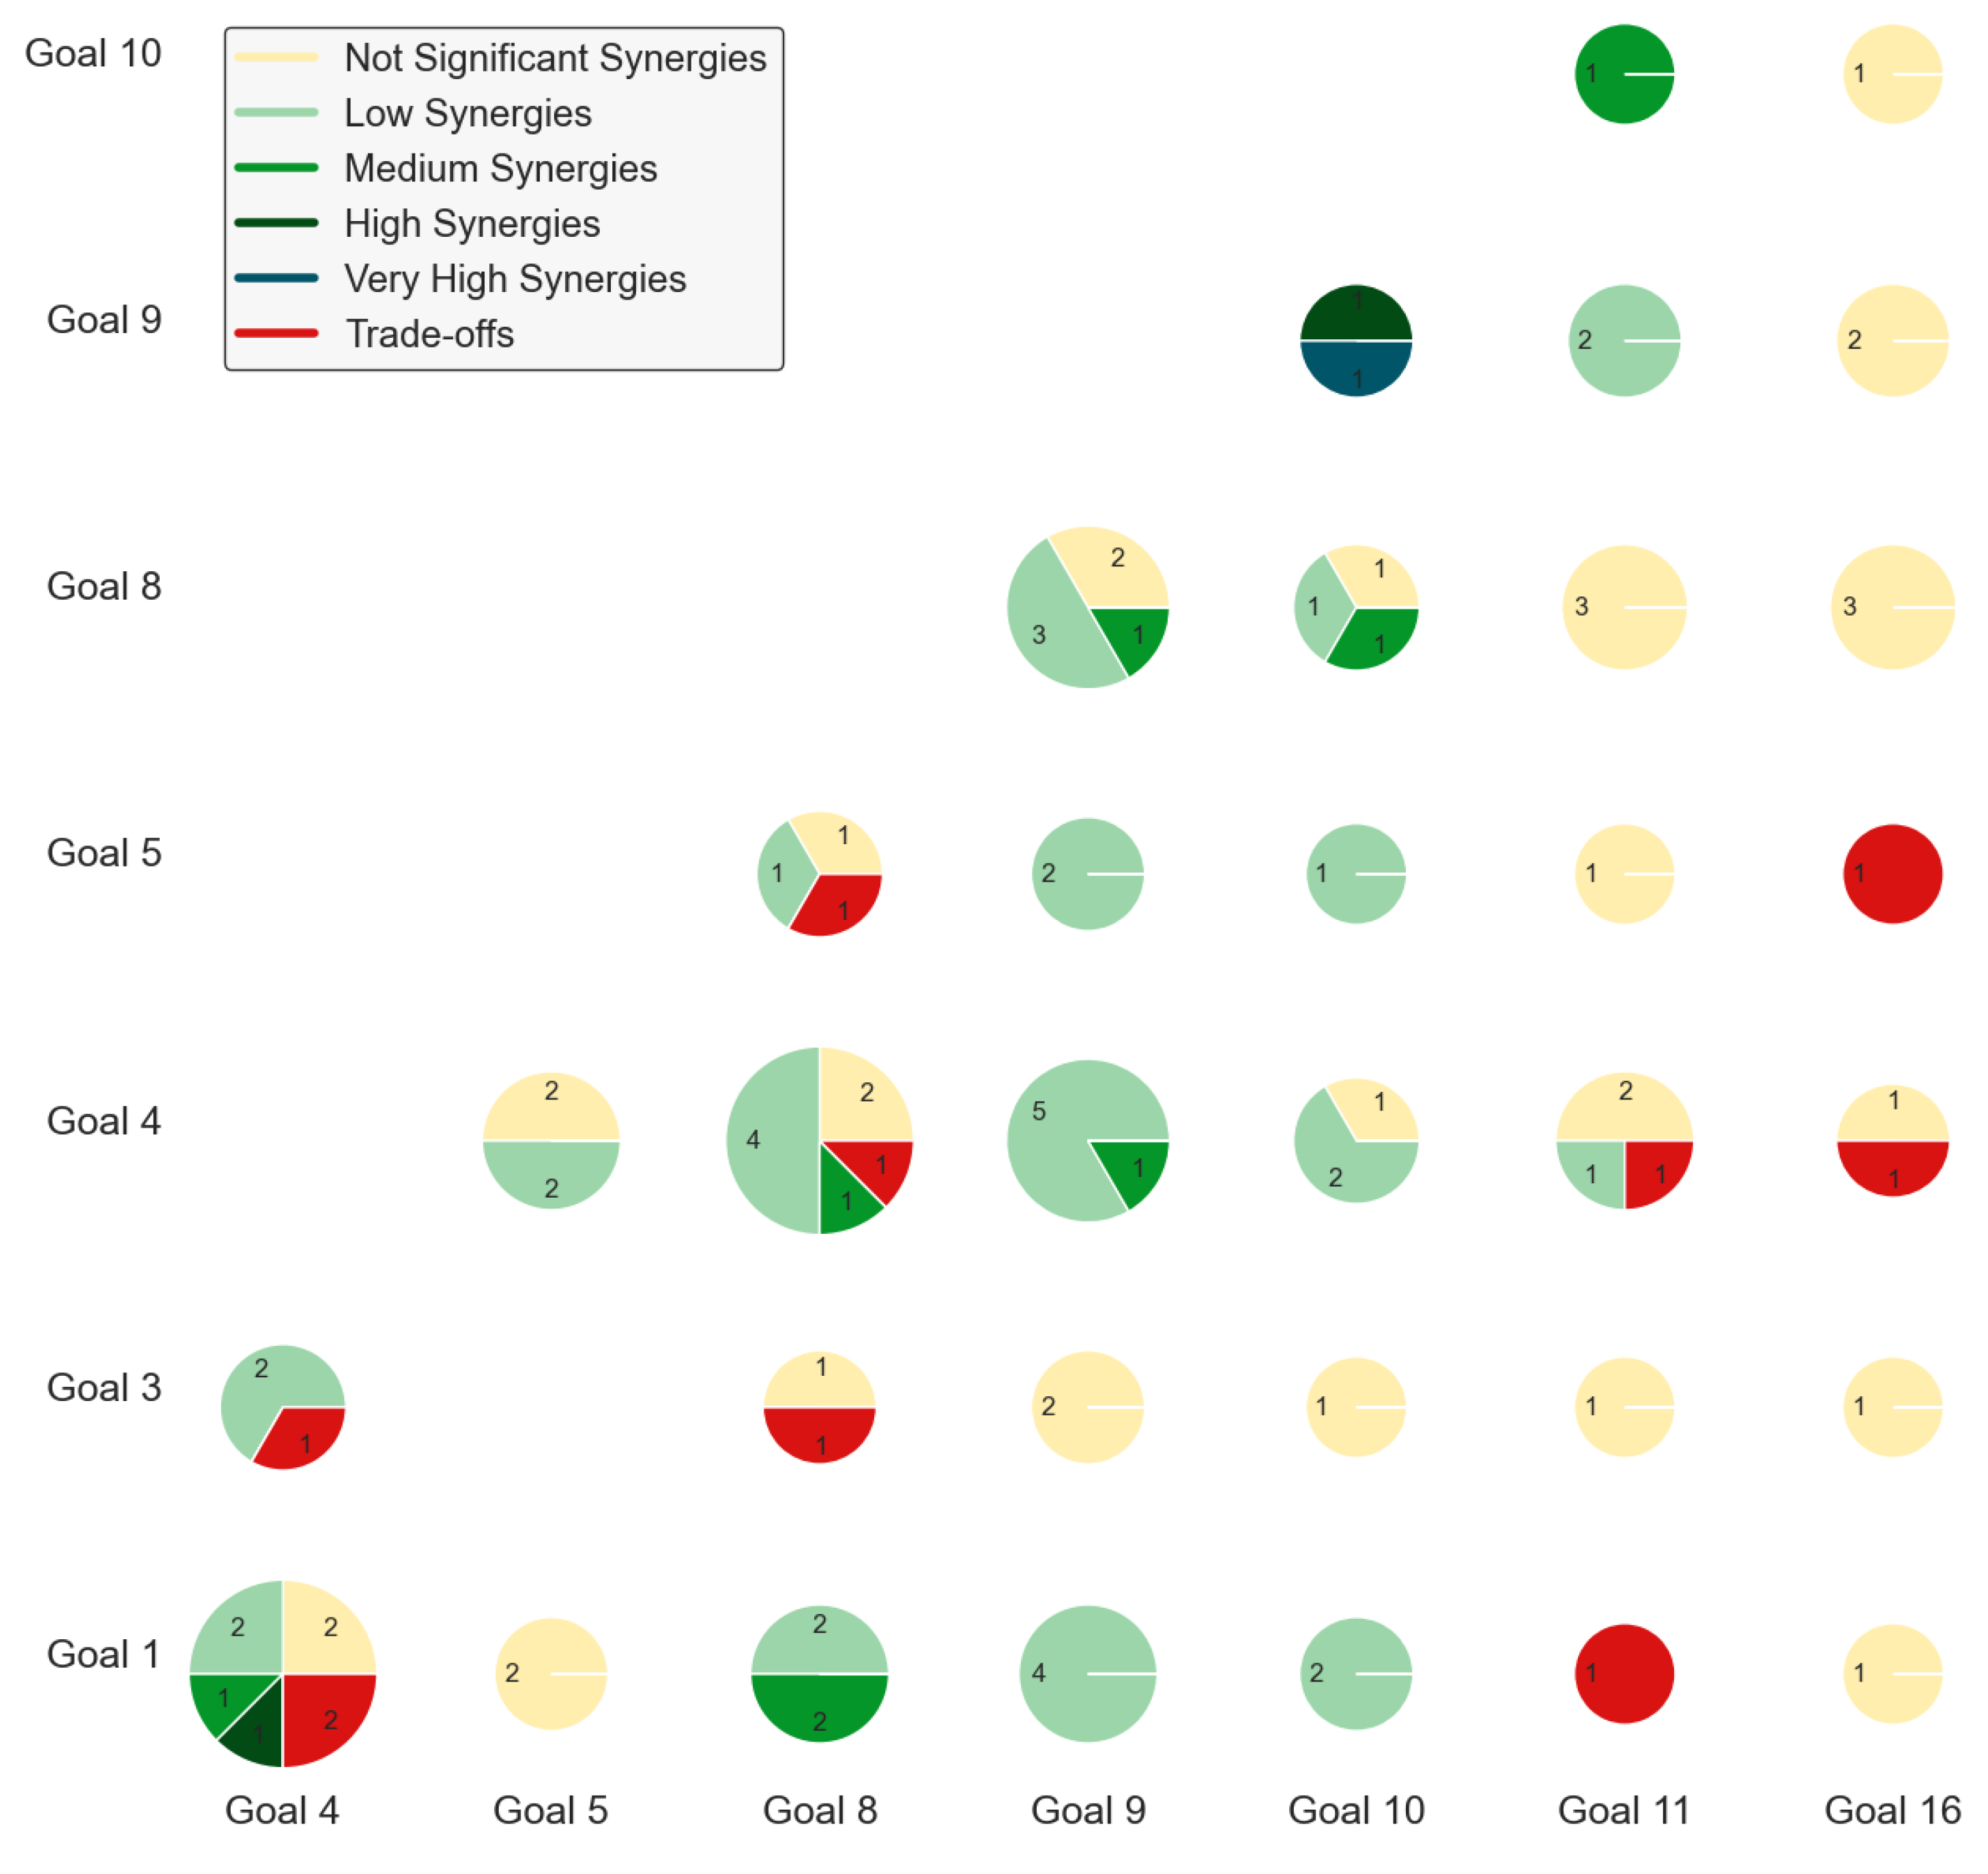
5.2.2. Correlation Analysis among the SDGs

To explore interactions among the 17 SDGs, we consider each indicator assigned to one goal as defined in the UN and EU SDG indicator set respectively. In Figure 8 and Figure 9, the interactions within goals are represented with a graph where the SDGs are the nodes and an edge between them exists if there are indicators from the two corresponding goals that are correlated with a b s ( ρ ) > 0.7 . Self-links indicate that there are high correlations ( a b s ( ρ ) > 0.7 ) between indicators of the same SDG. The edges are colored based on the average correlation between indicator pairs, while the size of each goal node is based on its weighted degree centrality, calculated from the correlation coefficients of its indicators. According to Figure 8, the EU SDG indicator set results in more high correlations among the SDGs compared to the UN SDG set.
Regarding the two graphs illustrated in Figure 8, it is apparent that they exhibit some striking similarities. SDG 17: Partnership for Sustainable Development is one of the most interconnected nodes, with the highest (>0.8) correlation coefficients. In both graphs, it undertakes the first and second position in the UN and EU SDG datasets, respectively. SDG 17 is expected to have the most connections due to its core focus on strengthening global cooperation to achieve the SDGs, on topics including international investments, technological advances, fair trade and market access. Nevertheless, it is the second most interconnected node in the EU SDG dataset, where SDG 10: Reduced Inequalities prevails. In addition, SDG 8: Decent work and economic growth is the only SDG for which strong correlations (>0.9) appear in both datasets, namely with SDG 10: Reduced Inequalities in the EU dataset and SDG 15: Life on land and SDG 17: Partnership for Sustainable Development in the UN dataset.
While the two graphs exhibit some similarities, it is vital to point out significant differences. There are goals, such as SDG 16: Peace, Justice, and Strong Institutions, SDG 11: Sustainable cities and communities and SDG 7: Affordable and clean energy that appear as highly interlinked goals in the EU SDG dataset but are not included in the UN SDG dataset. Respectively, SDG 15: Life on land, which is interlinked with five SDGs in the UN SDG dataset, is not present in the graph regarding the EU SDG indicators, since its three indicators were not included in the examined time range [2010, 2020] due to data availability restrictions. SDG 12: Responsible consumption and production, on the contrary, despite how the five EU indicators under its umbrella are included, is only present in the graph of the UN indicators, since these indicators have correlation values not greater than the 0.7 threshold. In addition, another captivating finding is that SDG 3: Good health and well-being even though it appears disconnected from other SDGs in the UN SDG dataset, is interlinked with SDG 10: Reduced Inequalities and SDG 6: Clean water and sanitation in the EU SDG dataset. Regarding the SDG 8: Decent work and economic growth and SDG 9: Industry, Innovation, and Infrastructure, they are two SDGs highly interlinked with 10 SDGs in the EU SDG dataset, compared to the UN dataset where they have less than half of the interlinkages.
Figure 9 presents the interlinkages among goals as they result from EU and UN indicator correlations (see Figure 6 and Figure 7). The two datasets boost the interlinkages between goals and establish SDG 17: Partnership for the goals as the most interconnected node. The most highly correlated (≥0.8) recorded interlinkages with other goals concern SDG 13: Climate action and its association with SDGs 8: Decent work and economic growth, 10: Reduced Inequalities, 12: Responsible consumption and production and 17: Partnership for the goals.
Moreover, the EU and UN indicators dataset result in an increase in the connectivity of SDG 1: No poverty, SDG 2: Zero hunger, SDG 3: Good health and well-being, SDG 4: Quality education, SDG 6: Clean water and sanitation and SDG 9: Industry, innovation and economic growth, compared to Figure 8. SDG 3: Good health and well-being remains the least interconnected goal, with its only association with SDG 10: Reduced Inequalities. The only SDGs not present are SDG 5: Gender Equality and SDG 14: Quality Education, for which the indicators did not appear with high correlations. SDG 11: Sustainable cities and communities, appears only with two goal-interlinkages between the two datasets; however, the association of its indicators sdg_11_52: Premature Deaths Due To Exposure To Fine Particulate Matter (PM2.5) (EU dataset) and 11.6.2: Annual mean levels of fine particulate matter (e.g., PM2.5 and PM10) in cities (population weighted) (UN dataset) is strong, with ρ = 0.92 (see Figure 7).
To identify the most effective partnerships and collaborations between both the EU and UN SDG indicators, it is essential to proactively detect their synergies and trade-offs. To be able to evaluate the interactions between the goals in terms of trade-offs or synergies, we only take into account the statistically significant (p-value 0.05 ) correlations of their indicators with a b s ( ρ ) 0.7 , as detailed in Figure 6 and Figure 7.
All indicators were assigned with a positive or a negative sign, determined by whether their uptrend contributes to the progress of their corresponding SDG or not. Based on this annotation, we expect a positive correlation when they have the same sign, or a negative otherwise. An interlinkage between two indicators of different goals is classified as a synergy when their actual correlation sign matches the expected one and as a trade-off in the opposite scenario. The synergies and trade-offs were identified based on the EU SDG indicators set in Figure 10a, the UN SDG indicators set in Figure 10b, and among the indicators of the two datasets in Figure 11.
In the EU dataset, SDG 10: Reduced Inequalities emerges not only with the strongest and the majority of correlations with other goals (as illustrated in Figure 8a), but it also exhibits the highest share of synergies. Its synergies are also dominant in the UN SDG framework (Figure 8b) and among the two datasets, as depicted in Figure 11. Based on the amount of synergies, SDG 10 may act as a central point for successfully implementing the Sustainable Agenda. On the contrary, trade-offs are prevalent for SDG 7: Affordable and clean energy and SDG 16: Peace, Justice, and Strong Institutions, both in the EU context and across EU–UN datasets, illustrating the challenges towards their successful implementation.
Furthermore, SDG 13: Climate action, even though it appears only with trade-offs in the UN SDG dataset, in the EU and combined dataset its correlations are mostly synergies. As already mentioned, SDG 3: Good health and well-being is interlinked with SDG 10: Reduced Inequalities and SDG 6: Clean water and sanitation in the EU context, but Figure 10a shows that these interactions are mainly trade-offs. In addition, while SDG 8: Decent work and economic growth and SDG 9: Industry, Innovation, and Infrastructure are linked with more SDGs in the EU context compared with the UN context, in the latter these connections are only synergies (Figure 10b) whereas in the EU context we identify some trade-offs too (Figure 10a). Overall, taking into account both datasets and the interlinkages among them, the majority of correlations between the SDGs are synergistic. Particularly, SDGs 17: Partnership for the goals, 10: Reduced Inequalities, SDG 9: Industry, Innovation, and Infrastructure and SDG 8: Decent work and economic growth stand out as crucial objectives at the national level due to their strong correlations along with their high percentage of synergies.

5.3. Examination of Interlinkages at Regional Level

To analyze the relations between the 16 EU SDG indicators with available data in the optimal range [2011, 2021] in the 101 Urban NUTS 2 regions (Figure 4b), we start by conducting the Spearman correlation analysis. Figure 12 illustrates all the statistically significant (p-value 0.05 ) correlations. The majority of the indicators at the urban regional scale are associated with a negative ρ and only three correlation absolute values exceed 0.7. The highest correlations that are also positive, appear between the indicator measuring the Percentage of population in the labor force (sdg_09_30) with the indicator sdg_09_10: Percentage of gross domestic product and the indicator sdg_10_10: Purchasing Power Adjusted Gdp Per Capita, but also the pair of two indicators of SDG 1 (sdg_01_10: People At Risk Of Poverty Or Social Exclusionsdg_01_20: Persons At Risk Of Monetary Poverty After Social Transfers). The indicators seem to be very similar, and for this reason, the correlation values are very high.
To gain deeper insights into the correlation coefficients ( ρ ) exceeding 0.5, we construct Figure 13. The top graph of Figure 13 presents the SDGs with statistically significant correlated indicators, of which the a b s ( ρ ) is higher than 0.5. As illustrated in Figure 5b, the selected indicators at the NUTS 2 urban level refer to the SDGs 1, 3, 4, 5, 8, 9, 10, 11 and 16. However, SDGs 3, 5 and 16, were not included in the graph, since they did not develop significant correlations. It is worth noting, however, that the SDGs may be represented by only one indicator at this level, as indicated by Eurostat. In the graph representation of goals, SDG 8: Decent work and economic growth, emerges as a central goal in the NUTS 2 regions, in accordance with the national level. SDG 10: Reduced Inequalities, is also a primary objective both at the national and regional level, given its strong correlations in Figure 13.
To better understand the high associations between the SDGs, the bottom graph in Figure 13 depicts the indicators correlated with ( a b s ( ρ ) 0.5 ) as nodes, where each node size is proportional to its total correlation coefficients. The indicators sdg_08_20, sdg_10_10, sdg_01_10, sdg_04_10, sdg_09_30 and sdg_09_10 are those with the biggest node sizes. While, the indicator sdg_08_20: Young People Neither In Employment Nor In Education And Training is the one with the majority of correlations and with values between (0.5, 0.6), the indicators sdg_01_10: People At Risk Of Poverty Or Social Exclusion, sdg_09_30: R&D Personnel By Sector and sdg_09_10: Gross Domestic Expenditure On R&D By Sector are those with the highest correlation values. Even though SDG 10 is represented by one indicator (sdg_10_10: Purchasing Power Adjusted GDP Per Capita) in the urban NUTS 2 level, it is connected with indicators coming from SDGs 8, 9 and 11.
To ensure the success of the SDGs in the NUTS 2 urban regions of EU-27 countries, it is essential to detect their synergies and trade-offs proactively. By understanding these interlinkages, the prioritization of actions will take place to enhance the policies that will advance the achievement of the 2030 Agenda at the urban regional scale.
Based on the approach that we followed at the national level, we identify synergies and trade-offs among the SDGs based on their indicator correlations. Synergies or trade-offs with absolute ρ values less than 0.3 are classified as not significant, whereas those with values in the range [0.3, 0.5) are classified as low. Additionally, the synergies or trade-offs with values in the ranges [0.5, 0.6), [0.6, 0.7) and [0.7, 1] are evaluated as medium, high and very high, respectively. Among all indicator pairs, only 52% of them indicate a significant interlinkage and are not classified as not significant synergy or a trade-off.
A valuable outcome of our study focusing on the urban regional scale is that there are no significant trade-offs between the SDGs at this level. The EU SDG indicators assigned to the NUTS 2 level, mainly form not significant or low synergies among the SDGs. SDG 8: Decent work and economic growth appears with five (medium) synergies, which all refer to its correlations with SDG 1: No poverty, SDG 4: Quality education, SDG 9: Industry, Innovation, and Infrastructure and SDG 10: Reduced Inequalities, as presented in Figure 14. On the other side, SDG 4 appears with only four but stronger synergies, regarding SDG 1 (one high and one medium synergy), SDG 8: Decent work and economic growth (one medium synergy) and SDG 9 (one medium synergy). Since the correlation values of the trade-offs of SDG 4 are lower than 0.3 and therefore insignificant, it can be concluded that SDG 4 is a pivotal goal at an urban-regional scale of the EU-27 countries. In the EU regional context, high-quality education (SDG 4) is highly interlinked with investment in infrastructure and innovation (SDG 9), the eradication of poverty (SDG 1) and overall economic growth and development (SDG 8).
In addition, the strongest synergies (high and very high) exist between SDG 9: Industry, innovation, and economic growth and SDG 10: Reduced Inequalities. As verified by indicators correlations between the two SDGs in Figure 13, innovation and research progress (sdg_09_10: Gross Domestic Expenditure On R&D By Sector, sdg_09_30: R&D Personnel By Sector) depends highly and is reinforced by the economic growth of a region (sdg_10_10: Purchasing Power Adjusted Gdp Per Capita). The only SDG that has no significant interlinkages (synergy of trade-off) at such a granular geographical level is SDG 16: Peace, Justice, and Strong Institutions.

6. Discussion

Following the detailed description of our approach for managing and analyzing SDG data based on a Knowledge Graph, we shortly refer to some limitations that have been identified, as well as provide a short comparison of the provided results with results in relevant studies.
With regards to limitations, it can be claimed that to examine sustainable development aspects in a holistic way, the interconnection among the various SDGs and targets has to be an integral part of the analysis. To achieve qualitative analysis of such data, the main barrier concerns data availability and quality. SDG data analysis has to be enabled in different time and spatial resolutions. However, availability of such data is limited, while their quality cannot be considered as granted. Semantic alignment of data is also crucial and can be easily supported in case of data coming from large SDG repositories, such as the UN SDG Database and Eurostat. However, in case of data coming from environmental agencies, IoT infrastructure in smart cities, and satellite infrastructure, semantic alignment has to be provided. Such an alignment can boost the analysis of SDG data in local regions, considering both urban and rural environments. As detailed in the manuscript, the adoption of novel knowledge management technologies, such as Knowledge Graphs is important.
In the current work, focus is given on a correlation analysis among the SDG indicators, as defined by the UN and EU SDG datasets, at national and urban NUTS 2 levels. The produced results and insights are important, but indicative ones. Valuable insights have emerged regarding the compliance of the European Commission to the 2030 Agenda for Sustainable Development. Based on the analysis results, it can be claimed that the associations among the SDGs depend highly on the geographical level of focus, and therefore policy measures toward sustainability at each level should be differentiated accordingly. Nevertheless, some objectives can be tackled holistically at both levels.
The pillars of sustainability that exert significant influence across the entire spectrum of SDGs are centered around inclusive economic growth (SDG 8), which is bound with investment in infrastructure (SDG 9) and reduction of inequalities (SDG 10) by providing work opportunities to all segments of the population, including marginalized groups. The partnership for sustainable development (SDG 17) serves as a cornerstone for the aforementioned goals to be achieved. Focusing on these goals through strategies and policy making can stimulate general progress towards the achievement of sustainable development. On the contrary, access to affordable and clean energy (SDG 7) and justice, inclusive societies and institutions (SDG 16) appear with the highest proportion of notable trade-offs and require careful consideration in decision-making processes. Awareness should be also raised towards marine life (SDG 14) and gender equality (SDG 5) issues regarding social, political and economic discrimination, which appear disconnected from the other SDGs with no significant correlations.
Based on the provided quantitative results, comparison with existing studies may be mainly conducted at the national level, since there are few works available for analysis of SDG interlinkages at the regional level. It is worth noting that our analysis highlights the strong synergies and trade-offs between the SDGs, where a b s ( ρ ) 0.7 , compared to the existing studies that mostly consider values a b s ( ρ ) > 0.5 . Thus, some discrepancies may appear also due to specific thresholds. A hypothetical statement that is stated in previous research works [5,33,34] and also validated in our study, concerns synergies that appear to be more common than trade-offs. The strongest synergies are identified for SDGs 8, 9, 10 and 17, in our study. This result is aligned with the work in [33] for the SDGs 8 and 9; the work in [34] for the SDGs 8, 9 and 17; and the work in [35] for the SDGs 8 and 17. Our study reveals that SDGs 5 and 14 have no strong synergies, while in the work detailed in [5], SDG 14 is one of the least synergistic SDGs. The analysis for the SDG 7 is in agreement with the work in [6] in terms of trade-offs, as it has the most trade-offs with the other SDGs, while SDG 2, which also has trade-offs with the other SDGs as suggested by the works in [5,6], possesses the fourth position in our study. Overall, it can be claimed that the results of our analysis are in accordance with the existing works in the field, given that we consider some dynamicity and discrepancies due to the differences in the considered datasets and time periods.

7. Conclusions

In the current manuscript we have detailed an approach for analysis of the interlinkages of the SDG indicators based on the adoption of an open-source knowledge management infrastructure, offered in the form of a Knowledge Graph called SustainGraph [15]. We have presented a methodology for the selection of indicators, data quality assessment, data quality improvement and data analysis over the SustainGraph. Following the methodology, various analysis processes have been realized, leading to insights with regards the interlinkages among the SDGs at national and regional levels. Both synergies and trade-offs among the SDGs are examined, highlighting the variations in the results based on the different datasets used as input and the applied spatial resolution.
The provided methodology and open-source tools can be adopted and extended to support analysis in different spatial resolutions, as well as to integrate further indicators that can be semantically aligned with the existing ones. This is part of potential future work, where emerging smart cities and citizen science platforms can be interlinked to the SustainGraph and feed it with qualitative data for urban environments. The development of open APIs for obtaining access and populating the SustainGraph with data make possible such developments. Furthermore, the current work can be expanded in the future to support a causal analysis among the SDGs in urban environments, and given the data availability at lower scales, to reveal the city measures in order to tackle appropriately various aspects of sustainability.

Author Contributions

Conceptualization, C.M.A., I.M., E.F., A.Z. and S.P.; methodology, C.M.A. and I.M.; software, C.M.A., I.M. and E.F.; validation, C.M.A., I.M., E.F., A.Z. and S.P.; formal analysis, C.M.A. and I.M.; data curation, C.M.A., I.M. and E.F.; writing—original draft preparation, C.M.A., I.M. and E.F.; writing—review and editing, A.Z. and S.P.; visualization, C.M.A. and I.M.; supervision, S.P. All authors have read and agreed to the published version of the manuscript.

Funding

This research work has received funding from the European Union’s Horizon 2020 research and innovation programme under grant agreement No 101037424.

Institutional Review Board Statement

Not applicable.

Informed Consent Statement

Not applicable.

Data Availability Statement

The developed software is made available as open-source, where GitLab repositories are provided for the SustainGraph [28] and the developed APIs [29]. Details for the used data are provided, while such data is also made available in the GitLab repository of the SustainGraph [28].

Conflicts of Interest

The authors declare no conflicts of interest.

Appendix A

Table A1. List of selected indicators from the UN SDG dataset.
Goal 1: NO POVERTY
1.1.1: Proportion of the population living below the international poverty line by sex, age, employment status and geographic location (urban/rural)
1.2.1: Proportion of population living below the national poverty line, by sex and age
1.2.2: Proportion of men, women and children of all ages living in poverty in all its dimensions according to national definitions
1.4.1: Proportion of population living in households with access to basic services
1.a.1: Total official development assistance grants from all donors that focus on poverty reduction as a share of the recipient country’s gross national income
Goal 2: ZERO HUNGER
2.1.1: Prevalence of undernourishment
2.1.2: Prevalence of moderate or severe food insecurity in the population, based on the Food Insecurity Experience Scale (FIES)
2.2.3: Prevalence of anaemia in women aged 15 to 49 years, by pregnancy status (percentage)
2.3.1: Volume of production per labour unit by classes of farming/pastoral/forestry enterprise size
2.5.1: Number of (a) plant and (b) animal genetic resources for food and agriculture secured in either medium- or long-term conservation facilities
2.5.2: Proportion of local breeds classified as being at risk of extinction
2.a.1: The agriculture orientation index for government expenditures
2.c.1: Indicator of food price anomalies
Goal 3: GOOD HEALTH AND WELL-BEING
3.1.1: Maternal mortality ratio
3.1.2: Proportion of births attended by skilled health personnel
3.2.1: Under-5 mortality rate
3.2.2: Neonatal mortality rate
3.3.1: Number of new HIV infections per 1,000 uninfected population, by sex, age and key populations
3.3.2: Tuberculosis incidence per 100,000 population
3.3.5: Number of people requiring interventions against neglected tropical diseases
3.a.1: Age-standardized prevalence of current tobacco use among persons aged 15 years and older
3.b.1: Proportion of the target population covered by all vaccines included in their national programme
3.c.1: Health worker density and distribution
3.d.1: International Health Regulations (IHR) capacity and health emergency preparedness
Goal 4: QUALITY EDUCATION
4.1.2: Completion rate (primary, lower secondary, upper secondary education)
4.2.2: Participation rate in organized learning (one year before the official primary entry age), by sex
4.3.1: Participation rate of youth and adults in formal and non-formal education and training in the previous 12 months, by sex
4.4.1: Proportion of youth and adults with information and communications technology (ICT) skills, by type of skill
4.5.1: Parity indices (female/male, rural/urban, bottom/top wealth quintile and others such as disability status, indigenous peoples and conflict-affected, as data become available) for all education indicators on this list that can be disaggregated
Goal 5: GENDER EQUALITY
5.5.1: Proportion of seats held by women in (a) national parliaments and (b) local governments
5.5.2: Proportion of women in managerial positions
Goal 6: CLEAN WATER AND SANITATION
6.1.1: Proportion of population using safely managed drinking water services
6.2.1: Proportion of population using (a) safely managed sanitation services and (b) a hand-washing facility with soap and water
6.4.1: Change in water-use efficiency over time
6.4.2: Level of water stress: freshwater withdrawal as a proportion of available freshwater resources
6.6.1: Change in the extent of water-related ecosystems over time
Goal 7: AFFORDABLE AND CLEAN ENERGY
7.1.1: Proportion of population with access to electricity
7.1.2: Proportion of population with primary reliance on clean fuels and technology
7.2.1: Renewable energy share in the total final energy consumption
7.3.1: Energy intensity measured in terms of primary energy and GDP
Goal 8: DECENT WORK AND ECONOMIC GROWTH
8.1.1: Annual growth rate of real GDP per capita
8.2.1: Annual growth rate of real GDP per employed person
8.3.1: Proportion of informal employment in total employment, by sector and sex
8.5.2: Unemployment rate, by sex, age and persons with disabilities
8.6.1: Proportion of youth (aged 15–24 years) not in education, employment or training
8.8.1: Fatal and non-fatal occupational injuries per 100,000 workers, by sex and migrant status
8.8.2: Level of national compliance with labour rights (freedom of association and collective bargaining) based on International Labour Organization (ILO) textual sources and national legislation, by sex and migrant status
8.9.1: Tourism direct GDP as a proportion of total GDP and in growth rate
8.10.1: (a) Number of commercial bank branches per 100,000 adults and (b) number of automated teller machines (ATMs) per 100,000 adults
8.a.1: Aid for Trade commitments and disbursements
Goal 9: INDUSTRY, INNOVATION AND INFRASTRUCTURE
9.1.2: Passenger and freight volumes, by mode of transport
9.2.1: Manufacturing value added as a proportion of GDP and per capita
9.2.2: Manufacturing employment as a proportion of total employment
9.3.1: Proportion of small-scale industries in total industry value added
9.4.1: CO2 emission per unit of value added
9.b.1: Proportion of medium and high-tech industry value added in total value added
9.5.1: Research and development expenditure as a proportion of GDP
9.5.2: Researchers (in full-time equivalent) per million inhabitants
9.c.1: Proportion of population covered by a mobile network, by technology
Goal 10: REDUCED INEQUALITIES
10.2.1: Proportion of people living below 50 per cent of median income, by sex, age and persons with disabilities
10.4.1: Labour share of GDP
10.5.1: Financial Soundness Indicators
10.7.4: Proportion of the population who are refugees, by country of origin
10.a.1: Proportion of tariff lines applied to imports from least developed countries and developing countries with zero-tariff
10.b.1: Total resource flows for development, by recipient and donor countries and type of flow (e.g., official development assistance, foreign direct investment and other flows)
Goal 11: SUSTAINABLE CITIES AND COMMUNITIES
11.6.2: Annual mean levels of fine particulate matter (e.g., PM2.5 and PM10) in cities (population weighted)
Goal 12: RESPONSIBLE CONSUMPTION AND PRODUCTION
12.2.2: Domestic material consumption, domestic material consumption per capita, and domestic material consumption per GDP
12.4.2: (a) Hazardous waste generated per capita; and (b) proportion of hazardous waste treated, by type of treatment
12.5.1: National recycling rate, tons of material recycled
12.b.1: Implementation of standard accounting tools to monitor the economic and environmental aspects of tourism sustainability
12.c.1: Amount of fossil-fuel subsidies (production and consumption) per unit of GDP
Goal 13: CLIMATE ACTION
13.1.1: Number of deaths, missing persons and directly affected persons attributed to disasters per 100,000 population
13.2.2: Total greenhouse gas emissions per year
Goal 14: LIFE BELOW WATER
14.1.1: (a) Index of coastal eutrophication; and (b) plastic debris density
14.5.1: Coverage of protected areas in relation to marine areas
14.7.1: Sustainable fisheries as a proportion of GDP in small island developing States, least developed countries and all countries
Goal 15: LIFE ON LAND
15.1.1: Forest area as a proportion of total land area
15.1.2: Proportion of important sites for terrestrial and freshwater biodiversity that are covered by protected areas, by ecosystem type
15.2.1: Progress towards sustainable forest management
15.4.1: Coverage by protected areas of important sites for mountain biodiversity
15.5.1: Red List Index
15.6.1: Number of countries that have adopted legislative, administrative and policy frameworks to ensure fair and equitable sharing of benefits
15.b.1: (a) Official development assistance on conservation and sustainable use of biodiversity; and (b) revenue generated and finance mobilized from biodiversity-relevant economic instruments
Goal 16: PEACE, JUSTICE AND STRONG INSTITUTIONS
16.1.1: Number of victims of intentional homicide per 100,000 population, by sex and age
16.2.2: Number of victims of human trafficking per 100,000 population, by sex, age and form of exploitation
16.3.2: Unsentenced detainees as a proportion of overall prison population
16.6.1: Primary government expenditures as a proportion of original approved budget, by sector (or by budget codes or similar)
16.8.1: Proportion of members and voting rights of developing countries in international organizations
Goal 17: PARTNERSHIPS FOR THE GOALS
17.1.1: Total government revenue as a proportion of GDP, by source
17.1.2: Proportion of domestic budget funded by domestic taxes
17.2.1: Net official development assistance, total and to least developed countries, as a proportion of the Organization for Economic Cooperation and Development (OECD) Development Assistance Committee donors’ gross national income (GNI)
17.3.2: Volume of remittances (in United States dollars) as a proportion of total GDP
17.6.1: Fixed Internet broadband subscriptions per 100 inhabitants, by speed
17.7.1: Total amount of funding for developing countries to promote the development, transfer, dissemination and diffusion of environmentally sound technologies
17.8.1: Proportion of individuals using the Internet
17.11.1: Developing countries’ and least developed countries’ share of global exports
17.12.1: Weighted average tariffs faced by developing countries, least developed countries and small island developing States
17.13.1: Macroeconomic Dashboard
17.18.1: Statistical capacity indicator for Sustainable Development Goal monitoring
Table A2. List of selected indicators from the EU SDG Dataset.
Goal 1: NO POVERTY
sdg_01_10: People At Risk Of Poverty Or Social Exclusion
sdg_01_20: Persons At Risk Of Monetary Poverty After Social Transfers - Eu-Silc And Echp Surveys
sdg_01_31: Severe Material And Social Deprivation Rate By Age Group And Sex
sdg_01_40: People Living In Households With Very Low Work Intensity, By Age Group
sdg_01_41: In Work At-Risk-Of-Poverty Rate
sdg_01_50: Housing Cost Overburden Rate By Poverty Status
Goal 2: ZERO HUNGER
sdg_02_20: Agricultural Factor Income Per Annual Work Unit (Awu) (Source: Eurostat, Dg Agri)
sdg_02_30: Government Support To Agricultural Research And Development
sdg_02_40: Area Under Organic Farming
sdg_02_60: Ammonia Emissions From Agriculture (Source: Eea)
Goal 3: GOOD HEALTH AND WELL-BEING
sdg_03_11: Healthy Life Years At Birth By Sex
sdg_03_20: Share Of People With Good Or Very Good Perceived Health By Sex
sdg_03_41: Standardised Death Rate Due To Tuberculosis, Hiv And Hepatitis By Type Of Disease
sdg_03_42: Standardised Preventable And Treatable Mortality
sdg_03_60: Self-Reported Unmet Need For Medical Examination And Care By Sex
Goal 4: QUALITY EDUCATION
sdg_04_10: Early Leavers From Education And Training By Sex
sdg_04_20: Tertiary Educational Attainment By Sex
sdg_04_31: Participation In Early Childhood Education By Sex (Children Aged 3 And Over)
sdg_04_60: Adult Participation In Learning In The Past Four Weeks By Sex
Goal 5: GENDER EQUALITY
sdg_05_20: Gender Pay Gap In Unadjusted Form
sdg_05_30: Gender Employment Gap, By Type Of Employment
sdg_05_40: Persons Outside The Labour Force Due To Caring Responsibilities By Sex
sdg_05_50: Seats Held By Women In National Parliaments And Governments (Source: Eige)
sdg_05_60: Positions Held By Women In Senior Management Positions (Source: Eige)
Goal 6: CLEAN WATER AND SANITATION
sdg_06_10: Population Having Neither A Bath, Nor A Shower, Nor Indoor Flushing Toilet In Their Household By Poverty Status
sdg_06_20: Population Connected To At Least Secondary Wastewater Treatment
sdg_06_30: Biochemical Oxygen Demand In Rivers (Source: Eea)
sdg_06_40: Nitrate In Groundwater (Source: Eea)
sdg_06_50: Phosphate In Rivers (Source: Eea)
sdg_06_60: Water Exploitation Index, Plus (Wei+) (Source: Eea)
Goal 7: AFFORDABLE AND CLEAN ENERGY
sdg_07_10: Primary Energy Consumption
sdg_07_11: Final Energy Consumption
sdg_07_20: Final Energy Consumption In Households Per Capita
sdg_07_30: Energy Productivity
sdg_07_40: Share Of Renewable Energy In Gross Final Energy Consumption By Sector
sdg_07_50: Energy Import Dependency By Products
sdg_07_60: Population Unable To Keep Home Adequately Warm By Poverty Status
Goal 8: DECENT WORK AND ECONOMIC GROWTH
sdg_08_10: Real Gdp Per Capita
sdg_08_11: Investment Share Of Gdp By Institutional Sectors
sdg_08_20: Young People Neither In Employment Nor In Education And Training By Sex (Neet)
sdg_08_30: Employment Rate By Sex
sdg_08_40: Long-Term Unemployment Rate By Sex
sdg_08_60: Fatal Accidents At Work Per 100 000 Workers, By Sex
Goal 9: INDUSTRY, INNOVATION AND INFRASTRUCTURE
sdg_09_10: Gross Domestic Expenditure On R&D By Sector
sdg_09_30: R&D Personnel By Sector
sdg_09_40: Patent Applications To The European Patent Office By Applicants’/Inventors’ Country Of Residence (Source: Epo)
sdg_09_50: Share Of Buses And Trains In Inland Passenger Transport
sdg_09_60: Share Of Rail And Inland Waterways In Inland Freight Transport
sdg_09_70: Air Emission Intensity From Industry
Goal 10: REDUCED INEQUALITIES
sdg_10_10: Purchasing Power Adjusted Gdp Per Capita
sdg_10_20: Adjusted Gross Disposable Income Of Households Per Capita
sdg_10_30: Relative Median At-Risk-Of-Poverty Gap
sdg_10_41: Income Distribution
sdg_10_50: Income Share Of The Bottom 40 % Of The Population
sdg_10_60: Asylum Applications By State Of Procedure
Goal 11: SUSTAINABLE CITIES AND COMMUNITIES
sdg_11_11: Severe Housing Deprivation Rate By Poverty Status
sdg_11_20: Population Living In Households Considering That They Suffer From Noise, By Poverty Status
sdg_11_40: Road Traffic Deaths, By Type Of Roads (Source: Dg Move)
sdg_11_52: Premature Deaths Due To Exposure To Fine Particulate Matter (Pm2.5) (Source: Eea)
sdg_11_60: Recycling Rate Of Municipal Waste
Goal 12: RESPONSIBLE CONSUMPTION AND PRODUCTION
sdg_12_21: Raw Material Consumption (Rmc)
sdg_12_30: Average Co2 Emissions Per Km From New Passenger Cars (Source: Eea, Dg Clima)
sdg_12_41: Circular Material Use Rate
sdg_12_51: Generation Of Waste By Hazardousness
sdg_12_61: Gross Value Added In Environmental Goods And Services Sector
Goal 13: CLIMATE ACTION
sdg_13_10: Net Greenhouse Gas Emissions (Source: EEA)
sdg_13_21: Net Greenhouse Gas Emissions Of The Land Use, Land Use Change And Forestry (Lulucf) Sector
sdg_13_40: Climate-Related Economic Losses (Source: EEA)
sdg_13_50: Contribution To The International 100Bn Usd Commitment On Climate-Related Expending (Source: Dg Clima, Eionet)
sdg_13_60: Population Covered By The Covenant Of Mayors For Climate & Energy Signatories (Source: Covenant Of Mayors)
Goal 14: LIFE BELOW WATER
sdg_14_40: Bathing Sites With Excellent Water Quality By Locality (Source: Eea)
sdg_14_60: Marine Waters Affected By Eutrophication (Source: Cmems)
Goal 16: PEACE, JUSTICE AND STRONG INSTITUTIONS
sdg_16_10: Standardised Death Rate Due To Homicide By Sex
sdg_16_20: Population Reporting Occurrence Of Crime, Violence Or Vandalism In Their Area By Poverty Status
sdg_16_30: General Government Total Expenditure On Law Courts
sdg_16_40: Perceived Independence Of The Justice System (Source: Dg Comm)
sdg_16_50: Corruption Perceptions Index (Source: Transparency International)
sdg_16_60: Population With Confidence In Eu Institutions By Institution
Goal 17: PARTNERSHIPS FOR THE GOALS
sdg_17_10: Official Development Assistance As Share Of Gross National Income
sdg_17_20: Eu Financing To Developing Countries By Financing Source (Source: Oecd)
sdg_17_30: Eu Imports From Developing Countries By Country Income Groups
sdg_17_40: General Government Gross Debt
sdg_17_50: Share Of Environmental Taxes In Total Tax Revenues
sdg_17_60: High-Speed Internet Coverage, By Type Of Area

References

  1. United Nations General Assembly. The Sustainable Development Goals. 2024. Available online: https://www.undp.org/sustainable-development-goals (accessed on 12 April 2024).
  2. Halkos, G.; Gkampoura, E.C. Where do we stand on the 17 Sustainable Development Goals? An overview on progress. Econ. Anal. Policy 2021, 70, 94–122. [Google Scholar] [CrossRef]
  3. Dawes, J. SDG interlinkage networks: Analysis, robustness, sensitivities, and hierarchies. World Dev. 2022, 149, 105693. [Google Scholar] [CrossRef]
  4. United Nations. Transforming Our World: The 2030 Agenda for Sustainable Development. 2024. Available online: https://sdgs.un.org/2030agenda (accessed on 12 April 2024).
  5. Bennich, T.; Persson, Å.; Beaussart, R.; Allen, C.; Malekpour, S. Recurring patterns of SDG interlinkages and how they can advance the 2030 Agenda. ONE Earth 2023, 6, 1465–1476. [Google Scholar] [CrossRef]
  6. Issa, L.; Mezher, T.; El Fadel, M. Can network analysis ascertain SDGs interlinkages towards evidence-based policy planning? A systematic critical assessment. Environ. Impact Assess. Rev. 2024, 104, 107295. [Google Scholar] [CrossRef]
  7. Cling, J.P.; Delecourt, C. Interlinkages between the Sustainable Development Goals. World Dev. Perspect. 2022, 25, 100398. [Google Scholar] [CrossRef]
  8. United Nations Statistics Division. The SDGs Geospatial Roadmap. 2024. Available online: https://unstats.un.org/unsd/statcom/53rd-session/documents/BG-3a-SDGs-Geospatial-Roadmap-E.pdf (accessed on 12 April 2024).
  9. López-Vargas, A.; Fuentes, M.; Vivar, M. Challenges and Opportunities of the Internet of Things for Global Development to Achieve the United Nations Sustainable Development Goals. IEEE Access 2020, 8, 37202–37213. [Google Scholar] [CrossRef]
  10. Jaber, M. IoT and machine learning for enabling sustainable development goals. Front. Commun. Netw. 2023, 4, 1219047. [Google Scholar] [CrossRef]
  11. Maheswar, R.; Kanagachidambaresan, G.R. Sustainable development through Internet of Things. Wirel. Netw. 2020, 26, 2305–2306. [Google Scholar] [CrossRef]
  12. Giuliani, G.; Mazzetti, P.; Santoro, M.; Nativi, S.; Van Bemmelen, J.; Colangeli, G.; Lehmann, A. Knowledge generation using satellite earth observations to support sustainable development goals (SDG): A use case on Land degradation. Int. J. Appl. Earth Obs. Geoinf. 2020, 88, 102068. [Google Scholar] [CrossRef]
  13. Kavvada, A.; Metternicht, G.; Kerblat, F.; Mudau, N.; Haldorson, M.; Laldaparsad, S.; Friedl, L.; Held, A.; Chuvieco, E. Towards delivering on the Sustainable Development Goals using Earth observations. Remote Sens. Environ. 2020, 247, 111930. [Google Scholar] [CrossRef]
  14. Warchold, A.; Pradhan, P.; Thapa, P.; Putra, M.P.I.F.; Kropp, J.P. Building a unified sustainable development goal database: Why does sustainable development goal data selection matter? Sustain. Dev. 2022, 30, 1278–1293. [Google Scholar] [CrossRef]
  15. Fotopoulou, E.; Mandilara, I.; Zafeiropoulos, A.; Laspidou, C.; Adamos, G.; Koundouri, P.; Papavassiliou, S. SustainGraph: A knowledge graph for tracking the progress and the interlinking among the sustainable development goals’ targets. Front. Environ. Sci. 2022, 10, 1003599. [Google Scholar] [CrossRef]
  16. Androna, C.M.; Mandilara, I.; Fotopoulou, E.; Giannakopoulou, K.; Zafeiropoulos, A.; Papavassiliou, S. Socio-environmental Spatial Data Reduction and Integration in Knowledge Graphs. In Proceedings of the PACET 2024: PAnhellenic Conference on Electronics and Telecommunications, Thessaloniki, Greece, 28–29 March 2024. [Google Scholar]
  17. Chen, M.; Chen, L.; Cheng, J.; Yu, J. Identifying interlinkages between urbanization and Sustainable Development Goals. Geogr. Sustain. 2022, 3, 339–346. [Google Scholar] [CrossRef]
  18. Song, J.; Jang, C.H. Unpacking the sustainable development goals (SDGs) interlinkages: A semantic network analysis of the SDGs targets. Sustain. Dev. 2023, 31, 2784–2796. [Google Scholar] [CrossRef]
  19. Hürlimann, M.; Guo, Z.; Puig-Polo, C.; Medina, V. Impacts of future climate and land cover changes on landslide susceptibility: Regional scale modelling in the Val d’Aran region (Pyrenees, Spain). Landslides 2022, 19, 99–118. [Google Scholar] [CrossRef]
  20. Ning, Y.; Liu, H.; Wang, H.; Zeng, Z.; Xiong, H. UUKG: Unified Urban Knowledge Graph Dataset for Urban Spatiotemporal Prediction. In Proceedings of the Advances in Neural Information Processing Systems; Oh, A., Neumann, T., Globerson, A., Saenko, K., Hardt, M., Levine, S., Eds.; Curran Associates, Inc.: Sydney, Australia, 2023; Volume 36, pp. 62442–62456. [Google Scholar]
  21. Liu, Y.; Ding, J.; Fu, Y.; Li, Y. UrbanKG: An Urban Knowledge Graph System. ACM Trans. Intell. Syst. Technol. 2023, 14, 60. [Google Scholar] [CrossRef]
  22. Janowicz, K.; Hitzler, P.; Li, W.; Rehberger, D.; Schildhauer, M.; Zhu, R.; Shimizu, C.; Fisher, C.K.; Cai, L.; Mai, G.; et al. Know, Know Where, KnowWhereGraph: A densely connected, cross-domain knowledge graph and geo-enrichment service stack for applications in environmental intelligence. AI Mag. 2022, 43, 30–39. [Google Scholar] [CrossRef]
  23. Allen, C.; Smith, M.; Rabiee, M.; Dahmm, H. A review of scientific advancements in datasets derived from big data for monitoring the Sustainable Development Goals. Sustain. Sci. 2021, 16, 1701–1716. [Google Scholar] [CrossRef]
  24. Mandilara, I.; Fotopoulou, E.; Androna, C.M.; Zafeiropoulos, A.; Papavassiliou, S. Knowledge Graph Data Enrichment Based on a Software Library for Text Mapping to the Sustainable Development Goals. In Proceedings of the TEXT2KG 2023: Second International Workshop on Knowledge Graph Generation from Text, Hersonissos, Greece, 28 May–1 June 2023. [Google Scholar]
  25. EU SDG Indicator Review. Available online: https://ec.europa.eu/eurostat/web/sdi/information-data (accessed on 12 April 2024).
  26. ARSINOE Project. ARSINOE H2020 Project: Climate Resilient Regions through Systemic Solutions and Innovations. 2023. Available online: https://arsinoe-project.eu/ (accessed on 12 April 2024).
  27. Eurostat. Methodological Manual on Territorial Typologies; Eurostat: Luxembourg, 2018. [Google Scholar]
  28. SustainGraph Gitlab Repository; Mandilara, I.; Androna, C.M.; Fotopoulou, E.; Zafeiropoulos, A. SustainGraph Gitlab Repository. 2024. Available online: https://gitlab.com/netmode/sustaingraph (accessed on 12 April 2024).
  29. SustainGraph API Gitlab Repository; Androna, C.M.; Mandilara, I.; Fotopoulou, E.; Zafeiropoulos, A. SustainGraph Gitlab Repository. 2024. Available online: https://gitlab.com/netmode/sustaingraph_api (accessed on 12 April 2024).
  30. SustainGraph Correlation Indicators Gitlab Repository; Mandilara, I.; Androna, C.M.; Fotopoulou, E.; Zafeiropoulos, A. SustainGraph Gitlab Repository. 2024. Available online: https://gitlab.com/netmode/sustaingraph-correlation-indicators (accessed on 12 April 2024).
  31. Batista, G.; Monard, M.C. A Study of K-Nearest Neighbour as an Imputation Method. In Proceedings of the Soft Computing Systems—Design, Management and Applications, HIS 2002, Santiago, Chile, 1–4 December 2002; Volume 30, pp. 251–260. [Google Scholar]
  32. Spearman, C. The Proof and Measurement of Association between Two Things. Am. J. Psychol. 1904, 15, 72–101. [Google Scholar] [CrossRef]
  33. Kroll, C.; Warchold, A.; Pradhan, P. Sustainable Development Goals (SDGs): Are we successful in turning trade-offs into synergies? Palgrave Commun. 2019, 5, 140. [Google Scholar] [CrossRef]
  34. Bellantuono, L.; Monaco, A.; Amoroso, N.; Aquaro, V.; Lombardi, A.; Tangaro, S.; Bellotti, R. Sustainable development goals: Conceptualization, communication and achievement synergies in a complex network framework. Appl. Netw. Sci. 2022, 7, 14. [Google Scholar] [CrossRef] [PubMed]
  35. Laumann, F.; von Kügelgen, J.; Kanashiro Uehara, T.H.; Barahona, M. Complex interlinkages, key objectives, and nexuses among the Sustainable Development Goals and climate change: A network analysis. Lancet Planet. Health 2022, 6, e422–e430. [Google Scholar] [CrossRef] [PubMed]
Figure 1. The SustainGraph overview.
Sustainability 16 04328 g001
Figure 2. Representation of indicators in the SustainGraph.
Sustainability 16 04328 g002
Figure 3. Quality data assessment of indicators.
Sustainability 16 04328 g003
Figure 4. The selected indicators across all time ranges after the implementation of the Quality data assessment.
Sustainability 16 04328 g004
Figure 5. The selected indicators across the SDGs before and after the Quality data assessment step.
Sustainability 16 04328 g005
Figure 6. Correlations among the EU and UN SDG indicators with 0.7 a b s ( ρ ) 0.8 .
Sustainability 16 04328 g006
Figure 7. Correlations among the EU and UN SDG indicators with 0.8 < a b s ( ρ ) 1 .
Sustainability 16 04328 g007
Figure 8. Goal-level correlations at national scale.
Sustainability 16 04328 g008
Figure 9. Goal-level correlations at national scale from both the EU and UN SDG indicator sets.
Sustainability 16 04328 g009
Figure 10. Goal-level synergies and trade-offs between pairs of indicators coming from the EU SDG indicator and the UN SDG indicator set, with correlation a b s ( ρ ) 0.7 .
Sustainability 16 04328 g010
Figure 11. Goal-level synergies and trade-offs between pairs of indicators coming from both the EU SDG indicator and the UN SDG indicator set, with correlation a b s ( ρ ) 0.7 .
Sustainability 16 04328 g011
Figure 12. Correlation heatmap with p-value < 0.05 of indicators at NUTS 2 scale.
Sustainability 16 04328 g012
Figure 13. The goal-level and indicator-level correlations at NUTS 2 scale from the EU SDG indicator set.
Sustainability 16 04328 g013
Figure 14. Level of synergies and trade-offs between goals in NUTS 2 scale.
Sustainability 16 04328 g014
Table 1. Selection of representative SDG indicators.
StepNational LevelNUTS 2 Urban Level
Original dataset231 (UN), 102 (EU)21 (EU)
Indicators available in EU-27 countries and the associated Urban NUTS 2 regions217 (UN), 95 (EU)21 (EU)
Indicators with data availability in the period from 2000 to 2023217 (UN), 95 (EU)21 (EU)
Indicators with data availability in at least half of the geoAreas159 (UN), 92 (EU)19 (EU)
Indicators upon excluding those with Boolean values150 (UN), 92 (EU)19 (EU)
Indicators upon the qualitative data assessment99 (UN), 84 (EU)16 (EU)
Table 2. The percentage of missing values after the sequential interpolation steps.
StepPercentage of Missing Values (National Level)Percentage of Missing Values (NUTS 2 Urban Level)
Selection of the optimal time period10%17%
Application of time interpolation technique3%4%
Application of the KNN imputer0%0%
Table 3. Correlations of the EU–UN SDG indicator pairs classified as identical.
EU SDG IndicatorUN SDG IndicatorCorrelation Value
sdg_01_10: People At Risk Of Poverty Or Social Exclusion1.2.2: Proportion of men, women and children of all ages living in poverty in all its dimensions according to national definitions0.96
sdg_01_20: Persons At Risk Of Monetary Poverty After Social Transfers—Eu-Silc And Echp Surveys1.2.1: Proportion of population living below the national poverty line, by sex and age0.91
sdg_07_40: Share Of Renewable Energy In Gross Final Energy Consumption By Sector7.2.1: Renewable energy share in the total final energy consumption0.98
sdg_09_10: Gross Domestic Expenditure On R&D By Sector9.5.1: Research and development expenditure as a proportion of GDP1
sdg_17_10: Official Development Assistance As Share Of Gross National Income (Source: Dg Intpa, Oecd)17.2.1: Net official development assistance, total and to least developed countries, as a proportion of the Organization for Economic Cooperation and Development (OECD) Development Assistance Committee donors’ gross national income (GNI)0.77
Table 4. Correlations of the EU–UN SDG indicator pairs classified as similar.
EU SDG IndicatorUN SDG IndicatorCorrelation Value
sdg_01_20: Persons At Risk Of Monetary Poverty After Social Transfers—Eu-Silc And Echp Surveys10.2.1: Proportion of people living below 50 per cent of median income, by sex, age and persons with disabilities0.82
sdg_04_31: Participation In Early Childhood Education By Sex (Children Aged 3 And Over)4.2.2: Participation rate in organized learning (one year before the official primary entry age), by sex0.38
sdg_04_60: Adult Participation In Learning In The Past Four Weeks By Sex4.3.1: Participation rate of youth and adults in formal and non-formal education and training in the previous 12 months, by sex0.97
sdg_05_50: Seats Held By Women In National Parliaments And Governments (Source: Eige)5.5.1: Proportion of seats held by women in (a) national parliaments and (b) local governments0.69
sdg_05_60: Positions Held By Women In Senior Management Positions (Source: Eige)5.5.2: Proportion of women in managerial positions0.22
sdg_06_60: Water Exploitation Index, Plus (Wei+) (Source: Eea)6.4.2: Level of water stress: freshwater withdrawal as a proportion of available freshwater resources0.69
sdg_07_30: Energy Productivity7.3.1: Energy intensity measured in terms of primary energy and GDP−0.78
sdg_08_10: Real Gdp Per Capita8.1.1: Annual growth rate of real GDP per capita−0.3
sdg_08_20: Young People Neither In Employment Nor In Education And Training By Sex (Neet)8.6.1: Proportion of youth (aged 15–24 years) not in education, employment or training0.94
sdg_09_70: Air Emission Intensity From Industry9.4.1: CO2 emission per unit of value added0.4
sdg_10_10: Purchasing Power Adjusted Gdp Per Capita8.1.1: Annual growth rate of real GDP per capita−0.22
sdg_10_41: Income Distribution10.2.1: Proportion of people living below 50 per cent of median income, by sex, age and persons with disabilities0.83
sdg_11_60: Recycling Rate Of Municipal Waste12.5.1: National recycling rate, tons of material recycled0.63
sdg_16_10: Standardised Death Rate Due To Homicide By Sex16.1.1: Number of victims of intentional homicide per 100,000 population, by sex and age0.73
sdg_17_20: Eu Financing To Developing Countries By Financing Source (Source: Oecd)10.b.1: Total resource flows for development, by recipient and donor countries and type of flow (e.g., official development assistance, foreign direct investment and other flows)0.97
Disclaimer/Publisher’s Note: The statements, opinions and data contained in all publications are solely those of the individual author(s) and contributor(s) and not of MDPI and/or the editor(s). MDPI and/or the editor(s) disclaim responsibility for any injury to people or property resulting from any ideas, methods, instructions or products referred to in the content.

