Article

Pots to Plots: Microshock Weed Control Is an Effective and Energy Efficient Option in the Field

by
Daniel J. Bloomer
1,*,
Kerry C. Harrington
1,
Hossein Ghanizadeh
1 and
Trevor K. James
2
1
School of Agriculture and Environment, Massey University, Palmerston North 4474, New Zealand
2
Ethical Agriculture, AgResearch Limited, Hamilton 3214, New Zealand
*
Author to whom correspondence should be addressed.
Sustainability 2024, 16(11), 4324; https://doi.org/10.3390/su16114324
Submission received: 18 April 2024 / Revised: 7 May 2024 / Accepted: 15 May 2024 / Published: 21 May 2024
(This article belongs to the Section Sustainable Agriculture)

Abstract

:
Seeking low environmental impact alternatives to chemical herbicides that can be integrated into a regenerative agriculture system, we developed and tested flat-plate electrode weeding equipment applying ultra-low-energy electric shocks to seedlings in the field. Better than 90% control was achieved for all species, with energy to treat 5 weeds m−2 equivalent to 15 kJ ha−1 for L. didymum and A. powellii, and 363 kJ ha−1 (leaf contact only) and 555kJ ha−1 (plants pressed to soil) for in-ground L. multiflorum, all well below our 1 MJ ha−1 target and a fraction of the energy required by any other weeding system. We compared applications to the leaves only or to leaves pressed against the soil surface, to seedlings growing outside in the ground and to plants growing in bags filled with the same soil. No previous studies have made such direct comparisons. Our research indicated that greenhouse and in-field results are comparable, other factors remaining constant. The in-ground, outdoor treatments were as effective and efficient as our previously published in-bag, greenhouse trials. The flat-plate system tested supports sustainable farming by providing ultra-low-energy weed control suitable for manual, robotic, or conventional deployment without recourse to tillage or chemical herbicides.

1. Introduction

Sustainable farming and regenerative agriculture [1,2,3,4,5] are frameworks of principles and practices that address critical issues such as degraded soils and reduced water quality [6], pest resistance, and dependence on non-renewable energy supplies [7]. Commenting in 1995 on weed science in sustainable agriculture, Zimdahl [8] questioned agricultural practices that “largely ignored ecological concerns” and that addressed problems through increasing applications of fertilisers, pesticides, water and energy, and suggested a need to move from reliance on chemical technology. The flow of publications of regenerative agriculture has continued and more recent work has sought to define and validate regenerative farm systems [9], investigate opportunities and constraints of certification [10], and to introduce industry certification schemes [11]. Common among these is recognition of the need to reduce the use of chemical pesticides including herbicides and to minimise tillage. The potential impact of agrichemicals can be compared using the environmental impact quotient (EIQ) [12]. We have calculated the EIQ for process tomatoes crops grown in New Zealand and found that herbicides account for about one-third of the overall score. The need for alternative, non-chemical weed control methods has been well described in our earlier work [13], with consumer preference [14,15,16,17,18], legislative restrictions and public concern about environmental effects [19,20], development of regenerative growing systems [21], and herbicide resistance [22,23,24,25,26] noted as drivers. We also note the need to reduce soil tillage and energy consumption [27], and particularly to reduce dependence on fossil fuels.
As weed scientists, we have been seeking ultra-low-energy, non-herbicide weed control methods that can be implemented within a regenerative farming system. Discounting tillage and high energy systems such as flaming, steaming and laser treatment, we have focused on very-low-energy electrical weeding techniques. We have shown that electric weeding with pulsed electric microshocks (PMS) is an effective ultra-low-energy option that requires a fraction of the energy of any other system [28]. We demonstrated in greenhouse trials using a precisely placed point electrode that a minimal amount of electrical energy was sufficient to control small, non-tillering grasses and broadleaf weed seedlings up to 15 cm in height. At 5 J plant−1, a density considered reasonable for escape weeds surviving after a chemical herbicide or mechanical treatment [29,30,31], our system treating five plants m−2 would require 0.25 MJ ha−1 plus transport and actuation energy. Seeking an easy-to-deploy method, we then tested a flat-plate electrode to apply PMS to a grass and four broadleaf weed species [32]. We found that tillering Lolium multiflorum Lam. (Italian ryegrass) was more difficult to control, but a range of broadleaf weeds were successfully managed, with the energy required to kill 100% of seedlings varying from 0.1 to 0.9 MJ ha−1. This was still a very low energy requirement compared to other weed control options [27,29,31,33,34,35,36,37,38,39,40,41,42,43,44].
There is little information comparing treatment of plants with electricity in laboratory or greenhouse settings with treatment of similar plants in outdoor field settings. Diprose, Hackham and Benson [45] suggested that maybe two to three times more power was required to kill plants in the field compared to those grown in pots in a greenhouse, disagreeing with Chandler [46], who suggested that ten times more energy is required to kill plants in the field relative to those indoors. However, in each case the plants being compared were not equal. Chandler noted considerable variation based on species and age, and Diprose et al. proposed the difference they saw was due to plant size. Other electrical weeding research typically describes plant size, but not necessarily in comparable ways, making it difficult to compare different results. While some give physical measurements such as stem diameter and plant height [47], or number of leaves [48], plant age has also been used as a size descriptor. For example, Lati et al. [44] described pot experiments with weeds at various numbers of weeks after seeding. No physical size measurements at time of treatment were reported, although final biomass measurements were given. The size of contact area of the root surface with the growing medium was also found to be related to overall electrical resistance [49] and hence the energy needed to apply a certain dose to plants.
Electrocution of in-ground plants has been theorised since the 1890s [50,51] and commercially available since the 1970s [42,52,53,54]. However, these are all very-high-energy systems. Blasco et al. [48] investigating robotic weed control system architecture, treated weeds in a field crop with 15 kV shocks at 30 mA for 200 ms (90 J), and eliminated all weeds with fewer than five leaves or less than 20 cm tall and “no significant damage was caused to lettuces having more than ten leaves”. They did not report equivalent indoor or in-bag treatments. Mizuno et al. [47] developed an apparatus for laboratory application and showed small plants (40–60 mm height, 1–3 mm stem diameter) could be destroyed by one spark discharge of 0.14 J energy and very large plants (800–1200 mm height, 10–15 mm stem diameter) with repeated pulses totalling only 2 J. They also investigated its use outdoors, describing a low-energy spot weeder powered by a 12 V battery to kill Poa annua L. (annual poa) in golf courses using a 3 kV 200 W high-frequency alternating current (AC) discharge [55]. However, the different experiments are not linked to compare in vitro with in terra effects.
We have previously applied approximately 6 J single-pulse direct current (DC) shocks to in-ground weeds using point electrodes as part of prototype equipment testing. In that unreported work, treated species including Capsella bursa-pastoris L. (shepherd’s purse), Sonchus oleraceus L. (sow thistle), Lepidium didymum L. (twin cress) and P. annua (annual poa) showed no symptoms for about six days, after which most broadleaf plants senesced and died, but the grasses appeared harder to kill. We then completed numerous greenhouse studies using our multiple-pulse electric weeding system [28,32].
Seeking to determine that treatment effects on bagged plants growing in a greenhouse would transfer to commercial field conditions using regenerative practices, we took our ultra-low-energy PMS research outdoors and compared the effects of treatments applied to weeds grown in bags with those applied to weeds grown directly in the ground. In an extension of our earlier studies, our main objectives were to determine whether a flat-plate electrode used on outdoor, in-ground plants (field treatment) could apply a threshold “dose” of voltage and energy to achieve more than 90% mortality, to assess energy expenditure, and to compare relative responses of different species. We set a goal of attaining the energy efficiencies of our greenhouse trials, aiming to achieve control of five weeds m−2 at less than 1 MJ ha−1 plus transport energy. The trials reported here included transplanted L. didymum and Amaranthus powellii S. Wats. (redroot) seedlings, and L. multiflorum cv. “Winter Star” grown from directly sown seed. Comparisons of energy discharges and weed killing effectiveness are presented.

2. Materials and Methods

2.1. Equipment and Materials

A custom-built PMS device that produces multiple direct current (DC) pulses of up to 4.5 kV was developed by Weda Tech Ltd. (Hastings, New Zealand) (Figure 1A). The device was controlled using custom software running on a laptop, with the discharge voltage, pulse duration, pulse period and number of pulses able to be programmed. This sets the potential level of applied energy, but variations in the resistances of plants and soil affect discharge current so the actual energy discharged varies. To ensure full capacitor recharge, a 50 ms interval was maintained between pulses. A PicoScope 2000 series oscilloscope was coupled with a Pico TA044 high-voltage differential probe connected to the positive and earthing electrodes to monitor the applied doses. Pulse data were automatically recorded and logged in comma separated value (csv) files.
The first trial compared treatments applied to bagged L. didymum plants growing in a greenhouse with treatments applied to in-ground plants growing in a field. It also compared two earthing electrode types, having the earthing and application electrodes in different locations along a transect, and having the system with and without a plant as part of the circuit. The second and third trials compared the effectiveness of equivalent treatments on outdoor bag-grown A. powellii and L. multiflorum plants with plants growing in the ground beside them, and treatments with the application electrode in contact with the leaves only or with the plant pressed against the soil surface.
For the A. powellii and L. multiflorum trials, the positive application electrode was a flat rectangular aluminium plate with dimensions of 75 mm × 100 mm (Figure 1B). Earthing was achieved by a 5 mm diameter aluminium rod inserted 75 mm into the ground. For the L. didymum trial, the positive application electrode was a 40 mm diameter aluminium disc contacting the centre of seedlings (Figure 2). For part of the L. didymum trial, an alternative earthing arrangement was also tested, replacing the inserted 5 mm rod earthing electrode (Figure 2A) with a 30 mm aluminium disc pressed against the soil surface a few centimetres from the positive application electrode disc (Figure 2B).
In all trials, the growing medium was Hastings silt loam soil (Typic Orthic Gley [56]). The soil in the ground was dug manually, crumbled and raked to leave a level but slightly rubbly surface. Soil excavated from the same area was sieved to 5 mm and used to grow the bagged plants. After treatments were applied, the L. didymum bagged plants were kept in a greenhouse with clear 6 mm polycarbonate panes (Winter Gardenz, Auckland, New Zealand). The in-ground plants were planted nearby and covered by 1 cm mesh bird netting to avoid damage by rabbits or native pükeko birds. The A. powellii and L. multiflorum plants were grown in a temporary 3 m wide tunnel covered by 0.58 mm Cropsafe insect mesh (Cosio Industries, Auckland, New Zealand), with the bags placed adjacent to the in-ground plants.

2.2. Environmental Data

Temperature, wind, radiation, rain and humidity were logged by the Ruahapia weather station (HortPlus Ltd., Hastings, New Zealand) sited 100 m from the plots, and showed no values considered likely to cause any negative effects.
The soil moisture percentage for in-ground-grown plants at time of treatment was determined by multiple readings taken using a 200 mm probe-length Hydrosense II sensor (Campbell Scientific Inc., Logan, UT, USA) inserted into the soil in the vicinity of the plant and earthing electrode positions. For bag-grown plants, the bags were weighed at time of treatment. At the end of the trial, the soil was oven dried at 35 °C for three days, and percentage moisture was determined from the difference. Noting in the L. didymum trial that dry soil acted as electrical insulation, the subsequent A. powellii and L. multiflorum trials had a thin layer of approximately 5 mm of dry soil added to the wet soil surface before the soil-pressed treatments were applied, with the aim to minimise direct loss of applied electricity to the soil body. The added soil was included when determining dry weight at the end of the trial.
When L. didymum plants were treated, the in-bag soil moisture was uniform with a mean of 34.6% (n = 14, SD = 0.03). The in-ground soil had high variability in moisture content with depth, and while the soil surface had dried peds, the underneath was damp and very moist at depths below about 100 mm. The mean moisture in the top 200 mm was 36.2% (n = 10, SD = 1.2%). At treatment time, the soil moisture in bagged A. powellii plants was 32.7% (n = 84, SD = 3.2), slightly higher (p = 0.04) than in ground-grown plants at 31.3% (n = 28, SD2.9). Rain in the days prior to treatment caused soil moisture differences between bagged and in-ground L. multiflorum plants. Bagged plants did not drain well and had a significantly higher (p < 0.001) mean moisture content of 41.7% (n = 73, SD = 5.0) than in-ground plants with a mean soil moisture content of 27.1% (n = 47, SD = 4.7). There was no significant difference in soil moisture between plants within the in-ground treatments, nor between plants within the bagged treatments.

2.3. Methods

For each application, the pulse voltage and current were recorded and the discharged energy was calculated. Subsequent plant health was scored, and death rates were determined. Results were compared for bag- versus ground-grown plants, for electrode application to leaves only versus to plants pressed to the soil surface, and by applied dose.
Trial 1 compared treatments applied to L. didymum seedlings with four to eight leaves taken from a cropping field and grown individually in 450 mL bags in a greenhouse or in the ground outdoors at 150 × 200 mm spacing. At 7 days after treatment (DAT), L. didymum plants were scored for vigour, with a score of 1 accorded to fully healthy plants and a score of 0 to dead plants. Plant vigour assessment was subjective based on leaf colour, turgor and rosette growth with equal weightings. At 23 DAT, final assessments were made including survival (dead or alive), days to death, stem state, leaf and side shoot colour and turgidity. All the plants that were not obviously dead were classified as alive.
The effect of the soil itself on the amount of energy discharged by the machine was tested during the outdoor L. didymum trial, firstly by pairing earthing and positive treatment electrode rods inserted 10 cm apart and 75 mm into the soil at different locations along a transect, and secondly by inserting the earthing electrode probe 75 mm into the soil and applying the positive treatment electrode at increasing distances (Figure 3). To test the influence of earthing electrode types with or without plants as part of the circuit, the process was repeated using two earthing electrode options (a 5 mm diameter rod inserted 75 mm into the soil and a surface-pressed 30 mm diameter disc) and with the disc treatment electrode pressing plants to the soil surface and with no plants present. The resulting data were standardised by adjusting for the separation distance between the electrodes to give a value of energy per distance, expressed as J m−1. Fit was determined using power function trendlines. Comparisons were also made between two earthing electrode types (a 5 mm diameter rod inserted 75 mm into the soil and a surface-pressed 30 mm diameter disc), having the earthing and application electrodes in different locations along a transect (Figure 3), and having the system with and without a plant as part of the circuit.
In Trial 2, A. powellii plants were germinated in trays in a greenhouse from field soil with a known weed infestation and transplanted individually into either 450 mL soil-filled bags or directly into the ground at 150 × 200 mm spacings. Plant status was assessed using a condition score based on subjective observations of plant vigour (50%), stem tip angle (5%), stem collapse (10%), stem diameter (10%), shoot colour (5%), shoot turgor (5%), leaf colour (5%) and leaf turgor (10%) combined to give a total possible score of 20 for fully healthy plants. A dead plant scored 0 regardless of any other ratings. Final assessments were made 17 DAT, by which time plants were clearly alive or dead.
In Trial 3, L. multiflorum plants were sown in sets of six into 450 mL soil-filled bags or in the ground at 150 × 200 mm spacings. Prior to treatment, each set was thinned to three plants such that all were of similar size. The plants were measured and bagged sets of three plants were sorted into equivalent groups for treatment. Plants were visually assessed prior to treatment, with the number of green leaves and tillers counted, and the length of the longest leaf of each plant measured. Most plants had two or three leaves and one tiller, but some were starting to produce second tillers. Measurements of living plant tissues were repeated, and plant deaths were recorded until the trial was stopped 14 DAT. Severely shrivelled or dead parts of the leaf were discounted, and any totally brown and shrivelled plants were classified as dead.

2.4. Treatments

The doses selected for each trial were based on results from earlier greenhouse work with the same or similar species of similar size. Seeking to determine an effective dose rate, the lowest energy applied dose was expected to have little effect, and the highest energy dose was expected to kill all plants. For L. didymum, a range of treatments pressing the leaves to the soil surface was applied at 4.5 kV, with the bagged plants receiving a dose of either 25, 50 or 100 × 100 µs pulses. The in-ground plants were all treated with 100 × 100 µs pulses, but with two alternative earthing arrangements employed.
The A. powellii plants received a 4.5 kV dose of either 25 × 25 µs, 50 × 50 µs, 50 × 100 µs, 100 × 100 µs, or 100 × 200 µs pulses. The same treatments were applied to both bagged and in-ground plants, with the treatment electrode either on the leaves only or pressing the plant against the soil surface. A thin insulating layer of about 5 mm of dried sieved soil was applied to the moist soil surface before plants were pressed to the soil for treatment.
In our earlier L. multiflorum research, we found that higher voltages could damage fine grass leaves but failed to kill growing points at ground level [28]. In this trial, treatments were applied at either 3.5 or 4.5 kV, each with 100 × 200 µs, 200 × 200 µs, or 200 × 400 µs pulses. As with A. powellii, the same treatments were applied to both bagged and in-ground plants, with the electrode either on the leaves only or pressing the whole plant against the soil surface which, if moist, had a thin insulating layer of about 5 mm of dried sieved soil applied to the surface before plants pressed to the soil were treated. The mean plant size and treatments applied in each of the trials are summarised in Table 1.

2.5. Statistical Analysis

Data were statistically analysed using SPSS Version 28.0.1.0 (142). Where differences are reported, the default for statistical comparisons of groups was the independent samples Kruskal–Wallis one-way ANOVA (k samples) because almost all cases failed the Levene’s test for ANOVA homogeneity of variance. In each trial, plants were randomised, and each treatment had six replicates, a sample size satisfactory for Kruskal–Wallis [57]. For L. didymum and A. powellii, each replicate was one plant. For L. multiflorum, data were analysed with each bag of three grasses representing one replicate (n = 6). Following the recommendations of Armstrong [58] and Perneger [59], no multiple test (e.g., Bonferroni) corrections were applied. The Kruskal–Wallis pairwise and multiple comparisons stepwise step-down procedures were used to determine homogeneous sets. For both A. powellii and L. multiflorum, binary logistic regression was used to assess the factors contributing to plant death. The L. multiflorum binomial logistic regression analysis used data for individual plants rather than mean values of bags of three plants and excluded controls.

3. Results

3.1. Trial 1 Lepidium didymum

When bag-grown plants were treated with the disc earthing electrode, there was evidence of arcing with the treatment electrode disc, indicated by loud cracking and sparking observed during treatment, so the energy applied to the plants may have been very little or none. Assessment of plant vigour 7 DAT showed untreated control plants were all healthy with a plant vigour score = 1.0 (Figure 4).
Most of the bag-grown plants subject to the disc earthing electrode treatment were healthy, giving a mean plant vigour score = 0.62. The outdoor-grown plants treated using the disc earthing electrode were much weaker, with a vigour score = 0.28. The vigour of plants subjected to the probe earthing electrode treatment was 0.28 for both outdoor-grown treatments, 0.25 for the highest indoor treatment, and 0.35 and 0.33 for the lowest and middle treatments, respectively. Kruskal–Wallis pairwise multiple comparisons showed all treatments had significantly reduced vigour compared to the controls, but there was no significant difference among the treatments (Figure 4). After 27 days, none of the untreated control plants had died, and all in-ground treated plants had died. All the greenhouse bag-grown plants treated with the inserted probe earthing electrode died but half the plants subjected to the disc earthing electrode treatment, where probable arcing was noted, survived.
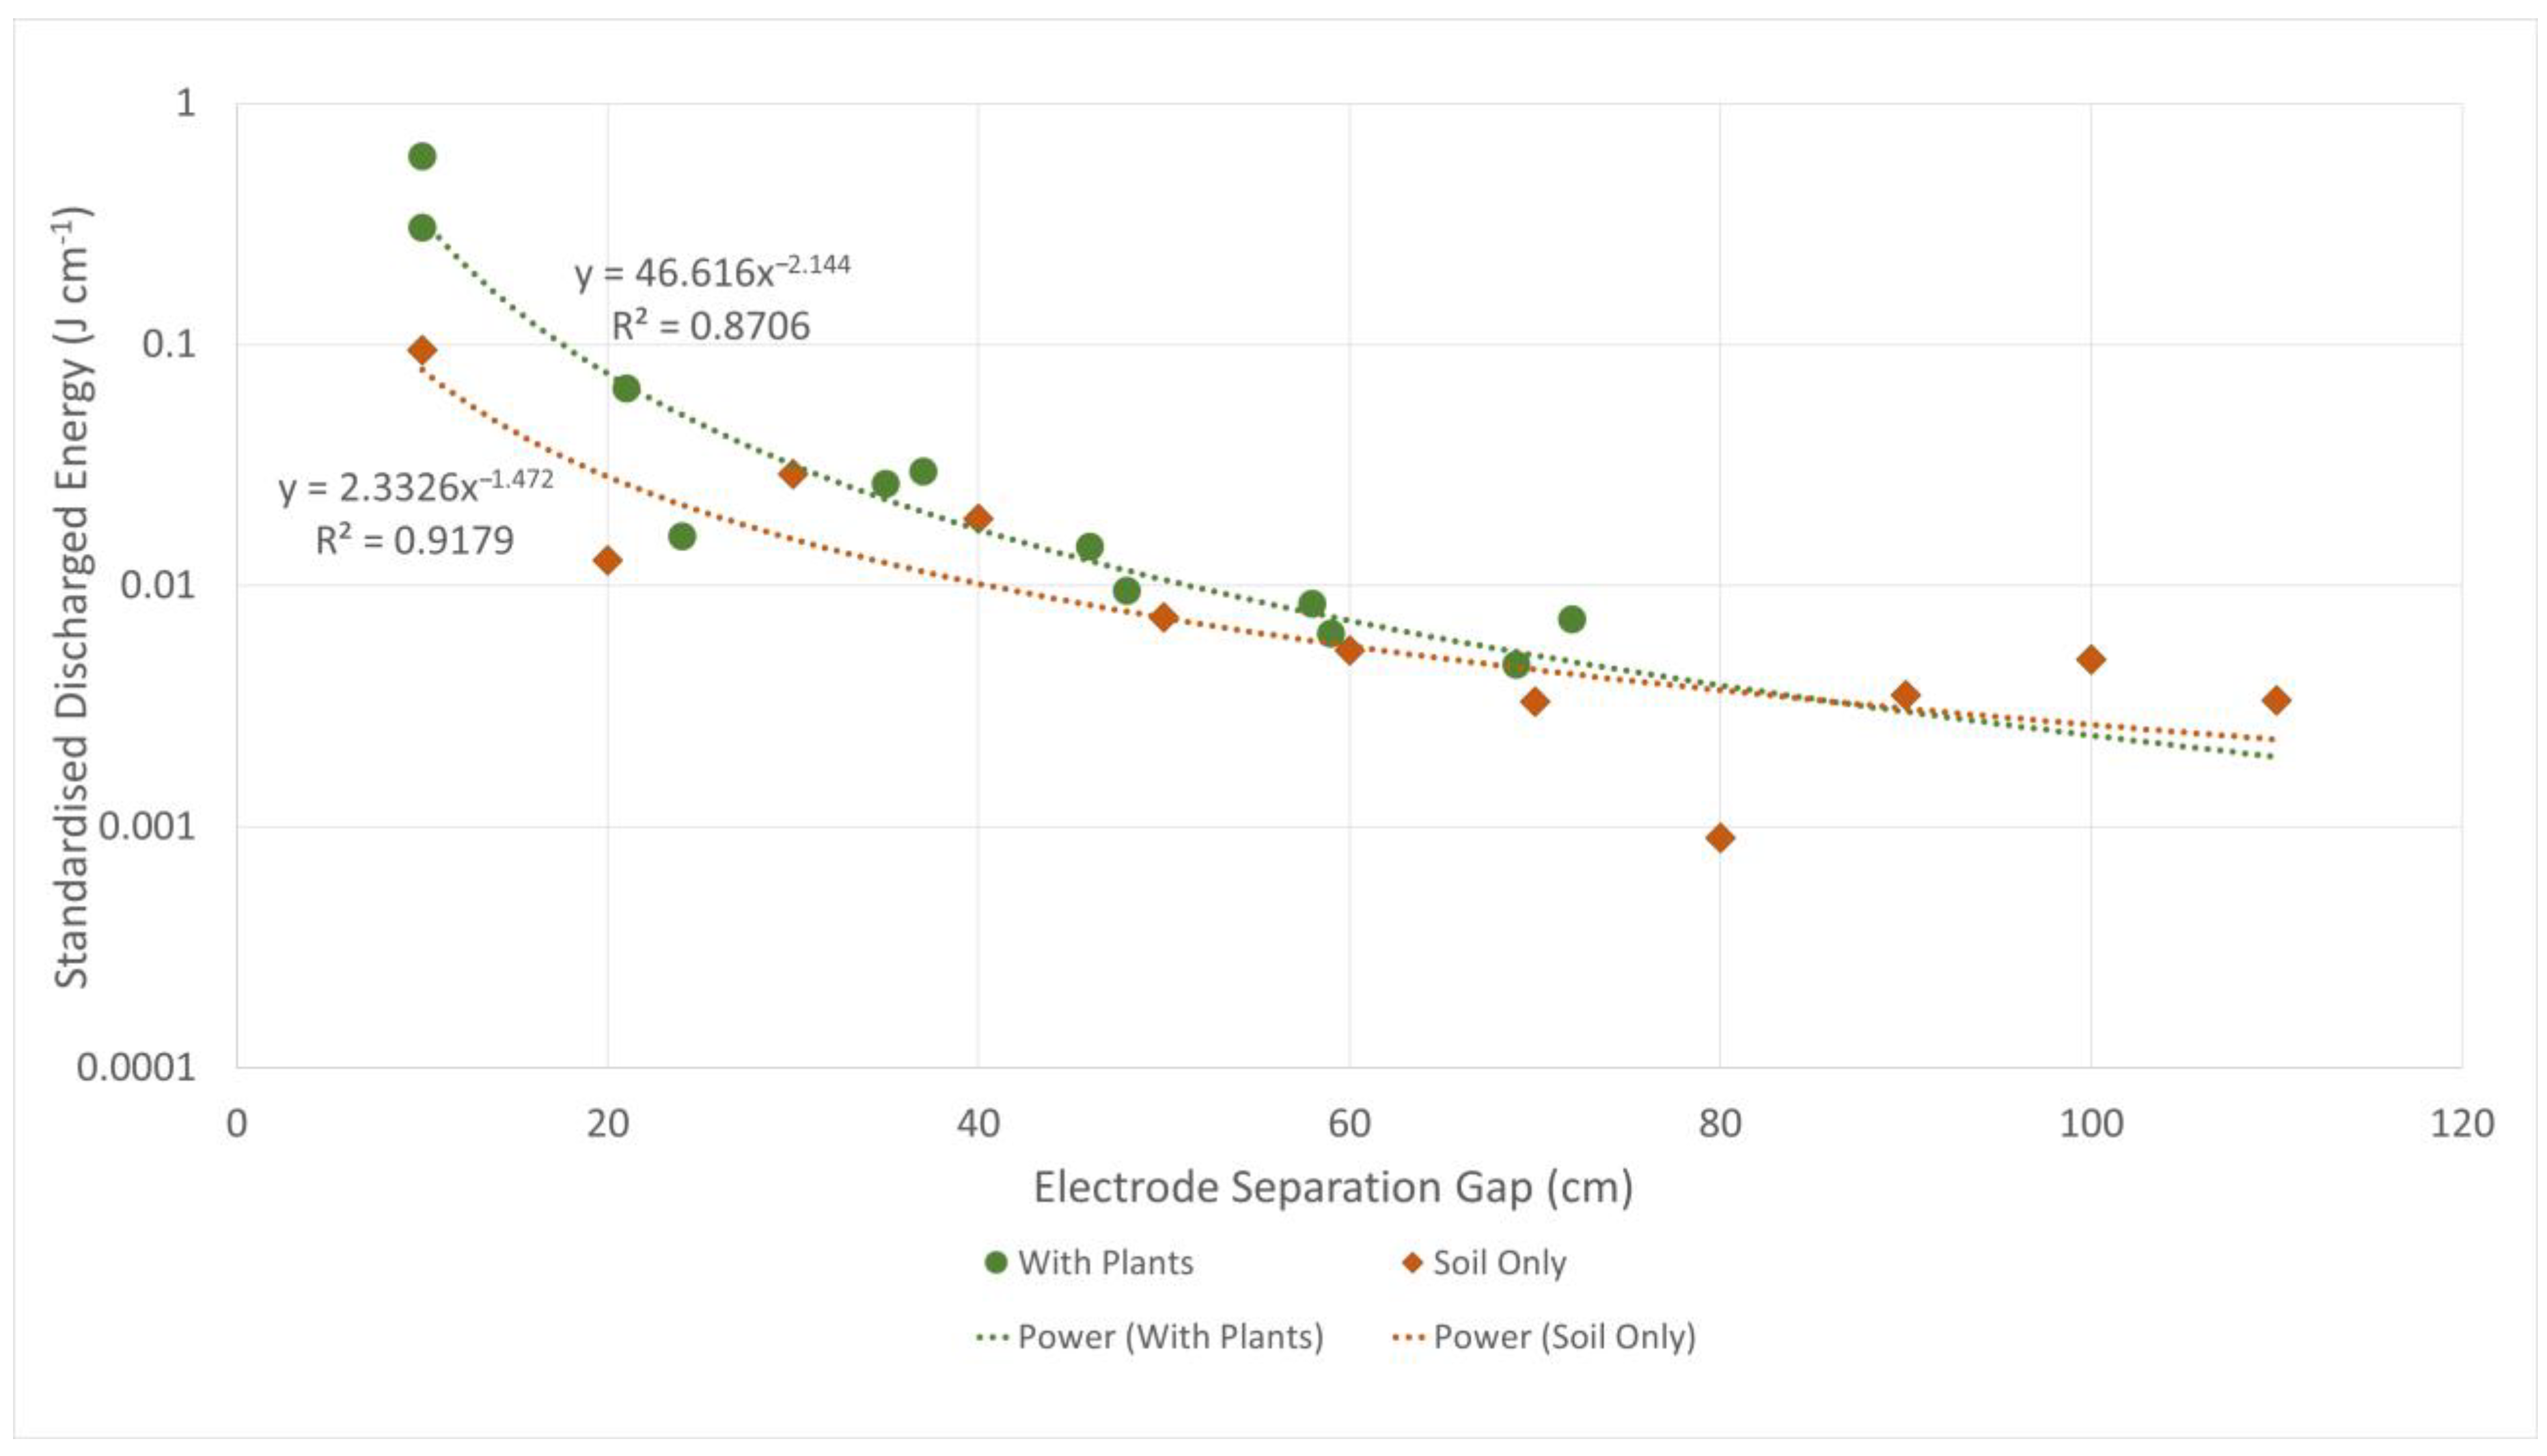
For the indoor-grown bagged plants, the amount of energy discharged using the inserted rod earthing electrode increased exponentially as the duration of discharge doubled (Table 2). Comparing 4.5 kV, 100 × 100 µs pulses, the energy discharge using a disc electrode pressing plants against a dry soil surface was approximately 20% that of the same dose applied with an inserted rod earthing electrode. The energy discharge of applications with a disc earthing electrode pressed to the soil in the open ground was 48% of that when the same dose was applied in bags. The energy discharged reduced with increasing electrode separation distance, exhibiting a strong decay curve (Figure 5). Power function trendlines showed a strong correlation for the applications made with a plant pressed to the soil surface (R2 = 0.99) and the applications to a bare soil surface only (R2 = 0.92). The power function was greater for the applications including plants, and discharges were 2.5 times greater for applications made to plants and soil than those made to the soil only.

3.2. Trial 2 Amaranthus powellii

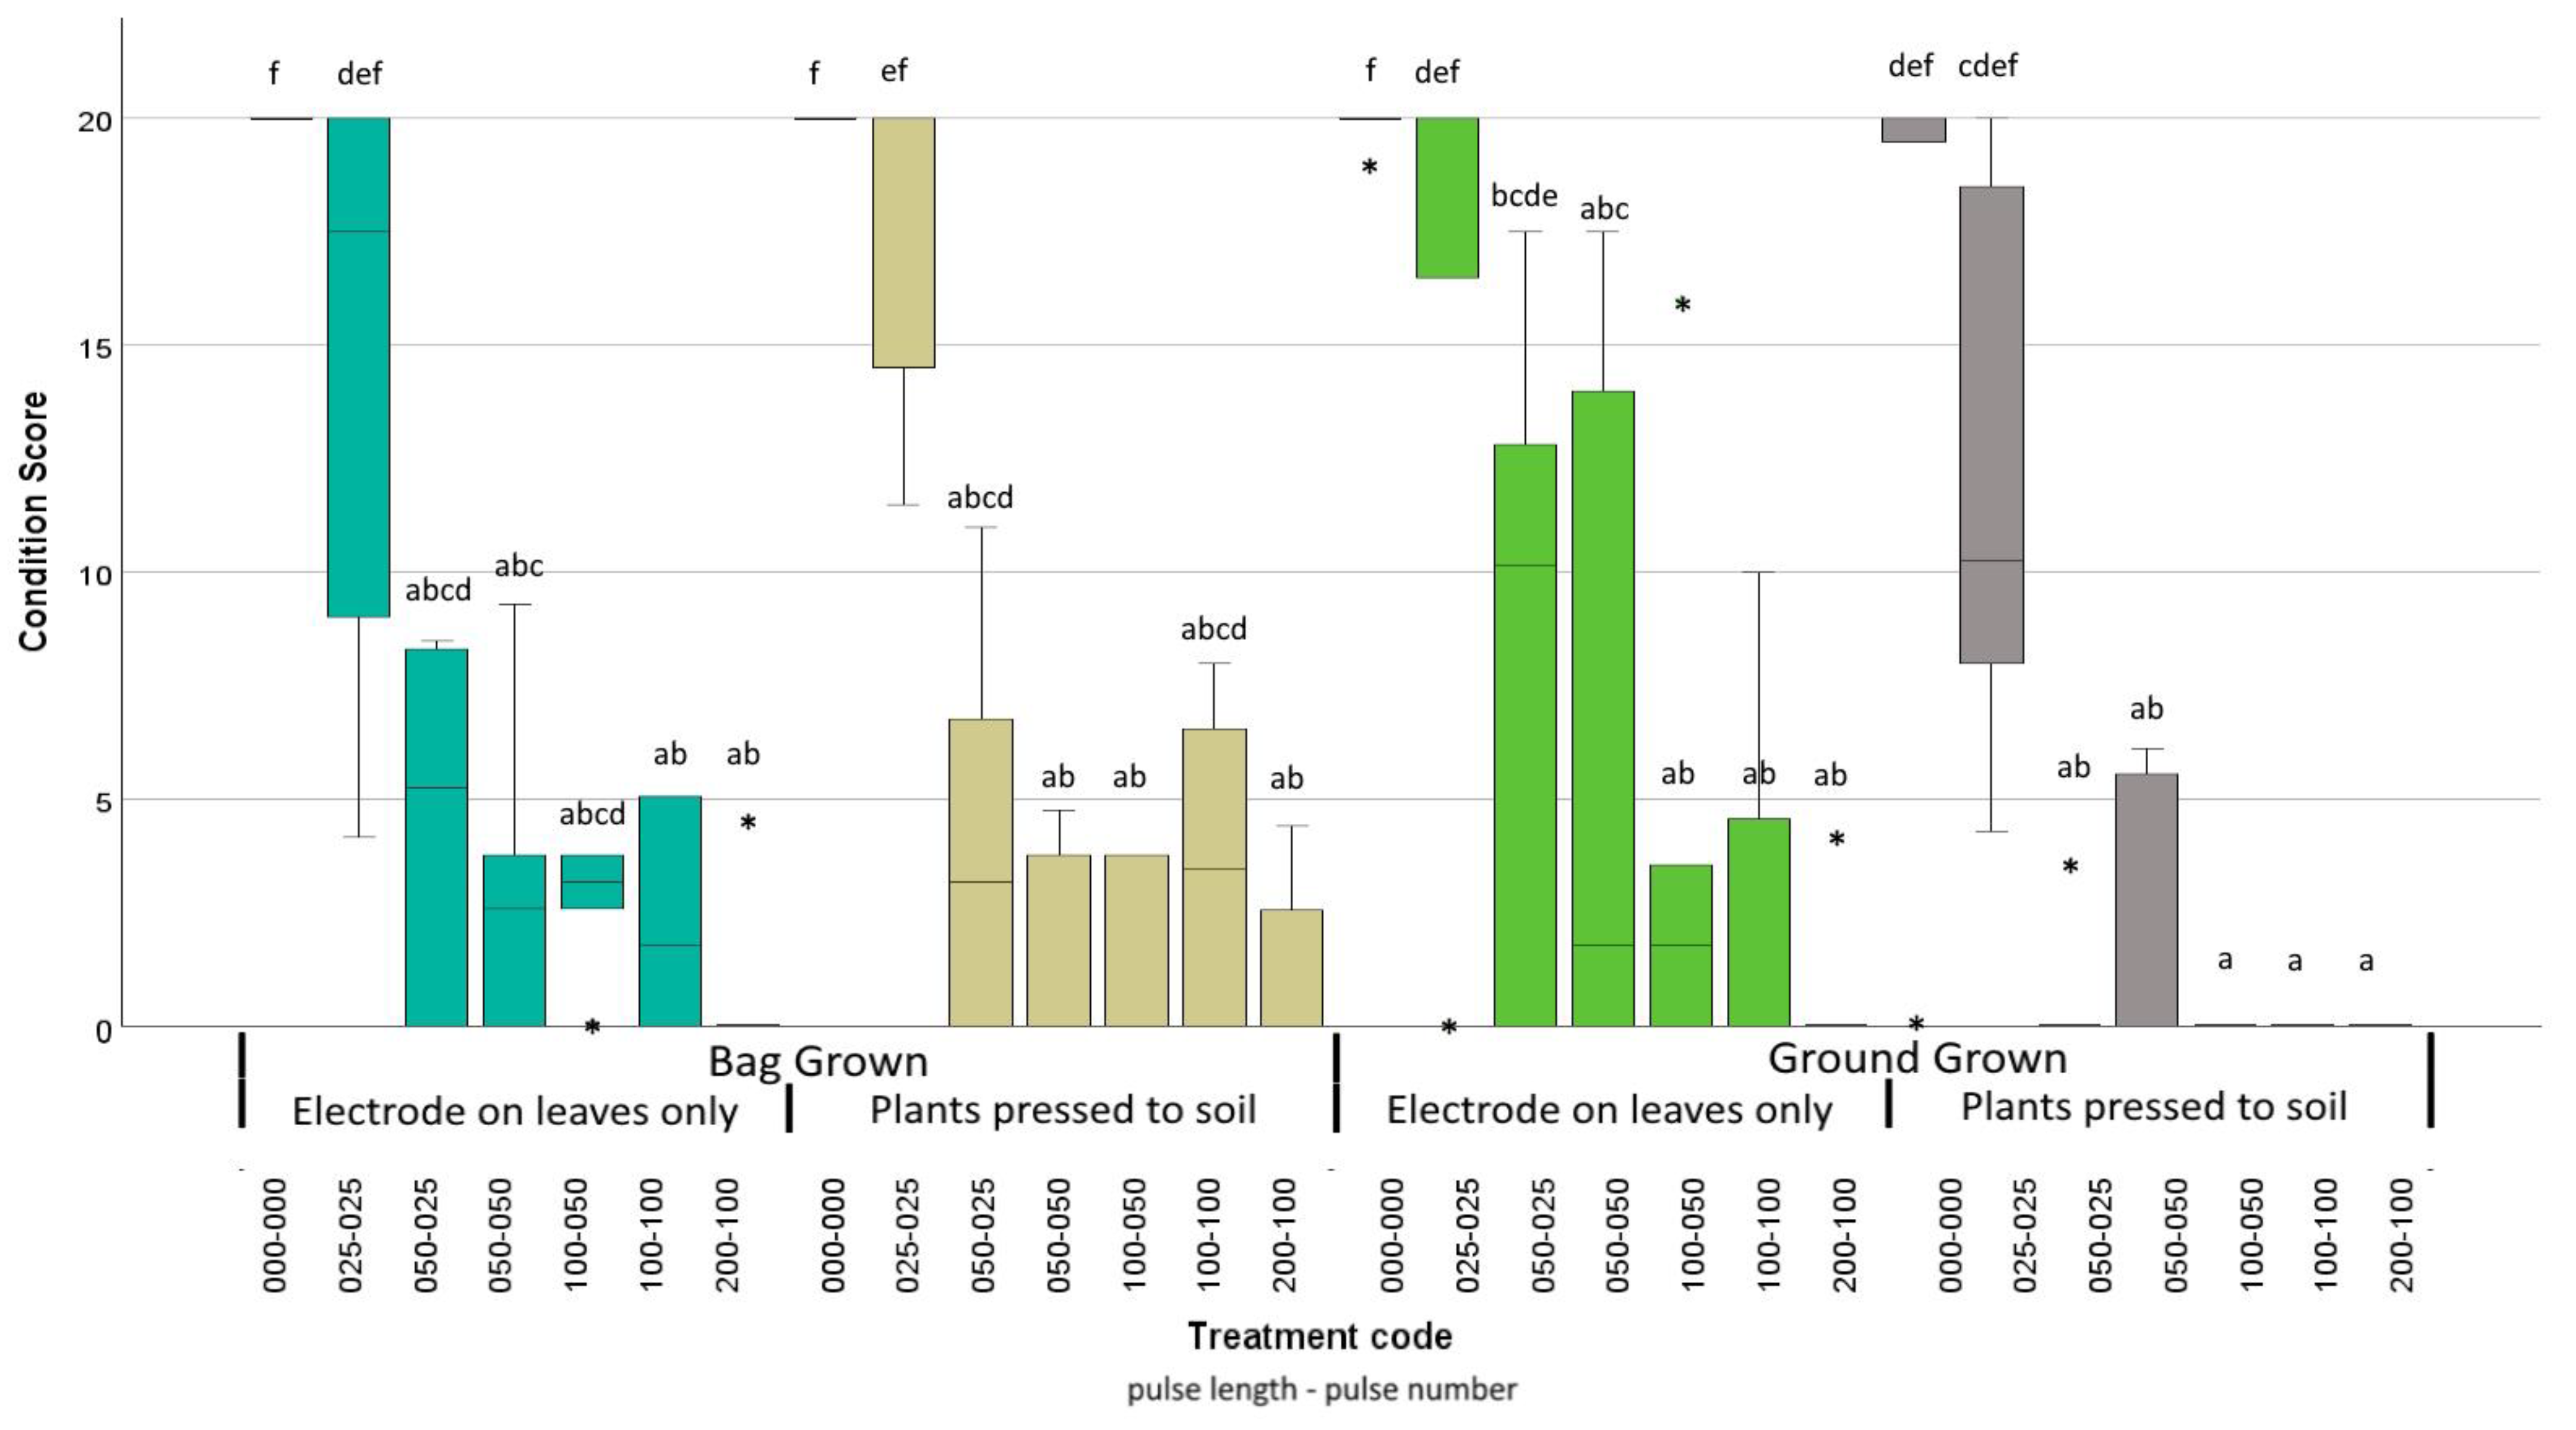
All untreated A. powellii control plants were alive and healthy 12 DAT, but there was a general trend for a lower condition score and a higher death rate with higher-energy treatments (Figure 6). There was little difference between the bag-grown plants treated by the electrode applied only to the leaf canopy or pressing the plant to soil. In-ground plants with treatments applied to the leaf canopy were generally healthier, whereas there were more early deaths among plants treated by pressing the whole plant to the soil.
At 15 DAT, all the A. powellii untreated control plants were healthy, and, in all treatments, there were some survivors and some deaths at the lowest energy doses. At higher doses, all plants died (Figure 7).
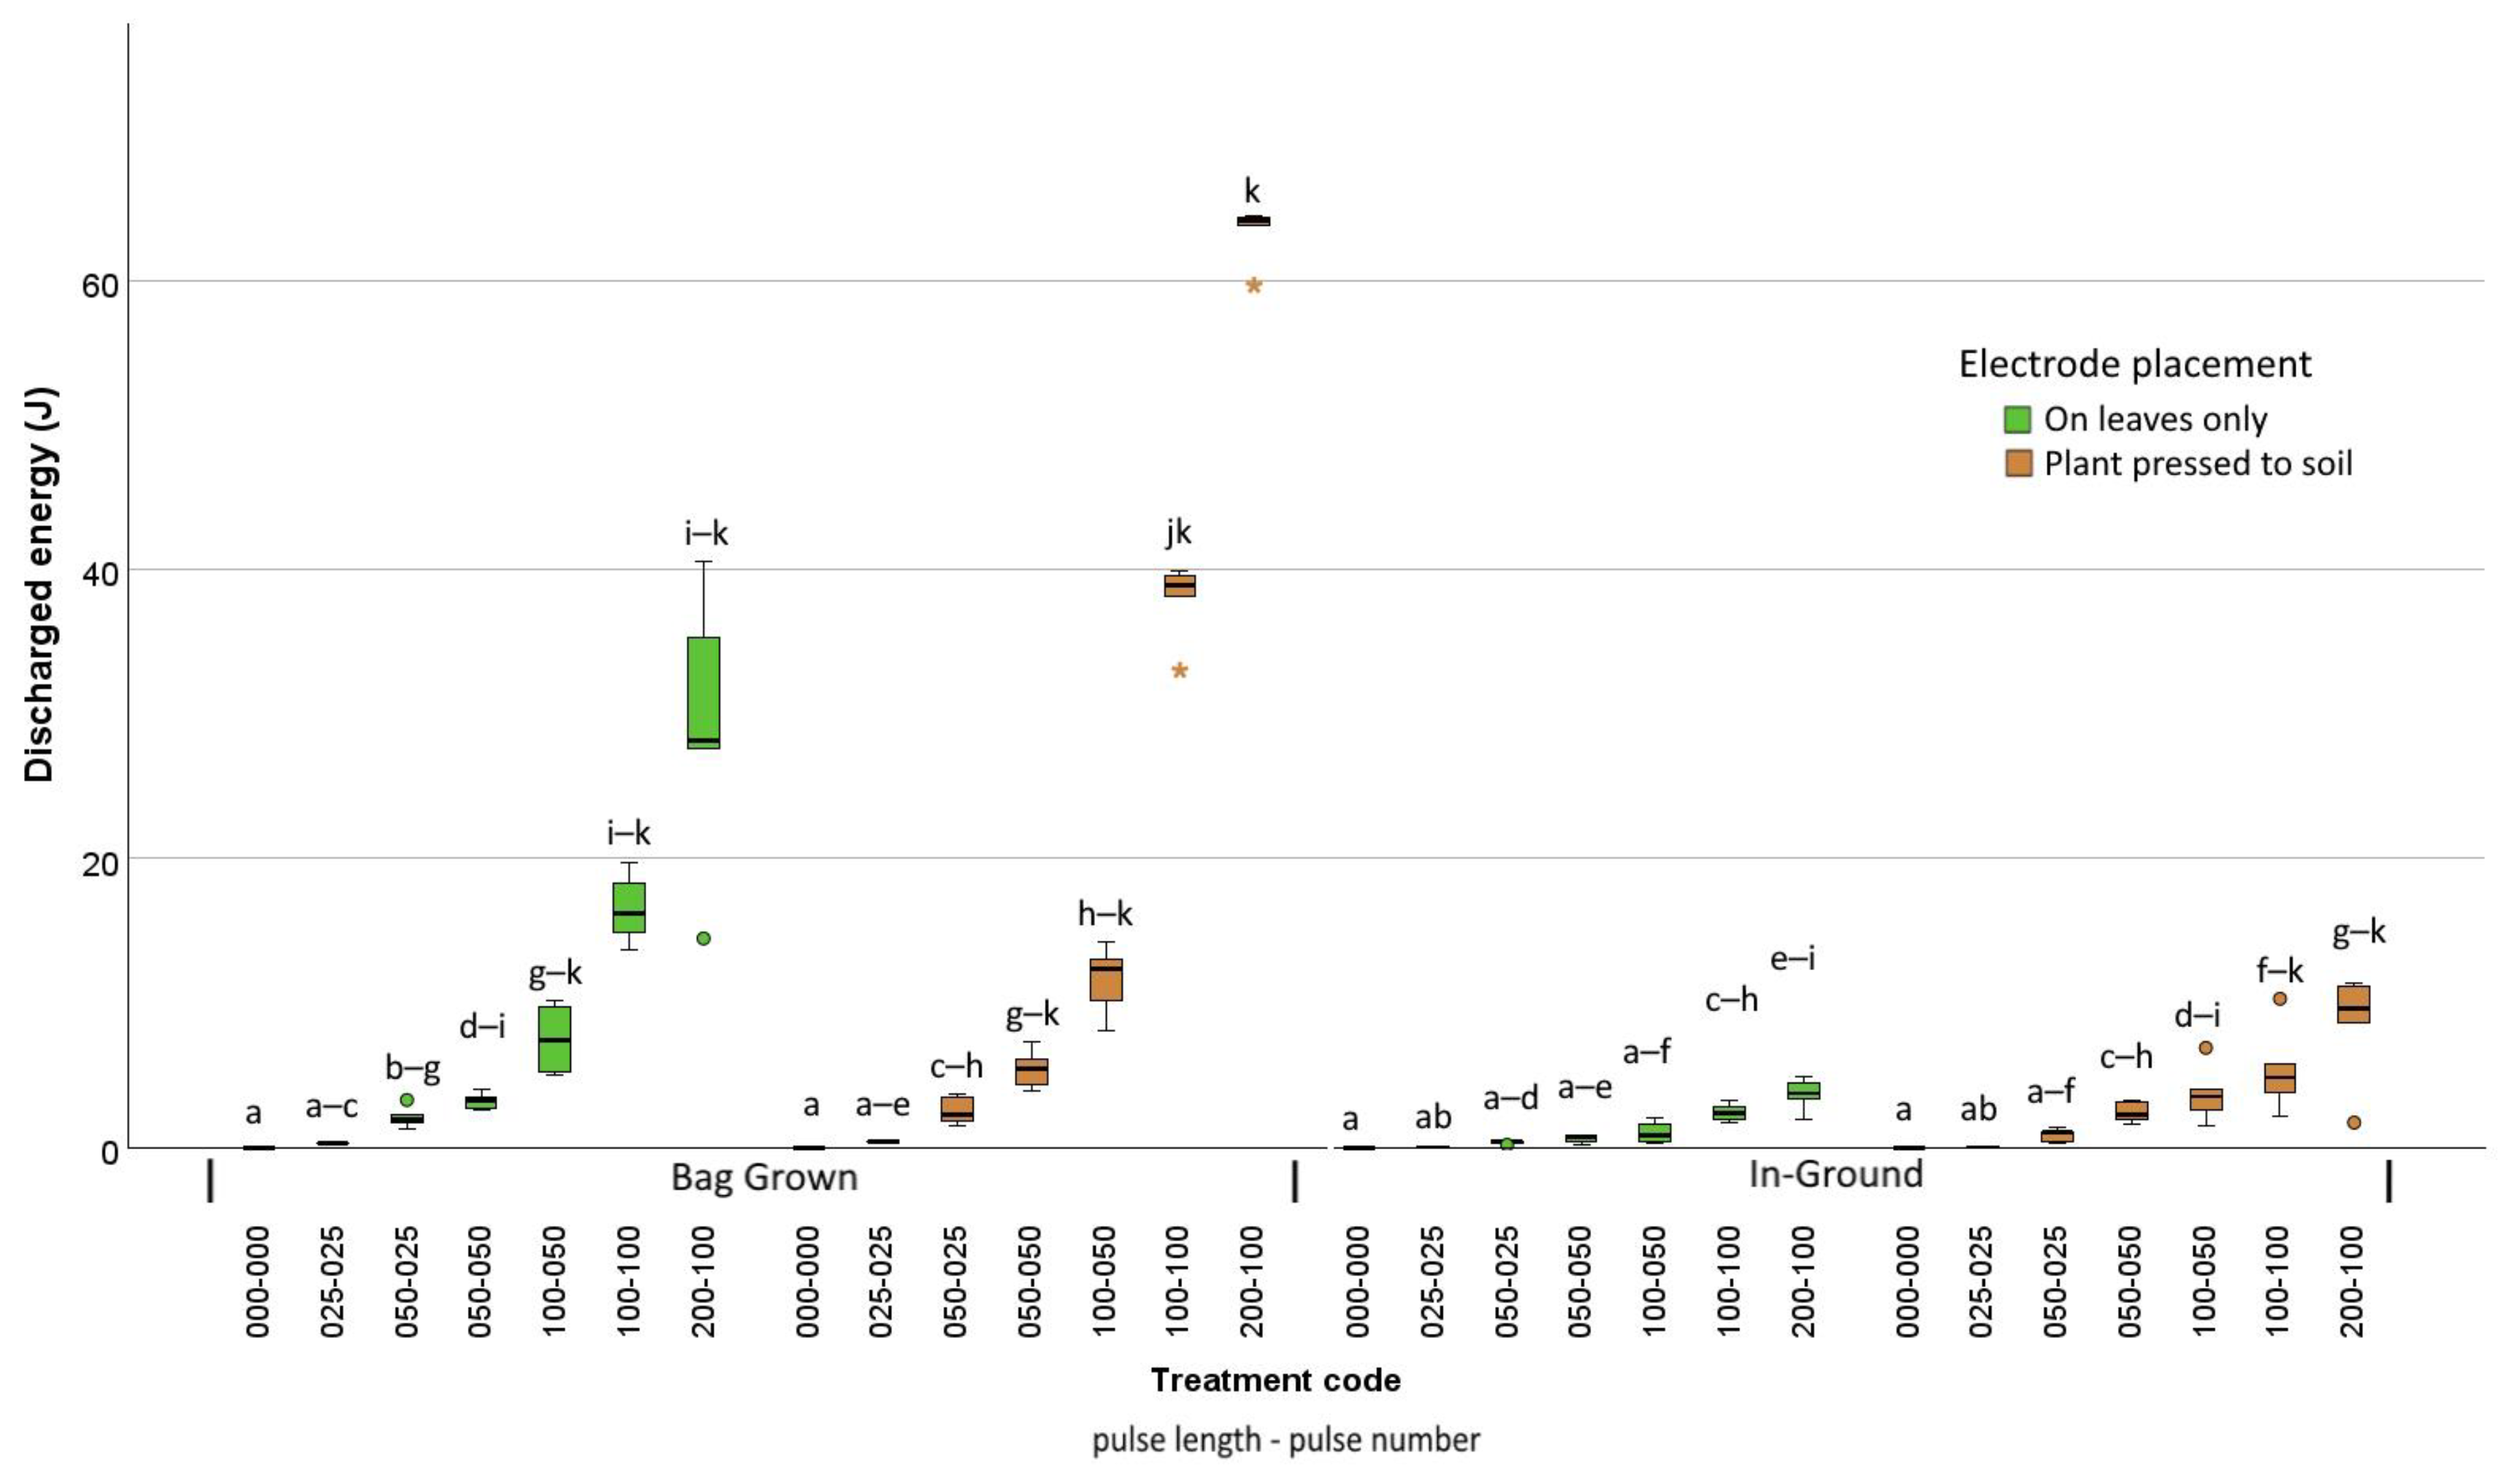
Far more energy was discharged when equivalent treatments were applied to A. powellii plants growing in bags than to plants growing in the ground, and more energy was discharged when applying treatments to whole plants pressed to the soil surface than to leaves only. Comparing equivalent doses applied under different scenarios showed that leaf-only treated plants in the ground used an average of 14.8% of the energy of leaf-only treated plants in bags, and soil-pressed treated plants in the ground used 24.2% of the energy of soil-pressed treated plants in bags. Leaf-only treated plants in bags used 62.3% of the energy of soil-pressed treated plants in bags, and leaf-only treated plants in the ground used 49.7% of the energy of soil-pressed treated plants in the ground (Figure 8).
To compare the discharge rate of different treatments, data were standardised by dividing measured discharge by the actual on-time (pulse length × pulse number) to determine the discharge rate as kilojoules per second (kJ s−1) which is equivalent to power in kilowatts (kW). The discharge rate of the shortest duration treatment (25 × 25 µs pulses) was much lower than the average rate for longer duration treatments (Table 3).
In Table 4, data are presented to show the mean discharge rate (kJ s−1) for all dose durations (labelled > 0 ms), the mean discharge rate for the shortest dose duration (0.625 ms) and the mean discharge rate for the average of all longer dose durations (labelled > 0.625 ms). With one bag-grown exception, all plants for which the energy discharge exceeded 0.5 J died (n = 108) and more than 90% of plants treated with more than 0.3 J died (Table 4).
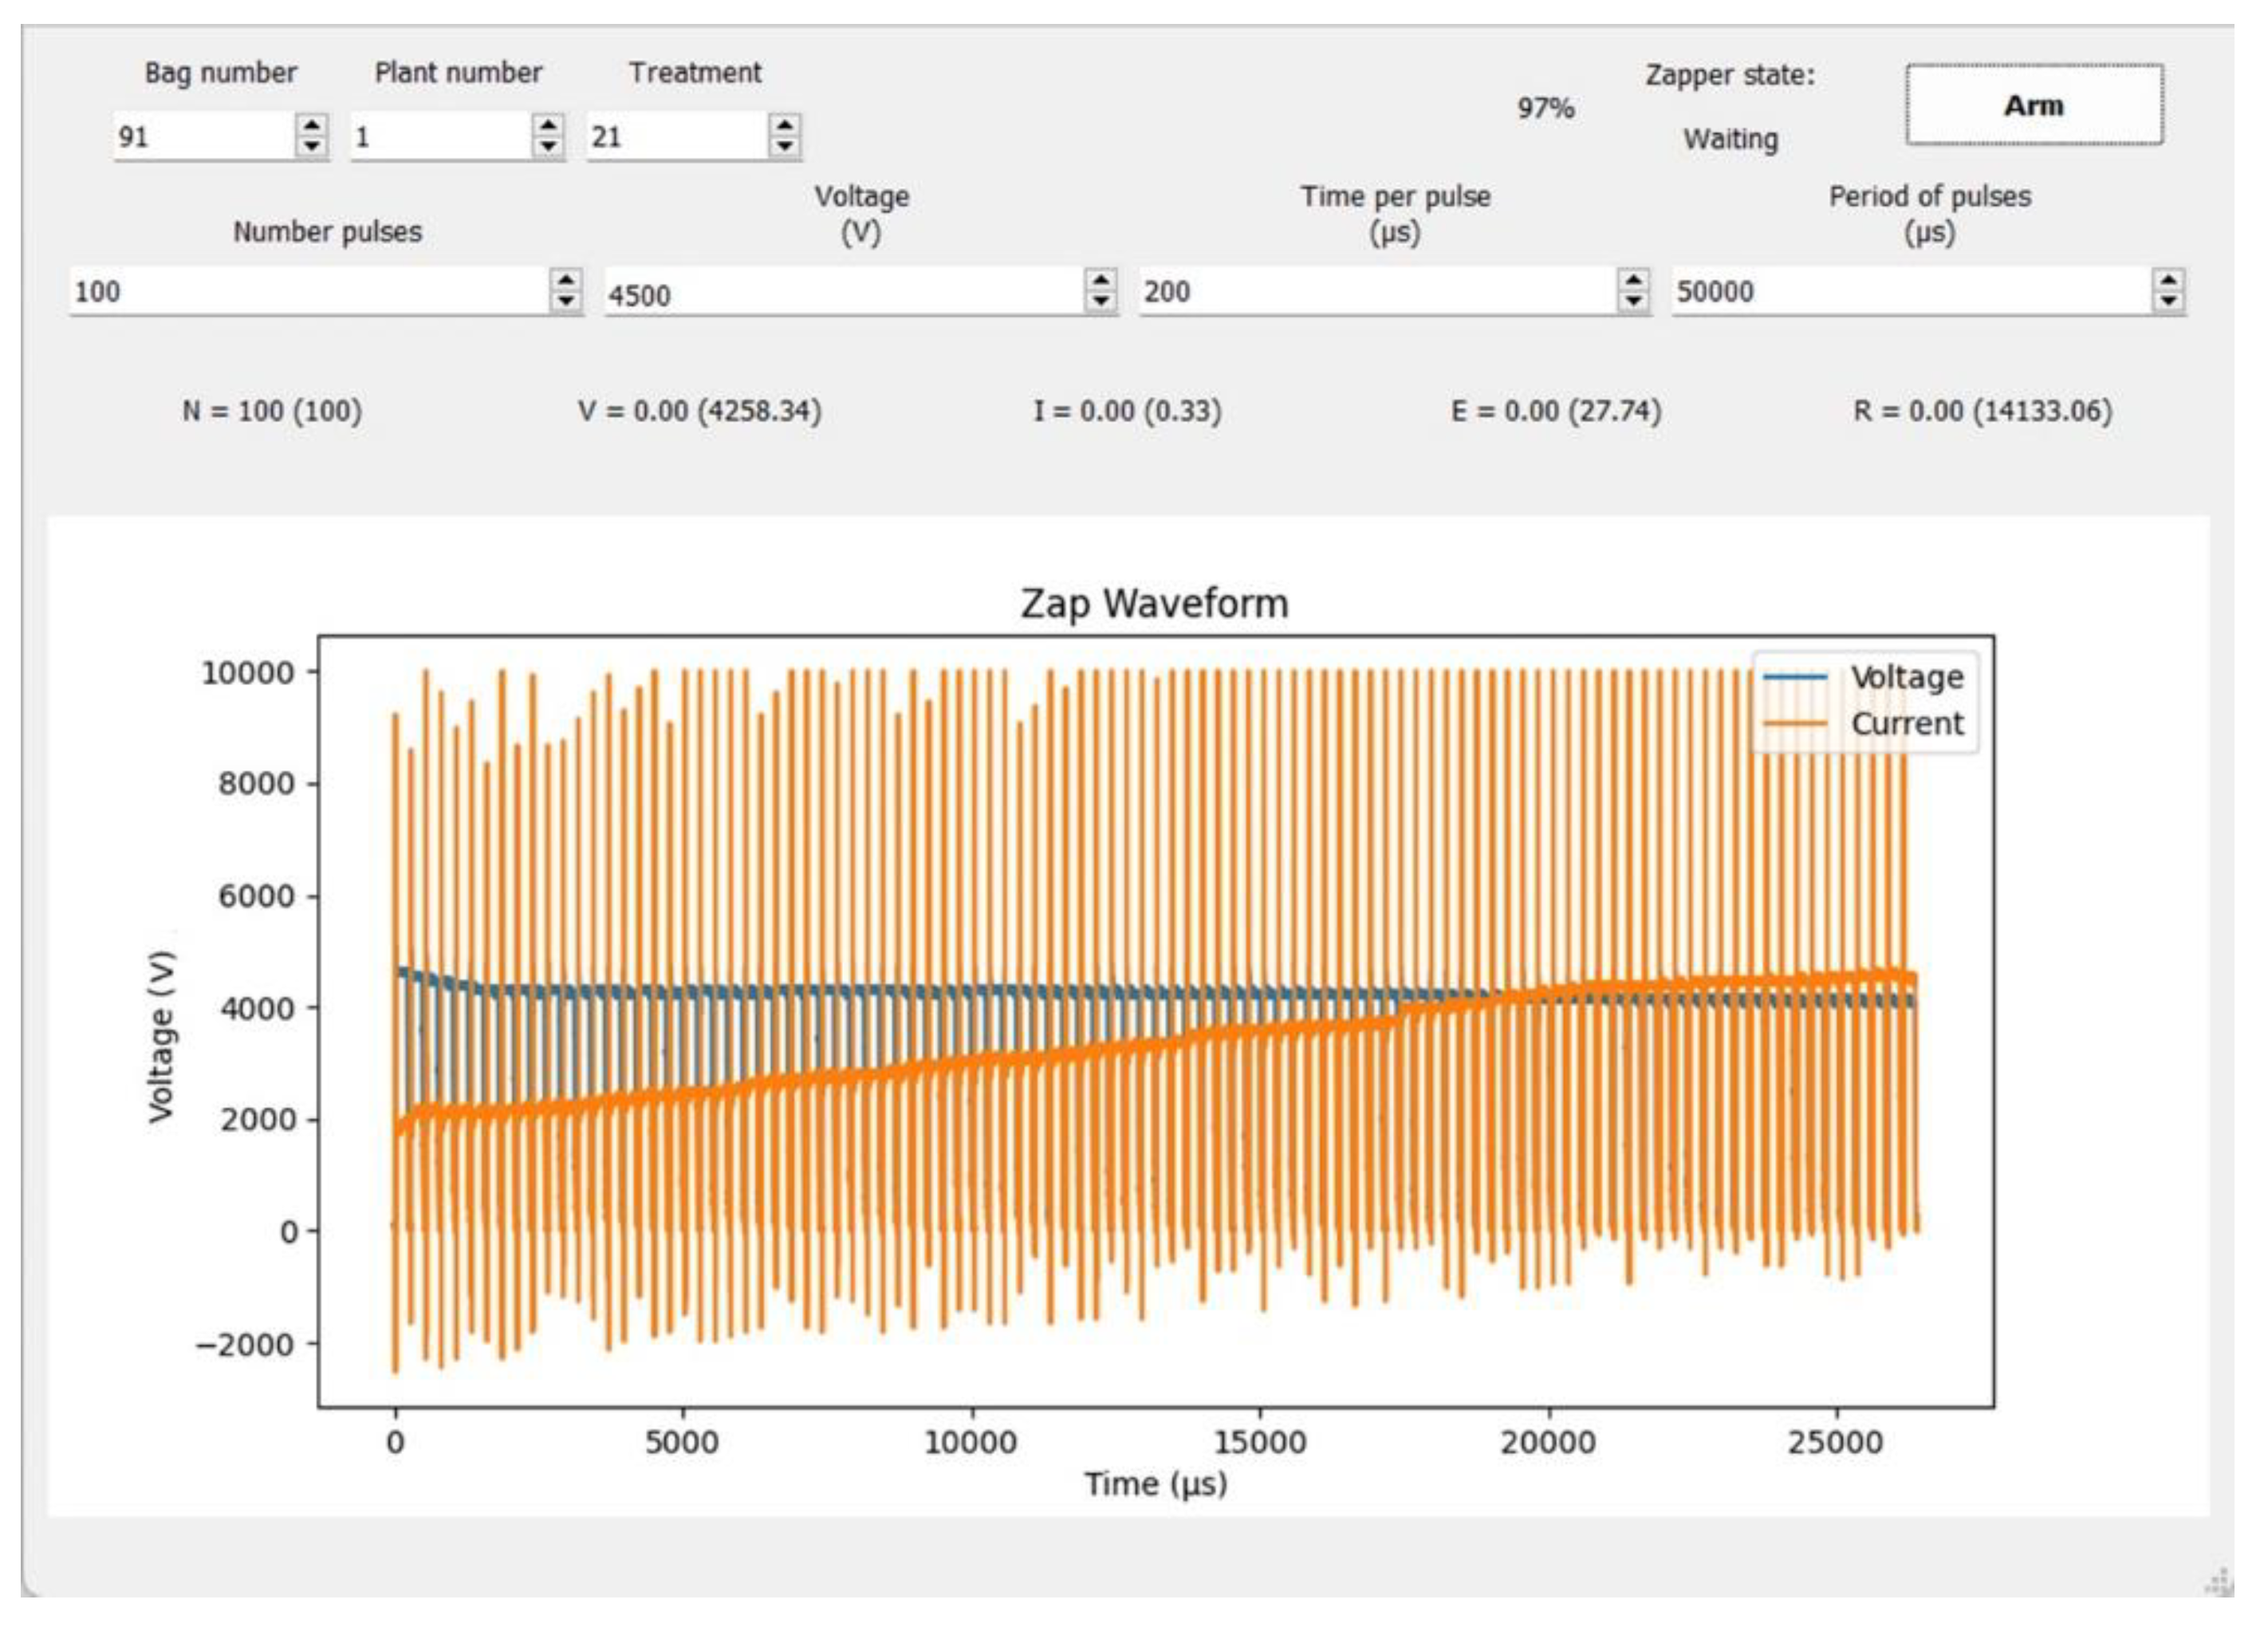
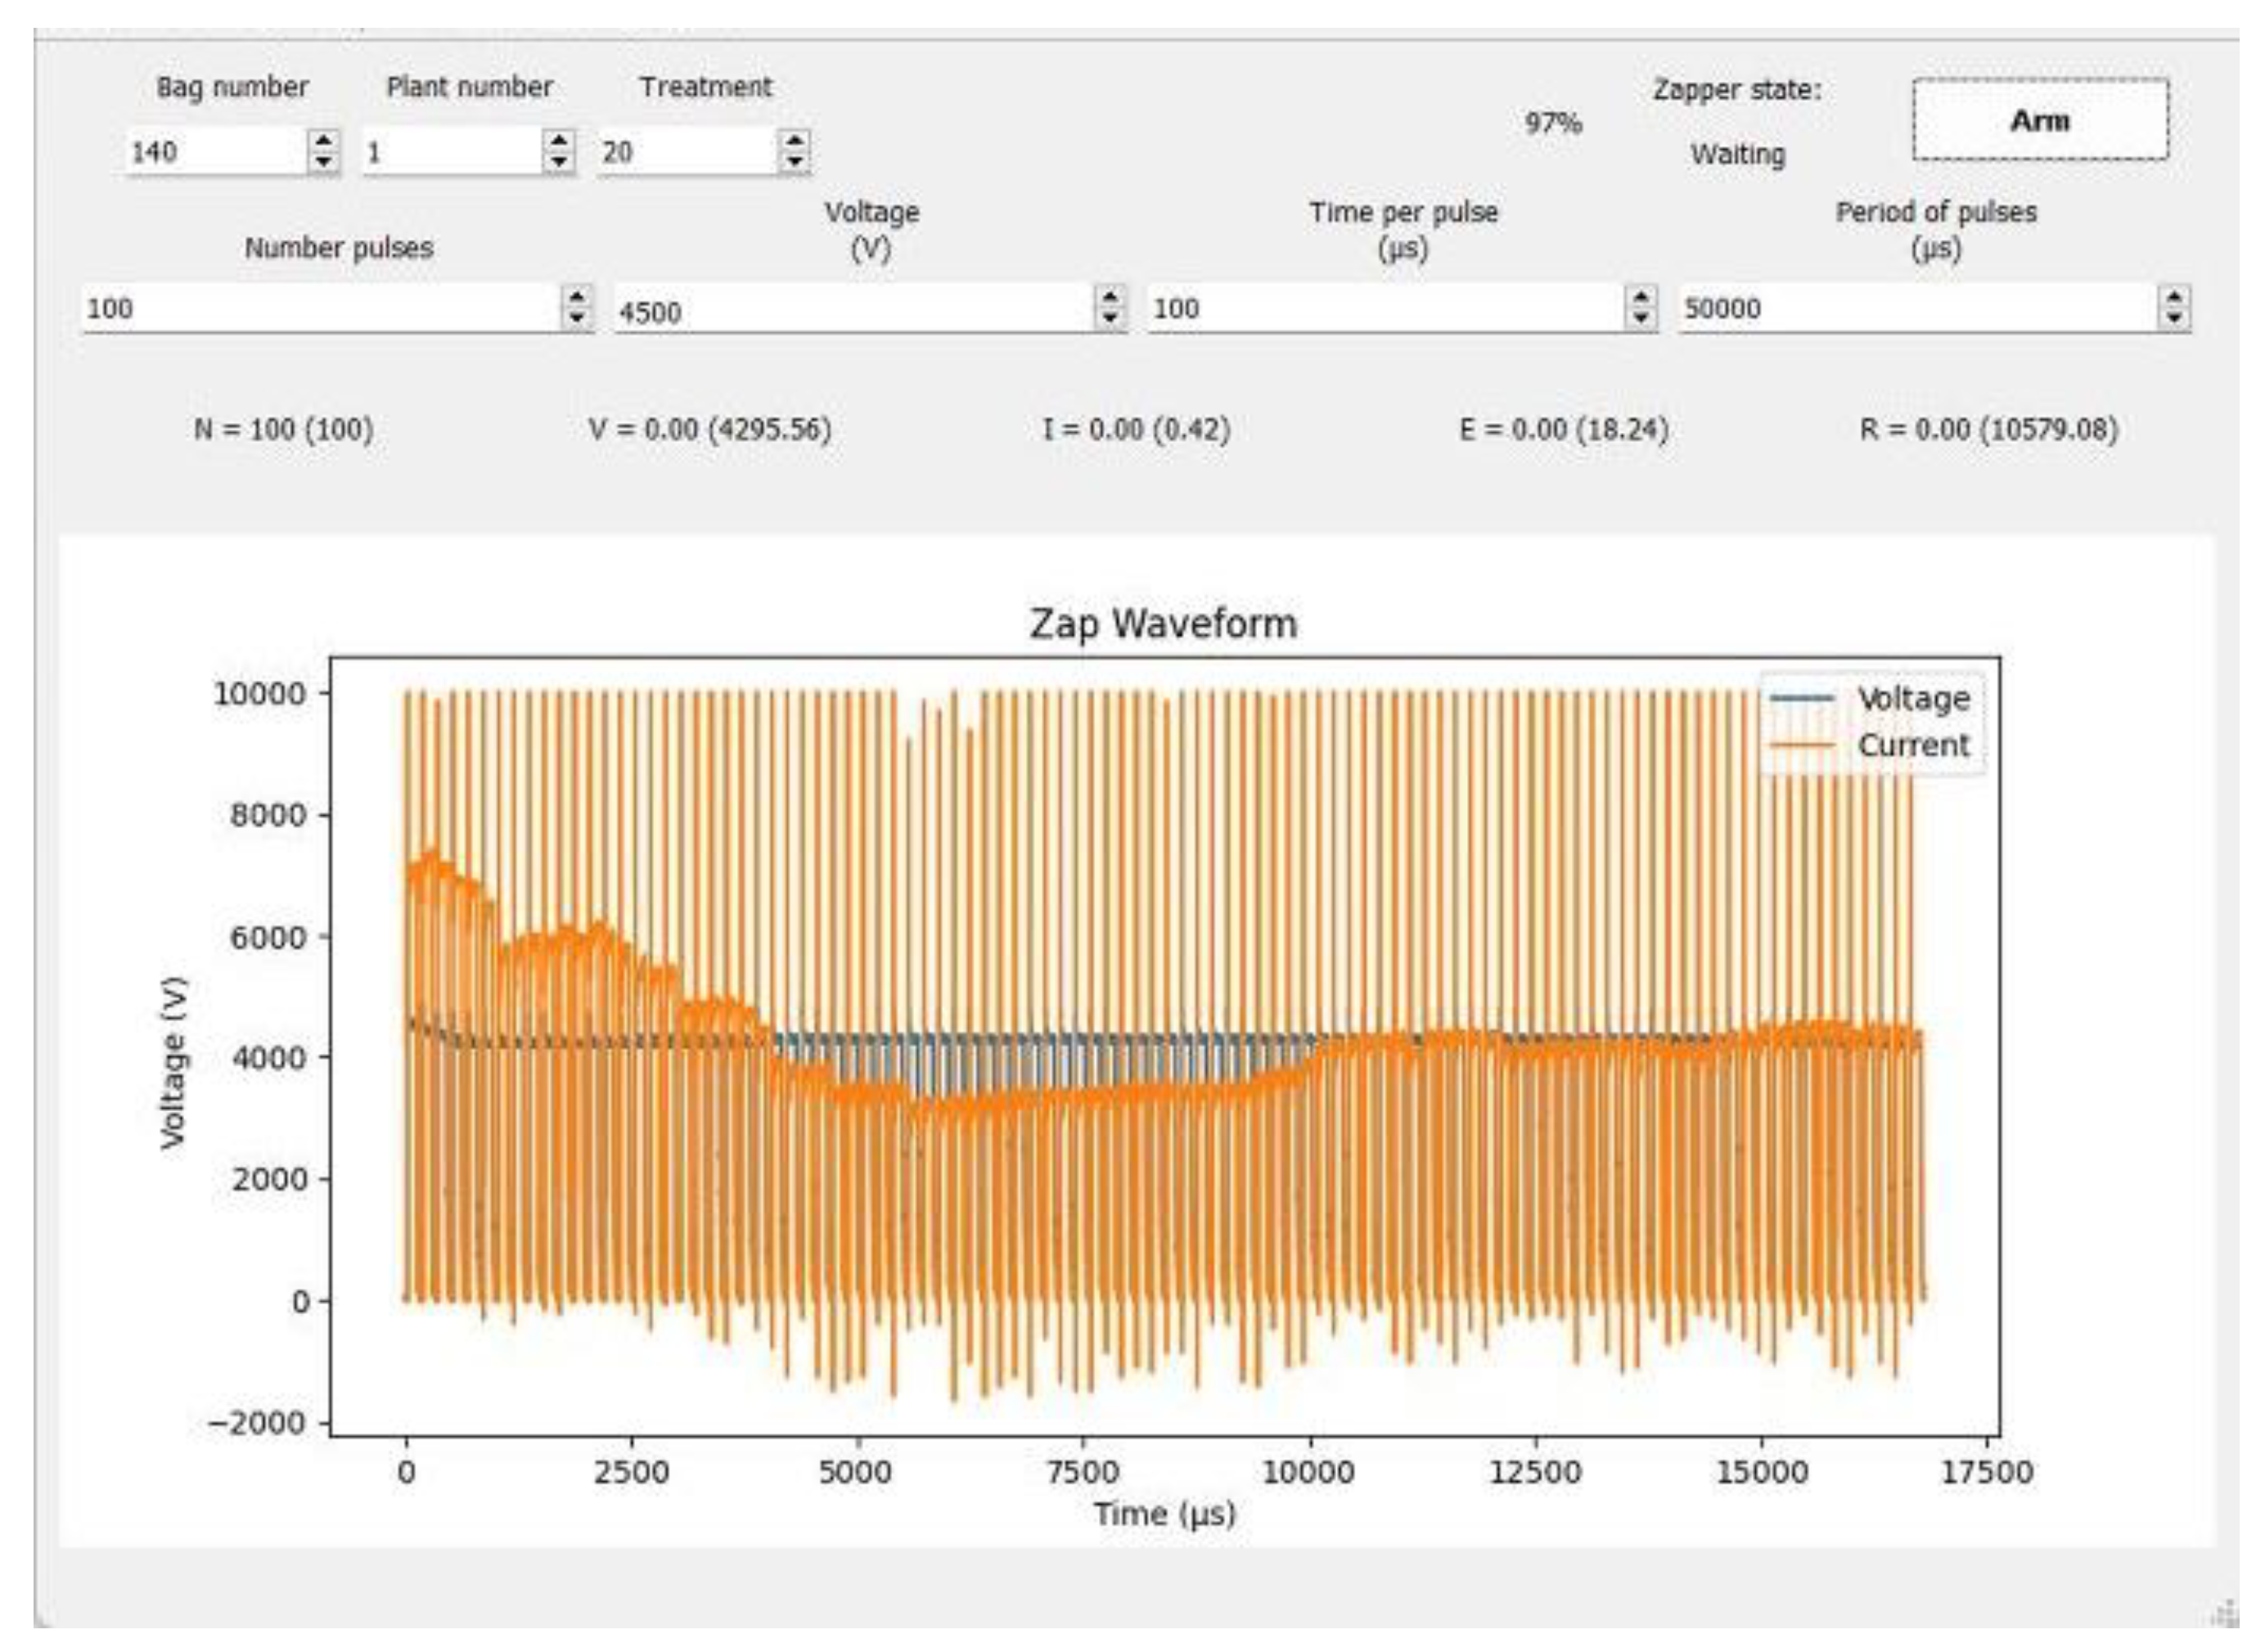
An example of pulse data captured by the WedaTech equipment during a single PMS application to A. powellii shows an initial drop in voltage and rise in current as the treatment begins, followed by a relatively stable voltage with the current continuing to increase during the treatment (Figure 9).
This pattern was typical of a higher-energy treatment when good electrode contact with the plant was maintained. We also noted that if good contact with the plant was not achieved, the current could reduce markedly. Figure 10 shows a case where initial arcing was indicated by sparking/crackling noises, and the flat-plate electrode was adjusted to better contact the leaves. While the voltage remained constant, the current initially dropped, but then climbed once good contact was achieved, following a similar trend to that observed with other applications made using similar doses.
Logistic regressions were performed to ascertain the effects of treatment on the likelihood that plants would be killed (Table 5). Included variables were electrode contact to leaves only or to leaves pressed to soil, soil moisture level, stem length and stem diameter at time of treatment, and average treatment voltage, current and discharged energy. The logistic regression model was statistically significant, χ2(7) = 124.1, p < 0.001. The model explained 77.3% (Nagelkerke R2) of the variance in the outcome and correctly classified 91.1% of the cases. Increasing average voltage (Exp(B) = 1.001, p = 0.005), average current (Exp(B) = 0.000, p = 0.026), and discharged energy (Exp(B) = 21.08, p = 0.005) were significant factors. Soil moisture (Exp(B) = 1.296 p = 0.069) and the other variables were not significant.

3.3. Trial 3 Lolium multiflorum

None of the untreated L. multiflorum control plants had died 14 DAT, but some plants had died in all the treatments and more than 90% of plants were dead in 16 of the 28 treatments. Some treated plants that were initially identified as dead resprouted from underground buds. The bag-grown plants had a higher mean survival rate than the in-ground plants, but this was not statistically different when analysed using Kruskal–Wallis all-pairwise comparisons (Figure 11).
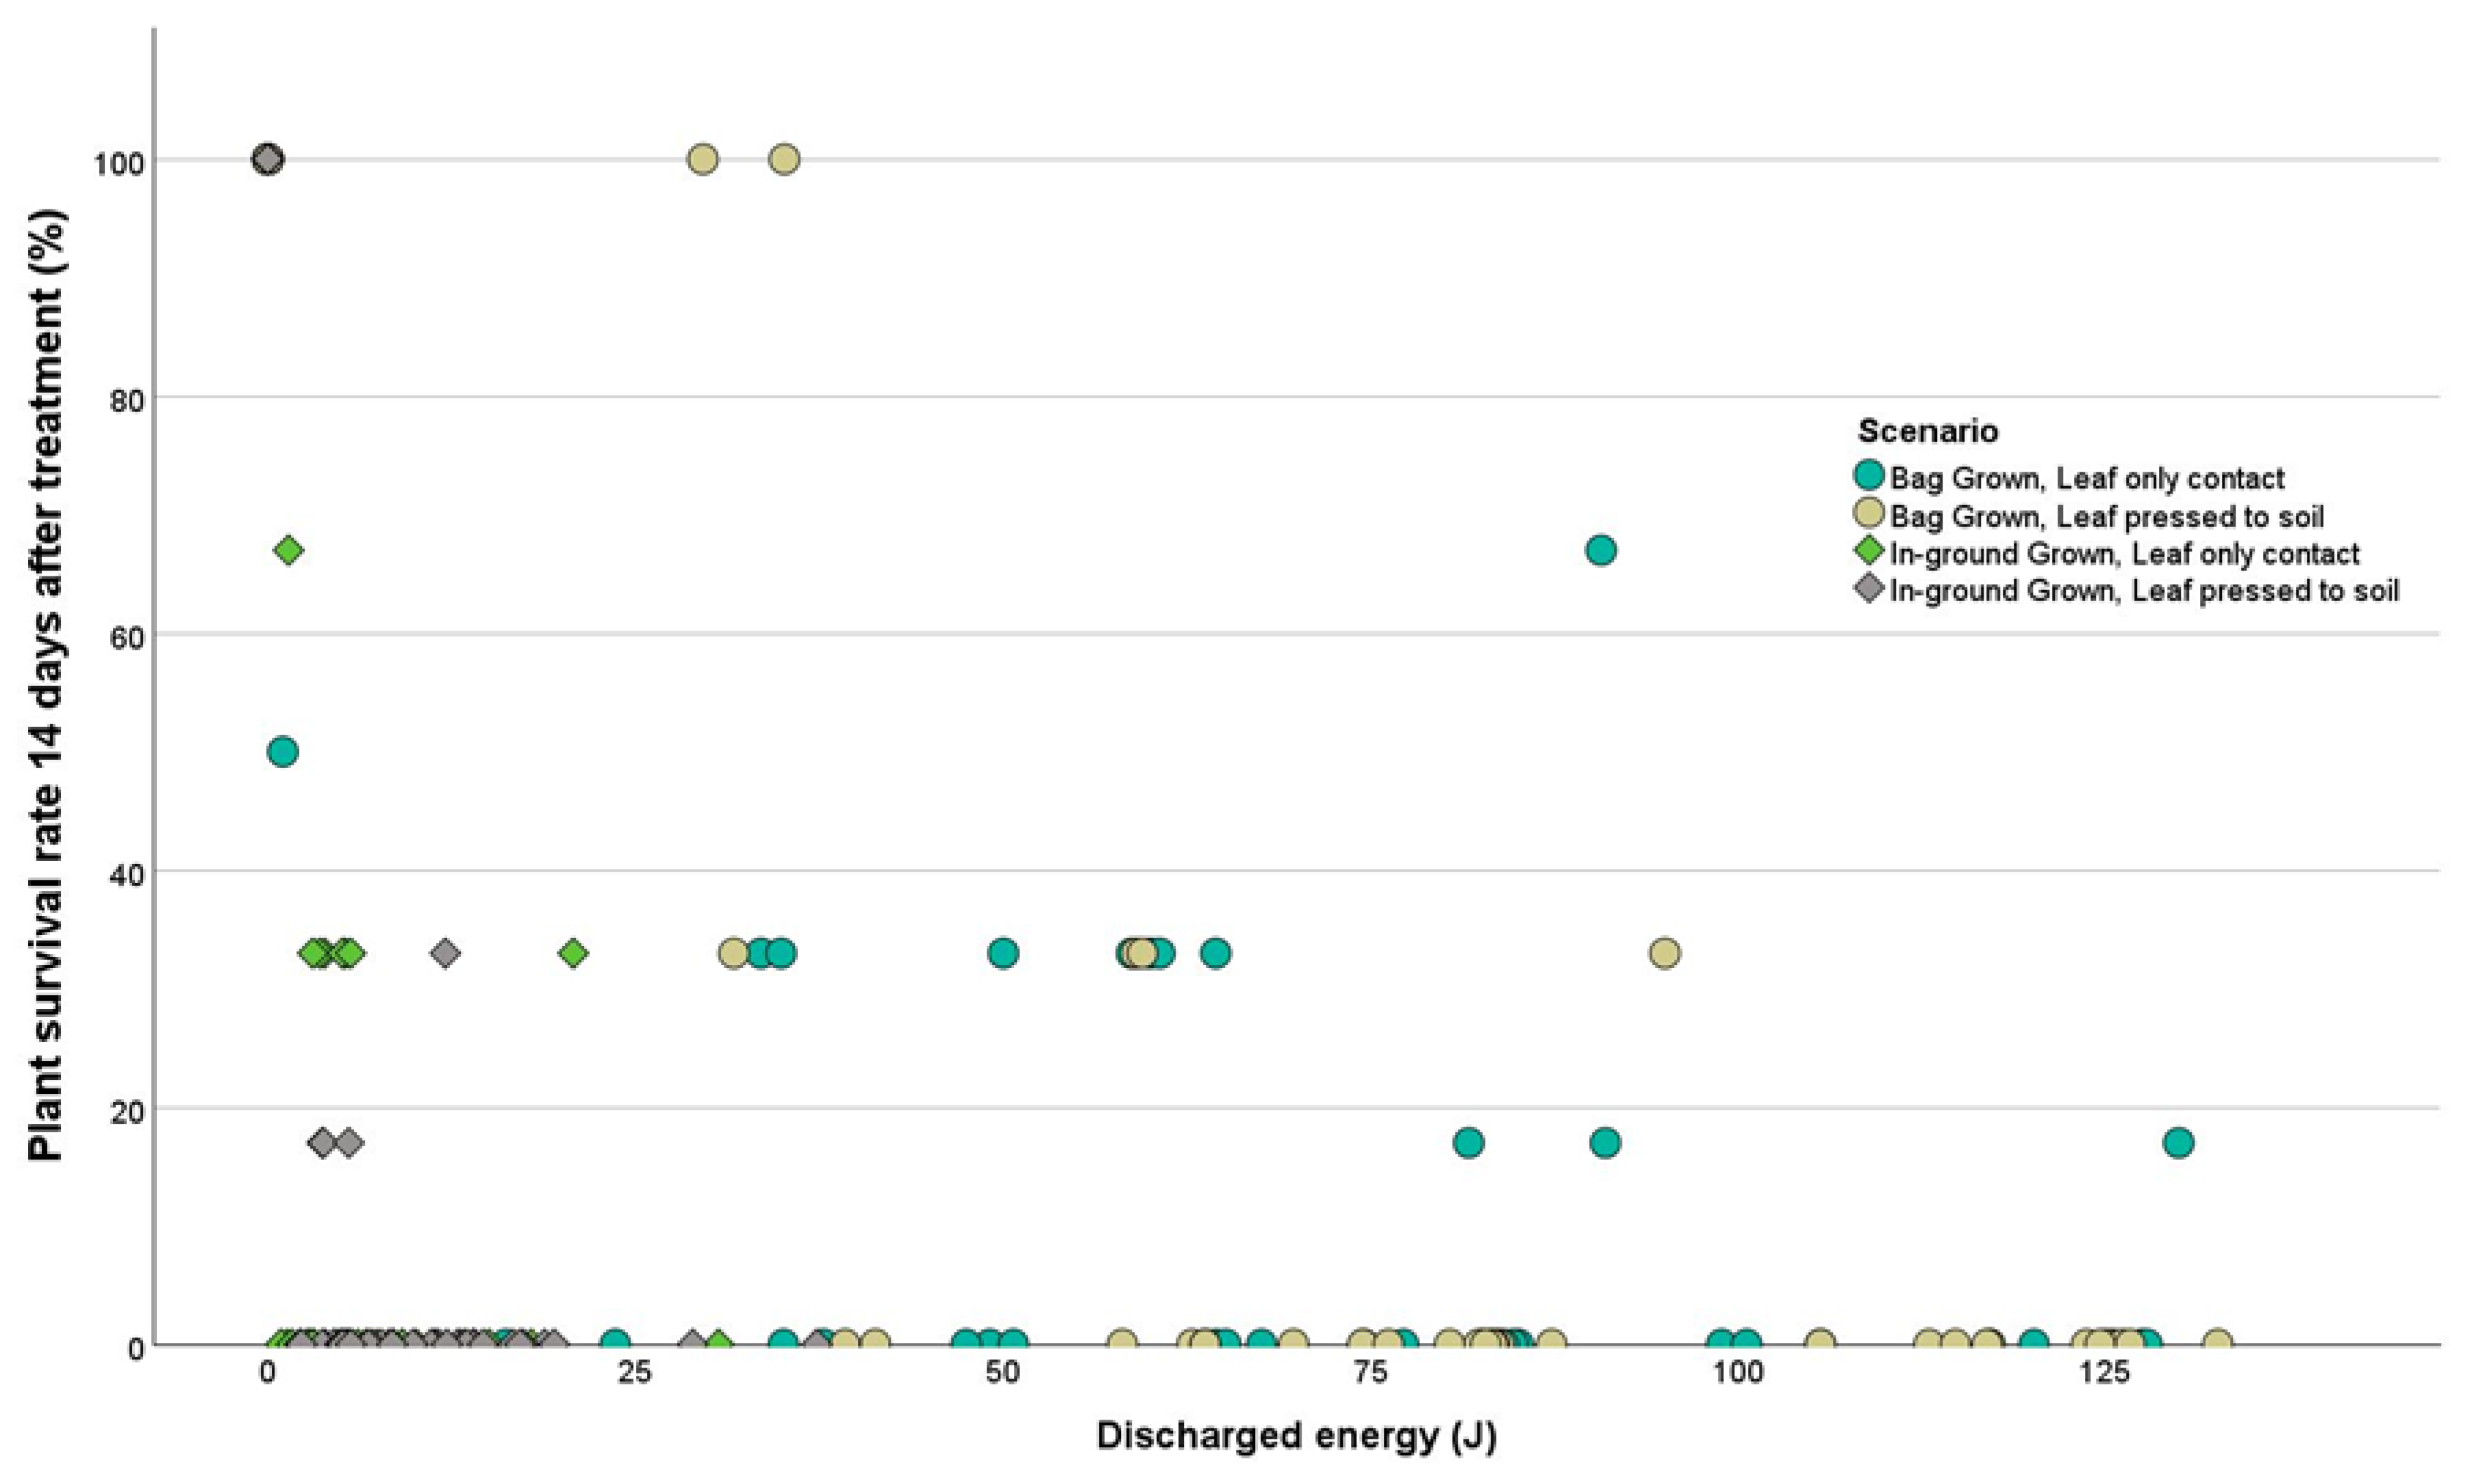
Comparing the survival rate of plants with the energy discharged showed that death rate tended to increase with increasing energy (Figure 12).
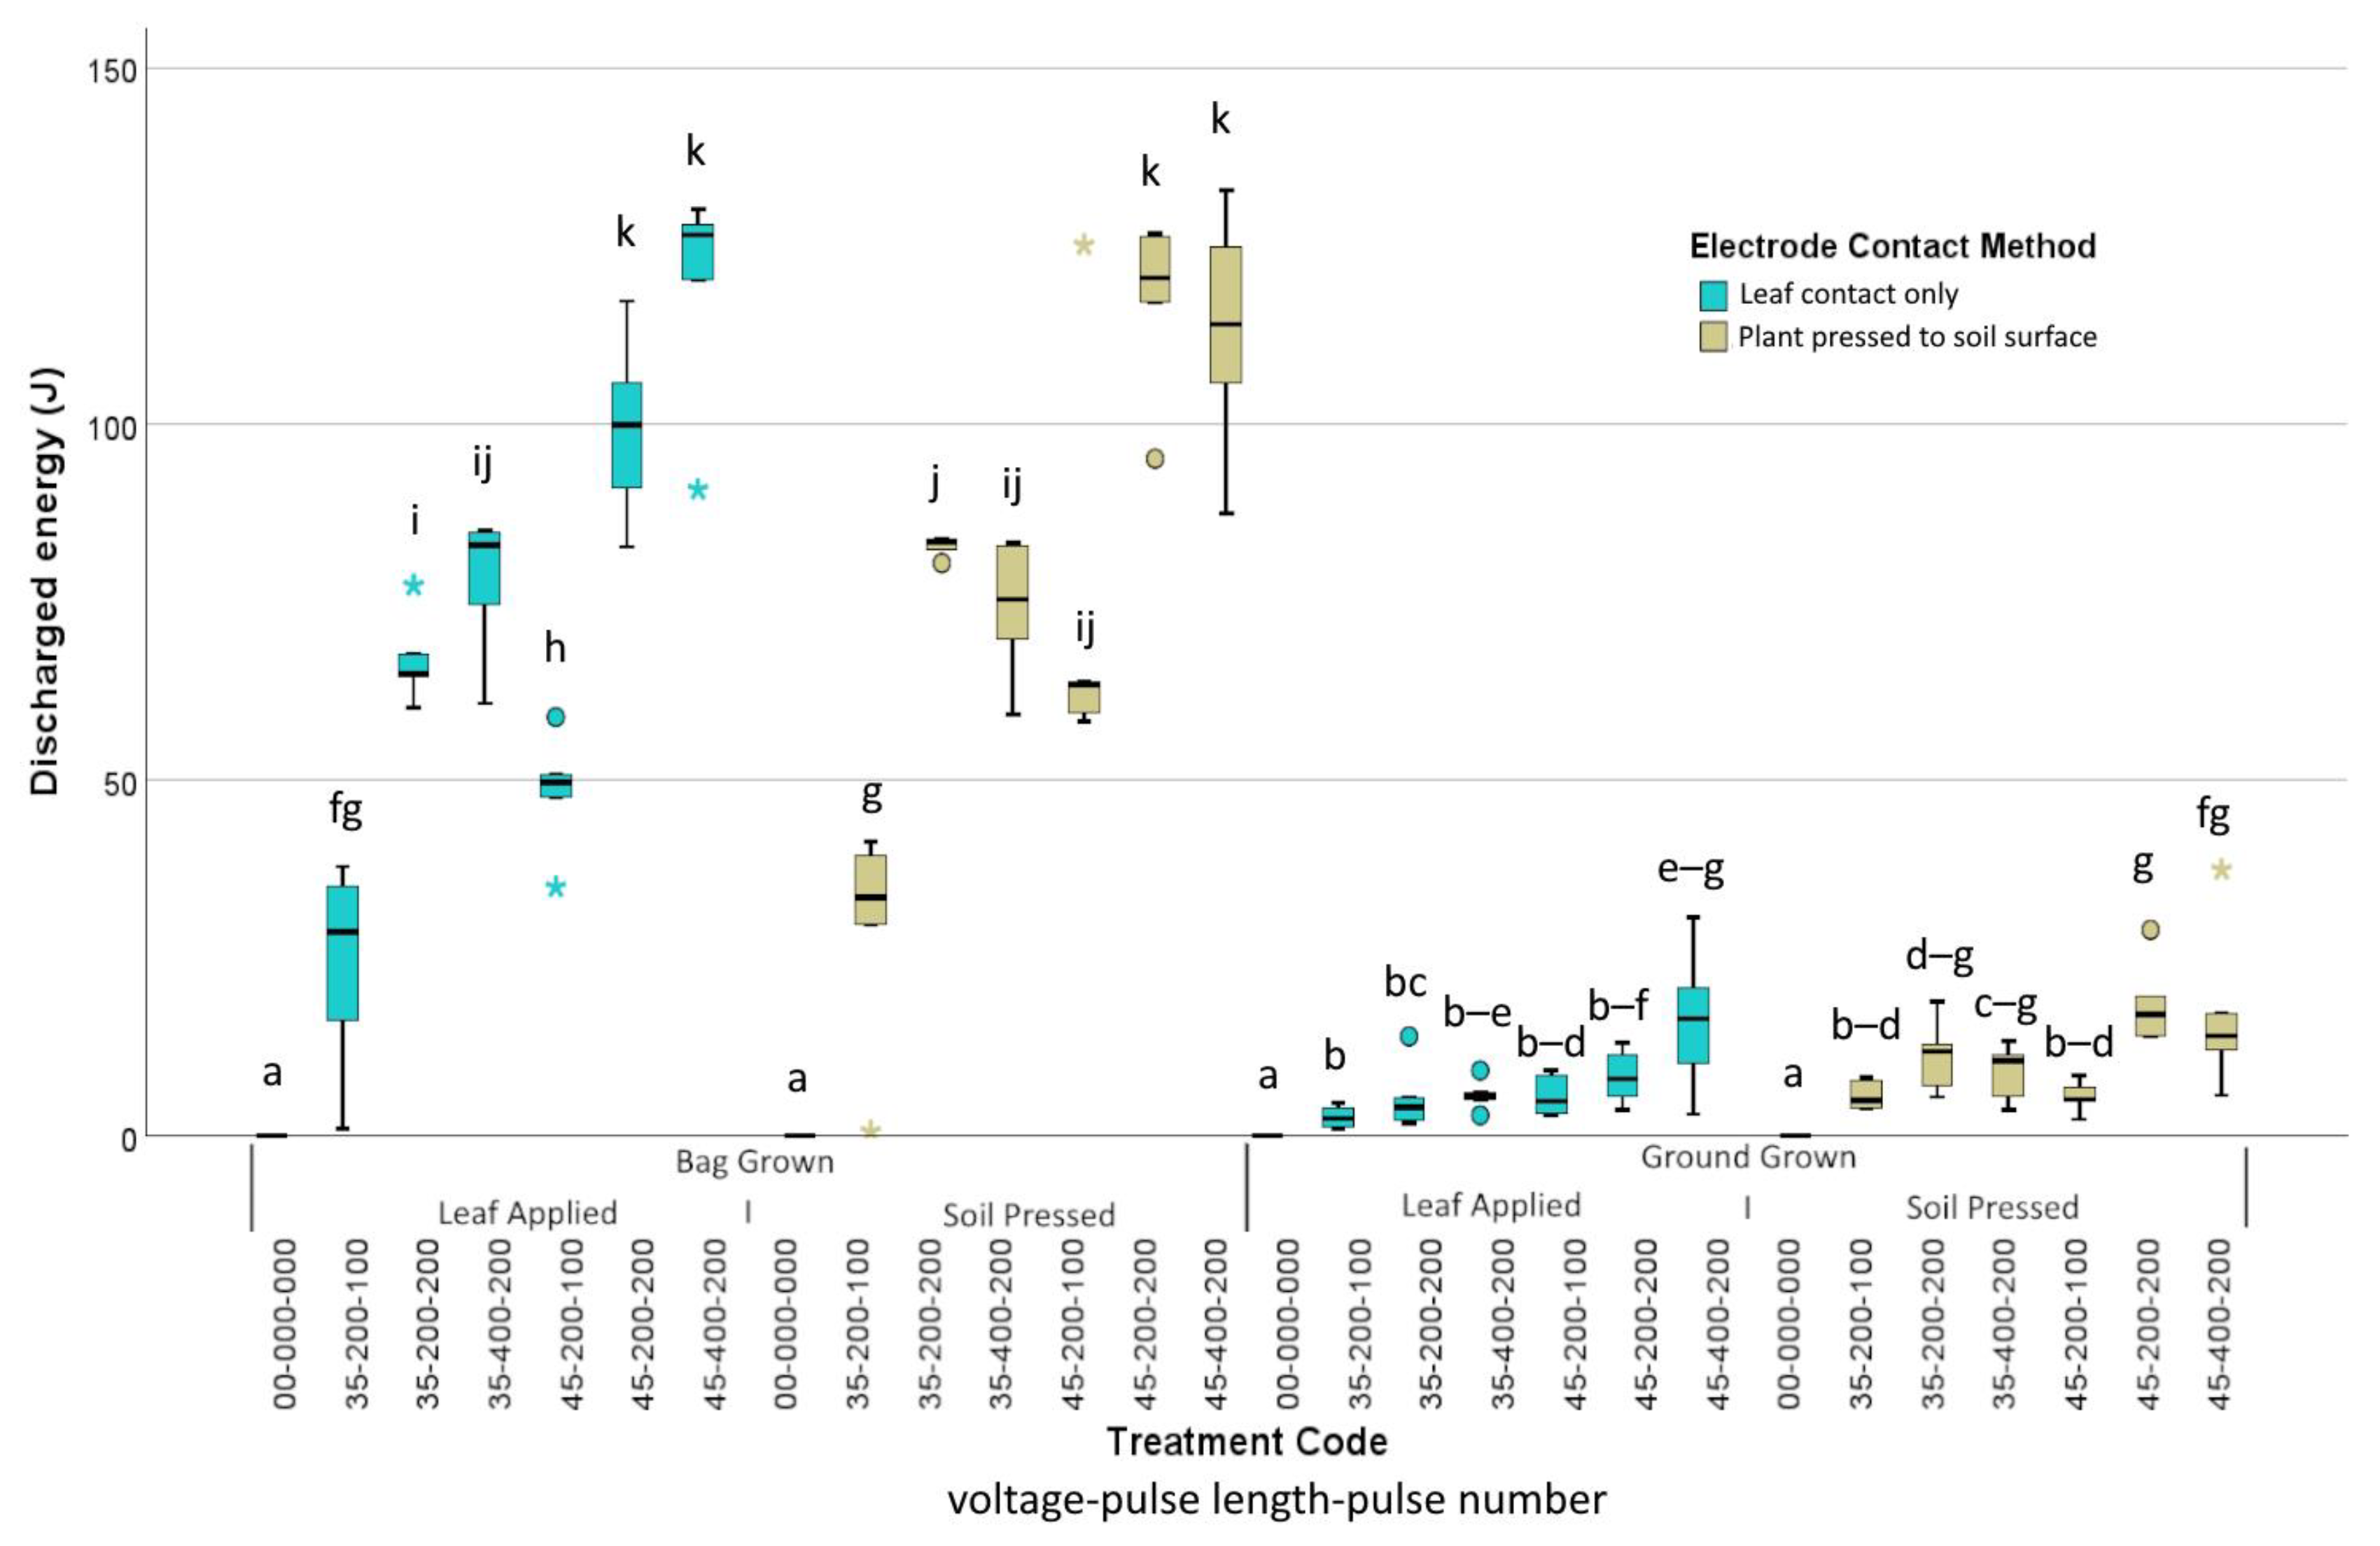
The discharged energy for each application was analysed and results for bagged or in-ground plants, electrode contact position and applied dose were compared (Figure 13). An extreme outlier in the B-S-35-200-100 treatment (bagged plants pressed to the soil applying 3.5 kV with 100 pulses each of 200 µs) was identified in post-treatment electrical data files as a failed application with very low energy applied, and mean energy for the treatment was substituted. A second relatively low energy application was retained, and those plants had a higher survival rate than others in the treatment. There were also low-energy outliers in other treatments, but they were retained as a relatively high amount of energy was discharged, even if not at the same rate as others in the same treatment. An extreme higher-energy discharge in treatment B-S-45 200-100 was noted as having arced to the ground, but data were retained in further analyses as at least the target dose was applied.
On an individual plant basis, 87.5% of bag-grown plants died at a mean energy discharge of 77.3 J. This equates to 3.86 MJ ha−1 assuming 5 escape weeds ha−1 (Table 6). The death rate and energy discharge were higher at 4.5 kV than at 3.5 kV. When only the in-ground plants are considered, the plant death rate was higher at 94% and the energy to kill plants was much lower with a mean energy discharge of 9.18 J application−1 or 0.051 MJ ha−1. The death rate and energy discharge were higher for 4.5 kV treatments than for 3.5 kV treatments, and for plants when the electrode pressed the leaves to the soil surface rather than to the leaves only.
A logistic regression was performed to ascertain the effects of treatment on the likelihood that plants would be killed (Table 7). Included variables were electrode contact to leaves only or to leaves pressed to soil, soil moisture level, leaf number and longest leaf length at time of treatment, and average treatment voltage, current and discharged energy. The logistic regression model was statistically significant, χ2(7) = 160.9, p < 0.001. The model explained 48.0% (Nagelkerke R2) of the variance in the outcome and correctly classified 91.9% of the cases. However, the Hosmer and Lemeshow test showed very poor model fit (p < 0.001). Applying the electrode to leaves pressed to the soil surface, (Exp(B) = 2.208, p = 0.023), fewer leaves (Exp(B) = 0.603, p = 0.038) and longer leaves (Exp(B) = 1.001, p = 0.034) at time of treatment, average voltage (Exp(B) = 1.001, p < 0.001) and discharged energy (Exp(B) = 1.027, p = 0.002) significantly increased likelihood of death. Higher percentage soil moisture (Exp(B) = 0.975, p = 0.361) and average current (Exp(B) = 0.064, p = 0.501) were not significant.

4. Discussion

Seeking a non-chemical herbicide method suitable for use in a regenerative agriculture cropping system, these trials compared the effects of low-energy electric shocks on two broadleaf weed species and a grass, treated both in bags and grown in the ground in a cropping field.
In the L. didymum trial, all treated plants and no untreated control plants died, although due to slow death rates it was almost 4 weeks from treatment before final determinations could be made. A discharge of 0.3 J or less appears sufficient to kill small L. didymum seedlings. Plants grown in bags and held indoors died faster than those growing outside in the ground. Even the lowest energy treatment (2.5 ms total discharge duration) applied to bagged plants had a greater energy discharge than any treatment applied to plants or bare soil in the ground (10 ms total discharge duration).
The doses applied to A. powellii were selected to span treatments expected to be ineffective through to those expected to be fully effective, but in this trial even the lower doses were very damaging to the weeds. Amaranthus powellii seedlings receiving a dose of 0.5 J plant−1 were killed, and more than 90% of plants were killed with a dose as low as 0.3 J plant−1. While two of our earlier reported trials [28,32] had only moderate success killing L. multiflorum plants grown in bags, this trial demonstrated a very high death rate, with over 94% of in-ground treated plants and 87.5% of in-bag plants dying. The plants in this trial were slightly larger than in two earlier trials [28] but slightly smaller than those in the two other reported trials [32] (Table 8). On an individual plant basis, when only the in-ground-grown plants are considered, the plant death rate was 94% and the energy to kill plants was much lower, with a mean energy discharge of 3.06 J plant−1.
For A. powellii seedlings, almost seven times more energy was discharged to bag-grown plants than to in-ground plants when treatments contacted the leaf canopy only. Four times more energy was discharged to bag-grown plants than to in-ground plants when treatments pressed the plants to the soil surface. In both the bag- and ground-grown plants, treatments that pressed plants to the soil surface experienced about twice the energy discharge of equivalent leaf-canopy-only doses. How much of the difference was due to better electrode-to-leaf contact and how much was due to direct energy loss from the flat-plate electrode to the soil could not be determined. In this trial, the 4500 V treatments on L. multiflorum were more effective than 3500 V treatments, although energy discharge was also much higher. Overall, pressing the grasses to the ground had a slightly higher kill rate than touching the plate electrode to the leaves only. When treating L. multiflorum seedlings, the energy discharged to bag-grown plants with significantly wetter soil was much greater than that discharged to in-ground plants at the same machine settings, with bagged plant treatments discharging ten times more energy for leaf-only treatments and seven times more for soil-pressed treatments, but this did not necessarily correlate with a higher death rate.
Ohm’s Law for the calculation of circuit resistance (R) from the measured voltage (V) and current (I) (arranged as Equation (1)) states that resistance in a circuit is a function of voltage and current.
R = V/I
The initial drop in voltage and rise in current during treatment of A. powellii, followed by a relatively stable voltage but the continued increase in current during treatment (Table 3 and Figure 9) show that resistance was decreasing during each treatment, initially quite quickly and then more slowly as the pulses continued to be applied. This supports hypotheses that the electric shocks are increasing the conductivity of plant tissues, perhaps by damaging the cell membranes and releasing more ionic fluids into the intercellular spaces [47,60,61,62]. Therefore, the lower energy discharge rate (J s−1) or power (watts, W) observed in the shorter duration treatments applied to A. powellii is indicative of higher initial vegetative resistance. Conversely, during the longer duration applications, more of the pulses would be treating damaged tissues with reduced resistance. This raises the possibility that monitoring resistance during PMS application may enable treatment to be stopped when sufficient damage has occurred to ensure subsequent plant death. Figure 10 presents an example in which current initially decreased, showing that initial resistance increased. When the contact of the treatment electrode with the canopy was improved part way through the application, the current increased, showing the resistance decreased because voltage remained constant. This demonstrates that good electrode connection with the plant is essential for the potential dose of energy to be applied.
The design of our application equipment means that, up to a system limited maximum discharge current, the energy discharge (Ep) is controlled by the voltage (V), the total discharge time (tc) and the resistance of the plant/soil machine circuit (Rv). Slaven et al. [63] relate these factors in the formula presented as Equation (2).
E p = V 2 t c R v
Other factors that can influence energy discharge include electrical properties of epidermal tissues, the cuticle and waxy layers, the initial hydration status of the plant and physical structure variation. Equation (2) does not explicitly identify soil resistance, which is a critical factor because it is a significant part of the electrical circuit for plants treated when growing in the ground. While good earthing electrode connection and good treatment electrode connection to the plant are essential for effective treatment, direct connection between the treatment electrode and the soil body creates inefficiency. When the flat plate presses the plants to the soil surface, there will be electrical conductance into the soil, both through the plant and from direct electrode-to-soil contact. The energy split will depend on the relative resistance of the two paths, and anything that increases resistance between the plate electrode and the soil will increase the energy available for discharge through the plant. The data presented in Figure 5 show that flat-plate discharges were 2.5 times greater for applications made to plants and soil than those made to the soil only, indicating much higher conductivity of plants relative to the soil surface.
The resistance of the soil is dependent on several factors, including soil physical properties such as clay content and density, variable factors including salinity, and in our trials, electrode surface contact area, electrode separation distance and soil moisture, which all affect soil electrical conductivity [64]. A larger electrode surface area or higher soil moisture will reduce resistance, whereas increasing electrode separation distance increases resistance. Diprose and Benson [52] state that high soil resistance can leave less capacity to shock the plants. Discussing broadacre application equipment, they recommended that earthing discs penetrate several centimetres into the ground and have a large cross-sectional area to ensure adequate electrical contact. Pre-trial testing of our equipment showed that pairing fully embedded 200 mm long, 5 mm diameter, aluminium electrodes in wet soil allowed the current between them to exceed the measuring capacity of our equipment, indicating that electrical resistance was extremely low. We believe the very low resistance was due to both the larger contact area and the much wetter soil below about 100 mm. Inserting the electrodes only 75 mm into the soil reduced the current and enabled our equipment to capture reliable measurements.
During the L. didymum trial in the field, we tested the effect of increasing the electrode separation gap, and of two earthing electrode types on energy discharge. Hydrosense II™ soil moisture measurements around the outdoor-grown plants identified a moisture gradient down the soil profile, with the surface layer air dry and the deeper layers very moist. Under this scenario, there was an apparent effect of electrode separation distance on the discharge rate, which can be assumed to be a function of soil resistance. A power function decay was observed (Figure 5), showing a rapid decrease in energy discharge up to about 30 cm electrode separation, beyond which the discharge decrease was minimal.
The average soil moisture content for the L. didymum trial was similar for bagged and in-ground plants, but the in-ground plants had a dry surface soil layer and the in-ground conditions were more variable than those within the bags, particularly with increasing soil depth. At equivalent machine settings, the higher energy discharge with the probe earthing electrode compared to the disc earthing electrode, and the higher energy discharge with plants present than without, suggested the dry soil surface acts as an electrical insulator.
Diprose, Hackam and Benson [45] suggested that much more energy would be required to achieve satisfactory kill rates of in-ground plants than bag-grown plants in a greenhouse and noted that “effects are variable depending on plant root type, age, size, and the relative moisture contents of the soil”. While more energy was discharged to bag-grown plants, we did not find that more energy was required to successfully control weeds growing in the ground relative to that required to kill bag-grown plants, all other things remaining equal. Our trials do indicate that plant size and development are important, especially for L. multiflorum seedlings once tillering has commenced, and the method of electrode earthing and treatment electrode placement on plants also impact treatment effectiveness. Binomial logistic regressions of data from the A. powellii and L. multiflorum trials sought to identify the role various factors had on the likelihood that seedlings would be killed. While soil moisture can have a large impact on the amount of energy discharged, it was not necessarily related to the probability that A. powellii or L. multiflorum seedlings will be killed. Increasing voltage and increasing the energy discharged were significant predictors of the likelihood of treatments killing seedlings of both species.
We set a goal of attaining the energy efficiencies achieved in our earlier greenhouse trials, with better than 90% control using energy of less than 1 MJ ha−1 plus transport at 5 weeds m−2, which is considered a reasonable density for escape weeds surviving after chemical or mechanical treatment. Better than 90% control was achieved for both L. didymum and A. powellii at 0.3 J plant−1, which equates to 15 kJ ha−1, and for in-ground L. multiflorum at 363 kJ ha−1 (leaf contact) and 555 kJ ha−1 (leaves pressed to soil), all well below our target of 1 MJ ha−1. These energy efficiencies are equivalent to or better than our previously published greenhouse trials [28,32].
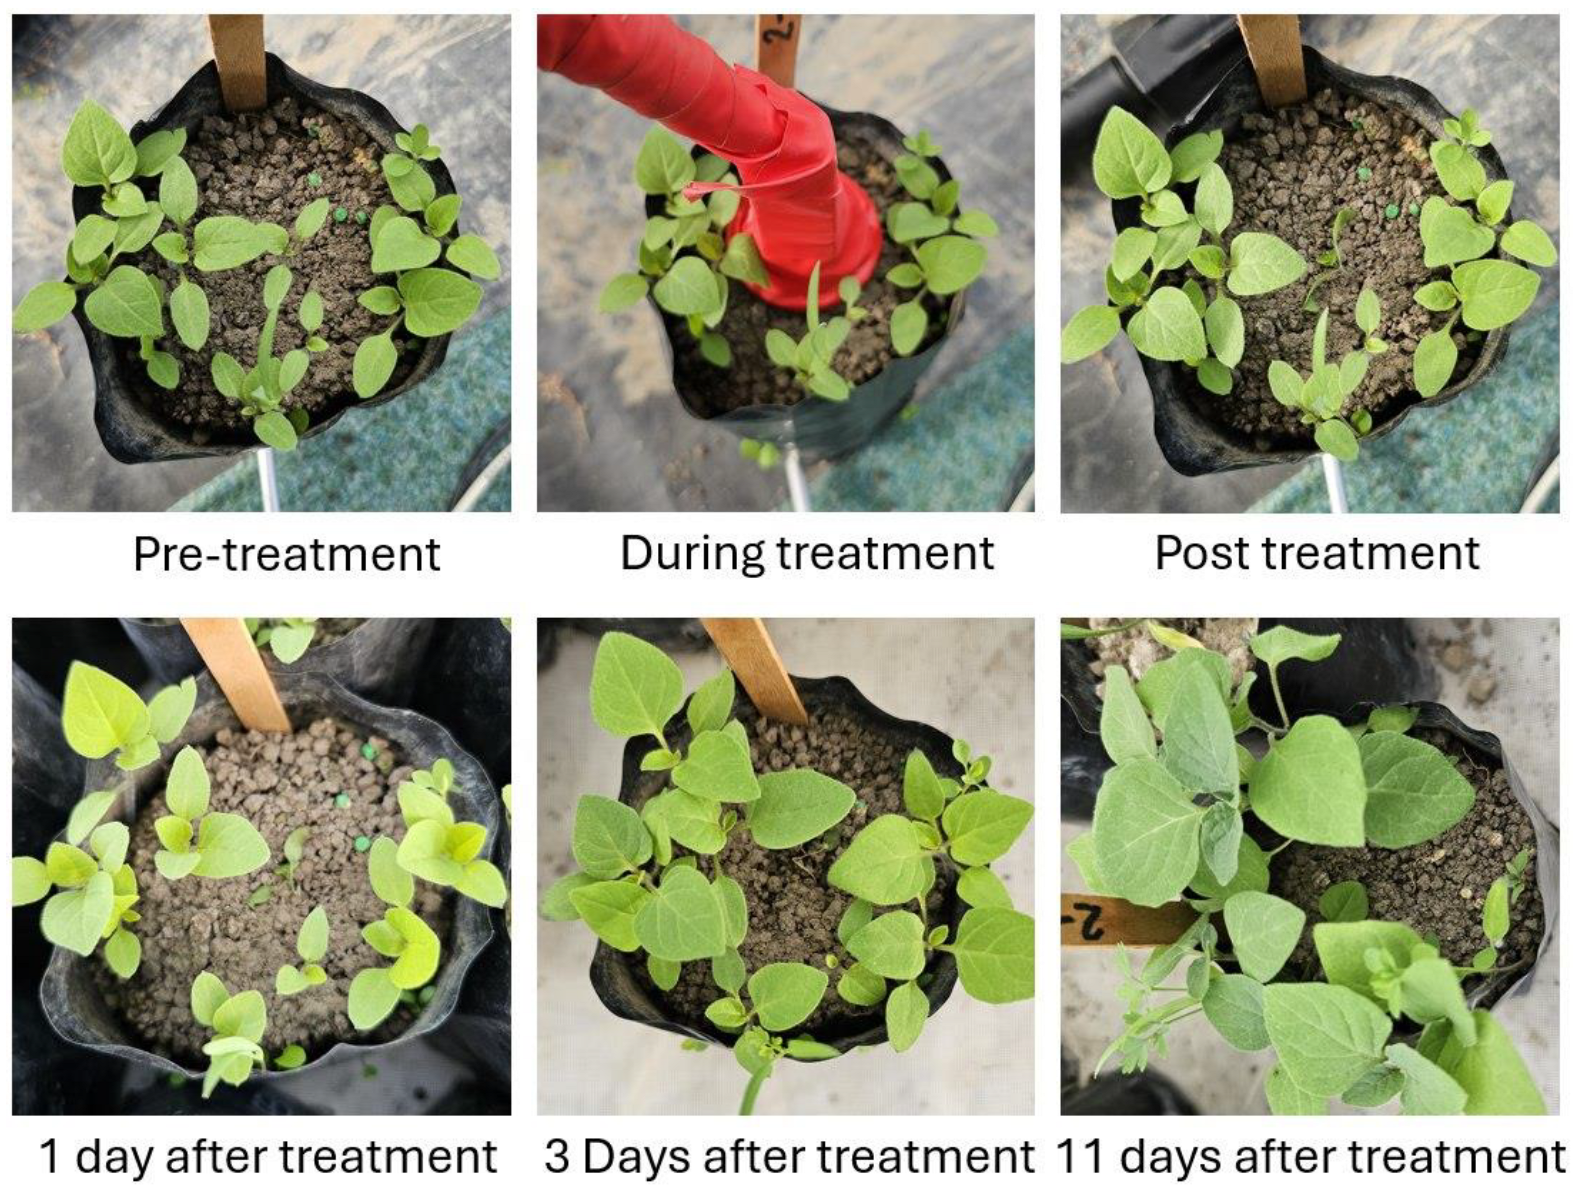
The equipment we have developed and tested is suited to treating individual weeds or small clumps of weeds up to about 15 cm tall. The use of a flat-plate electrode is proven to be effective and efficient in a field setting. The system would fit well with robotic “spot weeders” equipped with weed recognition, which are increasingly available [65,66,67,68,69,70]. The flat-plate electrode requires accurate placement, which could be achieved by robots such as BoniRob [71], or other systems using using the delta arm configuration [72,73] or other accurate systems [74]. In a small unreported trial we applied the circular disc treatment electrode to newly germinated seedlings growing very closely together. With thin insulation on the side of the disc, the plants immediately adjacent to those being treated were unaffected (Figure 14). Being an ultra-low-energy method, it would be ideal for low-powered robots including those using only solar power such as the early Ecorobotix machine [75,76]. The electric weeding system does require adequate earthing, which may reduce ease of use in a crop with a high amount of residue cover. A flat-plate system can press onto such residues, and if a metal disc cutting into the ground is blocked by debris, a second probe spearing through any residues into the soil underneath would provide the necessary earth connection.

5. Conclusions

Our objectives in this research were to determine whether an ultra-low-energy electric weeding system, suitable for integration into an autonomous weeder suitable for a regenerative agriculture cropping system, could apply a threshold “dose” of voltage and energy to plants growing in the ground outdoors (field treatment) that would achieve more than 90% mortality. We achieved our weed control and energy efficiency targets when treating seedlings growing in the ground outdoors and showed that the flat-plate system tested is suitable for field use as a manual or robotic weeding system in regeneratively farmed cropping fields.
We sought to compare energy expenditure with our earlier studies, and the relative responses for seedlings of two different broadleaf weed species and a grass. In contrast to the suggestions in the meagre literature available, our paired comparisons found that more energy does not appear necessary for effective treatment of in-ground plants than for plants grown and treated in bags. Given equivalent conditions, plants grown outdoors or in a greenhouse have similar responses. Increasing soil moisture increased total energy discharge but was not found to be a significant predictor of increased plant death. Increasing the distance between the earthing and application electrodes reduced energy discharge, most probably due to increased soil resistance, which may leave less energy available to impact the target weeds.

Author Contributions

Conceptualization, D.J.B., K.C.H. and T.K.J.; methodology, D.J.B. and K.C.H.; validation, H.G. and K.C.H.; formal analysis, D.J.B.; investigation, D.J.B.; resources, D.J.B.; data curation, D.J.B.; writing—original draft preparation, D.J.B.; writing—review and editing, K.C.H. and H.G.; visualization, D.J.B.; supervision, K.C.H., H.G. and T.K.J.; project administration, D.J.B.; funding acquisition, T.K.J. All authors have read and agreed to the published version of the manuscript.

Funding

This research was conducted as part of “Managing Herbicide Resistance”, a research programme by AgResearch, Ltd., a crown research institute in New Zealand, funded by the New Zealand Ministry for Business, Innovation and Employment Endeavour Fund C10X and C10X1806. The work contributes to material for submission as part of a PhD undertaken at Massey University.

Institutional Review Board Statement

Not applicable.

Data Availability Statement

Data are available on request from Daniel Bloomer.

Acknowledgments

The authors acknowledge the work of Hamish Penny in developing and making available the equipment used to apply pulsed microshocks and record the electrical data and energies delivered.

Conflicts of Interest

Author Trevor K. James was employed by AgResearch Limited, an independent research organisation owned by the New Zealand Government. The remaining authors completed this research under sub-contract to AgResearch Limited.

References

  1. O’Donoghue, T.; Minasny, B.; McBratney, A. Regenerative Agriculture and Its Potential to Improve Farmscape Function. Sustainability 2022, 14, 5815. [Google Scholar] [CrossRef]
  2. Rempelos, L.; Kabourakis, E.; Leifert, C. Innovative Organic and Regenerative Agricultural Production. Agronomy 2023, 13, 1344. [Google Scholar] [CrossRef]
  3. Grelet, G.; Lang, S. Regenerative agriculture in Aotearoa New Zealand: Research Pathways to Build Science-Based Evidence and National Narratives; Manaaki Whenua-Landcare Research: Lincoln, NZ, USA, 2021; p. 59. [Google Scholar]
  4. Burns, E.A. Thinking sociologically about regenerative agriculture. N. Z. Sociol. 2020, 35, 189–213. [Google Scholar]
  5. LaCanne, C.E.; Lundgren, J.G. Regenerative agriculture: Merging farming and natural resource conservation profitably. PeerJ 2018, 6, e4428. [Google Scholar] [CrossRef] [PubMed]
  6. Hageman, K.J.; Aebig, C.H.F.; Luong, K.H.; Kaserzon, S.L.; Wong, C.S.; Reeks, T.; Greenwood, M.; Macaulay, S.; Matthaei, C.D. Current-use pesticides in New Zealand streams: Comparing results from grab samples and three types of passive samplers. Environ. Pollut. 2019, 254, 112973. [Google Scholar] [CrossRef]
  7. Jayasinghe, S.L.; Thomas, D.T.; Anderson, J.P.; Chen, C.; Macdonald, B.C.T. Global Application of Regenerative Agriculture: A Review of Definitions and Assessment Approaches. Sustainability 2023, 15, 15941. [Google Scholar] [CrossRef]
  8. Zimdahl, R.L. Weed science in sustainable agriculture. Am. J. Altern. Agric. 1995, 10, 138–142. [Google Scholar] [CrossRef]
  9. Fenster, T.; LaCanne, C.; Pecenka, J.; Schmid, R.; Bredeson, M.; Busenitz, K.; Michels, A.; Welch, K.; Lundgren, J. Defining and validating regenerative farm systems using a composite of ranked agricultural practices [version 1; peer review: 2 approved]. F1000Research 2021, 10, 115. [Google Scholar] [CrossRef] [PubMed]
  10. Elrick, W.; Luke, H.; Stimpson, K. Exploring opportunities and constraints of a certification scheme for regenerative agricultural practice. Agroecol. Sustain. Food Syst. 2022, 46, 1527–1549. [Google Scholar] [CrossRef]
  11. McCain Foods. McCain’s Regenerative Agriculture Framework. 2023. Available online: https://www.mccain.com/media/4594/mccain_regenag_framework_2024.pdf (accessed on 6 May 2024).
  12. Cornell University College of Agriculture and Life Sciences. Environmental Impact Quotient (EIQ) Explained. Available online: https://turf.cals.cornell.edu/pests-and-weeds/environmental-impact-quotient-eiq-explained/ (accessed on 5 March 2024).
  13. Bloomer, D.J.; Harrington, K.C.; Ghanizadeh, H.; James, T.K. Robots and shocks: Emerging non-herbicide weed control options for vegetable and arable cropping. N. Z. J. Agric. Res. 2024, 67, 81–103. [Google Scholar] [CrossRef]
  14. Crinnion, W.J. Organic foods contain higher levels of certain nutrients, lower levels of pesticides, and may provide health benefits for the consumer. Environ. Med. 2010, 15, 9. [Google Scholar] [PubMed]
  15. Forbes, S.L.; Cohen, D.A.; Cullen, R.; Wratten, S.D.; Fountain, J. Consumer attitudes regarding environmentally sustainable wine: An exploratory study of the New Zealand marketplace. J. Clean. Prod. 2009, 17, 1195–1199. [Google Scholar] [CrossRef]
  16. Galati, A.; Schifani, G.; Crescimanno, M.; Migliore, G. “Natural wine” consumers and interest in label information: An analysis of willingness to pay in a new Italian wine market segment. J. Clean. Prod. 2019, 227, 405–413. [Google Scholar] [CrossRef]
  17. Hoek, A.C.; Pearson, D.; James, S.W.; Lawrence, M.A.; Friel, S. Shrinking the food-print: A qualitative study into consumer perceptions, experiences and attitudes towards healthy and environmentally friendly food behaviours. Appetite 2017, 108, 117–131. [Google Scholar] [CrossRef]
  18. Koch, S.; Epp, A.; Lohmann, M.; Bol, G.F. Pesticide residues in food: Attitudes, beliefs, and misconceptions among conventional and organic consumers. J. Food Prot. 2017, 80, 2083–2089. [Google Scholar] [CrossRef]
  19. Bajwa, A.A.; Mahajan, G.; Chauhan, B.S. Nonconventional weed management strategies for modern agriculture. Weed Sci. 2015, 63, 723–747. [Google Scholar] [CrossRef]
  20. Jun, I.; Feng, Z.; Avanasi, R.; Brain, R.A.; Prosperi, M.; Bian, J. Evaluating the perceptions of pesticide use, safety, and regulation and identifying common pesticide-related topics on Twitter. Integr. Environ. Assess. Manag. 2023, 19, 1581–1599. [Google Scholar] [CrossRef]
  21. Ministry for Primary Industries. Regenerating Aotearoa: Investigating the Impacts of Regenerative Farming Practices; Ministry for Primary Industries: Wellington, New Zealand, 2022; ISBN 978-1-99-105209-4.
  22. Buddenhagen, C.E.; James, T.K.; Ngow, Z.; Hackell, D.L.; Rolston, M.P.; Chynoweth, R.J.; Gunnarsson, M.; Li, F.; Harrington, K.C.; Ghanizadeh, H. Resistance to post-emergent herbicides is becoming common for grass weeds on New Zealand wheat and barley farms. PLoS ONE 2021, 16, e0258685. [Google Scholar] [CrossRef]
  23. Doole, G.J.; James, T.K. Profitable management of a finite herbicide resource. Crop Prot. 2023, 172, 106314. [Google Scholar] [CrossRef]
  24. Espig, M.; Henwood, R.J.T. The social foundations for re-solving herbicide resistance in Canterbury, New Zealand. PLoS ONE 2023, 18, e0286515. [Google Scholar] [CrossRef]
  25. Heap, I. The International Herbicide-Resistant Weed Database. Online 2020. Available online: www.weedscience.com (accessed on 14 April 2024).
  26. Ngow, Z. Herbicide Resistant Weeds in Maize in New Zealand: A Survey for Herbicide Resistant Weeds in the Bay of Plenty and Waikato; Waikato: Hamilton, NZ, USA, 2022. [Google Scholar]
  27. Alluvione, F.; Moretti, B.; Sacco, D.; Grignani, C. EUE (energy use efficiency) of cropping systems for a sustainable agriculture. Energy 2011, 36, 4468–4481. [Google Scholar] [CrossRef]
  28. Bloomer, D.J.; Harrington, K.C.; Ghanizadeh, H.; James, T.K. Micro electric shocks control broadleaved and grass weeds. Agronomy 2022, 12, 2039. [Google Scholar] [CrossRef]
  29. Coleman, G.Y.; Stead, A.; Rigter, M.; Xu, Z.; Johnson, D.W.; Brooker, G.; Sukkarieh, S.; Walsh, M.J. Using energy requirements to compare the suitability of alternative methods for broadcast and site-specific weed control. Weed Technol. 2019, 33, 633. [Google Scholar] [CrossRef]
  30. Kaufman, K.R.; Schaffner, L.W. Energy and economics of electrical weed control. Trans. ASAE 1982, 25, 297–0300. [Google Scholar] [CrossRef]
  31. Vigneault, C.; Benoit, D.L.; McLaughlin, N.B. Energy aspects of weed electrocution. Rev. Weed Sci. 1990, 5, 15–26. [Google Scholar]
  32. Bloomer, D.J.; Harrington, K.C.; Ghanizadeh, H.; James, T.K. The electric spatula: Killing weeds with pulsed microshocks from a flat-plate electrode. Agronomy 2023, 13, 2694. [Google Scholar] [CrossRef]
  33. Andreasen, C.; Saberi, M.; Rakhmatulin, I. Weed control with laser beams using autonomous vehicles: Pros and cons. In Proceedings of the FIRA 2021, Online, 7–9 December 2021; ACM: New York, NY, USA, 2021. [Google Scholar]
  34. Coleman, G.Y.; Betters, C.; Squires, C.; Leon-Saval, S.; Walsh, M.J. Low energy laser treatments control annual ryegrass (Lolium rigidum). Front. Agron. 2021, 2, 601542. [Google Scholar] [CrossRef]
  35. De Cauwer, B.; Bogaert, S.; Claerhout, S.; Bulcke, R.; Reheul, D.; Kim, D.-S. Efficacy and reduced fuel use for hot water weed control on pavements. Weed Res. 2015, 55, 195–205. [Google Scholar] [CrossRef]
  36. Denmukhammadiev, A.; Matchanov, O.; Sobirov, E.; Azamov, S. Energy-efficient environmentally friendly electric device for the destruction of weeds by heating them. IOP Conf. Ser. Earth Environ. Sci. 2022, 1076, 012036. [Google Scholar] [CrossRef]
  37. Fergedal, S. Weed control by freezing with liquid nitrogen and carbon dioxide snow. A comparison between flaming and freezing. In Proceedings of the Maitrise Des Adventices Par Voie Non Chimique, Communications de la Quatrieme Conference Internationale I.F.O.A.M., Dijon, France, 5–9 July 1993; pp. 163–166. [Google Scholar]
  38. Gay, P.; Piccarolo, P.; Ricauda Aimonino, D.; Tortia, C. A high efficiency steam soil disinfestation system, part I: Physical background and steam supply optimisation. Biosyst. Eng. 2010, 107, 74–85. [Google Scholar] [CrossRef]
  39. Goel, A.; Foshee, W.; Kirkici, H.; Ieee, I. Pulsed Electric Field Studies of Bio-Dielectrics; IEEE: Piscataway, NJ, USA, 2003; pp. 56–59. [Google Scholar]
  40. Gonzalez-de-Soto, M.; Emmi, L.; Garcia, I.; Gonzalez-de-Santos, P. Reducing fuel consumption in weed and pest control using robotic tractors. Comput. Electron. Agric. 2015, 114, 96–113. [Google Scholar] [CrossRef]
  41. Helsel, Z.R.; Pimentel, D. Energy in pesticide production and use. Encycl. Pest Manag. 2007, 2, 157–160. [Google Scholar]
  42. Kaufman, K.R.; Schaffner, L.W. Energy Requirements and Economic Analysis of Electrical Weed Control; The Sugarbeet Research and Education Board of Minnesota and North Dakota: Fargo, ND, USA, 1980; pp. 72–85. [Google Scholar]
  43. Mwitta, C.; Rains, G.C.; Prostko, E. Evaluation of Diode Laser Treatments to Manage Weeds in Row Crops. Agronomy 2022, 12, 2681. [Google Scholar] [CrossRef]
  44. Lati, R.N.; Rosenfeld, L.; David, I.B.; Bechar, A. Power on! Low-energy electrophysical treatment is an effective new weed control approach. Pest Manag. Sci. 2021, 77, 4138–4147. [Google Scholar] [CrossRef]
  45. Diprose, M.F.; Hackam, R.; Benson, F.A. Weed control by high voltage electric shocks. In Proceedings of the 1978 British Crop Protection Conference-Weeds, Brighton, UK, 20–23 November 1978; pp. 443–450. [Google Scholar]
  46. Chandler, J.M. Crop and weed response to an electrical discharge. In Proceedings of the 31st Annual Meeting of the Southern Weed Science Society, Charleston, South Carolina, 20–25 January 1978; Volume 63. [Google Scholar]
  47. Mizuno, A.; Tenma, T.; Yamano, N. Destruction of weeds by pulsed high voltage discharges. In Proceedings of the Record of the 1990 IEEE Industry Applications Society Annual Meeting, Seattle, WA, USA, 7–12 October 1990; pp. 720–727. [Google Scholar]
  48. Blasco, J.; Aleixos, N.; Roger, J.M.; Rabatel, G.; Moltó, E. Automation and emerging technologies. Robotic weed control using machine vision. Biosyst. Eng. 2002, 83, 149–157. [Google Scholar] [CrossRef]
  49. Cao, Y.; Repo, T.; Silvennoinen, R.; Lehto, T.; Pelkonen, P. An appraisal of the electrical resistance method for assessing root surface area. J. Exp. Bot. 2010, 61, 2491–2497. [Google Scholar] [CrossRef]
  50. Scheible, A. Apparatus for Exterminating Vegetation. US Patent 546,682, 24 September 1895. [Google Scholar]
  51. Sharp, A.A. Vegetation Exterminator. US Patent 492,635, 28 February 1893. [Google Scholar]
  52. Diprose, M.F.; Benson, F.A. Electrical methods of killing plants. J. Agric. Eng. Res. 1984, 30, 197–209. [Google Scholar] [CrossRef]
  53. Diprose, M.F.; Fletcher, R.; Longden, P.C.; Champion, M.J. Use of electricity to control bolters in sugar beet (Beta vulgaris L.): A comparison of the electrothermal with chemical and mechanical cutting methods. Weed Res. 1985, 25, 53. [Google Scholar] [CrossRef]
  54. Vigoureux, A. Results of trials carried out in Belgium in 1980 about killing weed beets by electric discharge. Meded. Van De Fac. Landbouwwet. Rijksuniv. Gent 1981, 46, 163–172. [Google Scholar]
  55. Mizuno, A.; Nagura, A.; Miyamoto, T.; Chakrabarti, A.; Sato, T.; Kimura, K.; Kimura, T.; Kobayashi, M. A portable weed control device using high frequency AC voltage. In Proceedings of the Record of the 1993 IEEE Industry Applications Conference, Toronto, ON, USA, 2–8 October 1993; pp. 2000–2003. [Google Scholar]
  56. Manaaki Whenua-Landcare Research. The New Zealand Soils Portal. 2024, Version: 5.0.154. Available online: https://soils.landcareresearch.co.nz/ (accessed on 3 January 2024).
  57. Field, A.P. Discovering Statistics Using IBM SPSS Statistics: And Sex and Drugs and Rock ‘n’ Roll, 4th ed.; Sage: London, UK, 2013. [Google Scholar]
  58. Armstrong, R.A. When to use the Bonferroni correction. Ophthalmic Physiol. Opt. 2014, 34, 502–508. [Google Scholar] [CrossRef] [PubMed]
  59. Perneger, T.V. What’s wrong with Bonferroni adjustments. BMJ 1998, 316, 1236. [Google Scholar] [CrossRef]
  60. Baev, I.V.; Yudaev, V.I. The determination of the most effective current type for electrical damage of plants. Indian J. Sci. Technol. 2017, 10, 1. [Google Scholar] [CrossRef]
  61. Gusbeth, C.; Frey, W.; Bluhm, H. Evidences for membrane electroporation during application of nanoseconds electrical pulses. In IEEE Conference Record-Abstracts; IEEE: Piscataway, NJ, USA, 2004; Volume 195. [Google Scholar] [CrossRef]
  62. Yudaev, I.V. Analysis of Variation in Circuit Parameters for Substitution of Weed Plant Tissue under Electric Impulse Action. Surf. Eng. Appl. Electrochem. 2019, 55, 219–224. [Google Scholar] [CrossRef]
  63. Slaven, M.J.; Koch, M.; Borger, C.P.D. Exploring the potential of electric weed control: A review. Weed Sci. 2023, 1–19. [Google Scholar] [CrossRef]
  64. McNeill, J. Electrical Conductivity of Soil and Rocks; Geonics Ltd.: Mississauga, ON, Canada, 1980. [Google Scholar]
  65. Ahmad, J.; Muhammad, K.; Ahmad, I.; Ahmad, W.; Smith, M.L.; Smith, L.N.; Jain, D.K.; Wang, H.; Mehmood, I. Visual features based boosted classification of weeds for real-time selective herbicide sprayer systems. Comput. Ind. 2018, 98, 23–33. [Google Scholar] [CrossRef]
  66. Anken, T.; Latsch, A. Detection rate and spraying accuracy of Ecorobotix ARA. In 42nd GIL Annual Conference, Artificial Intelligence in the Agricultural and Food Sector; Gandorfer, M., Hoffmann, C., El Benni, N., Cockburn, M., Anken, T., Floto, H., Eds.; Society for Informatics: Bonn, Germany, 2022; pp. 45–50. [Google Scholar]
  67. Coleman, G.; Bender, A.; Hu, K.; Sharpe, S.; Schumann, A.; Wang, Z.; Bagavathiannan, M.; Boyd, N.; Walsh, M. Weed detection to weed recognition: Reviewing 50 years of research to identify constraints and opportunities for large-scale cropping systems. Weed Technol. 2022, 36, 741–757. [Google Scholar] [CrossRef]
  68. Coleman, G.; Salter, W. More eyes on the prize: Open-source data, software and hardware for advancing plant science through collaboration. AoB Plants 2023, 15, plad010. [Google Scholar] [CrossRef]
  69. Li, N.; Zhang, X.; Zhang, C.; Guo, H.; Sun, Z.; Wu, X. Real-Time Crop Recognition in Transplanted Fields With Prominent Weed Growth: A Visual-Attention-Based Approach. IEEE Access 2019, 7, 185310–185321. [Google Scholar] [CrossRef]
  70. Ziwen, C.; Chunlong, Z.; Nan, L.; Zhe, S.; Wei, L.; Bin, Z. Study review and analysis of high performance intra-row weeding robot. Trans. Chin. Soc. Agric. Eng. 2015, 31, 5. [Google Scholar]
  71. Michaels, A.; Haug, S.; Albert, A. Vision-based high-speed manipulation for robotic ultra-precise weed control. In Proceedings of the International Conference on Intelligent Robots and Systems (IROS), Hamburg, Germany, 28 September–3 October 2015; pp. 5498–5505. [Google Scholar]
  72. Nguyen, V.-T.; Tung, T. Development of a prototype of weeding robot. Eng. Res. Express 2024, 6, 015411. [Google Scholar] [CrossRef]
  73. Malewar, A. New agricultural Robots Kill Individual Weeds with Electricity. Available online: https://www.inceptivemind.com/small-robot-company-tom-dick-kill-individual-weeds-electricity/19481/ (accessed on 3 August 2022).
  74. Lysakov, A.A.; Masyutina, G.V.; Rostova, A.T.; Eliseeva, A.A.; Lubentsov, V.F. Development of a weeding robot with tubular linear electric motors. IOP Conf. Ser. Earth Environ. Sci. 2021, 852, 012063. [Google Scholar] [CrossRef]
  75. Vaqar, A. New Weed Killer Robot Scours the Fields and Takes Out Weeds with a Single Chemical Jet Blast. Wonderful Engeneering. 2018. Available online: https://wonderfulengineering.com/new-weed-killer-robot-scours-the-fields-and-takes-out-weeds-with-a-single-chemical-jet-blast/ (accessed on 2 May 2024).
  76. Abdelghafour, F.; Rançon, F.; Liu, S.; Champ, J.; De Rudnicki, V.; Guizard, C.; Goëau, H.; Doussan, C.; Joly, A.; Bonnet, P. 83. WeedElec: A robotic research platform for individual weed detection and selective electrical weeding. In Precision Agriculture’21; Wageningen Academic: Wageningen, The Netherlands, 2021; pp. 695–702. [Google Scholar]
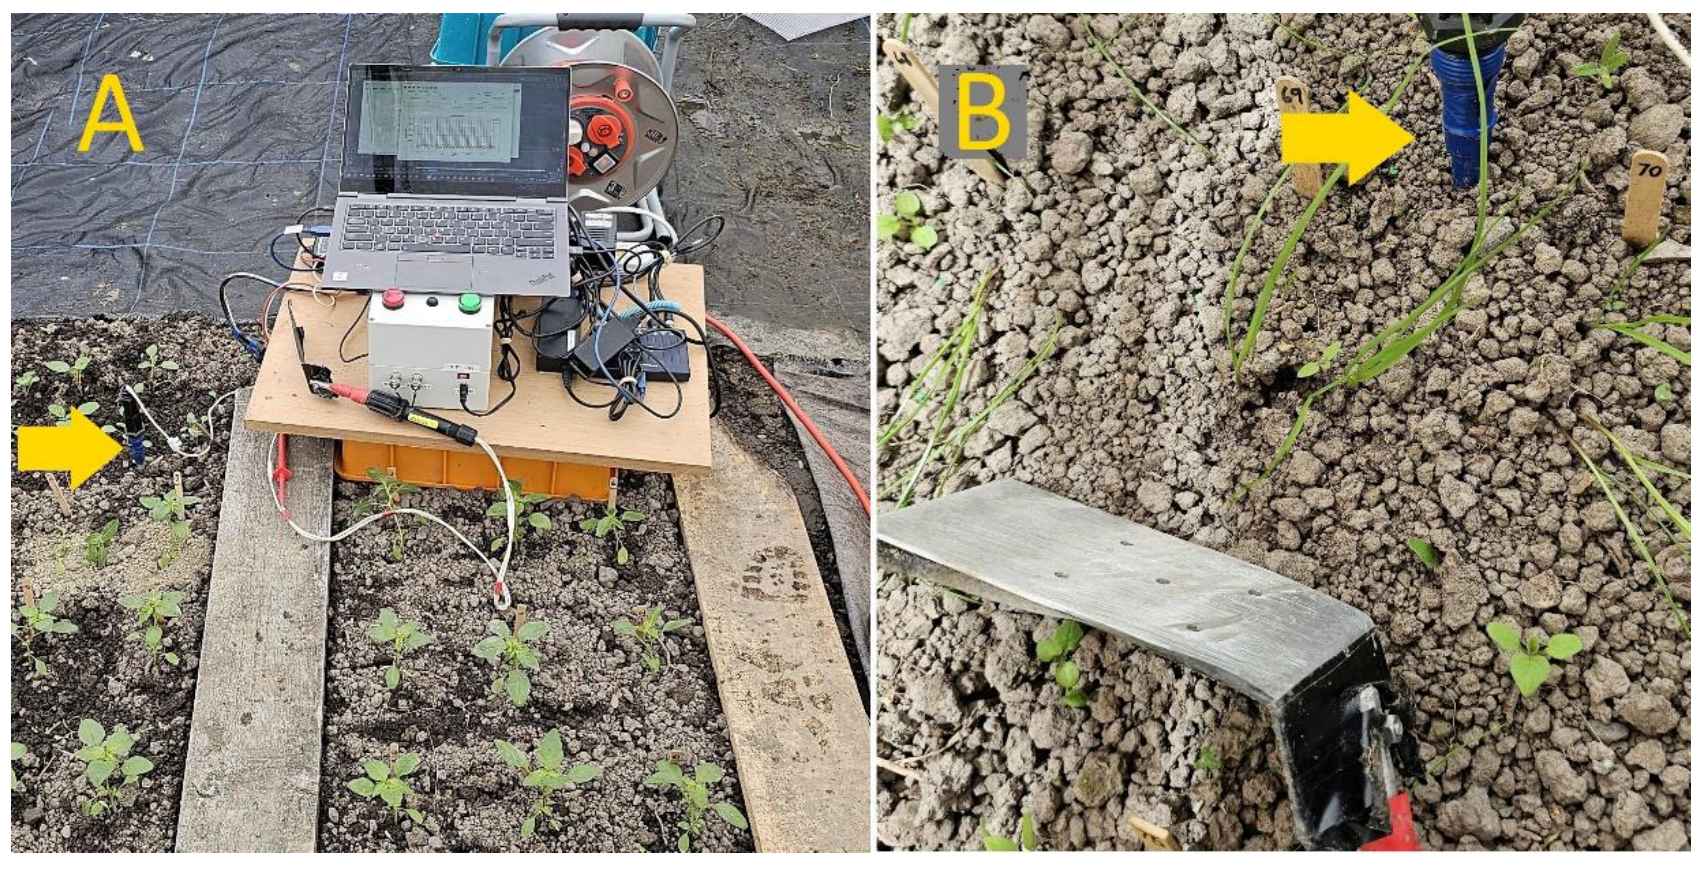
Figure 1. Photographs showing the WedaTech PMS equipment set up ready to apply flat-plate electrode treatments to (A) in-ground-grown A. powellii seedlings, and (B) sets of three L. multiflorum seedlings as single applications. The earthing electrode (yellow arrow) is the 5 mm diameter rod inserted 75 mm into the soil.
Sustainability 16 04324 g001
Figure 2. Photographs of alternative treatments being applied to bag-grown L. didymum seedlings using a 40 mm treatment electrode and (A) a 5 mm earthing probe inserted 75 mm into the soil, and (B) a 30 mm diameter disc earthing electrode pressed to the soil surface.
Sustainability 16 04324 g002
Figure 3. Photograph showing (A) the WedaTech PMS equipment, and (B) an array of 5 mm aluminium probe electrodes at 10 cm spacings set up to test soil conductivity and resistance in different positions and with increasing electrode separation gaps. The positive electrode (C) is coloured red, and the negative earthing electrode (D) is coloured blue.
Sustainability 16 04324 g003
Figure 4. Clustered boxplot of plant vigour score (0 = dead, 1 = healthy) at 7 DAT by treatment code for L. didymum in bags indoors and outdoors in the ground. A mild outlier is shown by a green dot. Plots sharing the same letters are not significantly different as determined using Kruskal–Wallis pairwise multiple comparisons.
Sustainability 16 04324 g004
Figure 5. Logarithmic scatterplot of standardised discharged energy (J cm−1) showing the correlation with power functions of discharged energy by electrode separation gap with the treatment disc-electrode pressing L. didymum plants to the soil surface (green circles) or pressed to bare soil only (brown diamonds).
Sustainability 16 04324 g005
Figure 6. Clustered boxplot of A. powellii plant condition 12 days after treatment with pulsed microshocks by treatment showing that untreated plants were healthy, and that the condition of treated plants reduced with increasing electrical dose applied. Extreme outliers are indicated by stars. Plots sharing the same letters are not significantly different as determined using Kruskal–Wallis pairwise multiple comparisons.
Sustainability 16 04324 g006
Figure 7. Histogram of A. powellii plants surviving 15 days after treatment comparing bagged versus in-ground plants, and the flat-plate electrode contacting the leaves only versus the electrode pressing plants to the soil. All untreated plants (000-000) survived, and some plants given lower energy treatments survived, but all plants receiving the higher doses were killed.
Sustainability 16 04324 g007
Figure 8. Clustered boxplot of discharged energy by treatment applied to A. powellii in bags and in the ground with the treatment electrode either pressing against the leaves only or pressing the plant to the soil surface. Mild outliers are indicated by dots and extreme outliers are indicated by stars. Plots sharing the same letters are not significantly different as determined using Kruskal–Wallis pairwise comparisons.
Sustainability 16 04324 g008
Figure 9. Screenshot of the WedaTech Zapper control interface showing the set number of pulses, voltage, time per pulse, period of pulses and a chart of the resulting oscilloscope measurements of voltage and current during application of a treatment to the upper leaves of an A. powellii seedling. N = logged number of pulses, V = mean voltage, I = mean current (amps), E = calculated energy (Joules), and R = calculated mean resistance (Ohms).
Sustainability 16 04324 g009
Figure 10. Screenshot of the WedaTech Zapper control interface showing a chart of the resulting oscilloscope measurements of voltage and current during application of a treatment to the upper leaves of an A. powellii seedling with poor initial contact.
Sustainability 16 04324 g010
Figure 11. Clustered boxplot of L. multiflorum plant survival rate 14 days after treatment by dose applied to plants in bags and in the ground with the treatment electrode either pressing against the leaves only or pressing the plant to the soil surface. A mild outlier is indicated by a green dot and extreme outliers by stars. Plots sharing the same letters are not significantly different using Kruskal–Wallis all-pairwise comparisons.
Sustainability 16 04324 g011
Figure 12. Scatterplot of L. multiflorum mean survival rate per bag 14 DAT by discharged energy for bag-grown and in-ground plants and both leaf-only or leaf pressed to the soil surface treatments. Each discharge treated three L. multiflorum seedlings at the same time.
Sustainability 16 04324 g012
Figure 13. Clustered boxplot of discharged energy for treatments applied to L. multiflorum in bags and in the ground. Mild outliers are indicated by dots and extreme outliers by stars. Plots with the same letters are not significantly different as determined using Kruskal–Wallis stepwise step-down multiple comparisons.
Sustainability 16 04324 g013
Figure 14. Time series photographs taken before, during and immediately after treatment with pulsed electric microshocks of seedlings surrounding a central weed, and at 1, 3 and 11 days after treatment was applied, showing adjacent weeds were unaffected.
Sustainability 16 04324 g014
Table 1. Trial summary table showing trial number, weed species, plant size, and treatments applied.
TrialSpeciesMean SizeTreatments
1L. didymumStem length
64.0 mm (SD = 13.9 mm)
Stem basal diameter 1.9 mm (SD = 0.5 mm)
Plants grown: in bags vs. in ground
Application: to leaves pressed to dry soil surface
Dose applied: no treatment vs. 25, 50 or 100 × 100 µs pulse lengths at 4.5 kV with electrode disc pressing plant to soil.
Extra treatments: inserted rod vs. surface-pressed disc earthing electrode applying 100 × 100 µs pulses at 4.5 kV with different electrode separation distances.
2A. powelliiStem length
72.9 mm (SD = 12.3 mm)
Stem basal diameter 2.1 mm (SD = 0.3 mm)
Plants grown: in bags vs. in ground
Application: to leaf canopy only vs. leaves pressed to dry soil surface
Dose applied: no treatment vs. 25 × 25 µs, 50 × 50 µs, 50 × 100 µs, 100 × 100 µs, or 100 × 200 µs pulses at 4.5 kV.
3L. multiflorumTiller No.
1.2 (SD = 0.3)
Leaf No.
2.9 (SD = 0.5)
Longest leaf length
157.6 mm (SD = 17.1 mm)
Plants grown: in bags vs. in ground
Application: to leaf canopy only vs. leaves pressed to dry soil surface
Dose applied: no treatment vs. 100 × 200 µs pulses, 200 × 200 µs pulses and 200 × 400 µs pulses at 3.5 kV or 4.5 kV.
Table 2. Mean energy discharge for Trial 1 when L. didymum growing in bags or in the ground were treated with 4.5 kV × 100 µs pulse doses using either a probe or a disc earthing electrode. Mean energy discharge values sharing the same letters are not significantly different as determined using Kruskal–Wallis pairwise multiple comparisons.
PlantingEarthingVoltagePulse Length (µs)Number of PulsesMean Energy Discharge (J)
BaggedProbe4500100254.6 b
BaggedProbe4500100508.4 c
BaggedProbe450010010023.0 d
BaggedDisc45001001004.5 b
In-groundDisc45001001002.2 a
Table 3. Table showing the mean energy discharge rate (kJ s−1) by dose applied (voltage-pulse length-pulse number) for A. powellii plants growing in bags or in the ground and the treatment electrode pressed to the leaves only or pressing the plant against the soil surface.
Mean Energy Discharge (kJ s−1)
TreatmentBag-GrownGround-Grown
Dose AppliedLeaves OnlyPressed to SoilLeaves OnlyPressed to Soil
45-025-0250.5180.6670.0530.050
45-050-0251.6742.0220.3030.724
45-050-0501.3022.1780.2520.976
45-100-0501.5052.3450.2070.740
45-100-1001.6493.8070.2410.529
45-100-1001.4523.1700.18510.459
Table 4. Comparisons of A. powellii seedling plants treated in bags and in the ground, with the treatment electrode applied to the leaves only or pressing the plant against the soil surface, showing the mean energy discharge per plant (J), mean energy discharge rate (kJ s−1) and mean plant death rate 15 days after treatment.
Bag-Grown PlantsIn-Ground-Grown Plants
Dose Discharge Duration (ms)>00.625>0.625>00.625>0.625
Average of all plantsMean death rate (%)86.125.098.388.758.394.9
Mean energy discharge/plant (J)12.90.3717.92.010.0322.82
Mean energy discharge rate (kJ s−1)1.860.592.110.3910.0520.459
Electrode contacting leaf canopy only Mean death rate (%)88.933.310080.633.390.0
Mean energy discharge/plant (J)8.390.3211.71.170.0331.63
Mean energy discharge rate (kJ s−1)1.350.511.520.2070.0530.238
Electrode pressing whole plant to soilMean death rate (%)83.316.796.797.183.3100
Mean energy discharge/plant (J)17.40.4124.22.870.0314.21
Mean energy discharge rate (kJ s−1)2.360.662.700.5760.0500.681
Table 5. Variables entered in the equation for a binary logistic regression for predicting the likelihood that A. powellii seedlings treated with pulsed electric shocks would be killed.
Variables in the Equation 95% C.I. for EXP(B)
BS.E.WalddfSig.Exp(B)LowerUpper
Step 1Electrode Contact1.1160.7842.02810.1543.0540.65714.193
Soil Moisture (%)0.2590.1433.30310.0691.2960.9801.715
Stem Length (mm)−0.0300.0340.79910.3710.9700.9081.037
Stem Diameter (mm)−0.1331.2580.01110.9160.8750.07410.300
Mean Voltage (V)0.0010.0007.96510.0051.0011.0001.001
Mean Current (I)−8.3973.7654.97410.0260.0000.0000.362
Discharged energy (J)3.0481.0768.02310.00521.0802.557173.768
Constant−8.4364.4353.61810.0570.000
Table 6. Summary of the death rate and discharged energy when L. multiflorum plants in bags or in the ground were treated with the treatment electrode applied to the leaf canopy only or to whole plant pressed to the soil surface at either 3.5 or 4.5 kV.
Voltage (kV)Bag-Grown PlantsIn-Ground Plants
3.54.5All3.54.5All
All plantsDeath Rate (%)83.391.787.591.796.394.0
Energy Discharge (J)59.495.277.36.5811.89.18
Energy ha−1 (MJ ha−1) *2.974.763.860.3290.5890.507
Leaf canopy only contactedDeath Rate (%)87.087.087.088.992.690.7
Energy Discharge (J)56.589.473.04.4910.07.26
Energy ha−1 (MJ ha−1) *2.824.473.650.2240.5020.363
Leaves pressed to soilDeath Rate (%)79.696.388.094.410092.7
Energy Discharge (J)62.210181.68.6813.511.1
Energy ha−1 (MJ ha−1) *3.115.054.100.4340.6750.555
* Energy ha−1 assumes the full discharge was applied to each of 5 plants m−2.
Table 7. Variables entered in the equation for a binary logistic regression for predicting the likelihood that L. multiflorum seedlings treated with pulsed electric shocks would be killed.
Variables in the Equation 95% C.I. for EXP(B)
BS.E.WalddfSig.Exp(B)LowerUpper
Step 1Electrode Contact0.7920.3495.15010.0232.2081.1144.375
Leaf number −0.5060.2444.29010.0380.6030.3740.973
Longest leaf (mm)0.0140.0074.50910.0341.0141.0011.028
Soil moisture (%)−0.0250.0280.83410.3610.9750.9241.029
Mean Voltage (V)0.0010.00058.8491<0.0011.0011.0011.001
Mean Current (I)−0.6901.0490.43310.5100.5010.0643.916
Discharged energy (J)0.0260.0099.37010.0021.0271.0101.044
Constant−2.3341.3113.17210.0750.097
Table 8. Comparison of key plant measurements for L. multiflorum in successive experiments showing that seedlings in the current trial were of similar size to earlier trials.
TrialTiller No.Leaf No.Longest Leaf Length
Current1.22.9158 mm
Previous [28] 1 *1.02.0109.mm
Previous [28] 2 ^1.02.0149 mm
Previous [32] 1 ^1.63.7141 mm
Previous [32] 2 ^1.94.0197 mm
* single-pulse treatments ^ multiple-pulse treatments.
Disclaimer/Publisher’s Note: The statements, opinions and data contained in all publications are solely those of the individual author(s) and contributor(s) and not of MDPI and/or the editor(s). MDPI and/or the editor(s) disclaim responsibility for any injury to people or property resulting from any ideas, methods, instructions or products referred to in the content.