Abstract
Based on the energy consumption data of the Changjiang River Administration of Navigation Affairs public building located in Wuhan, China, this paper analyzes the energy consumption characteristics of public buildings. Using the DesignBuilder energy simulation software (v7.0.0.096), various factors influencing building energy consumption are investigated. Furthermore, SPSS (v26.0.0.0) is employed to conduct correlation analyses between measured and simulated energy consumption data. The results indicate that the most significant factors affecting energy consumption are outdoor temperature, office equipment usage time, anticipated room temperature settings, boiler usage time, and per capita daily water consumption. By exploring the factors influencing energy consumption in public buildings, this study contributes novel insights into setting targets, adjusting schemes, and achieving energy-saving effects.
1. Introduction
Energy is a crucial foundation for economic development and modernization [1]. In recent years, with the rapid growth of the global economy and the continuous improvement of people’s living standards, building energy consumption has become one of the key issues in energy conservation [2], with its proportion of total energy consumption increasing year by year. The Sixth Assessment Report (AR6) released by the Intergovernmental Panel on Climate Change (IPCC) indicates that human activities, including pollution emissions from energy consumption, are making extreme climate events such as heatwaves, heavy rainfall, and droughts more frequent and severe. This underscores the growing awareness of sustainable development and emphasizes the necessity and urgency of energy conservation [3].
The “World Energy Outlook 2023” emphasizes the potential and significance of energy efficiency in buildings [4]. It advocates for building energy conservation through improvements in architectural design, adopting efficient equipment, optimizing energy management, and integrating new technologies such as smart building management systems, efficient insulation materials, and renewable energy sources. The 27th United Nations Climate Change Conference (COP27) [5], convened at the end of 2022, urged governments globally to shift from fossil fuels to renewable energy sources like wind and solar power. It launched the Building Breakthrough initiative to align policies among nations, aiming to substantially bolster clean technologies and sustainable solutions in the building sector by 2030. The COP28 [6] held in Dubai at the end of 2023 achieved the “UAE Consensus”, which explicitly stated the goals of tripling global renewable energy capacity, doubling energy efficiency, and further reducing the use of coal-fired power plants without emission reduction measures by 2030. According to the Global Alliance for Buildings and Construction (GlobalABC)’s “2023 Global Status Report for Building and Construction” [7], building and construction industry energy consumption accounted for 34% of global energy consumption, and the carbon emissions from the building and construction industry accounted for approximately 37% of global emissions. It has returned to pre-pandemic levels and continues to show a growing trend.
The relevant data from the “China Statistical Yearbook” indicate that China’s primary energy consumption has continued to grow steadily in the 21st century [8]. In 2021, China’s building energy consumption reached 1.91 billion tce, accounting for 36.3% of the national energy consumption, with a total carbon emission of 4.07 billion tCO2, representing 38.2% of the national energy-related carbon emissions. Among these, the proportion of carbon emissions from the operation of public buildings was 41%, increasing by 95 million tCO2 compared to 2020, with a growth rate of 11.1%, accounting for 63% of the total increase in carbon emissions from building operations [9]. Public buildings often have higher operational demands, usage frequency, and intensity compared to residential buildings. Therefore, the energy consumption per unit area is often higher in public buildings. However, under the influence of government policies and industry standards during China’s 11th Five-Year Plan to the 14th Five-Year Plan, efforts have been made to reduce energy consumption. According to the annual reports on Chinese building energy consumption published by Tsinghua University, the ratio of energy consumption per unit area between public buildings and residential buildings decreased from 4 times in 2017 to 2.9 times in 2021 [10].
Therefore, analyzing the factors driving the growth of energy consumption in public buildings is particularly important. It can help understand the energy consumption mechanism of buildings, provide energy-saving guidance and decision support, and fundamentally contribute to reducing building energy consumption and improving building energy efficiency.
The International Energy Agency has listed six aspects that influence building energy consumption [11], including climate, building envelope, building services and energy systems, building operation and maintenance, occupant activities and behavior, and indoor environmental quality. Among these, occupant behavior is a crucial factor affecting building energy consumption [12,13]. Cui et al. [14] conducted a correlation analysis of climate and energy consumption data in three typical cities in Northeast China over the past 50 years, concluding that climate change significantly affects the energy consumption of buildings in cold regions. Minseok et al. [15] found through analysis that building form factor, block angle, and building orientation have significant correlations with building energy use, and they also studied the potential impact of natural ventilation and urban heat island effect on building energy consumption. Jiang et al. [16] used the Apriori algorithm to verify the significant influence of basic building parameters such as heat transfer coefficient, window-to-wall ratio, and shading coefficient on energy consumption. Mao [17] explored the climate characteristics and energy-saving situation in the Wuhan area, constructed an energy-saving evaluation system for residential buildings in Wuhan, and conducted empirical analysis. Lope L [18] categorized the energy-saving factors of residential buildings into three aspects: building environment, occupant behavior, and building equipment technology. They concluded that occupants have a significant impact on energy savings and conducted simulation calculations to maximize the energy-saving potential by coordinating occupants’ energy consumption behavior. Kim Y. S. and Srebric J. [19] studied over a dozen different cases in commercial buildings, focusing on whether artificial variables exist in the buildings. They found that compared to buildings with occupants, unoccupied buildings can save up to 10% of energy consumption. Jia et al. [20] used the grey relational analysis method to explore the influencing factors of building energy consumption and identified the impact of user behavior patterns on building energy consumption.
Therefore, the behavioral habits of building occupants are the primary influencing factors on building energy consumption, and their impact cannot be overlooked. Zhang et al. [21] identified the significant role of user behaviors, such as adjustment of indoor temperature and lighting, patterns and durations of equipment usage, and water resource consumption habits, in building energy consumption. They elucidated the principles by which these factors affect building energy consumption and performance. Rouleau et al. [22] investigated the impact of occupant behaviors, including indoor temperature settings, frequency and duration of energy equipment usage, and lighting and ventilation habits, on energy consumption and comfort in high-performance residential buildings, highlighting the importance of optimizing occupant behavioral habits for energy savings. Chen et al. [23] conducted an in-depth analysis of the various aspects of occupant behavior’s influence on building energy consumption, identifying factors such as lifestyle habits, energy usage behaviors, and indoor temperature settings, which have direct and indirect effects on building energy consumption. Dong et al. [24] explored the significant impact of user behaviors in office buildings, including usage of office equipment, lighting, air conditioning, and heating systems, on energy consumption, and proposed corresponding energy-saving measures, such as enhancing employee awareness of energy consumption, optimizing equipment usage, and improving building design to enhance energy efficiency.
Spyropoulos G.N. et al. [25] conducted an in-depth investigation into the energy consumption composition of Greek public buildings, as well as the current status of energy conservation in heating, ventilation, air conditioning (HVAC), and lighting electricity consumption. They found that HVAC accounted for 48%, lighting accounted for approximately 35%, and other electrical equipment accounted for 17% of the total energy consumption. They also discovered that changing the air conditioning set temperature could reduce energy consumption by about 18%, and reducing the heat transfer coefficient of external windows could improve energy efficiency. Zhang [26] analyzed the influencing factors of energy consumption in public buildings in Taiyuan City using DeST simulation software and identified seven key factors, including the heat transfer coefficient of the building envelope, equipment power density, and COP of the chiller units. Li et al. [27] analyzed energy consumption data from 453 large public buildings in 24 cities and identified significant energy-saving potential in heating and air conditioning electricity consumption in large public buildings. Li et al. [28] conducted a joint study on the energy-saving effects of multiple public buildings in the United States, Europe, China, and other Asian regions, concluding that user behavior and energy equipment management significantly impact energy-saving effects.
In summary, the existing literature has conducted numerous studies on estimating building energy consumption and analyzing influencing factors. However, there is currently limited and shallow analysis of the energy consumption structure and influencing factors of public buildings. Therefore, this study focuses on the Changjiang River Administration of Navigation Affairs, located in Wuhan, Hubei Province, to explore the characteristics of energy use and influencing factors of public buildings.
The experimental procedure of this study is outlined as follows: Firstly, in Chapter One, potential influences of outdoor temperature and occupants’ energy usage habits on energy consumption in public buildings were identified through a literature review. Subsequently, in Chapter Two, an on-site investigation of the institution’s building information was conducted, encompassing the composition of energy-consuming equipment, water, electricity, and gas consumption data. Then, in Chapter Three, the consumption of water, electricity, and gas was converted into equivalent standard coal for comparative analysis, separately analyzing the consumption characteristics of water, electricity, and gas for the institution. Regression analysis was then conducted on the relatively abundant data of electricity and water consumption with outdoor temperature. Additionally, in Chapter Four, addressing the issue of insufficient data, the main building of the institution was modeled, and orthogonal experiments were employed to determine experimental groups, from which several sets of water, electricity, and gas consumption data were obtained under different conditions. Finally, to further investigate the varying effects of occupants’ energy usage habits on building energy consumption, eight such factors were selected as independent variables, with corresponding water, electricity, and gas consumption data as dependent variables, for regression analysis and sensitivity exploration of energy consumption to each factor.
This study conducted a comprehensive analysis of the energy consumption of a specific public building, integrating methods of on-site investigation and simulation analysis, along with an in-depth exploration of factors related to occupants’ energy usage habits. Additionally, the research revealed the relationships between building energy consumption and various factors through comparative and regression analyses, providing practical insights for energy management and conservation strategies in public buildings. The study underscores the outdoor temperature and the pivotal role of occupants’ behavior in energy consumption and offers a significant reference for other public buildings to develop tailored energy-saving schemes and optimize energy management strategies, thereby maximizing energy efficiency and minimizing energy waste.
2. Survey Results and Analysis of the Building
2.1. General Situation
The “Civil Building Thermal Design Code of China” (GB50176-93) [29] divides China into five climatic zones, including severe cold regions, cold regions, hot-summer and cold-winter regions, hot-summer and warm-winter regions, and temperate regions. Wuhan is the capital city of Hubei Province in China, covering an area of 8569.15 km2. It is the largest city in central and western China and one of the largest water resource cities in China. With water sources such as the Changjiang River, Han River, and Donghu Lake, its water area covers 2217 km2, ranking among the top cities in the world. Wuhan has a subtropical monsoon humid climate, characterized by cold winters, hot summers, abundant rainfall, ample sunshine, and distinct seasons.
The Changjiang River Administration of Navigation Affairs was established in 1984 by the Ministry of Transport of China following the principles of separating government functions from enterprise management and dividing port and maritime management responsibilities. It is responsible for managing the navigation of the Changjiang River main channel and has 49 subordinate branches. This government agency is situated in Wuhan, a region of China with hot summers and cold winters. There are five buildings, including the main building, annex, archive building, data center building, and canteen. These buildings were renovated and constructed in 2013, with a total floor area of approximately 30,400 m2. It is equipped with a central air conditioning system, a heating boiler, four computer rooms in the emergency center, archives management equipment in the archive building, kitchen equipment and air conditioning in the canteen. The total construction area of the main building is 14,906 m2, with 22 floors. The main body has 17 floors, the tower has 4 floors, and the equipment floor (basement) has 1 floor. The main building is shown in Figure 1.
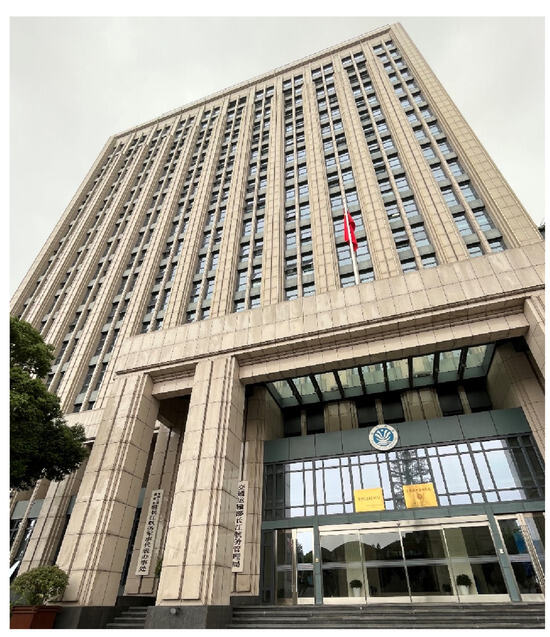
Figure 1.
Main building of Changjiang River Administration of Navigation Affairs.
2.2. Energy Structure
The building energy consumption discussed in this paper is the running energy consumption, that is, the heating and cooling energy consumption generated by maintaining the normal use of the building. Therefore, this paper studies the energy consumption characteristics and structure of the Changjiang River Administration of Navigation Affairs during 2020–2023, following on-site research and data collection. The energy structure is dominated by electricity, natural gas, and water. The main electricity-consuming equipment can be divided into six categories according to the function: computer room, HVAC (Heating, Ventilation, and Air Conditioning), power, lighting, office, and miscellaneous.
The computer room equipment includes modular Uninterruptible Power Supply (UPS) units, servers, monitors, and other devices located in the convergence room for both internal and external networks of the emergency center, equipment monitoring room, security system monitoring room, and data center. The HVAC consumption includes electricity consumption for heating, ventilation, and air conditioning systems to maintain comfortable indoor temperature and air quality, such as air conditioning, boilers, and fans. Power equipment includes elevators, water pumps, and mechanical garages. Lighting equipment includes emergency exit signs, daily fixtures, and lighting systems. Office equipment includes items such as computers, printers, and copiers. Miscellaneous includes equipment such as coffee machines, microwave ovens, and water dispensers.
The energy flow consumption flow is as follows (Figure 2):
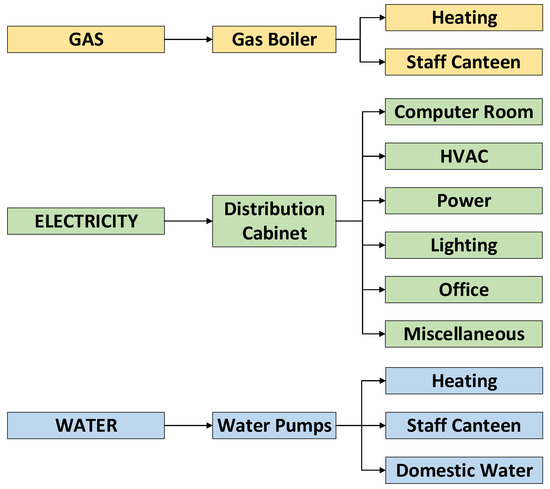
Figure 2.
Energy consumption flow of Changjiang River Administration of Navigation Affairs.
3. Energy Consumption Characteristics and Influencing Factors
3.1. Total Energy Consumption
The institution’s energy consumption system comprises electricity, natural gas, and water. Natural gas serves as the primary energy source, while electricity functions as secondary energy, and water is classified as a non-renewable resource. Given their differing nature, direct comparison among these three is challenging. To facilitate a more precise comparison and analysis of energy consumption, all three types are converted into a standardized unit of coal equivalence, as depicted in Figure 3.
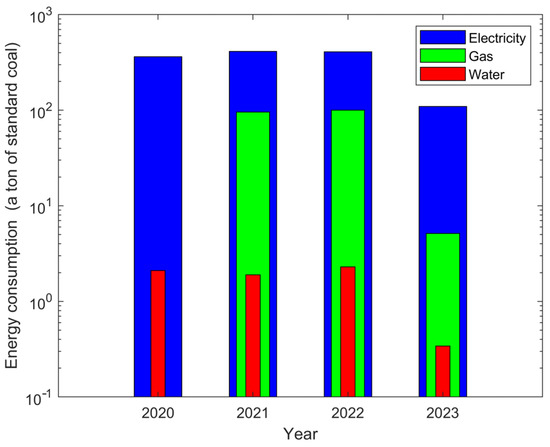
Figure 3.
Energy consumption composition (standard coal, logarithmic scale) from 2020 to 2023. Note: The institution switched to natural gas heating in 2021, and the data for 2023 only includes the first quarter. Electricity conversion standard coal coefficient: 1 KWh = 0.1229 × 10⁻³ tons. Natural gas conversion standard coal coefficient: 1 m3 = 1.33 × 10⁻³ tons. Water conversion standard coal coefficient: 1 ton = 0.0857 × 10⁻³ tons [30].
It can be found that in the energy consumption composition, the proportion of converted standard coal in electricity energy consumption is the highest, accounting for 99.42% in 2020, 80.83% in 2021, 79.95% in 2022, and 67.84% in 2023. Notably, the data for 2020 only includes electricity and water consumption due to the absence of natural gas usage at that time, as the institution switched to natural gas heating in 2021, as explained earlier. Additionally, in 2023, natural gas usage data are included, but it only covers the first quarter. Due to the unique circumstances surrounding the data from 2020 and 2023, there may be an impact on the proportion of electricity consumption to total energy consumption in these two years, potentially affecting the comparability of their results with those of other years. Despite these variations, electricity consumption consistently maintains the highest proportion, followed by gas, with water accounting for the lowest proportion.
In terms of costs, it is notable that electricity and gas expenses collectively account for over 99% of the total, as derived from our investigation into the institution’s energy consumption expenses. Therefore, from the perspective of energy conservation and emission reduction, resource protection, and operation cost saving, we should focus on controlling electricity and natural gas consumption.
3.2. Electrical Consumption
Electrical consumption is one of the focal points in the expenditure of energy costs for this building. The monthly electrical consumption data for the years 2020, 2021, and 2022 were selected as the basis for the study, which is shown in Figure 4.
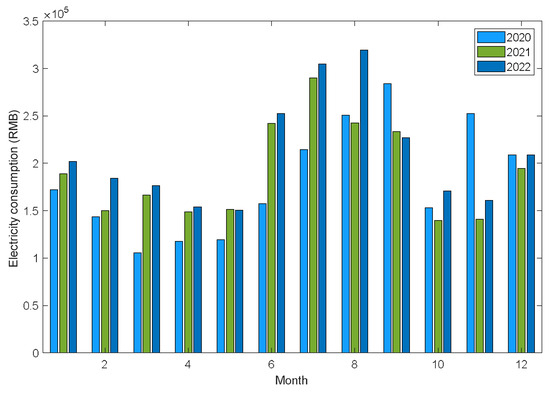
Figure 4.
Monthly electricity consumption from 2020 to 2022.
It can be seen from Figure 4 that the monthly electricity consumption trend is wavy. In the past three years, the average lowest monthly electricity consumption is in April, with 201,060 KWh, and the average highest monthly electricity consumption is in August, with 389,893 KWh, with a difference of 93.92%. The electricity consumption of the building has significant seasonal characteristics, and the total electricity consumption in the third quarter accounts for 34% of the total annual electricity consumption, more than 1/3, and the total electricity consumption in the first quarter, the second quarter, and the fourth quarter are close. Among them, due to the hot summer climate, the use of air conditioning from June to September is relatively high, so these four months become the peak of electricity consumption. Electricity consumption is lowest from March to May and October due to a sharp decrease in the use of air conditioning in spring and autumn. The reason for the low electricity consumption in January and December is that although air conditionings are not used in winter, the use of heating equipment such as boilers and fans during the gas supply period also leads to an increase in electricity consumption. It is also verified that the electricity consumption of the institution is greatly affected by seasonal temperature, and it increases greatly in the high-temperature season due to the use of air conditioning, and relatively less in the spring and autumn season.
3.3. Natural Gas Consumption
Natural gas consumption is one of the key points of its energy expenses. Monthly natural gas consumption data in 2021 and 2022 are selected as the research basis, and the characteristics of natural gas consumption for heating are shown in Figure 5.
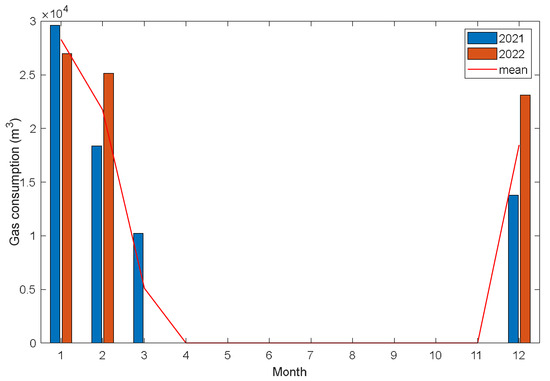
Figure 5.
Monthly natural gas consumption from 2021 to 2022.
The use of natural gas also exhibits significant seasonal characteristics, with peak natural gas consumption occurring in January, February, and December. This is mainly due to the decrease in temperature during winter, leading to an increased demand for heating, thereby significantly increasing the usage of natural gas. Therefore, if we wish to control natural gas consumption, the key lies in exploring the energy-saving potential of the boiler system.
3.4. Water Consumption
Water is an important natural resource. Although the cost accounts for only about 1% of the total annual expenses, the significance of conserving water resources is substantial. Therefore, the monthly water consumption data in the years 2020 and 2021 were selected as the basis for the study, which is shown in Figure 6.
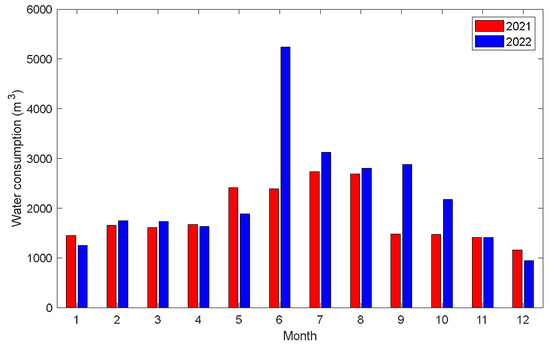
Figure 6.
Monthly water consumption from 2021 to 2022. Note: In June 2022, a burst water pipe caused a sudden increase in tap water consumption. The subsequent data processing has excluded the affected data.
It can be observed that the institution also exhibits significant seasonal variations in water usage, with noticeable fluctuations. Among them, water consumption in the third quarter accounts for 34% of the annual total, exceeding one-third. The second quarter follows with a usage of 27%, and the water consumption in the first and fourth quarters is very close, accounting for 18% and 20% respectively. This further confirms that the water usage in this institution is significantly influenced by seasonal temperatures, with the highest water consumption during high-temperature conditions and relatively lower consumption during winter. Exploring water usage patterns in the summer can lead to substantial savings in resources and operational costs.
3.5. Regression Analysis of Temperature Impact on Energy Consumption
Regression analysis is a statistical method used to study the relationship between independent and dependent variables. Linear regression can estimate the strength and direction of the relationship between independent and dependent variables by establishing a linear relationship model [31]. Quadratic regression extends linear regression by flexibly capturing nonlinear relationships in data through adjusting curvature, incorporating squared terms of independent variables, thereby providing a more accurate representation of complex data patterns [32].
Through the literature review and research on the temperature in Wuhan, we identified the outdoor temperature as the primary environmental factor influencing the energy consumption of the institution. Moreover, employing linear regression for water consumption and quadratic regression for electricity consumption provided a more accurate description of the complex relationship between outdoor temperature and energy consumption. Therefore, in this section, we selected the monthly average outdoor temperature in Wuhan as the independent variable and conducted regression analysis using the main building and total energy consumption of the institution as dependent variables to analyze their energy consumption characteristics. The fitted formulas for linear regression and quadratic regression are as follows:
where,
- —monthly energy consumption (KWh/m2);
- —Monthly average outdoor air temperature (°C);
- —Constant term;
- —Linear coefficient;
- —Quadratic coefficient.
At the same time, we utilize the Pearson correlation coefficient () to evaluate the relationship between variables [33], which is commonly used to measure the strength of linear correlation between two continuous variables.
where,
- —Pearson correlation coefficient;
- —Observed values;
- —Mean values;
- —Predicted values of the dependent variable based on the regression equation;
- —Sample size.
When is close to 1, it indicates that the regression model can explain the variation in the dependent variable, meaning the model fits the observed data well. On the other hand, when is close to 0, it implies that the model has not effectively explained the variation in the dependent variable. is a useful metric for evaluating the explanatory power and fitting effectiveness of a linear regression model. Due to variations in thresholds across different studies, we utilize the criteria outlined in the relevant literature [34,35,36,37] within the field of architecture as a comprehensive reference. We consider an value greater than or equal to 0.7 indicative of a high degree of correlation between the dependent and independent variables, while a value less than or equal to 0.3 suggests a low degree of correlation.
This study conducts regression analysis on water consumption and electricity consumption. The main building is taken as a typical example for demonstration. In the experiment, to avoid regression impacts arising from different units of measurement, temperature, water consumption, and electricity are normalized. The regression results are shown in Figure 7 and Figure 8.
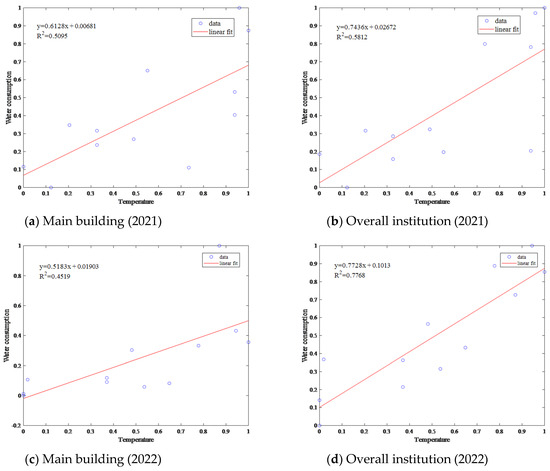
Figure 7.
Linear regression results of monthly water consumption and monthly mean temperature.
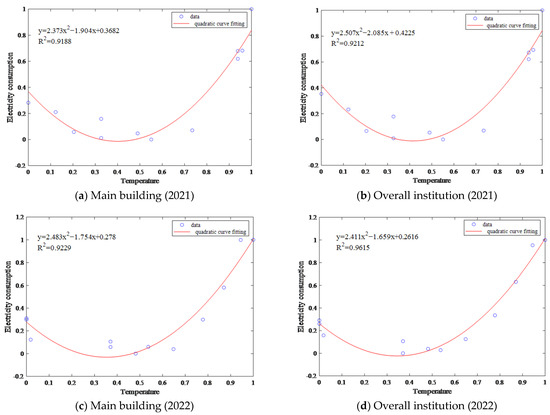
Figure 8.
Quadratic regression results of monthly electricity consumption and monthly average temperature.
From Figure 7, it can be observed that the water consumption of the institution shows a relatively highly correlated relationship with the monthly average temperature, while the main building exhibits a moderately correlated relationship. The fitting performance is generally good. When the monthly average temperature is below 8 °C over the two years, the monthly water consumption of the main building remains around 500 L. When the monthly average temperature reached 28 °C in 2022, the main building’s water consumption reached its highest level in two years, reaching 3000 L, significantly higher than the highest monthly water consumption of 1166 L in 2021. When the monthly average temperature reached a peak of 34 °C in 2022, the overall water consumption of the institution building reached its highest level in two years, at 3124 L, an increase of 607 L compared to 2021. This variation is speculated to be due to extreme temperature events in 2022, with average temperatures in July and August increasing from 29 °C and 28 °C in the previous year to 30 °C and 32 °C, respectively. The average temperatures in the spring and autumn months of 2022 were also generally higher than the same months in 2021. This change supports the characteristic that water consumption tends to increase with rising outdoor temperatures and extreme temperatures may make water consumption more sensitive to variations in outdoor temperature.
Figure 8 shows that the electricity consumption of the overall institution and the main building exhibits a strong quadratic regression relationship with the monthly average temperature. This indicates that the monthly electricity consumption shows a noticeable trend of initially decreasing and then increasing with the rise in the monthly average temperature. When the monthly average temperature is between 9 °C and 22 °C, the monthly electricity consumption remains consistently near the lowest point. However, when the temperature falls below 9 °C or exceeds 22 °C, electricity consumption increases significantly. When the temperature exceeds 27 °C, electricity consumption sharply rises and continues to increase with a further temperature rise until reaching the highest point.
This electricity usage pattern suggests the existence of a potentially optimal outdoor temperature range. When the outdoor temperature is within this range, it may be possible to avoid using natural gas for building heating, and the air conditioning load can be maintained at a lower level, leading to a reduction in overall electricity consumption. Based on the analysis above, it can be preliminarily inferred that this comfortable temperature range is from 9 °C to 22 °C. Temperature extremes, either too low or too high, may increase the cooling or heating load, subsequently causing an increase in electricity consumption.
4. Energy Consumption Simulation Analysis
4.1. Modeling Software Selection
To address the issues of insufficient quantity and accuracy of measured data and to explore more factors influencing energy consumption, a simulation-based approach was employed to conduct an analysis of energy consumption for the main building of this institution. This involved detailed analysis and simulation of the energy consumption of various equipment, personnel, and other items within the building. The software utilized a dynamic calculation method, with the theoretical foundation of the thermal balance method [38] being the conservation of energy law. In the calculation process, we comprehensively considered the thermal balance inside and outside surfaces of the building, as well as the thermal balance between indoor air and the overall building. The method aimed to minimize assumptions and realistically reproduce the process of heat exchange between the building and the external environment, to ensure precise calculations.
where,
- —the cooling load at time ;
- —the area of the ith surface;
- —heat transfer coefficient of the -th surface, KW/(m2·°C);
- —the temperature of the ith inner surface;
- —indoor temperature;
- —ventilation volume at time , m3/s;
- —outdoor air temperature;
- —indoor heat source heat at time , KW.
This study utilized DesignBuilder as the tool for energy consumption simulation analysis. The software allows the importation of CAD drawings to simplify the modeling process, supports natural ventilation settings, includes modules for detailed personnel activities and equipment operating cycles, and enables dynamic simulations on a monthly, daily, or hourly basis as needed. It covers various aspects such as thermal transfer in the building envelope, energy consumption, thermal comfort, and CO2 emissions, providing a comprehensive assessment of the simulation results.
4.2. The Simulated-Building Model
Based on the CAD drawings of the main building, a model of the entire structure was constructed, including the placement of doors and windows on its surfaces. To improve computational efficiency, adjacent rooms with similar functions on each floor were merged. The final architectural model obtained is as follows (Figure 9).
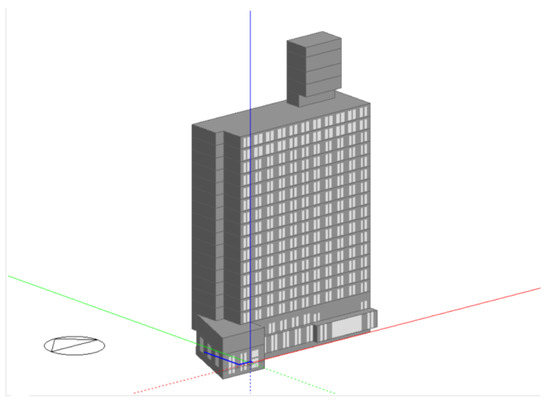
Figure 9.
3D model of the main building.
The information on the building envelope is as follows (Table 1):

Table 1.
Envelope structure information.
According to the research, factors influencing building energy consumption include personnel working time, summer indoor temperature, winter indoor temperature, office equipment usage time, lighting time, air conditioning running time, boiler running time, and per capita water consumption. Through orthogonal experiments, parameters most similar to the actual energy consumption data of the building were selected from 25 sets of simulation results. Wuhan was chosen in the software’s built-in geographical location database, including specific parameters such as altitude, latitude, longitude, and temperature standards for winter and summer. The DesignBuilder software was used to control the parameters of the building envelope, including construction and opening, which determine the structure of external walls, roofs, doors, and windows. Wall materials were selected to ensure the external wall with an overall heat transfer coefficient (-value) of 0.92 W/m2·K, roof -value of 0.66 W/m2·K, and overall window -value of 1.96 W/m2·K. The personnel density variation was set between 0.029 and 0.139 persons/m2. Office personnel density and office equipment usage were set according to Figure 10. Boiler running was set to 1 from 07:00 to 15:00, air conditioning running was set to 1 from 05:00 to 19:00, and lighting level was set to 1 from 07:00 to 19:00, with 0 for the rest of the time. Office environmental temperatures were set to a heating temperature of 20 °C, return air temperature of 12 °C, cooling temperature of 24 °C, and return air temperature of 28 °C.
Figure 10.
Office personnel density and office equipment usage setting.
4.3. Model Reliability Verification
In the energy consumption simulation of the building model, the simulation period in DesignBuilder is set to one year, and the time interval for energy consumption simulation output results is set to one month.
To verify the accuracy of the model, the monthly deviation , annual deviation , and coefficient of variation of the mean square deviation for the -th month are calculated [39]. The smaller these three values are, the higher the accuracy of the model. The calculation formulas are as follows:
where,
- —Actual energy consumption value for the i-th month;
- —Simulated energy consumption value for the i-th month;
- —Monthly energy consumption mean squared deviation;
- —Average value of actual monthly energy consumption.
According to the calculations, all three indicators meet the acceptable range requirements specified by M&V, ASHRAE, and IPMVP [40]. In 2022, the monthly actual electricity consumption of the main building had an annual deviation of 0.027 from the simulated usage, with water consumption at 0.12 and gas consumption at 0.021.
Taking the example of the comparison chart between the monthly simulated and actual electricity consumption values, it can be observed that the building energy consumption simulation curve closely aligns with the actual energy consumption curve. Both exhibit the same trend, demonstrating the reliability of using this model for subsequent work (Figure 11).
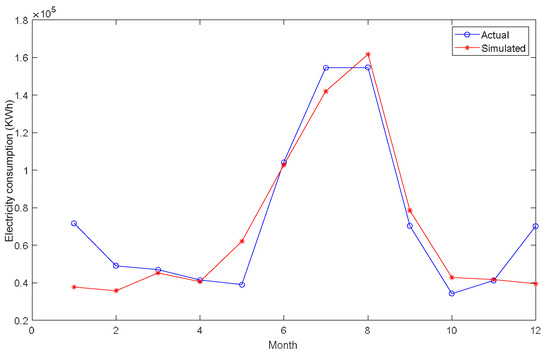
Figure 11.
Comparison of simulated and actual monthly electricity consumption.
While the above data shows a relatively high degree of conformity, there are still some deviations, and the analysis of the reasons is as follows:
- Some equipment models and operating conditions, such as lighting, can only be set to approximate values in DesignBuilder, leading to deviations.
- Specific meteorological data are based on typical meteorological year parameters, which may introduce errors.
- Limited thermal property data for building envelope materials and parameter selection based on experience may introduce errors.
4.4. Regression Analysis of Influencing Factors
To study the energy consumption of the main building, detailed simulation calculations, and analysis were conducted on various equipment operating energy consumption and personnel working patterns. In this section, we selected eight factors related to personnel energy usage habits to investigate their effects on energy consumption. These factors, including personnel working hours, summer indoor temperature, winter indoor temperature, office equipment usage time, lighting time, air conditioning running time, boiler running time, and per capita daily water consumption, were chosen based on the identification of key factors influencing energy consumption from past literature research [20,21,22,23] and the integration of actual building conditions studied. Many inherent connections and patterns between factors and building operational energy consumption were discovered by employing the method of controlling variables to analyze the impact of various factors on energy consumption. Our goal is to analyze the different effects of these personnel energy usage factors on energy consumption and provide a scientific basis and optimization suggestions for energy management, ultimately achieving maximum efficiency in energy utilization. The personnel working hours and the operating hours of various equipment are defined as the sum of the product of the respective attendance rate or usage level and time. We have selected three typical factors as cases to analyze the specific impact of factors on energy consumption.
Analyzing the linear regression results of various factors and the total electricity consumption, considering the regression curve, it was found that the factors with a significant impact on total electricity consumption include the office equipment usage time (as shown in Figure 12), summer indoor temperature, lighting time, and air conditioning running time. Within the range of variable changes, the impact of office equipment usage time on the total annual electricity consumption is positively correlated, with a total increase of 324.25 MWh, accounting for a high proportion of 43.15% of the total electricity consumption. The impact of summer indoor temperature is positively correlated with 105.90 MWh, representing 13.60% of the total electricity consumption, while the electricity consumption influenced by the lighting time and air conditioning running time each account for around 5%.
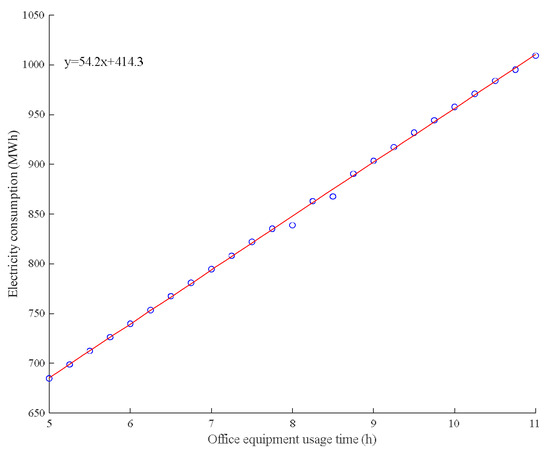
Figure 12.
Office equipment usage time and electricity consumption linear regression relationship.
The factors with a significant impact on the total gas consumption include boiler usage time (as shown in Figure 13), winter indoor temperature, and the operating hours of office equipment. Within the range of variable changes, the impact of boiler usage time on the total annual gas consumption is positively correlated and amounts to 23,355 m3, representing a high proportion of 34.08% of the total gas consumption. The impact of winter indoor temperature is positively correlated with 10,433 m3, accounting for 14.48% of the total gas consumption, while the electricity consumption influenced by the operating hours of office equipment represents 4.58%.
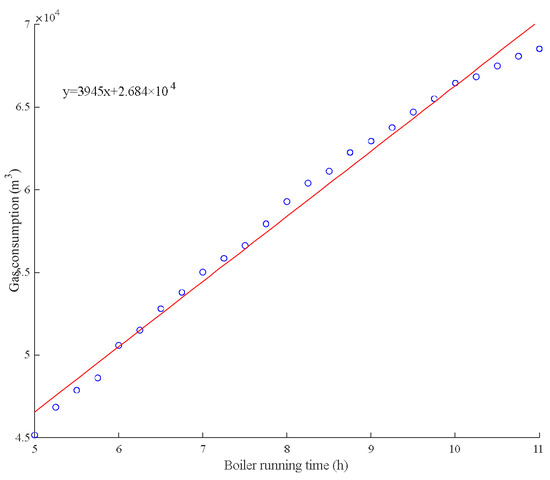
Figure 13.
Linear regression relationship between boiler running time and gas consumption.
The primary influencing factor on the water consumption of the building is the domestic water usage within the building, as shown in Figure 14. The results indicate that the per capita daily water consumption has no impact on the total annual electricity and gas consumption. However, the total water consumption increases with the increase in per capita water usage. During the variation of per capita water usage from 0.2 L to 2 L, the total water consumption increased by 851 m3, accounting for approximately 7% of the total water consumption.
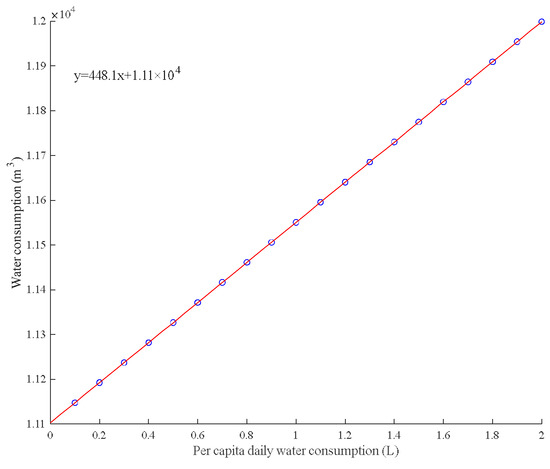
Figure 14.
Linear regression relationship between per capita daily water consumption and water consumption.
Additionally, there are some interactions between individual factors. Due to the heat generated by the use of office equipment and lighting, the room temperature increases, leading to an increase in cooling electricity consumption, with an increase of approximately 24 MWh. Similarly, it can be observed that with the increase in equipment usage time, gas consumption in winter decreases.
In addition to utilizing , which was used in exploring the impact of temperature on energy consumption, sensitivity coefficients [35] were also employed to ascertain the differential effects of the eight factors on energy usage, facilitating the identification of the most significant factors and enabling the prioritization of adjustments in energy management to enhance the effectiveness of energy optimization strategies.
The sensitivity coefficient represents the change in the dependent variable resulting from a unit change in the independent variable. The larger the value of , the stronger the sensitivity of the factor to energy consumption. The formula is as follows:
where,
- —Sensitivity coefficient;
- —Dependent variable, %;
- —Independent variable, %;
The specific simulation results after linear regression analysis are shown in the table below (Table 2).
Table 2.
Regression coefficients of factors.
The impact of various factors on the energy consumption of the building has been discussed and analyzed. Through the analysis of simulated data, according to the magnitude of sensitivity coefficient, it can be noted that the selected eight factors have varying degrees of impact on energy consumption. The order of magnitude of the impact on electricity consumption is as follows: Office equipment usage time (54.2) > Summer indoor temperature (−17.64) > Lighting time (6.58) > Air conditioning running time (5.53) > Personnel working hours (0.65). The order of magnitude of the impact on gas consumption is as follows: Boiler running time (3940) > Winter indoor temperature (1950) > Office equipment usage time (−478) > Personnel working hours (105) > Lighting time (−103) > Summer indoor temperature (−2.78). Only Per capita daily water consumption affects water consumption (448), while other factors do not show significant direct or interactive effects. In the regression analysis results, factors such as Office equipment usage time, Summer indoor temperature, Boiler running time, and Per capita daily water consumption exhibit highly correlated relationships and high sensitivity analysis results, indicating their highest impact on total energy consumption. This finding offers robust scientific evidence to guide energy management and efficiency optimization. Specifically, targeting these factors enables the implementation of tailored measures to reduce energy consumption and enhance energy utilization efficiency. For instance, adjusting office equipment usage time, precisely controlling indoor temperature, optimizing boiler running time, and implementing water-saving measures can effectively achieve energy-saving objectives. Furthermore, continuous monitoring and evaluation of the trends associated with these factors are crucial for ongoing improvements in energy management, contributing to sustained enhancements in energy utilization efficiency and benefits.
5. Conclusions
The study focused on the public building of the Changjiang River Administration of Navigation Affairs, utilizing actual energy consumption data and simulated energy consumption data obtained through DesignBuilder software. Regression analysis using SPSS software was conducted to explore the impact of various factors on building energy consumption. After data processing and analysis, the study derived the operating patterns and influencing factors of energy consumption in public buildings in Wuhan. The results indicate:
- (1)
- When converted to standard coal for calculating the energy consumption composition of the institution, electricity usage has the highest proportion, followed by gas, with the sum of the two reaching 99%. To prioritize energy conservation, resource protection, and cost-saving in organizational operations, attention should be focused on controlling electricity and gas usage.
- (2)
- Monthly water consumption positively correlates with the outdoor monthly average temperature. The fitting performance is generally good, and the water consumption of the institution shows a relatively highly correlated relationship with the monthly average temperature, while the main building exhibits a moderately correlated relationship.
- (3)
- Monthly electricity consumption demonstrates a strong quadratic regression relationship with the outdoor monthly average temperature. As temperature increases, electricity consumption initially decreases and then rises. This indicates that when the temperature is moderate, the environmental temperature is comfortable for both personnel and equipment, thereby reducing the use of air conditioning and lowering electricity consumption.
- (4)
- Among the eight simulated factors influencing energy consumption, according to the magnitude of sensitivity coefficient, the order of magnitude of the impact on electricity consumption is as follows: Office equipment usage time (54.2) > Summer indoor temperature (−17.64) > Lighting time (6.58) > Air conditioning running time (5.53) > Personnel working hours (0.65). The order of magnitude of the impact on gas consumption is as follows: Boiler running time (3940) > Winter indoor temperature (1950) > Office equipment usage time (−478) > Personnel working hours (105) > Lighting time (−103) > Summer indoor temperature (−2.78). Per capita daily water consumption (448) is the sole factor directly impacting water usage, with others showing no notable direct or interactive effects. In regression analyses, variables like Office equipment usage time, Summer indoor temperature, Boiler running time, and Per capita daily water consumption reveal highly correlated relationships and significant sensitivity, indicating their pivotal role in total energy consumption. Enhancing building insulation, improving equipment efficiency, and raising personnel awareness are recommended to optimize energy usage.
This study investigates the impact of temperature on building energy consumption and simulates the effects of eight factors related to occupant behavior on building energy consumption, yielding the conclusions outlined above. However, we are aware of several limitations in our research. Firstly, our empirical data are primarily based on field surveys of a specific public building, which may limit the generalizability of our findings to other regions or building types. Additionally, certain parameters could only be set to approximate values in DesignBuilder during software simulation, resulting in deviations. Secondly, our study may be subject to potential unidentified and uncontrolled confounding factors. Lastly, constraints in time and resources may have limited our ability to delve deeper into additional factors. To address these limitations, future research will employ broader samples, consider more potential confounding factors, and utilize more comprehensive research designs. Nonetheless, the findings of this study still hold significant practical implications. Our research provides valuable insights for similar public building energy management and energy-saving strategies, contributing to the optimization of building energy efficiency and the pursuit of sustainable development goals.
Author Contributions
L.W.: investigation, methodology, supervision, formal analysis, and project administration. J.C.: investigation, software, methodology, formal analysis, validation, writing—original draft, and writing—review and editing Y.Z.: supervision, resources, formal analysis, and project administration. Y.X.: data curation, methodology, and investigation. L.Y.: data curation, formal analysis, and investigation. Y.W.: software, and visualization. All authors have read and agreed to the published version of the manuscript.
Funding
This research received no external funding.
Data Availability Statement
The data presented in this study are available on request from the corresponding author.
Conflicts of Interest
The authors declare that they have no known competing financial interests or personal relationships that could have appeared to influence the work reported in this paper.
References
- Ye, H.; Hu, X.; Ren, Q.; Lin, T.; Li, X.; Zhang, G.; Shi, L. Effect of Urban Micro-Climatic Regulation Ability on Public Building Energy Usage Carbon Emission. Energy Build. 2017, 154, 553–559. [Google Scholar] [CrossRef]
- China Association of Building Energy Efficiency. China Building Energy Consumption Research Report 2020. Build. Energy Effic. 2021, 49, 1–6. [Google Scholar]
- Lejano, P.; Kan, S. IPCC and the City: The Need to Transition from Ideology to Climate Justice. J. Plan. Educ. Res. 2022. [Google Scholar] [CrossRef]
- International Energy Agency (IEA). World Energy Outlook 2023; IEA: Paris, France, 2023. [Google Scholar]
- UNFCCC, Conference of the Parties (COP). Report of the Conference of the Parties on Its Twenty-Seventh Session; UNFCCC, COP: Sharm el-Sheikh, Egypt, 2023. [Google Scholar]
- UNFCCC, Conference of the Parties (COP). Report of the Conference of the Parties on Its Twenty-Eighth Session; UNFCCC, COP: Dubai, United Arab Emirates, 2024; Available online: https://unfccc.int/cop28/outcomes (accessed on 14 March 2024).
- United Nations Environment Programme (UNEP), International Energy Agency (IEA). 2023 Global Status Report for Building and Construction; UNEP, IEA: Paris, France, 2023. [Google Scholar]
- National Bureau of Statistics. China Statistical Yearbook; China Statistics Press: Beijing, China, 2022; ISBN 978-7-5037-9950-1. [Google Scholar]
- China Association of Building Energy Efficiency, Chongqing University. 2023 Research Report of China Building Energy Consumption and Carbon Emissions. Constr. Archit. 2024, 02, 46–59. [Google Scholar]
- Building Energy Research Center in Tsinghua University. 2021 Annual Report on China Building Energy Efficiency; China Building Industrial Publishing: Beijing, China, 2021; ISBN 978-7-112-26521-3. [Google Scholar]
- IEA EBC. Total Energy Use in Buildings: Analysis and Evaluation Methods; IEA: Paris, France, 2016. [Google Scholar]
- Yoshino, H.; Hong, T.; Nord, N. IEA EBC Annex 53: Total Energy Use in Buildings—Analysis and Evaluation Methods. Energy Build. 2017, 152, 124–136. [Google Scholar] [CrossRef]
- Su, S.; Li, J.; Yuan, J.; Tang, M.; Wang, E.; Ding, Y. How Can Energy Saving Culture of A Company Influence Energy Behaviors and Consumptions in Its Offices? A Simulation and Optimization Model. Build. Eng. 2022, 58, 105011. [Google Scholar] [CrossRef]
- Cui, Y.; Ao, X.; Cao, J.; Zhou, X.; Li, M.; Zhao, C.; Liu, M.; Lin, R. Impact of Climate Change on Energy Consumption of Typical Urban Office Buildings in Northeast China. J. Meteorol. Environ. 2021, 37, 91–99. [Google Scholar]
- Oh, M.; Jang, K.M.; Kim, Y. Empirical Analysis of Building Energy Consumption and Urban Form in A Large City: A Case of Seoul, South Korea. Energy Build. 2021, 245, 111046. [Google Scholar] [CrossRef]
- Jiang, M.; Li, X.; Zheng, S. Analysis of Influencing Factors of Green Building Energy Consumption Based on Apriori Algorithm. Shanghai Energy Conserv. 2022, 6, 699–704. [Google Scholar]
- Mao, S. Research on Energy Efficiency Evaluation of Residential Buildings in Wuhan. Master’s Thesis, Wuhan Polytechnic University, Wuhan, China, 2015. [Google Scholar]
- Lope, L.; Hokoia, S.; Miura, H. Energy Efficiency and Energy Savings in Japanese Residential Buildings—Research Methodology and Surveyed Results. Energy Build. 2006, 37, 698–706. [Google Scholar] [CrossRef]
- Kim, Y.S.; Srebric, J. Impact of Occupancy Rates on the Building Electricity Consumption in Commercial Buildings. Energy Build. 2016, 138, 591–600. [Google Scholar] [CrossRef]
- Jia, Y.; Yan, Z. Research on the Influence of User Behavior on Building Energy Consumption Based on Grey Correlation Analysis. Build. Sci. 2016, 32, 108–113. [Google Scholar]
- Zhang, Y.; Bai, X.; Mills, F.; Pezzey, J. Rethinking the role of occupant behavior in building energy performance: A review. Energy Build. 2018, 172, 279–294. [Google Scholar] [CrossRef]
- Rouleau, J.; Gosselin, L.; Blanchet, P. Robustness of energy consumption and comfort in high-performance residential building with respect to occupant behavior. Energy 2019, 188, 115978. [Google Scholar] [CrossRef]
- Chen, S.; Zhang, G.; Xia, X.; Chen, Y.; Setunge, S.; Shi, L. The impacts of occupant behavior on building energy consumption: A review. Sustain. Energy Technol. Assess. 2021, 45, 101212. [Google Scholar] [CrossRef]
- Dong, Z.; Zhao, K.; Hua, Y.; Xue, Y.; Ge, J. Impact of occupants’ behaviour on energy consumption and corresponding strategies in office buildings. IOP Conf. Ser. Earth Environ. Sci. 2019, 294, 012076. [Google Scholar] [CrossRef]
- Spyropoulos, G.N.; Balaras, C.A. Energy Consumption and The Potential of Energy Savings in Hellenic Office Buildings Used as Bank Branches A Case Study. Energy Build. 2011, 43, 770–778. [Google Scholar] [CrossRef]
- Zhang, C. Research on Energy-Saving Renovation Technology of Existing Office Buildings in Taiyuan City Based on Dest Simulation. Master’s Thesis, Taiyuan University of Technology, Taiyuan, China, 2021. [Google Scholar]
- Li, L.; Chen, Z.; Cao, Y.; Wei, Z.; Qi, Z.; Song, Y. Statistical Analysis of Energy Consumption Characteristics of Large Office Buildings. Constr. Sci. Technol. 2022, Z1, 31–35+39. [Google Scholar]
- Li, C.; Hong, T.; Yan, D. An Insight into Actual Energy Use and Its Drivers in High-Performance Buildings. Appl. Energy 2014, 131, 394–410. [Google Scholar] [CrossRef]
- GB 50176-2016; Code for Terminal Design a Civil Building. Ministry of Housing and Urban-Rural Development of the People’s Republic of China: Beijing, China, 2016.
- Wang, W. Analysis of Energy Consumption Characteristics and Research on Energy Use Optimization of Large General Hospitals. Master’s Thesis, Southeast University, Nanjing, China, 2021. [Google Scholar]
- Zhang, H. Scenario Analysis for Linear Regression and Logistic Regression. Autom. Instrum. 2022, 10, 1–4+8. [Google Scholar]
- Smith, J.; Johnson, A.; Williams, B. Polynomial Regression in Pearson Correlation Analysis: A Comprehensive Review. J. Stat. Anal. 2020, 35, 123–135. [Google Scholar]
- Fisher, R.A. Statistical Methods for Research Workers; Springer: New York, NY, USA, 1992. [Google Scholar]
- Tan, Z.; Liu, Z.; Wang, F.; Huang, L. Analysis of Influencing Factors of Energy Consumption in Hospital Building Wards. Build. Energy Environ. 2021, 40, 82–84. [Google Scholar]
- Fan, J.; Hu, S.; Wu, Y. Analysis of Influencing Factors of Energy Consumption Intensity of Urban Residential Buildings in Hot Summer and Cold Winter Areas. Constr. Sci. Technol. 2021, 15, 23–27. [Google Scholar]
- Pan, Z.; Wang, Y.; Li, Z.; Yang, Y.; Zhang, W. Analysis of Macroscopic Influencing Factors of Building Energy Consumption in China. New Build. Mater. 2020, 47, 13–14+62. [Google Scholar]
- Wang, M.; Chinyama, M.; Jin, L.; Zhang, Z. Analysis of Influencing Factors of Building Energy Consumption of Rural Tube Houses in Northern Zhejiang Province. New Build. Mater. 2022, 49, 85–90+100. [Google Scholar]
- Zhang, J.; Zhang, Y.; Meng, Q.; Li, R. Establishment and Experimental Study of Thermal Balance and Energy Consumption Analysis Model for Prefabricated Industrial Buildings. J. Build. Energy Effic. 2018, 46, 146–152. [Google Scholar]
- Zhang, G.; Zhang, Q.; Wang, F.; Wang, Q.; Liang, R. Study on Influencing Factors of Energy Consumption of Traditional Residential Houses in Kangding Rural Area Based on Designbuilder. Build. Sci. 2019, 35, 108–115. [Google Scholar]
- Chen, J. Research on Energy Audit of Public Buildings Based on Energyplus Rapid Modeling. Master’s Thesis, Shenyang Jianzhu University, Shenyang, China, 2023. [Google Scholar]
Disclaimer/Publisher’s Note: The statements, opinions and data contained in all publications are solely those of the individual author(s) and contributor(s) and not of MDPI and/or the editor(s). MDPI and/or the editor(s) disclaim responsibility for any injury to people or property resulting from any ideas, methods, instructions or products referred to in the content. |
© 2024 by the authors. Licensee MDPI, Basel, Switzerland. This article is an open access article distributed under the terms and conditions of the Creative Commons Attribution (CC BY) license (https://creativecommons.org/licenses/by/4.0/).