Article

How Does Environmental Protection Tax Affect Urban Energy Consumption in China? New Insights from the Intensity Difference-in-Differences Model

School of Business, Xiangtan University, Xiangtan 411105, China
*
Author to whom correspondence should be addressed.
Sustainability 2024, 16(10), 4141; https://doi.org/10.3390/su16104141
Submission received: 1 April 2024 / Revised: 30 April 2024 / Accepted: 12 May 2024 / Published: 15 May 2024
(This article belongs to the Special Issue Energy and Environment: Policy, Economics and Modeling)

Abstract

:
Against the backdrop of accelerating environmental protection and resource conservation, it is of great significance to achieve energy conservation and sustainable growth. In this context, by collecting panel data from 284 cities in China from 2009 to 2021, this paper constructs an intensity difference-in-differences (I-DID) model, using the implementation of China’s environmental protection law in 2018 as an event shock, to explore the impact of environmental protection tax (EPT) on urban energy consumption. The results indicate that EPT significantly reduces urban energy consumption. After several robustness tests, the estimation results shown above still hold. The mechanism test reveals that EPT mainly reduces energy consumption by promoting urban industrial upgrading, economic openness, and technological innovation. In addition, the heterogeneity test shows that EPT has a greater impact on energy consumption in central and western cities, small and medium-sized cities, non-resource-based cities, and non-old industrial bases. Therefore, to fully improve the positive effect of EPT on urban energy consumption, we suggest increasing energy efficiency, promoting the green transformation of energy structures, enhancing the ability to open-up and innovate, and improving a differentiated regional EPT management system.

1. Introduction

A national or regional ability to achieve steady economic growth depends largely on energy supply, and energy security is crucial to national security overall, particularly in developing countries [1]. Since the reform and opening in 1978, China’s economic growth has moved into a stage of rapid expansion. But as the economy grows quickly, China’s energy consumption keeps rising, placing a great deal of strain on the country’s energy supply and exacerbating issues like air and water pollution [2,3]. At the same time, as the country’s population grows and industrialization picks up speed, coupled with its relatively limited domestic energy reserves, national energy security concerns will unavoidably face new challenges. The necessity to strengthen the development of security capacities in critical sectors and guarantee the security of energy and resources was made abundantly evident during the 20th National People’s Congress of China in 2022. Energy consumption at the current stage of development is crucial to economic growth and lays the groundwork for the nation to achieve sustainable development. Thus, it is essential to investigate the subject of energy consumption in China [4]. On the one hand, the rapid growth of the Chinese economy and advancements in living standards are driving up consumer demand for energy. However, excessive energy use results in financial losses and social burdens, in addition to aggravating resource scarcity and environmental contamination. On the other hand, people’s need for clean, efficient energy is growing as urbanization picks up speed. The emergence of highly energy-intensive sectors will also result in significant emissions of pollutants, endangering both the environment and public health and the need to address the problems associated with energy use, raise living and productivity standards, and increase people’s sense of gain, security, and contentment [5]. Furthermore, one of the most significant challenges facing the world today is climate change, and focusing on energy consumption issues is also beneficial for addressing the challenges of global climate change. In summary, China needs to focus more on energy consumption issues, implement effective policies that promote energy transformation and green development, achieve coordinated development between economic development and environmental protection, meet the populace’s needs for a better quality of life, and raise its standing internationally [6,7].
China has implemented several laws and initiatives to curb energy use and to support sustainable development and environmental preservation, including the development of renewable energy sources, energy consumption quotas, and green financing support [8]. Among them, environmental protection tax (EPT) is widely used as an economic means to promote sustainable development. The Environmental Protection Tax Law of the People’s Republic of China, promulgated and implemented in 2018, is the first single-line tax law specifically reflecting “green taxation” since the establishment of the People’s Republic of China (PRC). It marks an important step in promoting the green tax system in China. In theory, EPT can promote the development of renewable energy and reduce the use of fossil fuels by regulating energy production and consumption behavior, thereby alleviating environmental and energy problems [9,10]. First, levying for environmental conservation, like those on carbon emissions, can raise the cost of fossil fuels, make them less competitive, and encourage firms to choose renewable energy instead. Taxing for environmental protection can help lower emissions of pollutants by encouraging firms to use clean manufacturing methods. Second, by encouraging firms to use clean manufacturing technology, environmental protection levies can also lower the emissions of pollutants. The government has the authority to tax the emissions of businesses that produce large amounts of pollution and to offer tax breaks or subsidies to those that take steps to lower their emissions. This will encourage businesses to spend money on equipment and technology for environmental protection, increase production effectiveness, and lessen their negative effects on the environment. Thus, how does EPT affect the amount of urban energy consumption in China? What is the impact mechanism? Does its influence exhibit notable heterogeneity? Investigating these problems is of great importance to encourage the transformation of urban energy consumption structure, the reduction of environmental pollution in urban areas, and the realization of high-quality urban growth [11,12].
This study takes the implementation of the Environmental Protection Tax Law of the People’s Republic of China as an event shock, selects panel data from 284 prefecture-level cities in China from 2009 to 2021, and uses an intensity difference-in-differences (I-DID) model to explore the impact of EPT on urban energy consumption. Compared to previous relevant studies, the main contributions listed in this paper are as follows: Firstly, we gathered three types of urban energy data to calculate the overall amount of urban energy consumption. We then dissected the energy consumption situation and the characteristics of its spatial distribution across different areas. Secondly, this paper uses the I-DID model to comprehensively evaluate the dynamic impact of the implementation of EPT, leading to more trustworthy results. Finally, this study confirms the fact that in order to lower urban energy consumption, EPT can encourage technological innovation, improve industrial upgrading, and increase economic openness.
The rest of the study is organized as follows. The relevant research on energy use and EPT is reviewed in Section 2. In Section 3, the institutional foundation of EPT is further stated, and the impact mechanism of EPT on urban energy consumption is also examined. The I-DID model, variables, and data used for empirical analysis are discussed in Section 4. The analysis of the empirical results is shown in Section 5. Section 6 concludes the study.

2. Literature Review

This study reviews relevant literature on energy consumption and EPT and gives a general overview of the current state of academic research on the subject. These studies mainly cover the influencing factors of energy consumption, the economic and environmental effects of environmental regulations, and the application of difference-in-differences models in various fields. The following is a review of research relevant to the subject.
First off, researching the factors influencing the consumption of energy has long been a focus of the academic community. Academics are also deeply worried about environmental contamination and resource depletion resulting from excessive energy use since economic progress necessitates a steady and sufficient supply of energy. At present, economic growth, industrial structure, technological innovation, and economic openness are the main subjects of research on the factors influencing energy consumption [13,14,15]. In particular, from the perspective of economic growth, economic development speeds up the rate of urbanization and industrialization in developing countries, which is followed by a dramatic rise in the demand for energy. In contrast, developed economies are shifting towards using more renewable energy. For instance, Gozgor et al. [5] discovered that the usage of renewable energy is encouraged by the growing degree of economic globalization after analyzing group data from 30 OECD nations between 1970 and 2015. Zaharia et al. [6] studied the panel data of 28 EU countries from 1995 to 2014 by bibliometrics and found that economic parameters were positively correlated with energy consumption. From the standpoint of industrial structure, established industries’ reliance on energy may be effectively reduced, and resource utilization efficiency can be increased, by fostering the growth of high-tech businesses and establishing new industries. For example, Xu et al. [16] analyzed the data from Shanxi Province in China from 1980 to 2018, using cointegration techniques, and found that relevant characteristics, such as industrial structure, had a favorable impact on energy usage. In order to achieve resource conservation and increase production efficiency, technological innovation promotes the restructuring and agglomeration of the manufacturing sector. It also uses digital technology and artificial intelligence to promote energy structure upgrades and reduce energy consumption. For instance, Murad et al. [17] examined panel data in Denmark from 1970 to 2012 using the autoregressive distributed lag approach and discovered that increased technological innovation can lower Denmark’s energy usage. Chen and Lei [18] showed that by utilizing panel quantile techniques to evaluate data from 30 nations globally between 1980 and 2014, renewable energy may be generated at reduced prices while increasing energy efficiency to fulfill energy demand. However, Acheampong et al. [19] used panel data from the EU between 1995 and 2019 using SYS GMM to find an inverted U-shaped link between technological innovation and energy usage. Through opening to the outside world, cutting-edge energy technology and related information can lessen resource use and negative effects on the environment. For instance, Chen et al. [7] used GMM to estimate the dynamic panel model of 30 provinces in China from 2005 to 2018, and they discovered that trade openness contributed to lower energy usage. On the other hand, Kyophylavong et al. [20] maintain the opposing viewpoint. They examine Thailand’s trade openness and energy consumption using Bayer and Hank cointegration techniques and discover a relationship between the two: trade openness and energy consumption lead to each other.
In recent years, the academic community has performed in-depth research and discussions on the subject since the implementation of various environmental protection measures has had a significant impact on the economy and environmental governance. On the one hand, there are four primary points in the academic community on the economic effects of environmental regulation [21,22,23]. Firstly, scholars generally believe that environmental regulation is closely related to economic growth. Furthermore, the majority of scholars believe that environmental regulation and economic growth exhibit an inverse U-shaped relationship in which environmental regulation first hinders and then promotes economic growth. Secondly, some researchers believe that environmental regulations can optimize and upgrade industrial structures through technological innovation and other means. By using a unique spatial matrix and panel data from 30 provinces in China during 2008–2019, Zhou et al. [24] discovered that there is an inverted U-shaped linkage between economic development and environmental restrictions. However, Abdullah and Morley [11] utilized the standard Granger causality method to analyze panel data from 25 EU countries between 1995 and 2006 and suggested that raising environmental taxes does not seem to have any substantial economic impact. Based on panel data from 283 prefecture-level cities in China between 2003 and 2018, Lin and Xie [25] built a comprehensive evaluation method and discovered that urban environmental protection measures significantly promote industrial structure optimization and transformation. Thirdly, it is expected that green total factor productivity will increase as a result of environmental regulation. Cheng and Kong [12] analyzed Chinese provinces between 2000 and 2019 with a dynamic spatial panel model and found that coordinating multiple policies is more effective in promoting GTFP growth than a single policy. Fourthly, some scholars have also noticed that environmental regulations can have an impact on employment. According to Raff and Earnhart [26], there is a decrease in output and employment in the environmental sector when environmental standards are strictly enforced. On the other hand, environmental regulation’s ability to reduce and regulate pollution and environmental harm is an aspect of the academic community’s study on the effects of environmental governance [27,28]. For instance, Wang et al. [29] used a system GMM model to study 30 provinces in China from 2005 to 2015 and found an inverted U-shaped relationship between environmental regulations and corporate environmental responsibility. Meanwhile, Collins et al. [30] analyzed over 25,000 manufacturing factories in the United States from 1998 to 2012 and found that targeted environmental strategies can reduce toxic emissions without reducing employment. Zhang et al. [31] also found that environmental regulation can encourage companies to practice environmental responsibility through D&O insurance.
In academic research, the difference-in-differences (DID) model is a research method used to evaluate the effects of policy implementation and is widely used in fields such as economics and ecology [32,33,34]. Ashenfelter [35] first applied the DID method to the field of economics. Currently, the approach is being used by economists to deal with such problems as income inequality, industrial structure modernization, employment, and economic growth. For example, by using the DID model, Yang et al. [36] revealed that carbon emission trading policies can improve both employment growth and carbon emission reduction. Sendstad et al. [37] found, based on panel data from EU countries between 2000 and 2017, that a stable policy environment with credible policy commitments is crucial for incentivizing private company investment using the DID model. Ma et al. [38] used the data of Chinese manufacturing listed companies from 2009 to 2018 and found that the accelerated depreciation policy of fixed assets can significantly promote enterprise R&D investment and fixed asset investment and reduce the level of enterprise financialization. In the field of ecology, DID models are often used to study issues such as pollution and carbon emissions. For example, Wu et al. [39] used the DID model to study policy effects based on panel data of 30 provinces in China during 2006–2017 and 196 cities during 2011–2018. The results show that the development of the Internet has significantly improved energy conservation and emission reduction efficiency. Nawaz et al. [40] evaluated the average causal effect of the treatment of determinants of expanding green financing and mitigating climate change in N–11 countries between 2005 and 2019 using the DID method and found that this decision had no significant impact among countries.
To sum up, the literature mentioned above indicates that scholars have studied energy consumption aspects in depth as well as how environmental regulations affect economic and environmental governance. In addition, more and more scholars are using the DID model to evaluate policy effects, providing strong theoretical support for the implementation of various policies. However, based on a large amount of existing research, it is not difficult to find that there are still three aspects that need further improvement, summarized as follows: Firstly, plenty of research has looked into how different factors impact energy consumption; however, there are not many studies on how environmental regulations limit energy consumption, particularly when it comes to the establishment of EPT systems in developing nations like China, which are currently experiencing economic growth. Secondly, the academic community has recognized the important role of environmental regulation, but the discussion on whether environmental regulation can weaken energy consumption is not sufficient, as energy consumption and pollutant emissions are closely related. Thirdly, in academic applications, the DID model has become quite mature and widely used, but this method still lacks research related to energy. Meanwhile, previous research on energy issues mainly used fixed effects models, but these models were unable to fully evaluate the policy effects of EPT on energy consumption. Therefore, this study uses the DID method to compensate for this deficiency.

3. Institutional Background and Research Hypotheses

3.1. Institutional Background

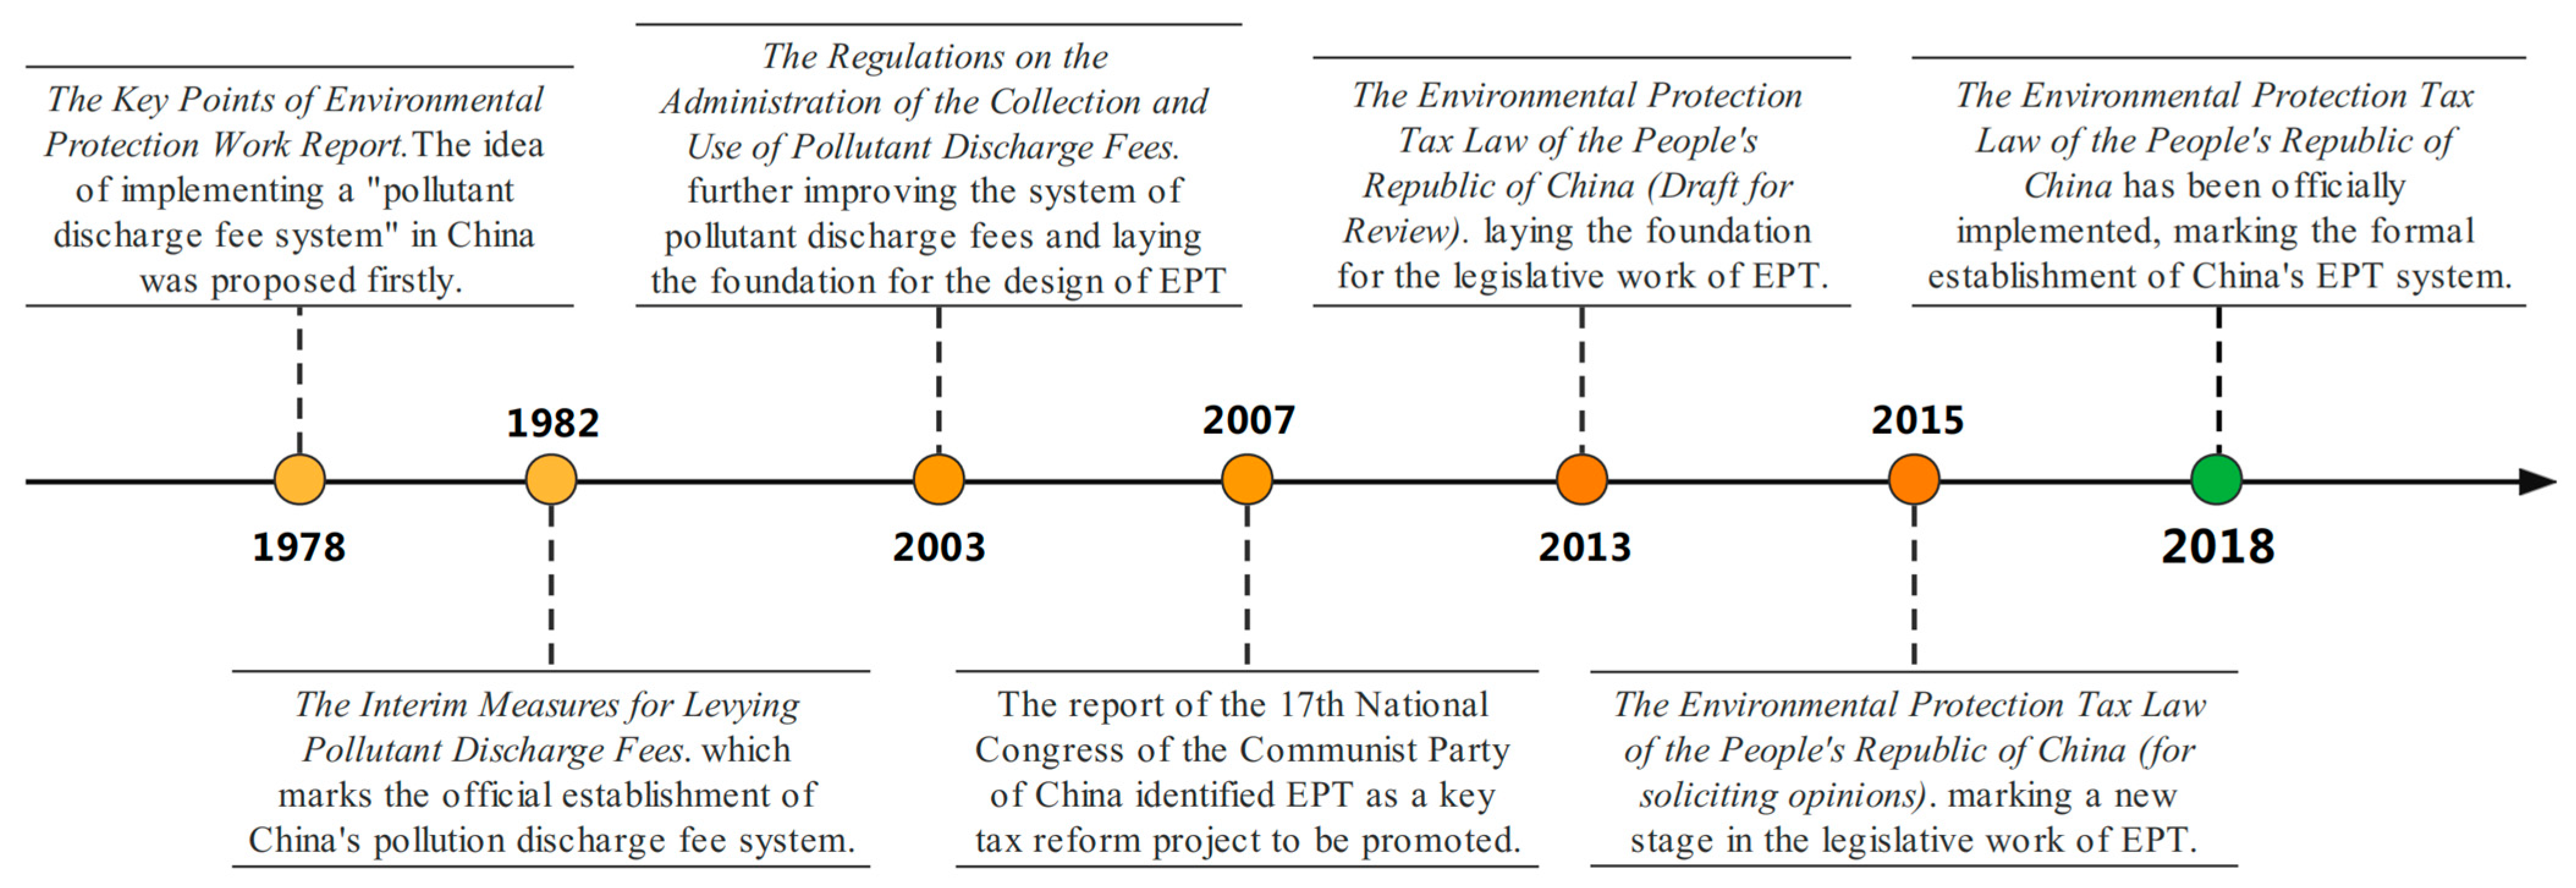
Before the reform and openness, light and heavy chemical industries dominated China’s industrial structure, which led to several environmental pollution issues. In 1978, the Chinese government originally suggested a pollution charge system, anticipating it would safeguard the environment and promote sustainable socioeconomic development. In 1982, the State Council issued the Interim Measures for Levying Pollutant Discharge Fees, which made unified provisions on the purpose of implementing pollution discharge fees and the collection, management, and use of pollution discharge fees, marking the official establishment of China’s pollution discharge fee system. The Regulations on the Administration of Collection and Use of Pollutant Discharge Fees published by the State Council in 2003 signaled an important turning point in the evolution of pollution fees from experimental use to official charging. Despite the reality that pollution fees have reduced pollutant emissions to some extent, issues with the actual implementation process, such as inadequate collection, poor fund management, and incomplete collecting scope, have emerged because of the lack of support from the legal system. This not only compromises the efficacy of environmental laws in practice, but it also impedes the advancement of technology for environmental protection. On the other hand, other hitherto unidentified sources of pollution have started to surface as China’s social economy continues to grow and expand, putting more pressure on us to safeguard the environment. The report of the 17th National Congress of the Communist Party of China proposed in 2007 to implement a financial and tax system that is conducive to scientific development, establish and improve mechanisms for paid use of resources and ecological compensation, and identify environmental protection tax as a key tax reform project to be promoted. It’s to solve the many difficulties encountered in implementing pollution discharge fees and introduce policies that are more in line with China’s national conditions.
In the second decade of the 21st century, the reform and development of China’s environmental protection tax have entered an accelerated period. In 2013, the Ministry of Finance, the State Administration of Taxation, and the Ministry of Environmental Protection jointly reported the Environmental Protection Tax Law of the People’s Republic of China (draft for examination) to the State Council, laying the foundation for the legislative work on the environmental protection tax. In June 2015, the draft of the Environmental Protection Tax Law of the People’s Republic of China (for soliciting opinions) was publicly solicited from the public, marking a new stage in the legislative work on the EPT. The Environmental Protection Tax Law was redrafted in early 2016 following several rounds of public comment and suggestion rounds, and it was accepted by the Standing Committee of the National People’s Congress. The People’s Republic of China formally enacted the Environmental Protection Tax Implementation Regulations at the end of 2017, which said that the tax will replace pollution discharge levies that had been in place for almost 40 years and be implemented countrywide on 1 January 2018. Compared with pollution fees, the collection of EPT is more diverse and covers the protection and management of natural resources such as air, water, and soil, as well as the management of environmental pollutants such as solid waste and noise. Secondly, the tax basis for EPT is more scientific and reasonable. Through measuring and monitoring, the real quantity of taxable pollutants that taxpayers generate determines their pollution emissions. Once more, the EPT is legally traceable, and taxpayers must accept oversight and inspection as well as disclose and pay to the tax authorities in compliance with laws. This guarantees that environmental protection efforts are effectively implemented and reinforces the oversight of such efforts. Furthermore, the environmental tax has also introduced some new tax incentives, such as providing tax reduction and exemption benefits to eligible clean energy projects. Overall, the introduction of the EPT has become China’s first main type of green tax system, marking an important step forward in promoting green development. Simultaneously, it indicates how important it is and how consistently the Chinese government has adhered to the goal of fusing the development of an ecological civilization with the advancement of the economy and society (as shown in Figure 1).

3.2. Research Hypothesis

EPT is a type of tax levied on environmental pollution and ecological damage, aimed at raising awareness of environmental protection among enterprises and individuals and reducing environmental pollution and resource waste. Hence, the implementation of the EPT inevitably involves issues related to energy consumption. On the one hand, enterprises will be encouraged to focus more on energy conservation, emission reduction, and environmental protection as a result of the collection of EPT. They will also be encouraged to optimize industrial processes to increase resource utilization efficiency and lower emissions of pollutants. On the other hand, high energy consumption also plays an important role in environmental pollution. Thus, tax measures are used to regulate energy consumption behavior, guide people to choose clean and low-carbon energy forms, and thus achieve the goal of reducing environmental pollution. For example, high-energy-consuming enterprises or individuals will bear higher tax burdens, prompting them to adopt renewable energy or low-carbon products to meet production and living needs, thereby promoting the development of the entire society’s energy structure in a cleaner direction. In brief, the collection of EPT is closely related to energy consumption and is also complementary. Specifically, EPT collection encourages individuals and businesses to adopt more environmentally friendly production and lifestyle choices while also directing energy consumption in a more sustainable direction and ultimately contributing to the goal of sustainable development. Consequently, we put up the following theory:
Hypothesis 1 (H1).
Environmental protection tax policy can reduce urban energy consumption.
The first mechanism is the industrial upgrading effect. To be specific, the influence of environmental protection fees on industry upgrading is primarily examined in this study from two angles: government administration and technology research and development. From the standpoint of technological R&D, the introduction of an EPT drives up the cost of environmental pollution expenses, compelling businesses to upgrade their production equipment, introduce more sophisticated process technologies, or innovate their R&D efforts to achieve cleaner and more efficient production methods. In addition to requiring a significant financial outlay, research and development innovation also needs to draw in top-tier talent and technology, facilitate the shift in the industrial structure from one that is labor-intensive to one that is technology-intensive, and ultimately produce sophisticated and highly integrated production methods. From the perspective of government collection and administration, the scope of EPT is broader, and the tax rate is generally higher than the pollution fee. EPT is subject to stricter collection and administration procedures than pollution discharge fees. In terms of environmental protection fees, enterprises only need to pay according to the prescribed time, and tax authorities cannot effectively supervise and control them. In the case of EPT, taxpayers are required to furnish pertinent environmental proof materials to support their tax declaration, and tax authorities can conduct traceability checks on them. Additionally, to promptly identify and address unlawful and irregular actions, the EPT has built a more thorough reporting structure and encouraged public participation in environmental oversight. Therefore, the environmental protection tax system has strengthened tax management measures, and high standards of supervision have forced enterprises to reduce non-competitive products and services, thereby promoting industrial optimization and reform processes. Undoubtedly, industrial upgrading may accomplish sustainable development objectives and lower energy consumption by utilizing cutting-edge technology, refining the industrial structure, and creating appropriate policies. Therefore, this study presents the following research hypothesis:
Hypothesis 2 (H2).
Environmental protection tax policies can reduce urban energy consumption by enhancing industrial upgrading.
The second mechanism is the effect of economic openness. Specifically, by incentivizing businesses to adopt greener and more efficient technology and manufacturing methods, EPT fosters technological advancement and development. Concurrently, the collection of EPT will increase tax income allocated to environmental protection and related activities, and the growth of the environmental protection sector will stimulate the expansion of associated sectors, stimulating economic growth. These will assist in drawing in extra opportunities for global technological collaboration and investment. Environmental protection cooperation and exchanges between China and other nations will also be facilitated by the introduction of environmental protection fees. The government may enhance its technical prowess and environmental protection management capabilities by introducing world-standard environmental protection norms and technology. This would gradually broaden the country’s scope of influence on an international level. The development and environment for foreign investment in China will also be enhanced by the implementation of an EPT. Businesses may attain greater development prospects and draw in more foreign investors to invest and expand in China while still carrying out their environmental obligations. Cities may also acquire cutting-edge energy-saving and emission-reduction experiences and technologies through collaboration and technical exchange with overseas businesses, then implement them into local industries. This lowers energy consumption even further by enhancing the management quality and energy usage efficiency of businesses. Consequently, the next research hypothesis presented in this study is as follows:
Hypothesis 3 (H3).
The environmental protection tax policy reduces urban energy consumption by promoting economic openness.
The third mechanism is the technological innovation effect. According to existing studies, EPT can improve the level of urban technological innovation in two aspects. Businesses will have to pay more to produce products as a result of environmental protection charges. Therefore, many businesses will take various steps to reduce environmental pollution, such as updating or improving production processes and equipment and developing green and environmentally friendly products, in order to avoid the cost pressure brought on by increased tax payments and to enhance their competitive advantage. All of these technologies cannot be applied without technological innovation, thus forming an “innovation compensation effect” [41]. On the other hand, the government will devote more funds to building environmental protection infrastructure and technologies as a consequence of the implementation of environmental protection levies, providing better environmental governance services and support. This will provide the necessary financial support and policy guarantees for urban scientific and technological innovation, promoting the transformation and promotion of urban scientific and technological achievements. Government funding for environmental protection technology research, for instance, can draw additional academic institutions and businesses to the sector, fostering the growth and advancement of urban scientific and technical innovation. As is well known, developing new technologies or products and adopting more efficient and energy-saving manufacturing methods can reduce the demand for traditional energy while improving product performance and competitiveness. This helps to achieve sustainable development goals and reduce energy consumption (as shown in Figure 2). Given this, the study hypothesis that follows is suggested in this study to be confirmed.
Hypothesis 4 (H4).
Environmental protection tax policy reduces urban energy consumption by supporting technological innovation.

4. Methodology, Variables, and Data

4.1. The Benchmark Model for Evaluating Policy Effects

The Difference-in-Differences (DID) model, which can effectively identify the impact of policy adjustments by dividing the samples under policy shocks into experimental and control groups, has received widespread attention from the academic community [42,43]. The main purpose of this paper is to examine how China’s 2018 EPT implementation affected urban energy consumption. Given that this policy has been enacted simultaneously across the country since 2018, regression bias may occur when using traditional DID models. This study constructs a policy dummy variable based on the median of 2018 air pollution tax collection standards in each city [44]. Cities higher than this standard are used as the experimental group, while other cities are used as the control group. To investigate whether EPT affects urban energy consumption, an intensity difference-in-differences (I-DID) model is constructed. The model structure is as follows:
Energyit = α + β·Tax_didit + γ·Controlit + μt + λi + εit
where the city and year are denoted by the subscripts i and t, respectively. The dependent variable Energyit reflects urban energy consumption, which is measured by the ratio of each city’s energy consumption to its GDP. The core explanatory variable Tax_didit represents the environmental protection tax (EPT) policy, which is the interaction term between the policy dummy variable and the time dummy variable. Controlit represents the control variables at the urban level (Control), including urban economic development (PGDP), industrialization (Indus), fiscal expenditure (Fiscal), financial development (Credit), population density (Popul), and urbanization rate (Urban). α, β, and γ are estimated parameters, where β measures the impact of EPT on urban energy consumption; if β < 0 indicates that EPT can reduce urban energy consumption, on the contrary, it will promote urban energy consumption. In addition, the year-fixed effect (Year FE) is represented by μt, the city-fixed effect (City FE) by λi, and the random error term is reflected by εit.

4.2. Variable Selection and Description

(1) Explained variable: urban energy consumption (Energy). Cities are important carriers of economic activity space aggregation, and energy consumption is also reflected at the urban level. Therefore, urban energy consumption has always been a focus of academic attention [17,45]. This study utilizes an indirect measuring approach to calculate energy consumption for each city, given that the Chinese government has not published the relevant total energy consumption figures. Specifically, we use the China Urban Statistical Yearbook to collect all available data on urban natural gas (NG), urban liquefied petroleum gas (LPG), and urban social electricity consumption (ELEC) before calculating urban energy consumption. Then, we convert the three types of energy into energy consumption measured by standard coal according to the natural gas conversion standard coal coefficient, liquefied petroleum gas conversion standard coal coefficient, and electricity conversion standard coal coefficient issued by the Ministry of Industry and Information Technology of the People’s Republic of China. Finally, the total energy consumption of each city is obtained by adding up the three converted energy consumption amounts (as shown in Figure 3). The formula can be expressed as follows:
Energyit = φ·NGit + χ·LPGit + ψ·ELECit
where NGit, LPGit, and ELECit, respectively reflect the total natural gas supply, total liquefied petroleum gas supply, and total social electricity consumption of each city over the years. The symbols φ, χ, and ψ, respectively represent the conversion coefficients of natural gas to standard coal, liquefied petroleum gas to standard coal, and electricity to standard coal. For simplicity, this study selects the ratio of the total energy consumption of each city over the years to the gross domestic product of the urban area as the dependent variable to reflect the energy consumption intensity of each city.
(2) Core explanatory variable: Environmental Protection Tax Policy (Tax_did). How to construct the interaction term between policy dummy variables and time dummy variables is the key to assessing the effectiveness of policy changes in DID models. This paper takes the full implementation of the Environmental Protection Tax Law of the People’s Republic of China in 2018 as the policy background. It needs to be pointed out that EPT is implemented simultaneously in all regions of the Chinese Mainland, without exception in one city. In this context, the traditional DID model makes it difficult to distinguish between the experimental group and the control group in the sample cities, so it is unable to effectively identify the implementation effect of the policy. Based on this, following Chen [46], this study uses the I-DID model to evaluate the impact of EPT implementation on urban energy consumption. Regarding the setting of policy dummy variables for each city, based on the median of the 2018 national air pollution tax collection standard for each city, if the air pollution tax rate of a city is higher than the median of the national tax collection standard, the city will be used as the experimental group, and its policy dummy variable value will be set to 1. Otherwise, it will be used as the control group, and its policy dummy variable value will be set to 0 (as shown in Figure 4). Regarding the setting of time dummy variables for each city, with 2018 as the dividing line, the values for 2018 and subsequent years are set to 1, and vice versa, they are all set to 0. Then, to obtain the key explanatory variable for this study, the policy dummy variables are multiplied by the time dummy variable for each city.
In addition, all cities imposed pollutant discharge taxes prior to the enactment of the environmental protection tax policy. Following the extensive implementation of the environmental protection tax policy, some cities have increased their criteria, while others have kept them at the original pollutant discharge fee levels. Considering the reality of “tax burden shifting”, this study reconstructed the policy dummy variables of each city for robustness testing. The specific approach is to use the city as an experimental group and set the value of its policy dummy variable to 1 if the air pollution tax rate of a certain city increases after the implementation of the Environmental Protection Tax. Otherwise, it is placed in the control group, and its policy dummy variable value is set to 0 [47]. On this basis, the policy dummy variables of each city are multiplied by the time dummy variables to obtain the core explanatory variable of the I-DID model under the shift in tax burden.
(3) Control variables. To eliminate regression bias caused by omitted variables, we also introduce a series of urban-level control variables (Control) in the model, including the level of economic development (PGDP), degree of industrialization (Indus), fiscal expenditure (Fiscal), financial development (Finance), population density (Popul), and urbanization rate (Urban). Specifically, the per capita GDP of each city is used to measure the extent of economic growth (PGDP), which indicates that the more developed a city is economically, the more environmentally conscious its citizens are, which will reduce the amount of energy used in cities. The degree of industrialization (Indus) is measured by the ratio of the added value of the secondary industry in each city to the city’s GDP, indicating that the higher the degree of industrialization, the more it can reduce dependence on energy by improving resource allocation efficiency and promoting green technology progress. Fiscal expenditure (Fiscal) is reflected by a city’s total fiscal expenditure divided by its GDP. Financial development (Finance) is measured by the ratio of the year-end loan balance of financial institutions in each city to the city’s GDP. Population density (Popul) is measured by the number of people per square kilometer. The urban population is relatively concentrated, which helps promote resource-intensive utilization and research and development cooperation, thereby reducing urban energy consumption. The urbanization rate (Urban) is denoted by the ratio of each city’s urban population to its total population.

4.3. Data Sources and Description

According to data released by the Ministry of Civil Affairs of the PRC in 2022, there are 333 prefecture-level administrative regions, including 293 cities at or above the prefecture level. Considering the availability of data, this paper selects 284 prefecture-level cities in Mainland China from 2009 to 2021 as research objects. The data are collected from the China Urban Statistical Yearbook, China Statistical Yearbook, China Urban Construction Statistical Yearbook, China Population and Employment Statistical Yearbook, and China Economic Network database and EPS database. Among them, the data on the air pollution tax collection standards for each city comes from the official website of the national tax bureau. To maintain the integrity of the data, this study uses linear interpolation to fill in the missing data for some variables. Meanwhile, to eliminate the influence of price change, the consumer price index of each province in 2009 is used to deflate the value variables in the model. Furthermore, all of the absolute variables reported in this paper are logarithmized to lessen heteroscedasticity.

5. Empirical Analysis

5.1. The Evolution Trends and Regional Differences in Urban Energy Consumption in China

In order to intuitively reflect the changes in energy consumption in Chinese cities, this study refers to the approach of Li et al. [48] and draws a trend chart of urban energy consumption and a Dagum Gini coefficient evolution chart based on the per capita energy consumption of each city (as shown in Figure 5). From the overall trend of changes, with the rapid growth of the Chinese economy, urban energy consumption is generally on the rise. From the perspective of the intra-group gap, compared with the national level, the Gini coefficient of energy consumption in eastern, central, and western cities shows a downward trajectory, indicating a narrowing trend in the intra-group gap of urban energy consumption. From the perspective of inter-group gaps, the greatest geographical divide is seen between the central and western areas, regional disparities between the eastern and western areas are less than those between the central and western regions. The Gini coefficient between each group shows a downward trajectory, indicating that although the inter-group gap in urban energy consumption is large, it also shows a narrowing trend.
To further characterize the geographical imbalance of urban energy consumption, referring to the research of Chen et al. [49], this study draws energy consumption kernel density distribution maps based on per capita energy consumption in each city, revealing the dynamic evolution of absolute differences in urban energy consumption. The results are shown in Figure 6. From the position of the curve, the national nuclear density curve has been shifting to the left year by year from 2009 to 2021, while cities in the eastern, central, and western regions have not exhibited a clear trend of leftward shift, indicating an overall downward trend in urban energy consumption. From the distribution pattern, the main peak value of the national and three regional nuclear density curves has decreased from 2009 to 2021, and the width of the main peak has widened, indicating that the energy consumption differences between cities are gradually increasing. From the perspective of the extensibility of distribution, the right-tailed phenomenon is more severe in the whole country, as well as in the eastern and western regions, indicating a significant gap in energy consumption. From the perspective of the polarization trend, the “multi-peak” feature in the national and western nuclear density estimation maps is not obvious, indicating that the “multi-polarization” phenomenon of energy consumption in cities across the country and western regions is not prominent. However, there is a “multi-peak” phenomenon in the eastern and central regions, indicating that there is a “multi-polarization” phenomenon in the energy consumption level of cities in the eastern and central regions.

5.2. Baseline Regression Results Analysis

In order to evaluate the impact of EPT on urban energy consumption in China, this study conducts empirical analysis based on model (1) and gradually introduces control variables. Table 1 displays the outcomes of the benchmark regression.
Firstly, from the regression results of the environmental protection tax policy (Tax_did), with the gradual introduction of control variables, the coefficients of EPT on urban energy consumption are notably negative, showing that the implementation of EPT greatly decreases urban energy consumption. Specifically, using column (5) as a demonstration, the estimated coefficient of EPT is −0.019, and passing the 1% significance level test indicates that urban energy consumption will drop by 0.019 percentage points for each percentage point rise in the environmental protection tax rate. It means that EPT can significantly lower the amount of energy used in cities. This offers a preliminary validation of Hypothesis 1 (H1) stated in this paper.
Next, further analyze the impact of control variables on urban energy consumption. The per capita GDP (PGDP) calculated coefficient in Table 1 is negative, suggesting that rising per capita GDP could lead to advances in technology and managerial practices and enhance the efficiency of energy consumption, thus eventually resulting in lower energy use. The coefficient of the secondary level of urban industrial development is negative but not significant. The higher the degree of industrialization, the less dependence on energy can be reduced by improving productivity, technological progress, and efficiency. However, the effect is not significant. Therefore, there is still a long way to go in reducing energy consumption and achieving sustainable development. The coefficient of fiscal expenditure (Fiscal) is significantly positive, which may be due to the increase in fiscal expenditure increasing energy consumption, as the government needs to use a large amount of energy resources to support its operation and development in investment and construction. In column 5 of Table 1, the coefficient of urbanization rate (Urban) is significantly positive, indicating that as the degree of urbanization increases, energy consumption will also increase accordingly. This is because in the process of urbanization, people’s living standards have improved, and the requirements for quality of life are also constantly increasing. At the same time, to meet the growing energy demand, more energy supply is needed.
In summary, the above results indicate that EPT can significantly reduce urban energy consumption, indicating that EPT has a positive policy effect on suppressing energy consumption. At the same time, factors such as urban economic development, industrial development level, loan balance of financial institutions, and population agglomeration can also reduce energy consumption to a certain extent.

5.3. Parallel Trend Test and Placebo Test

To accurately evaluate the impact of EPT shocks and ensure the reliability of the estimation results stated above, this study further conducted analysis by using such methods as parallel trend tests and placebo tests. The results are shown in Figure 7 and Figure 8.
Firstly, to eliminate the influence of other potential factors and more accurately evaluate the economic effects of intervention measures, this paper conducts parallel trend testing to ensure that the experimental group and the control group have similar trends before policy implementation. Thus, this paper takes 2017 as the base period and selects sample data from the six periods before EPT implementation, the current period of EPT implementation, and the three periods after EPT implementation for regression to further examine whether there is consistency in the trend of changes between the experimental group and the control group before and after EPT implementation. In this process, we adopt two methods to divide the sample into the treated group and the control group (as shown in Figure 4). One is based on the median of the air pollution tax collection standard, and the other is based on whether to implement “tax burden shifting” as the classification basis. For these two classification methods, parallel trend tests were conducted in this paper, and the results are shown in Figure 7.
From the parallel trend test results in Figure 7a, there is no significant difference between the experimental group and the control group divided by the median before policy implementation, and their changing trends are consistent. This indicates that there is no difference in urban energy consumption between the experimental group cities and the control group cities before the implementation of EPT, proving that the I-DID model in this paper satisfies parallel trend testing. Further analysis shows that the estimated values of the experimental group and the control group have been consistently negative and significant since the implementation of the policy in 2018. After the implementation of the EPT, the energy consumption of the experimental group cities has significantly decreased compared to the control group, indicating that the policy implementation can effectively suppress urban energy consumption. In addition, as shown in the parallel trend test results in Figure 7b, the experimental group and control group classified based on “tax burden shift” in this study obtained consistent results. This indicates that both classification methods meet the prerequisite settings of the DID model, improving the efficacy and dependability of the study findings even further.
To eliminate the potential impact of random unobservable factors on the empirical results of this study, this study further refers to the experience of Nawaz [40]. This study takes energy consumption per unit GDP (Enery_GDP) and per capita energy consumption (Enery_Pop) as the dependent variables, respectively, and simulates regression through 1000 randomly generated pseudo-experimental groups, recording their estimation coefficients and significance levels. Based on the p-values and regression coefficients generated by virtual regression, this paper presents a Placebo test chart consisting of a kernel density distribution and a p-value scatter plot, as shown in Figure 8. Among them, the estimation coefficients of virtual regression are concentrated around 0 values and follow a normal distribution, and most regression results are insignificant. In addition, the estimated coefficients (true effect) in the benchmark regression are all located at the high-tailed position of the virtual regression coefficient distribution, which belongs to a low probability event in the placebo test. Based on this, it can be ruled out that unobservable factors caused the benchmark estimation results in this study.

5.4. Robustness Analysis

To further ensure the credibility and validity of the benchmark regression results mentioned above, this study uses six methods to conduct robustness tests on the benchmark regression results mentioned above, as follows:
Firstly, replace the dependent variable. Considering the potential confounding factors in the model that may interfere with or affect the dependent variable, to ensure the accuracy and stability of the research conclusions, this study reflects the intensity of urban energy consumption utilizing total energy consumption (Energy). The regression results are shown in column 1 of Table 2. After replacing the dependent variable, the core explanatory variable passes the robustness test with a negative coefficient that is significant at the 1% level.
Secondly, eliminate the influence of some special samples. The research sample for this study includes municipalities directly under the central government, deputy ministerial-level cities, and provincial capital cities. These cities have higher administrative levels, richer market resources, and more complete social systems. Due to the particularity of these cities, they may have differences in energy supply and usage methods. Therefore, this study tests the robustness of the benchmark regression results by excluding municipalities directly under the central government, deputy ministerial-level cities, and provincial capital cities. The results are shown in column 2 of Table 2. Regression findings show that the predicted coefficient of EPT remains significantly negative at the 1% level, confirming the robustness of the study’s benchmark regression results.
Thirdly, adjust the explanatory variables’ identification method. In the process of replacing environmental protection fees with taxes, it is necessary to appropriately shift the tax burden of EPT to ensure the fairness and sustainability of the environmental protection tax system. Beijing, Hainan, and Guangdong are among the twelve provinces and cities that have increased their tax standards; the other eighteen provinces and cities have kept their tax rates the same (the pilot distribution is shown in Figure 4). This paper sets the reference city as the experimental group with a value of 1 and the other cities as the control group with a value of 0 by changing the recognition method. After multiplying with the policy time point to generate a new interaction term, regression is performed, as shown in column 3 of Table 2, and the results are consistent with the conclusions of the benchmark regression.
Fourthly, adjust the time range. Considering the serious impact of COVID-19 on China’s economy, this study is based on the research of Cortes et al. [50], excluding the years 2020 and 2021 during the outbreak of COVID-19 in China and conducting regression analysis on the remaining sample periods. Column (4) of Table 2 displays the robustness test results, which show that after removing the effect of COVID-19, the coefficient of the core explanatory variable is still significantly negative, indicating that EPT can substantially reduce urban energy consumption, which passes the robustness test.
Fifthly, adjust the estimation method. Cities with high levels of economic development and industrialization may selectively implement higher EPT collection standards, which may lead to the experimental group in this paper not meeting random selection. Therefore, considering that the benchmark regression results may still face estimation bias caused by bidirectional causality and sample self-selection, this study uses the PSM-DID model to estimate policy effects. Specifically, we use the radius caliper matching approach (with a caliper value of 0.01) for matching after first using the control variables in the model (1) as matching variables. Finally, the matched samples were analyzed using the DID method. The results are shown in column 5 of Table 2. The impact of EPT on urban energy consumption is significantly negative, further demonstrating the robustness of the benchmark regression results.
Finally, the instrumental variable (IV) method is used. In order to further reduce the estimation bias caused by potential endogeneity issues in the study, this paper adopts the IV method to identify the causal relationship between environmental protection tax and urban energy consumption. Specifically, this paper selects the air circulation coefficient of each prefecture-level city as the instrumental variable [51]. The smaller the value of this indicator, the higher the pollution concentration detected in the air, and the government may establish higher environmental protection tax collection standards. Therefore, the air circulation coefficient is negatively correlated with EPT. Meanwhile, urban energy consumption involves multiple complex factors, including the impact of energy demand, energy supply, and energy utilization efficiency. The air circulation coefficient is not directly related to these factors, so it does not directly participate in the process of driving these energy consumption factors. Therefore, as shown in column 6 of Table 2, the Tax_did coefficient is still significantly −0.093 after using IV, which is consistent with the benchmark regression results.

5.5. Policy Uniqueness Test

To better manage urban environmental pollution and advance urban sustainable development, the Chinese government has implemented several green innovation and urban environmental protection regulations in recent years. For example, in 2008, an innovative city pilot policy was implemented, and in 2013, the “Broadband China” strategy was implemented. The national smart city pilot policy implemented in 2012, the low-carbon city pilot policy implemented in 2010, and the national big data comprehensive pilot zone policy implemented in 2016 may also have an impact on urban energy consumption. Based on this, to eliminate the interference of these policies on the regression results, this study introduces these policy variables into the model and further examines the impact of EPT on urban energy consumption through policy uniqueness testing. The results of policy uniqueness tests are listed in Table 3.
From the results listed above, by introducing the five different types of urban development policies, it can be found that EPT still has a significant inhibitory effect on urban energy consumption. To be precise, in column 1 of Table 3, it can be seen that after introducing the interaction term of Innovative City Pilot Policy (Innocity_did), the EPT’s impact coefficient on urban energy consumption is −0.019, passing the 1% significance level test. Table 3′s column 2 shows that after the introduction of the “Broadband China” strategic interaction term (BdChina_did), the coefficient of impact of environmental protection tax on energy consumption is significantly −0.018. Similarly, as shown in columns 3-5 of Table 3, after introducing the interaction terms of Smart City (Smrcity_did), Low Carbon City Pilot Project (LowCo2_did), and National Big Data Comprehensive Pilot Zone Policy (Data_did), it is also concluded that EPT has a significant negative impact on energy consumption. Finally, by simultaneously introducing the five policies mentioned above into the model for regression analysis, it was found that the impact coefficient of EPT on urban energy consumption is −0.020, which still passes the significance level test of 1%. Therefore, after excluding the impact of the five relevant policies mentioned above, EPT can still significantly reduce urban energy consumption, further demonstrating the robustness and reliability of the benchmark regression results.

5.6. Heterogeneity Analysis

The aforementioned study findings confirm that EPT can significantly reduce urban energy consumption. However, China has a vast territory, and there are significant differences among different cities in terms of geographical location, population size, resource endowment, and industrialization level. These heterogeneous characteristics will lead to differences in the implementation effect of EPT, and the impact of improving urban sustainable development capacity, high-quality urban development processes, and urban energy consumption will also vary. Therefore, this study classifies the entire sample from four aspects: geographical location, population size, resource endowment, and industrialization level, in order to further explore the heterogeneous impact of EPT on urban energy consumption. The results of heterogeneity testing are shown in Table 4.
Firstly, this study divides cities into eastern and central western cities based on China’s geographical region, and the regression results are shown in columns 1 and 2 of Table 4. From the regression results, the environmental protection tax policy can significantly reduce energy consumption in central and western cities, but its impact on energy consumption in eastern cities is not significant. This phenomenon may have its roots in the energy structures of western and central cities, which mostly consist of coal. Coal, as one of the traditional energy sources, can cause significant pollution during its use. Therefore, the implementation of the EPT may encourage enterprises and individuals to shift more towards cleaner energy forms, thereby reducing dependence on coal and reducing energy consumption. The energy structure in the eastern region is relatively diversified, and energy consumption is relatively stable, so the impact of environmental tax policies on its energy consumption may be relatively small.
Secondly, depending on population size, this study separates cities into small and medium-sized as well as large cities. Large cities have populations of more than a million, while small and medium-sized cities have populations of less than a million. The regression results are shown in columns 3 and 4 of Table 4. From the regression results, EPT can significantly suppress energy consumption in both large and small cities, but the inhibitory effect is relatively better in small and medium-sized cities. This may be because energy consumption in small and medium-sized towns is often more dispersed, unlike in large cities, where it is concentrated in a few high-energy-consuming industries. In addition, due to the lower level of economic development and fewer enterprises in small and medium-sized cities compared to large cities, environmental pressure is relatively low.
Thirdly, based on the natural resource endowment of cities, this study divided the entire sample into resource-based cities and non-resource-based cities. The regression results are shown in columns 5 to 6 of Table 4. From the regression results, EPT significantly reduces the energy consumption of non-resource-based cities, but its impact on the energy consumption of resource-based cities is not significant. This may be because non-resource-based cities are usually dominated by light industries such as services and manufacturing, and their energy dependence is relatively low, so the impact of EPT on them is more obvious. However, resource-based cities mainly rely on heavy industries such as mining and metallurgy, which require a large amount of energy to support production. Moreover, most enterprises in resource-based cities are still in the traditional high-energy consumption production mode, lacking effective energy-saving measures and the application of technology. Therefore, even if EPT is levied, these enterprises find it difficult to have significant emission reduction effects in the short term.
Finally, based on the differences in urban industrialization levels, this study divides all cities into old industrial-base cities and non-old industrial-base cities. The regression results are shown in columns 7–8 of Table 4. From the test results, the impact of EPT on non-old industrial bases is significantly negative, but the impact on old industrial bases is not significant. The reason behind this is that enterprises in non-old industrial bases are often newly established enterprises, and levying EPT may increase the costs of enterprises, thereby increasing their production costs and operational difficulties. Therefore, environmental taxes may have a more significant impact on some emerging industries and regions. For the existing old industrial bases, due to the relatively stable industrial structure in these areas, the impact of environmental taxes on them is not apparent.

5.7. Transmission Mechanism Analysis

According to the above regression results, EPT may result in a decrease in urban energy consumption. But how does the EPT affect the amount of energy used in cities? This study explores the influence mechanism of EPT on urban energy consumption in greater detail to give a more thorough response to this subject. To be specific, EPT primarily affects urban energy consumption through the three channels mentioned above, such as enhancing industrial structure, raising the level of openness, and encouraging technical innovation. Therefore, this study selected the proportion of the output value of the secondary and tertiary industries to GDP in each city as the proxy variable for industrial upgrading [52], the actual total amount of foreign investment used in each city in the current year as the measure of economic openness [53], and the proportion of science and technology expenditure to fiscal expenditure in each city as the measure of technological innovation [54]. The impact models of the environmental protection tax policy interaction term (Tax_did) on industrial upgrading, economic openness level, and technological innovation were constructed, respectively, and the results are shown in columns 1, 3, and 5 of Table 5. In addition, to further verify the robustness of industrial upgrading effects, economic openness effects, and technological innovation effects, this paper divides the environmental protection tax policy interaction term (Tax_did) into high and low subsamples based on the 75% percentile and above and 25% percentile and below of each mechanism variable and tests the impact of high and low group EPT on urban energy consumption. The results are shown in columns 2, 4, and 6 of Table 5.
Firstly, from the perspective of industrial upgrading effects, the estimated coefficient of EPT on industrial upgrading is positive at a significance level of 10%, as shown in column 1 of Table 5. This indicates that EPT can significantly promote industrial upgrading, thus verifying Hypothesis 2 (H2). Furthermore, the regression results of EPT on urban energy consumption are shown in column 2 of Table 5, after dividing the high and low groups based on the 75% and 25% percentiles of industrial upgrading indicators. In the high-level industrial upgrading group, the impact coefficient (Tax_did × high) of EPT on urban energy consumption is significantly negative at the 1% level, while in the low-level industrial upgrading group, the impact coefficient (Tax_did × low) of EPT on urban energy consumption is positive. This may be since cities with high industrial upgrading usually have more developed technological innovation capabilities and financial support. Enterprises can leverage these advantages to develop and apply more advanced energy-saving technologies and equipment, reducing energy consumption from the source. Cities with lower levels of industrial upgrading often rely mainly on traditional industries, and due to technological and financial limitations, these industries may not be able to quickly achieve technological upgrading and transformation, thus continuing to maintain their original high-energy consumption production methods.
Secondly, from the perspective of the economic openness effect, the estimated coefficient of EPT on economic openness is significantly positive, as shown in column 3 of Table 5. This indicates that EPT can significantly improve the level of urban openness to the outside world, thereby reducing energy consumption, thus supporting Hypothesis 3 (H3). In addition, as shown in column 4 of Table 5, the coefficient of the impact of EPT on urban energy consumption in the high level of economic openness group (Tax_did × high) is −0.027 at the 1% significance level, while the coefficient of the low level of economic openness group (Tax_did × low) is not significant. This indicates that, compared to low-level economic openness, high-level economic openness can effectively reduce urban energy consumption through EPT. In summary, as an effective economic means, environmental protection plans not only reduce energy consumption and environmental protection, but also inject new vitality into sustainable economic development, achieving a win-win situation for both economic and environmental benefits.
Finally, from the perspective of technological innovation effects, as shown in column 5 of Table 5, the regression coefficient of EPT on technological innovation is 0.118 and the significance level is 10%, indicating that EPT can reduce urban energy consumption by stimulating the government to increase investment in energy-related technology research and development, thus verifying hypothesis 4 (H4). In addition, as shown in column 6 of Table 5, the coefficient of impact of EPT on urban energy consumption in the high-tech innovation level group (Tax_did × high) is −0.022 at the 1% significance level, while the estimated coefficient of the technology innovation low group (Tax_did × low) is 0.013 at the 10% significance level. This indicates that when the level of urban technological innovation is high, EPT can effectively suppress energy consumption, but when urban technological innovation is at a low level, EPT not only fails to play its expected role but also promotes energy consumption. The emergence of this phenomenon may be due to insufficient technological innovation, leading to a lack of effective means for energy utilization and environmental protection in cities. In this situation, enterprises may face a high burden of environmental taxes, but due to the lack of efficient technical support, it is not possible to reduce energy consumption by improving production methods. Therefore, companies may choose to increase production scale or adopt more energy-efficient technologies to cope with environmental tax pressures, leading to an increase in energy consumption.

6. Conclusions and Policy Recommendations

Energy consumption is necessary for urban development, but too much energy use can seriously harm the environment and deplete resources, which will hinder cities’ ability to grow sustainably. In this context, this study uses panel data from 284 prefecture-level cities in China from 2009 to 2021 and an intensity difference-in-differences model to empirically test the impact and mechanism of environmental protection tax policy implementation on urban energy consumption. The results of the study indicate that EPT significantly reduces urban energy consumption, and this conclusion is still valid after a series of robustness tests. From the perspective of heterogeneity testing, the effect of EPT on urban energy consumption exhibits significant heterogeneity because of the notable differences in each city’s geographical location, population size, resource endowment, and level of industrial development. Specifically, EPT has a more significant inhibitory effect on urban energy consumption in central and western cities, small and medium-sized cities, non-resource-based cities, and non-old industrial bases. According to its mechanism of action, EPT has significantly reduced the amount of energy used in urban areas by encouraging the upgrading of the industrial structure of the city, expanding the degree of urban economic openness, and raising the standard of technological innovation in the city. Therefore, this paper proposes the following four policy suggestions as a result of the findings mentioned above.
Firstly, the government should accelerate the adjustment of the energy structure, improve energy utilization efficiency, and reduce reliance on fossil fuels. Specifically, the first is to strongly support the R&D, promotion, and application of cutting-edge technologies for energy saving and emission reduction as well as green production, therefore enhancing energy efficiency. The government can establish a dedicated Green Technology Innovation Fund to support the scientific research and commercialization of green clean technologies and energy conservation and emission reduction industries that meet environmental requirements. At the same time, relevant policies should be formulated to encourage enterprises to adopt these technologies, such as tax incentives and loan subsidies. Additionally, the government and academic institutions can foster talent development and scientific research cooperation by creating technology alliances and collaborative research projects, facilitating the dissemination and application of scientific and technical achievements to businesses, and advancing the growth of green technology, energy-saving, and emission-reduction industries. The second is to further lessen the unreasonable reliance on conventional fossil fuels by encouraging and supporting the study and development of new renewable energy sources. The government should boost technological innovation and R&D spending and encourage the advancement of renewable energy technology, such as increasing photovoltaic cell conversion efficiency, wind turbine performance, hydropower system efficiency and dependability, etc. Moreover, the government should encourage the use of new energy cars and renewable energy buildings to reduce emissions and environmental pollution from traditional fuel vehicles and encourage end-users to apply renewable energy to increase market share and stimulate demand.
Secondly, the government should continue to promote the sound implementation of the EPT system to assist economic and social progress and stable development. To be more precise, to protect the environment and encourage sustainable growth, both the national and local governments should create and enhance environmental protection tax laws. The central government should adjust the EPT rate according to the actual situation to balance the contradiction between tax revenue and environmental protection. For example, lower tax rates can be set to reduce government financial pressure, or higher tax rates can be set to enhance environmental regulation. Local governments should clarify the scope, tax rate, and purpose of EPT collection policies and regulations and ensure consistency with national environmental regulations. The second is making law enforcement and monitoring stronger during the policy-implementation process. The government can improve oversight and law enforcement activities in order to address the problems with environmental tax policy. This includes tougher environmental oversight and management of businesses or people, as well as harsher penalties for illicit activity. These measures can ensure that the implementation of environmental tax policies achieves the expected goals and reduces environmental damage. Thirdly, financial subsidies and other means can be used by the government to encourage and assist qualified businesses and individuals to take part in the construction of environmental protection projects, thereby lowering their environmental protection costs; furthermore, policies like tax exemptions and reductions can be implemented to encourage businesses to adopt more environmentally friendly methods of production.
Thirdly, to fully utilize the energy and growth potential for urban development, the government should speed up the establishment of a distinctive environmental tax collection and administration system. Adaptive modifications to the EPT systems are required considering the variations in geographical location, population density, resource endowment, and industrial development level among cities. For cities in different geographical locations. We need to strengthen industrial restructuring and encourage enterprises and individuals with higher emissions to improve energy efficiency or shift towards cleaner energy sources in order to reduce pollutant emissions. For cities with large populations, the government should adopt a goal-constrained approach, strengthen regulatory efforts, ensure that enterprises and individuals comply with environmental laws and regulations, and establish stricter and more specific environmental standards to promote the development of cities toward low-carbon and green directions. For resource-based cities, promote technological innovation and process improvement for resource-based enterprises, adopt advanced production technologies and equipment, and reduce energy consumption in the production process. Meanwhile, to lessen dependence on fossil fuels, the government should actively encourage the research and application of renewable energy sources, such as wind and solar power. For highly industrialized cities, it is necessary to strengthen environmental monitoring and management, strictly enforce environmental regulations and standards, impose severe penalties on the illegal discharge of pollutants, and establish an effective regulatory system while simultaneously promoting the optimization and adjustment of economic structure and gradually eliminating traditional industries with high energy consumption and pollution.
Lastly, make the most of the favorable impacts that different mechanism variables have on energy usage. More precisely, the industrial structure needs to be optimized and altered to decrease the amount of obsolete production capacity and improve the position of new industries in alternative development. This will save more resources overall, enhance the rate at which resources are used efficiently, and provide environmental protection. The second is to increase the country’s exposure to other countries and introduce more advanced technologies and management methods. By utilizing international market price signals, modifying domestic industrial structure and policy orientation to reduce energy consumption, fostering stronger economic cooperation with neighboring countries and regions, building stable oil and gas pipelines and transportation networks, and taking other steps, opening to the outside world can help improve energy efficiency by better integrating global resources and market information. Thirdly, we are committed to developing and utilizing renewable energy while promoting and implementing technologies to reduce emissions and improve energy efficiency. Research and development of new energy, energy-saving, and clean production technologies should receive more funding to increase energy utilization efficiency and to encourage businesses to implement technological transformation and updates, adopt more efficient machinery and processes, support the circular economy and resource-saving industrial models, and reduce energy consumption.
Although this study provides an in-depth analysis of the impact mechanism and effects of EPT on energy consumption in Chinese cities, there are still two shortcomings in the research process. Firstly, this study adopts the strength of the DID model to examine the causal effect between EPT and urban energy consumption, but the influence of spatial factors is ignored in the research method. To make up for this deficiency, a spatial DID model will be used for analysis in the future. Secondly, the research on energy consumption in Chinese cities in this study is based on three types of energy data, and the measurement of energy data is still not comprehensive, especially without considering the differences between clean energy and non-clean energy applications. In the future, we will adopt county-level energy consumption data to enrich existing research.

Author Contributions

Conceptualization, X.X.; methodology, X.X.; formal analysis, X.X. and L.H.; data curation, L.H.; writing—original draft preparation, L.H.; writing—review and editing, X.X.; funding acquisition, X.X. All authors have read and agreed to the published version of the manuscript.

Funding

This study was funded by the National Social Science Foundation of China (No.19BRK036) and the Humanities and Social Science Youth Foundation of the Ministry of Education in China (No. 18YJC840047).

Institutional Review Board Statement

Not applicable.

Informed Consent Statement

Not applicable.

Data Availability Statement

The datasets and computer programs used in this study are available from the corresponding author upon reasonable requests.

Conflicts of Interest

The authors declare no conflicts of interest.

References

  1. Li, J.; Yang, L.; Long, H. Climatic impacts on energy consumption: Intensive and extensive margins. Energy Econ. 2018, 71, 332–343. [Google Scholar] [CrossRef]
  2. Lee, S.; Oh, D.W. Economic growth and the environment in China: Empirical evidence using prefecture level data. China Econ. Rev. 2015, 36, 73–85. [Google Scholar] [CrossRef]
  3. Xu, X.; Song, Y. Is there a conflict between automation and environment? Implications of artificial intelligence for carbon emissions in China. Sustainability 2023, 15, 12437. [Google Scholar] [CrossRef]
  4. Beattie, G.; Ding, I.; La Nauze, A. Is there an energy efficiency gap in China? Evidence from an information experiment. J. Environ. Econ. Manag. 2022, 115, 102713. [Google Scholar] [CrossRef]
  5. Gozgor, G.; Mahalik, M.K.; Demir, E.; Padhan, H. The impact of economic globalization on renewable energy in the OECD countries. Energy Policy 2020, 139, 111365. [Google Scholar] [CrossRef]
  6. Zaharia, A.; Diaconeasa, M.C.; Brad, L.; Ladaru, G.R.; Ioanas, C. Factors Influencing Energy Consumption in the Context of Sustainable Development. Sustainability 2019, 11, 4147. [Google Scholar] [CrossRef]
  7. Chen, S.; Zhang, H.; Wang, S. Trade openness, economic growth, and energy intensity in China. Technol. Forecast. Soc. Chang. 2022, 179, 121608. [Google Scholar] [CrossRef]
  8. Xu, Y.; Li, S.; Zhou, X.; Shahzad, U.; Zhao, X. How environmental regulations affect the development of green finance: Recent evidence from polluting firms in China. Renew. Energy 2022, 189, 917–926. [Google Scholar] [CrossRef]
  9. Wang, H.; Zhang, R. Effects of environmental regulation on CO2 emissions: An empirical analysis of 282 cities in China. Sustain. Prod. Consump. 2022, 29, 259–272. [Google Scholar] [CrossRef]
  10. He, P.; Sun, Y.; Shen, H.; Jian, J.; Yu, Z. Does environmental tax affect energy efficiency? An empirical study of energy efficiency in OECD countries based on DEA and Logit model. Sustainability 2019, 11, 3792. [Google Scholar] [CrossRef]
  11. Abdullah, S.; Morley, B. Environmental taxes and economic growth: Evidence from panel causality tests. Energy Econ. 2014, 42, 27–33. [Google Scholar] [CrossRef]
  12. Cheng, Z.H.; Kong, S.Y. The effect of environmental regulation on green total-factor productivity in China’s industry. Environ. Impact Assess. Rev. 2022, 94, 106757. [Google Scholar] [CrossRef]
  13. Islam, M.M.; Irfan, M.; Shahbaz, M.; Vo, X.V. Renewable and non-renewable energy consumption in Bangladesh: The relative influencing profiles of economic factors, urbanization, physical infrastructure and institutional quality. Renew. Energy 2022, 184, 1130–1149. [Google Scholar] [CrossRef]
  14. Simcock, N.; MacGregor, S.; Catney, P.; Dobson, A.; Ormerod, M.; Robinson, Z.; Ross, S.; Royston, S.; Hall, S.M. Factors influencing perceptions of domestic energy information: Content, source and process. Energy Policy 2014, 65, 455–464. [Google Scholar] [CrossRef]
  15. Ding, Q.; Khattak, S.I.; Ahmad, M. Towards sustainable production and consumption: Assessing the impact of energy productivity and eco-innovation on consumption-based carbon dioxide emissions (CCO2) in G-7 nations. Sustain. Prod. Consump. 2021, 27, 254–268. [Google Scholar] [CrossRef]
  16. Xu, L.N.; Li, Y.N.; Chen, Z.; Yang, X.F. Analyzing Impact Factors of Energy Consumption in Yellow River Basin of China-Taking Shanxi Province as an Example. J. Coast. Res. 2020, 115, 539–542. [Google Scholar] [CrossRef]
  17. Murad, M.W.; Alam, M.M.; Noman, A.M.; Ozturk, I. Dynamics of technological innovation, energy consumption, energy price and economic growth in Denmark. Environ. Prog. Sustain. Energy 2019, 38, 22–29. [Google Scholar] [CrossRef]
  18. Chen, W.H.; Lei, Y.L. The impacts of renewable energy and technological innovation on environment-energy-growth nexus: New evidence from a panel quantile regression. Renew. Energy 2018, 123, 1–14. [Google Scholar] [CrossRef]
  19. Acheampong, A.O.; Dzator, J.; Dzator, M.; Salim, R. Unveiling the effect of transport infrastructure and technological innovation on economic growth, energy consumption and CO2 emissions. Technol. Forecast. Soc. Chang. 2022, 182, 121843. [Google Scholar] [CrossRef]
  20. Kyophilavong, P.; Shahbaz, M.; Anwar, S.; Masood, S. The energy-growth nexus in Thailand: Does trade openness boost up energy consumption? Renew. Sust. Energ. Rev. 2015, 46, 265–274. [Google Scholar] [CrossRef]
  21. Lange, B.; Gouldson, A. Trust-based environmental regulation. Sci. Total Environ. 2010, 408, 5235–5243. [Google Scholar] [CrossRef] [PubMed]
  22. Blohmke, J.; Kemp, R.; Türkeli, S. Disentangling the causal structure behind environmental regulation. Technol. Forecast. Soc. Chang. 2016, 103, 174–190. [Google Scholar] [CrossRef]
  23. Xie, R.H.; Yuan, Y.J.; Huang, J.J. Different types of environmental regulations and heterogeneous influence on “green” productivity: Evidence from China. Ecol. Econ. 2017, 132, 104–112. [Google Scholar] [CrossRef]
  24. Zhou, Q.; Zhong, S.H.; Shi, T.; Zhang, X.L. Environmental regulation and haze pollution: Neighbor-companion or neighbor-beggar? Energy Policy. 2021, 151, 112183. [Google Scholar] [CrossRef]
  25. Lin, B.; Xie, J.W. Does environmental regulation promote industrial structure optimization in China? A perspective of technical and capital barriers. Environ. Impact Assess. Rev. 2023, 98, 106971. [Google Scholar] [CrossRef]
  26. Raff, Z.; Earnhart, D. Employment and environmental protection: The role of regulatory stringency. J. Environ. Manag. 2022, 321, 115896. [Google Scholar] [CrossRef]
  27. Tanaka, S. Environmental regulations on air pollution in China and their impact on infant mortality. J. Health Econ. 2015, 42, 90–103. [Google Scholar] [CrossRef]
  28. Guo, L.; Wang, Y. How does government environmental regulation “unlock” carbon emission effect? —Evidence from China. Chin. J. Popul. Resour. Environ. 2018, 16, 232–241. [Google Scholar] [CrossRef]
  29. Wang, M.; Liao, G.; Li, Y. The relationship between environmental regulation, pollution and corporate environmental responsibility. Int. J. Environ. Res. Public Health 2021, 18, 8018. [Google Scholar] [CrossRef]
  30. Collins, M.B.; Pulver, S.; Hill, D.T.; Manski, B. Targeted pollution management can significantly reduce toxic emissions while limiting adverse effects on employment in US manufacturing. Environ. Sci. Policy 2023, 139, 157–165. [Google Scholar] [CrossRef]
  31. Zhang, X.J.; Huang, S.F.; Li, W.F.; Wang, Y. Directors? and officers? liability insurance, environmental regulation and firms? envi ronmental responsibility. Ecol. Econ. 2023, 208, 107796. [Google Scholar] [CrossRef]
  32. Martins, H.C. Competition and ESG practices in emerging markets: Evidence from a difference-in-differences model. Financ. Res. Lett. 2022, 46, 102371. [Google Scholar] [CrossRef]
  33. Heckert, M.; Mennis, J. The economic impact of greening urban vacant land: A spatial difference-in-differences analysis. Environ. Plan. A 2012, 44, 3010–3027. [Google Scholar] [CrossRef]
  34. Jia, R.N.; Shao, S.; Yang, L.L. High-speed rail and CO2 emissions in urban China: A spatial difference-in-differences approach. Energy Econ. 2021, 99, 105271. [Google Scholar] [CrossRef]
  35. Ashenfelter, O. Estimating the effect of training programs on earnings. Rev. Econ. Stat. 1978, 60, 47–57. [Google Scholar] [CrossRef]
  36. Yang, X.Y.; Jiang, P.; Pan, Y. Does China’s carbon emission trading policy have an employment double dividend and a Porter effect? Energy Policy 2020, 142, 111492. [Google Scholar] [CrossRef]
  37. Sendstad, L.H.; Hagspiel, V.; Mikkelsen, W.J.; Ravndal, R.; Tveitstol, M. The impact of subsidy retraction on European renewable energy investments. Energy Policy 2022, 160, 112675. [Google Scholar] [CrossRef]
  38. Ma, C.G.; Bei, H.J.; Wang, C.E.; Chen, G.H. Accelerated Depreciation Tax Credit and Corporate Financialization Based on the PSM-DID Model. Wirel. Commun. Mob. Comput. 2020, 2020, 6622900. [Google Scholar] [CrossRef]
  39. Wu, H.T.; Xue, Y.; Hao, Y.; Ren, S. How does internet development affect energy-saving and emission reduction? Evidence from China. Energy Econ. 2021, 102, 105577. [Google Scholar] [CrossRef]
  40. Nawaz, M.A.; Seshadri, U.; Kumar, P.; Aqdas, R.; Patwary, A.K.; Riaz, M. Nexus between green finance and climate change mitigation in N-11 and BRICS countries: Empirical estimation through difference in differences (DID) approach. Environ. Sci. Pollut. Res. 2021, 28, 6504–6519. [Google Scholar] [CrossRef]
  41. Ambec, S.; Cohen, M.A.; Elgie, S.; Lanoie, P. The Porter hypothesis at 20: Can environmental regulation enhance innovation and competitiveness? Rev. Environ. Econ. Policy 2013, 7, 2–22. [Google Scholar] [CrossRef]
  42. Daw, J.R.; Hatfield, L.A. Matching and regression to the mean in difference-in-differences analysis. Health Serv. Res. 2018, 53, 4138–4156. [Google Scholar] [CrossRef]
  43. Kosfeld, R.; Mitze, T.; Rode, J.; Walde, K. The COVID-19 containment effects of public health measures: A spatial difference-in-differences approach. J. Reg. Sci. 2021, 61, 799–825. [Google Scholar] [CrossRef] [PubMed]
  44. Gao, X.; Liu, N.; Hua, Y. Environmental Protection Tax Law on the synergy of pollution reduction and carbon reduction in China: Evidence from a panel data of 107 cities. Sustain. Prod. Consump. 2022, 33, 425–437. [Google Scholar] [CrossRef]
  45. Lee, H.Y.; Jang, K.M.; Kim, Y. Energy Consumption Prediction in Vietnam with an Artificial Neural Network-Based Urban Growth Model. Energies 2020, 13, 4282. [Google Scholar] [CrossRef]
  46. Chen, S.X. The effect of a fiscal squeeze on tax enforcement: Evidence from a natural experiment in China. J. Public Econ. 2017, 147, 62–76. [Google Scholar] [CrossRef]
  47. Guo, B.; Wang, Y.; Feng, Y.; Hu, F. The effects of environmental tax reform on urban air pollution: A quasi-natural experiment based on the Environmental Protection Tax Law. Front. Public Health 2022, 10, 967524. [Google Scholar] [CrossRef] [PubMed]
  48. Li, M.; Liu, X.; Yang, M. Analyzing the regional inequality of renewable energy consumption and its driving factors: Evidence from China. Renew. Energy 2024, 223, 120043. [Google Scholar] [CrossRef]
  49. Chen, H.; Du, Q.; Huo, T.; Liu, P.; Cai, W.; Liu, B. Spatiotemporal patterns and driving mechanism of carbon emissions in China’s urban residential building sector. Energy 2023, 263, 126102. [Google Scholar] [CrossRef]
  50. Cortes, G.S.; Gao, G.P.; Silva, F.B.; Song, Z. Unconventional monetary policy and disaster risk: Evidence from the subprime and COVID–19 crises. J. Int. Money Finance 2022, 122, 102543. [Google Scholar] [CrossRef]
  51. Hering, L.; Poncet, S. Environmental policy and exports: Evidence from Chinese cities. J. Environ. Econ. Manag. 2014, 68, 296–318. [Google Scholar] [CrossRef]
  52. Wang, Y.; Li, L. Digital economy, industrial structure upgrading, and residents’ consumption: Empirical evidence from prefecture-level cities in China. Int. Rev. Econ. Financ. 2024, 92, 1045–1058. [Google Scholar] [CrossRef]
  53. Paul, J.; Feliciano-Cestero, M.M. Five decades of research on foreign direct investment by MNEs: An overview and research agenda. J. Bus. Res. 2021, 124, 800–812. [Google Scholar] [CrossRef] [PubMed]
  54. Liu, C. Infrastructure public–private partnership (PPP) investment and government fiscal expenditure on science and technology from the perspective of sustainability. Sustainability 2021, 13, 6193. [Google Scholar] [CrossRef]
Figure 1. The Historical Evolution of Environmental Protection Tax in China.
Sustainability 16 04141 g001
Figure 2. Framework diagram for analyzing the impact mechanisms of EPT on energy consumption.
Sustainability 16 04141 g002
Figure 3. Geographical distribution maps of Chinese urban energy consumption in 2009, 2013, 2017, and 2021 (unit: tons per person).
Sustainability 16 04141 g003
Figure 4. Geographical distribution map of Environmental Protection Law pilot cities in 2018.
Sustainability 16 04141 g004
Figure 5. Trends and regional differences in urban energy consumption in China from 2009 to 2021.
Sustainability 16 04141 g005
Figure 6. The kernel density maps of urban energy consumption in China from 2009 to 2021.
Sustainability 16 04141 g006
Figure 7. Parallel trend test chart of the policy effect of EPT on energy consumption.
Sustainability 16 04141 g007
Figure 8. p-value and kernel density distribution of energy consumption per unit GDP (a) and per capita energy consumption (b).
Sustainability 16 04141 g008
Table 1. The regression results of the impact of EPT on urban energy consumption.
Variable(1)(2)(3)(4)(5)
Tax_did−0.021 ***−0.018 ***−0.018 ***−0.018 ***−0.019 ***
(−2.955)(−2.637)(−2.630)(−2.704)(−2.882)
PGDP −0.038 ***−0.034 ***−0.016−0.025 **
(−3.477)(−3.154)(−1.538)(−2.157)
Indus −0.059−0.034−0.030
(−1.244)(−0.731)(−0.647)
Fiscal 0.045 ***0.042 ***
(3.552)(3.434)
Finance −0.000−0.001
(−0.060)(−0.171)
Popul −0.017
(−0.690)
Urban 0.078 ***
(4.767)
_Cons0.095 ***0.500 ***0.478 ***0.1490.038
(78.762)(4.282)(4.256)(1.128)(0.190)
City FEYesYesYesYesYes
Year FEYesYesYesYesYes
F statistic8.738.796.145.806.82
R20.7040.7100.7100.7140.721
Obs36923692369236923692
Note: The t value is enclosed in parentheses. *** and ** reflect significance at the 1% and 5% levels.
Table 2. The results of EPT’s robustness test on urban energy consumption.
Variables(1)(2)(3)(4)(5)(6)
Adjust Explained VariableRemove Some Special SamplesAdjust Explanatory VariableAdjust
Sample Period
Adjust Estimation MethodIV Estimation Method
EnergyEnergy_GDPEnergy_GDPEnergy_GDPEnergy_GDPEnergy_GDP
Tax_did−0.187 ***−0.019 ***−0.019 ***−0.019 ***−0.011 **−0.093 **
(−2.955)(−2.737)(−2.999)(−2.996)(−2.075)(−2.039)
PGDP0.391 ***−0.030 **−0.025 **−0.027 **−0.045 ***−0.015
(2.839)(−2.207)(−2.143)(−2.114)(−3.865)(−1.367)
Indus0.247−0.032−0.037−0.0640.021−0.046
(0.616)(−0.674)(−0.804)(−1.264)(0.638)(−0.943)
Fiscal0.1400.032 ***0.042 ***0.035 ***0.023 **0.045 ***
(1.470)(2.615)(3.438)(2.897)(2.449)(3.047)
Finance−0.123 ***0.003−0.0000.005−0.003−0.005
(−3.090)(0.450)(−0.019)(0.758)(−0.468)(−0.754)
Popul0.3370.042−0.013−0.002−0.047 **0.053
(1.340)(1.257)(−0.514)(−0.076)(−2.187)(1.165)
Urban0.806 ***0.060 ***0.079 ***0.071 ***0.079 ***0.085 ***
(5.373)(3.493)(4.786)(4.424)(4.756)(4.682)
_Cons−4.926 **−0.1530.0140.0220.460 **
(−2.332)(−0.705)(0.070)(0.112)(2.580)
City FEYesYesYesYesYesYes
Year FEYesYesYesYesYesYes
F statistic13.795.116.936.217.736.02
R20.9130.7360.7220.7130.785
Obs369232373692312428013692
CD-Wald-F 224.64
KP-Wald-rk-F 25.79
Note: The t value is enclosed in parentheses. *** and ** reflect significance at the 1% and 5% levels.
Table 3. The results of policy uniqueness tests.
Variables(1)(2)(3)(4)(5)(6)
Tax_did−0.019 ***−0.018 ***−0.019 ***−0.019 ***−0.020 ***−0.020 ***
(−2.925)(−2.851)(−2.898)(−2.894)(−2.840)(−2.823)
Innocity_did−0.014 * −0.011
(−1.908) (−1.506)
BdChina_did −0.013 ** −0.012 **
(−2.354) (−2.136)
Smrcity_did −0.007 −0.006
(1.398) (−1.076)
LowCo2_did −0.002 −0.000
(−0.372) (−0.071)
Data_did 0.0090.008
(1.120)(0.943)
_Cons0.0440.0650.0520.0360.0500.088
(0.217)(0.322)(0.262)(0.181)(0.256)(0.443)
ControlYesYesYesYesYesYes
City FEYesYesYesYesYesYes
Year FEYesYesYesYesYesYes
F statistic6.036.106.036.046.194.35
R20.7220.7230.7220.7210.7220.724
Obs369236923692369236923692
Note: The t value is enclosed in parentheses. ***, **, and * reflect significance at the 1%, 5%, and 10% levels.
Table 4. The regional heterogeneity results of the impact of EPT on urban energy consumption.
Variables(1)(2)(3)(4)(5)(6)(7)(8)
Eastern CitiesCentral and Western CitiesLarge CitiesMedium and Small CitiesResource
-Based
Non-Resource
-Based
Old Industrial BasesNon-Old Industrial Bases
Tax_did−0.003−0.026 ***−0.016 **−0.040 *−0.008−0.026 ***−0.013−0.018 *
(−0.370)(−3.237)(−2.162)(−1.740)(−0.827)(−2.749)(−1.569)(−1.961)
_Cons0.745 ***−0.2710.397 *−0.578−0.4560.534 **0.1120.493 **
(3.254)(−1.109)(1.719)(−1.433)(−1.568)(2.111)(0.370)(2.059)
ControlYesYesYesYesYesYesYesYes
City FEYesYesYesYesYesYesYesYes
Year FEYesYesYesYesYesYesYesYes
F statistic8.563.604.932.893.335.359.404.36
R20.6640.7320.6610.7470.7110.7330.7310.726
Obs1300239229777151469222315342158
Note: The t value is enclosed in parentheses. ***, **, and * reflect significance at the 1%, 5%, and 10% levels.
Table 5. The results of the EPT’s mechanism regression on urban energy consumption.
Variables(1)(2)(3)(4)(5)(6)
Industrial
Upgrading
Energy_GDPEconomic OpennessEnergy_GDPTechnological InnovationEnergy_GDP
Tax_did0.006 * 0.247 *** 0.118 *
(1.965) (3.011) (1.907)
Tax_did × high −0.036 *** −0.027 *** −0.022 ***
(−5.017) (−5.099) (−2.776)
Tax_did × low 0.003 −0.003 0.013 *
(0.461) (−0.382) (1.855)
_Cons3.784 ***0.079−14.072 ***0.072−9.108 ***0.115
(26.473)(0.398)(-3.611)(0.361)(−3.341)(0.584)
ControlYesYesYesYesYesYes
City FEYesYesYesYesYesYes
Year FEYesYesYesYesYesYes
F statistic29.577.895.797.5613.869.59
R20.9510.7240.8610.7220.7940.722
Wald test 16.57 *** 9.10 *** 12.02 ***
Obs369236923692369236923692
Note: The t value is enclosed in parentheses. *** and * reflect significance at the 1% and 10% levels.
Disclaimer/Publisher’s Note: The statements, opinions and data contained in all publications are solely those of the individual author(s) and contributor(s) and not of MDPI and/or the editor(s). MDPI and/or the editor(s) disclaim responsibility for any injury to people or property resulting from any ideas, methods, instructions or products referred to in the content.

