Article

Analysis of Factors Influencing Driver Yielding Behavior at Midblock Crosswalks on Urban Arterial Roads in Thailand

by
Pongsatorn Pechteep
1,
Paramet Luathep
1,*,
Sittha Jaensirisak
2 and
Nopadon Kronprasert
3
1
Department of Civil and Environmental Engineering, Faculty of Engineering, Prince of Songkla University, Songkhla 90110, Thailand
2
Department of Civil Engineering, Faculty of Engineering, Ubon Ratchathani University, Ubon Ratchathani 34190, Thailand
3
Department of Civil Engineering, Faculty of Engineering, Chiang Mai University, Chiang Mai 50200, Thailand
*
Author to whom correspondence should be addressed.
Sustainability 2024, 16(10), 4118; https://doi.org/10.3390/su16104118
Submission received: 8 March 2024 / Revised: 26 April 2024 / Accepted: 8 May 2024 / Published: 14 May 2024

Abstract

:
Globally, road traffic collisions cause over a million deaths annually, with pedestrians accounting for 23%. In developing countries, most pedestrian deaths occur on urban arterial roads, particularly at midblock crossings. This study analyzes the factors influencing driver yielding behavior at midblock crosswalks on urban arterial roads in Thailand. This study analyzed the factors influencing driver yielding behavior at the midblock crosswalk before and after the upgrade from a zebra crossing (C1) to a smart pedestrian crossing (C2), which is a smart traffic signal detecting and controlling pedestrians and vehicles entering the crosswalk. Video-based observations were used to assess driver yielding behavior, with multinomial logistic regression applied to develop driver yielding behavior models. The results revealed that the chances of a driver yielding at C2 were higher than at C1, and the yielding rate increased by 74%. The models indicate that the number and width of traffic lanes, width and length of crosswalks, vulnerable group, number of pedestrians, pedestrian crossing time, number of vehicles, vehicle speed, headway, post-encroachment time between a vehicle and pedestrian, and roadside parking are the significant factors influencing yielding behavior. These findings propose measures to set proper crosswalk improvements (e.g., curb extensions), speed reduction measures, enforcement (e.g., parking restrictions), public awareness campaigns, and education initiatives.

1. Introduction

Globally, pedestrian-involved traffic crashes present a significant road safety issue, particularly in developing countries [1,2]. With a dramatic increase in urban traffic flow, the primary threat to pedestrians occurs from conflicts between pedestrians and vehicles at crosswalks. These conflicts become more likely and difficult to avoid when vehicle drivers fail to yield to pedestrians, particularly in midblock crosswalks [3]. In road traffic collisions, pedestrians are more vulnerable to harm than vehicles, as even a low-speed impact can result in serious injuries or fatalities [3,4]. The recent report on the global status of road safety [4] highlighted a staggering figure of approximately 1.19 million road traffic deaths in 2021, corresponding to a rate of 15 deaths per 100,000 population. Notably, pedestrians accounted for 23% of these fatalities, with over 90% of pedestrian deaths occurring in low-income and middle-income countries [4].
In Thailand, road traffic crashes have a high human toll. In 2021 alone, 16,957 people died as a result of road traffic crashes [4]. According to the statistics, the pedestrian casualty rate accounts for 2.5 deaths per 100,000 individuals across the country. This figure represents approximately 8% of all road crash casualties [4]. In addition, the number of pedestrian fatalities, especially on national highways, has increased dramatically from 2018 to 2022, with an alarming increase of 6.3% per year [5], resulting in an approximate toll of 350 pedestrian deaths per year [6]. This high casualty rate among pedestrians underscores the vulnerability of this road user group. It is tragedy that almost all losses occur when pedestrians cross the road. These losses include the case of a female medical doctor who was killed while crossing a midblock crosswalk on an urban arterial road in 2022 [7]. From the crash records [5,6], the top two contributing factors to vehicle-pedestrian collisions are vehicles exceeding the speed limit (accounting for 70% of cases), followed by drivers not complying with the crosswalk rules (e.g., yielding to pedestrians).
Following the Sustainable Development Goals (SDGs), particularly Goal 3: good health and well-being, and Target 3.6: to halve the number of global deaths and injuries from road traffic crashes by 2030 [8], Thailand aims toward zero road deaths [9], emphasizing the urgent need for pedestrian safety measures and encouraging drivers to yield to pedestrians. These measures are expected to decrease the number of pedestrian crashes, injuries, and fatalities. A focused intervention to reduce pedestrian incidents presents an avenue through which it can positively influence both public health and the overarching pursuit of sustainable development.
Among the array of driver-oriented engineering countermeasures, the following can be listed: pedestrian-activated flashing beacons designed to warn and guide drivers, high-visibility markings, optical speed bars (OSB), zig–zag lines, red-painted areas, curb extensions, and raised pedestrian crosswalks. Additionally, applying various pedestrian signals is crucial to enhancing pedestrian safety. A recent addition to the aforementioned countermeasures is the implementation of smart pedestrian crossings, which can detect both the traffic flow of vehicles entering the crosswalk and the movement of pedestrians crossing [10,11]. The effectiveness of these countermeasures have demonstrated a positive effect on reducing traffic speed and pedestrian crashes [12] and encouraging driver yielding behavior [12,13,14,15].
The driver yielding behavior varies depending on the implemented countermeasures [12,15,16,17]. It is notably influenced by diverse factors such as the driver’s characteristics, attitude towards yielding, and behavior-related factors [15,16,17]. Extensive research has indicated the significance of driver non-yielding to pedestrians as a primary factor contributing to pedestrian crashes [12,15,16,17]. In pedestrian crashes, more than 95% result from traffic violations [15], and 19% of drivers disagree with yielding to pedestrians [12,15]. Unfortunately, drivers often fail to recognize pedestrian safety, and not complying with crosswalk rules by yielding to pedestrians is one of the most dangerous driving behaviors and a significant safety problem [12,14]. This risky behavior significantly undermines the effectiveness of safety countermeasures at such locations. Therefore, an essential strategy for achieving a safe pedestrian system is to encourage driver-yielding behavior and minimize instances of drivers not complying with the crosswalk rules.
The Department of Highways has recently introduced a smart crosswalk system in Thailand, particularly on urban arterial roads [10]. The previous research [12,13,14,15,18,19] has primarily focused on evaluating the effectiveness, in terms of safety, of midblock crosswalk improvements upgrading from a typical zebra crossing (C1) to a smart pedestrian crossing (C2) in which a smart traffic signal is installed to detect and control the traffic of pedestrian crossings and vehicles approaching the crosswalk. These studies have revealed various positive safety impacts, in which the C2 led to a notable reduction in vehicle speed owing to better visibility of the crosswalk and a significant increase in the rate of drivers yielding to pedestrians [18,19]. The variation in the percentage of drivers yielding to pedestrians between C1 and C2 highlights the necessity for a comprehensive exploration into the factors influencing driver yielding behavior toward pedestrians, which has not been investigated thoroughly and is, therefore, the primary focus of the current study. Bridging this knowledge gap is crucial for addressing persistent challenges in pedestrian safety and providing insights into the factors influencing driver behavior. Additionally, aspects related to vehicle headway and post-encroachment time (PET) between vehicles and pedestrians have not been previously discussed in driver yielding behavior.
Regarding the driver yielding behavior models, most studies applied a binary logistic framework [20,21], which allows yield or non-yield behavior. However, in Thailand, driver behavior encompasses yielding, soft yielding, and non-yielding, with a predominance of non-yield and soft yield behaviors and minimal instances of yield, especially at zebra crossings. The current study applies multinomial logistic regression (MLR), which takes these three types of yielding patterns to formulate driver yielding behavior models.
This study, therefore, aims to fill the existing research gaps by undertaking a comprehensive analysis of the factors influencing driver yielding behavior at midblock crosswalks on urban arterial road in Thailand. The underlying research hypothesis is that a smart pedestrian crossing impacts driver yielding behavior more than a zebra crossing. This hypothesis incorporates the influence of physical roadway characteristics on the driver yielding behavior. The contributions of this study can lead to an understanding of the factors that influence driver yielding behavior in the safety of midblock crosswalks, and can help propose guidelines for tailoring effective countermeasures to improve pedestrian safety and encourage driver yielding behavior in mixed traffic conditions between pedestrians and vehicles, particularly in developing countries like Thailand.
The rest of this paper is structured as follows: following this introduction, Section 2 reviews previous research on the factors influencing yielding behavior. Section 3 presents the research methodology used in this study, and Section 4 presents a comprehensive discussion of the key findings based on this study. Finally, Section 5 summarizes the significant contributions and suggests future research directions.

2. Literature Review

This section reviews the literature on driver yielding behavior and the factors influencing driver yielding behavior at the midblock crosswalk. The details are explained in the next subsections.

2.1. Driver Yielding Behavior

Driver yielding behavior is inconsistently defined both conceptually and operationally. Much safety research has focused on treatments to improve vehicle yielding rates (using varying definitions of yielding). Some studies strictly use yielding to mean that road users follow traffic laws [20]. Alternatively, yielding is based on the road the user passes first [21], sometimes accounting for the feasibility of a vehicle stopping based on speed and distance [22]. Vehicle slowing or stopping has also been used to define yielding [23].
A pedestrian–driver interaction event is a pedestrian entering the crosswalk area while a driver is approaching the crosswalk. The driver knows that an event sequence will occur at the crosswalk from the onset of a pedestrian–driver interaction event. The pedestrian intends to cross the road (waiting on the sidewalk and looking for a gap in traffic to cross). The driver must discern the pedestrian’s intention and respond accordingly (decide whether to slow down or continue through the crosswalk) [20]. Accordingly, the driver behaviors can be grouped into two main behavior classes: non-yield and yield.
Not yielding to pedestrians (non-yield: NY): The driver decides not to yield to the pedestrian when the driver goes through the crosswalk area or conflict zone without yielding to the pedestrian, and keeping the speed unchanged [20,21,22,23].
Yielding to pedestrians (yield: Y): The driver yields to a pedestrian by adjusting the speed, decelerating at a crosswalk area to accommodate the pedestrian, and waiting until the pedestrian has cleared the lanes on the driver’s side of the street [20,21,22,23].
Another specification can be made when a driver yields to the pedestrian by softly slowing down (soft yield: SY). In this event, the driver slows down to a minimum speed higher than 10 km/h to allow the pedestrian to pass [20]. On the other hand, hard slowing down (Hard Yield: HY) represents an event when a driver slows down to a minimum speed lower than 10 km/h to allow the pedestrian to pass [20].

2.2. Contributing Factors to Driver Yielding Behaviors

The act of yielding, a behavioral factor inherent in the interactions among road users, is consistently recognized as a pivotal component of pedestrian safety and comfort [24,25]. In recent years, there has been a notable surge in studies focusing on the driver yielding behavior at midblock crosswalks under mixed traffic conditions, consisting of a mix of pedestrians, cyclists, motorcycles, and other vehicles sharing the same roadway.
Table 1 summarizes a comprehensive review of the factors significantly influencing driver yielding behavior and the methods used to identify them. These factors can be systematically categorized into four components: (1) roadway factors, (2) pedestrian factors, (3) traffic factors, and (4) environmental factors. The details are discussed in the next subsections.

2.2.1. Roadway Factors

Regarding roadway factors, research has illuminated key insights into driver yielding behavior on urban roads, revealing lower yielding on local roadways [40]. Notably, locations where pedestrian-involved crashes are the most prevalent pose a heightened risk, particularly in urban areas where 69% of pedestrian fatalities occur [41]. The width of the roadway and number of traffic lanes have emerged as critical factors influencing driver–pedestrian interactions [42,43]. The simultaneous circulation of vehicles in multiple lanes can obscure areas of driver visibility, impeding their ability to detect pedestrians [26]. Furthermore, the increased sense of safety and comfort experienced by drivers on such roads often leads to higher driving speeds [44].
In road user safety, the absence of crosswalks is a significant risk factor, with roads lacking designated crosswalks being 1.5–2.0 times more likely to collide with pedestrians than roads equipped with crosswalks [44,45]. However, the placement of crosswalks is essential, and careful consideration ensures their installation at locations where pedestrians and drivers are more likely to adhere to crosswalks [45]. Drivers approaching a crosswalk area with pedestrian refuge islands exhibited a 1.63 times greater likelihood of yielding than those approaching a crosswalk area without refuge islands [27]. These findings underscore the multifaceted impact of roadway characteristics on driver yielding behavior and highlight the importance on thoughtful infrastructure design in promoting pedestrian safety.
Numerous studies have focused on the driver yielding behavior associated with specific design elements in examining various crosswalks. The effectiveness of different crosswalks is contingent upon the complex interplay between pedestrian and driver behaviors [26,28,29,30,31]. Studies on zebra crossings indicate that drivers are more inclined to yield to pedestrians within marked areas than unmarked sections (odds ratio: OR = 7.15) [31]. However, the overall willingness of drivers to yield at zebra crossings remains relatively low, ranging from 4% to 40% [30,31]. Additionally, driver yielding behavior at zebra crossings can occasionally lead to traffic disruptions, delays, and the risk of injury or fatality [32,33]. Enhancing pedestrian safety through the incorporation of design elements such as stripes, colored/textured surfaces, optical lane narrowing, and ramps has demonstrated substantial efficacy. Introducing these elements increases the likelihood of the first vehicle and any subsequent vehicles coming to a stop, resulting in a significant surge in yielding rates from 20% to an impressive 97% [30]. Similarly, the presence of a raised crosswalk and overhead flashing beacons led to a noteworthy 50% increase in the rate of yielding [43]. It significantly elevated the rate of driver yielding (OR = 20.76) [31]. Also, installing a crosswalk with a traffic signal boasted the highest driver yielding rate, averaging an impressive 98%. The driver yielding rate for a rectangular rapid-flashing beacon (RRFB) stood at 86%, whereas a pedestrian hybrid beacon (PHB) achieved a rate of 89% [26].

2.2.2. Pedestrian Factors

Numerous studies have contributed to a more comprehensive understanding of pedestrian characteristics and their crossing behavior, which is a significant factor influencing yielding behavior. Gender differentials have emerged, indicating that male pedestrians exhibit a higher likelihood of unlawful crossing than their female counterparts [34,46]. Pedestrian fatalities constitute a higher proportion of all road crash fatalities among females than males [46]. Statistics reveal that females are primarily victims of pedestrians and car passengers. In addition, females have a 47% higher risk of serious injury in car crashes than males and are five times more likely to suffer from whiplash injuries [34,47]. This information demonstrates the vulnerability of females compared to males.
In contrast, mature pedestrians possess the highest proportion of illegal crossing behavior within age groups compared to young and elderly individuals [35,47]. It is noteworthy that drivers exhibit a higher likelihood of yielding to older pedestrians than younger ones [48]. Additionally, the number of pedestrian crossings is a factor that increases drivers’ willingness to yield [30]. Specifically, when a group of pedestrians, comprising more than three individuals, is poised to cross the curb, drivers tend to yield in 46% of the cases [36]. Considering the size of pedestrian crossing groups, drivers are more inclined to yield when more than one person aims to cross (OR = 1.92) [31]. Furthermore, a significant majority of drivers (77.1%) exhibited proximity to the crosswalk area when pedestrians were either waiting at the curb, stopping to stay, or entering the street, resulting in drivers yielding to pedestrians [27]. Drivers are 1.83 times more likely to yield when pedestrians are still on the crosswalk compared to instances where pedestrians have already entered the sidewalk [27].

2.2.3. Traffic Factors

Various studies have underscored the significant influence of traffic characteristics on yielding behavior, where factors such as vehicle speed, vehicle type, and number of vehicles approaching a crosswalk have emerged as crucial predictors of compliance with pedestrian crosswalk laws and yielding behavior [37]. Recognizing that speed constitutes a primary contributor to road fatalities [49] and pedestrian crashes [50,51,52,53,54,55], it is well-established that pedestrian safety at crosswalks is positively correlated with lower vehicle speeds [37,38,49,50,51,52,53,54,55]. Drivers traveling at higher speeds may need help detecting pedestrians and diminishing their capacity to yield effectively [38]. A notable observation is that only 17% of drivers yielded to pedestrians, even as approximately half of them reduced their speed [36]. The likelihood of conflict escalates with higher vehicle speeds and heavy traffic, with a substantial proportion of drivers (36%) failing to yield to pedestrians under these conditions [36,39].
Conversely, relatively lighter traffic conditions empower drivers to be more confident in yielding to pedestrians, resulting in an approximately 2.5 times increase in the likelihood of yielding. This increased confidence is primarily attributed to the lower probability of rear-end collisions in such scenarios [31]. Regarding vehicle type, motorcycles demonstrated a lower propensity to yield pedestrians than passenger cars (OR = 0.63) [31]. Notably, drivers of passenger cars revealed a 1.82 times higher likelihood of yielding than drivers of other vehicle types, including trucks, vans, and SUVs [27].

2.2.4. Environmental Factors

Environmental and various contextual factors have been identified as influencing yielding behavior, encompassing elements such as roadside parking, bus stops, crosswalk distance, crosswalks with a history of vehicle-pedestrian crashes, land use, and time of day [28,29,30,33,34,39]. The impact of land use on yielding behavior is particularly noteworthy, with drivers demonstrating a heightened willingness to yield at crosswalks near bus stops [29,39,41]. However, bus stops and roadside parking spaces may decrease yielding behavior due to potentially obstructing the view of pedestrians and drivers [29,39].
In summary, the previous research [26,27,28,29,30,31,32,33,34,35,36,37,38,39,42,43,44,45,46,47,48,49,50,51,52,53,54,55] primarily delves into the intricate details of factors influencing driver yielding behavior. However, the aspects of vehicle headway and the post-encroachment time (PET) between vehicles and pedestrians have not been investigated. Regarding the methods for identifying the significant factors, the previous studies relied on linear and binary logistic regressions. These techniques allow for predicting the likelihood of a driver yielding or non-yielding. However, in Thailand, driver behavior encompasses yielding, soft yielding, and non-yielding, with a predominance of non-yield and soft yield behaviors and minimal instances of yield, especially at zebra crossings. This study investigates this issue comprehensively by applying multinomial logistic regression to formulate driver yielding behavior models. The model results would help to understand more insightful information and could help design tailored countermeasures to improve pedestrian safety in mixed traffic conditions. The details of the research methodology are presented in the next section.

3. Research Methodology

This study analyzed the factors influencing driver yielding behavior at crosswalks before and after improvements from a zebra crossing to a smart pedestrian crossing. This section presents detailed information on the research methodology.

3.1. Scope of This Study
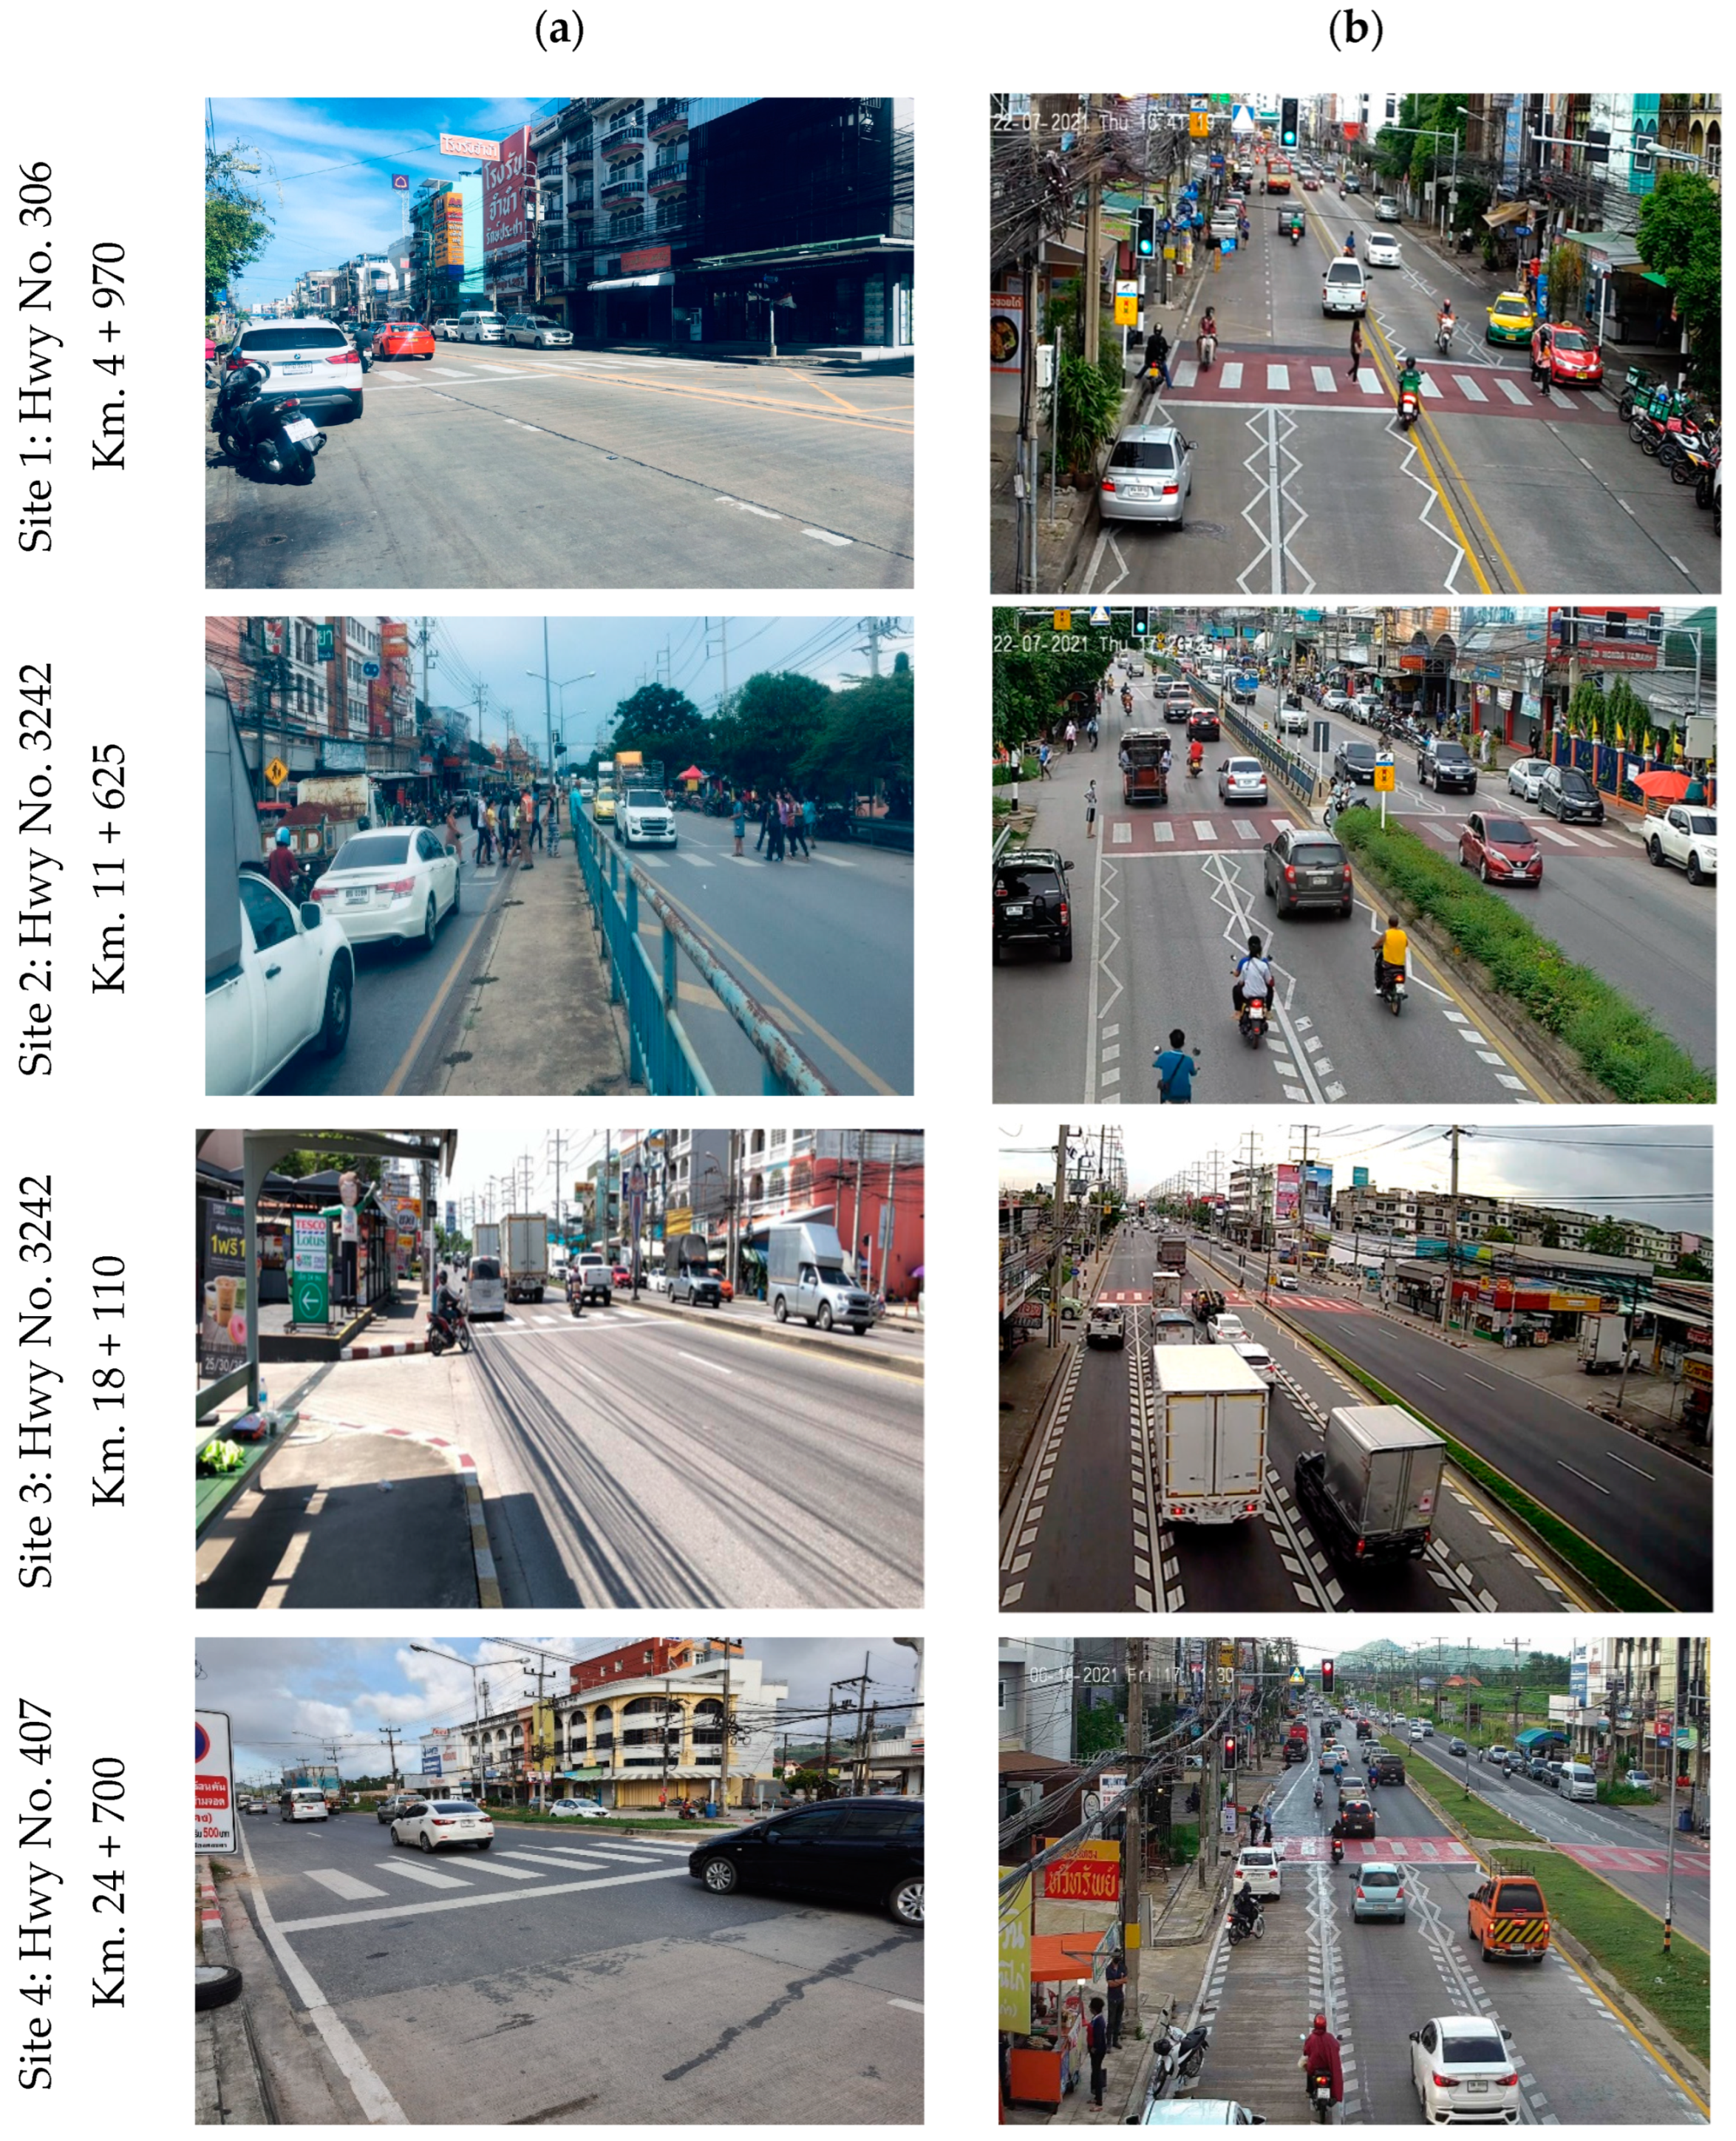
3.1.1. Study Areas

This study was conducted at four midblock crosswalks on arterial urban streets in three provinces across Thailand. As shown in Figure 1, the four crosswalks were upgraded from a typical zebra crossing (C1) to a smart pedestrian crossing (C2), following the guidelines on pedestrian crossing warrants [9,10].
In general, the study sites were crossings with a pedestrian volume of over 135 persons per hour, average daily traffic (ADT) exceeding 12,000, and a posted speed limit greater than 30 km/h on multi-lane roadways. Table 2 presents the details of the study areas with observed pedestrian volume and traffic volume of motorcycles and passenger cars obtained in both directions. For various traffic conditions, the traffic data were collected during morning peak hours (7:00 a.m.–9:00 a.m.) and afternoon peak hours (4:00 p.m.–6:00 p.m.) on weekdays and weekends under fair weather conditions. It was observed from all sites that passenger cars comprise the majority (58%), followed by motorcycles (34%), and other vehicles (8%), respectively. Thus, this study focused only on passenger cars and motorcycles.

3.1.2. Types of Crosswalks

This study selected two types of crosswalks for the analysis: a typical zebra crossing (C1) and a smart pedestrian crossing (C2). The first type, the zebra crossing (Figure 1a), is characterized by longitudinal stripes on the road, alternating black and white stripes, and white stop lines across the street. In contrast, a smart pedestrian crossing (Figure 1b) is installed with more detailed markings and traffic signals. This layout includes additional elements, such as OSB, zig–zag lines, a red-painted area, and flashing warning lights. Moreover, a smart pedestrian crossing system is implemented. The system detects pedestrian and vehicle traffic flows. It uses these data to determine the optimal signal timing, allowing pedestrians not to wait too long to cross safely and corresponding to vehicle traffic entering the crosswalk.

3.2. Data Collection

3.2.1. Driver Yielding Behavior

Field observations were conducted using video recordings to investigate pedestrian and vehicle interactions at the crosswalk areas. The observations were conducted during the morning and afternoon peak hours due to higher traffic exposure, which increases conflicts (and crash risks) between pedestrians and vehicles. This study defines interactions between pedestrians and drivers in vehicles, considering an event when a pedestrian starts a crossing stage on the road, attempting to cross from the footpath to the first traffic lane, and crossing the area to another footpath. This study investigated whether there was an interaction in an event if the pedestrian crossed and at least one vehicle was approaching. Therefore, the driver had to decide to yield. Subsequently, for each event with interaction, it was recorded whether the first vehicle approached the crossing and if any car (the first or any subsequent vehicles) yielded to pedestrians.
The data collection for before–after studies on driver yielding behavior was carried out before crosswalk improvements, specifically in the case of zebra crossing (C1). After upgrading to the smart pedestrian crossing (C2), the driver yielding behavior was collected six months after the upgrade. These data collection allows for a comprehensive examination of the changes in driver yielding behavior before and after the crosswalk upgrade.
Following the previous research [20,21,22,23], three yielding patterns, which include non-yield (NY), soft yield (SY), and yield (Y), were examined in how a driver approached crosswalks. However, in this study, the definitions of NY, SY, and Y were revised to ensure clarity in characterizing the drivers’ actions in C1 and C2, as shown in Table 3.

3.2.2. Roadway Characteristics

A comprehensive examination of the physical attributes of the four study road sections was conducted. This investigation encompassed a detailed assessment of various factors. Table 4 presents the variables considered in driver yielding behavior modeling. Regarding roadway characteristics, the factors include the width and length of traffic lanes, median, sidewalks, and shoulders. In addition, road surface conditions, road markings, width and length of the crosswalk, condition of stop lines, warning signs, speed limit signs, pedestrian refuge island, roadside parking, and surrounding land use were examined.

3.2.3. Pedestrian Characteristics

The pedestrian characteristics of the study sections were investigated. As shown in Table 4, this study divided the vulnerable groups into two categories: the non-vulnerable group (male and adult) and the vulnerable group (female, children, and elderly), following the previous research [34,35,46,47,48]. The other pedestrian characteristics included the number of pedestrians crossing at the crosswalk area, the position of the pedestrian waiting area, the pedestrian waiting times, and the pedestrian crossing time. Note that the number of pedestrians was counted per vehicle stop (yield) for pedestrians. This process allows individuals to distinguish whether they are alone or in a group.

3.2.4. Traffic Characteristics

Field observations were conducted to collect the traffic characteristics at each study site. As shown in Table 4, the factors include the type of the first vehicle entering a crosswalk area (motorcycle or passenger car), the spot speed of the first vehicle, the total number of vehicles entering the crosswalk area, the headway between the first and second vehicles entering the crosswalk area, and the post-encroachment time (PET) between the first vehicle and pedestrian(s). Additionally, roadside parking was observed to assess its effect on yielding behavior. In this study, the spot speed of a vehicle was examined 25 m before the stop line because, beyond this distance, some entrances/exits and roadside activities could affect the vehicle speed. Furthermore, roadside parking within the study crosswalk area is prohibited; thus, this study observed roadside parking three meters away from the crosswalk.

3.2.5. Summary of Variables in Driver Yielding Behavior Modeling

As shown in Table 4, the dependent variables consist of non-yield (NY), soft yield (SY), and yield (Y), with NY serving as the reference category. On the other hand, most explanatory variables are chosen following the significant factors from the previous research [26,27,28,29,30,31,32,33,34,35,36,37,38,39,42,43,44,45,46,47,48,49,50,51,52,53,54,55], as depicted in Table 1. However, this study introduces the vehicle headway and the PET between the first vehicle and pedestrian(s).
The variables incorporated into MLR modeling were categorized as dichotomous data and continuous variables. When employed as independent variables, the dichotomous variables were set to values of 0 or 1. On the other hand, the continuous variables were directly integrated into the MLR model development. Note that this study involved observing at least 400 vehicle drivers entering each type of crosswalk at a study site, ensuring an ample dataset for thoroughly analyzing the variables considered in this study.

3.3. Data Analysis

The data analysis is divided into two parts: the descriptive statistics of variables and yielding behavior modeling. The details are discussed in the next subsections.

3.3.1. Descriptive Statistics of Observation Variables

Descriptive statistics of the collected variables were employed to explain the likelihood of driver yielding behavior and the distribution of observed variables. This summary encompassed vital measures, including the frequency distribution, central tendency (mean), and variability (standard deviation).

3.3.2. Yielding Behavior Modeling

In this study, a series of multinomial logistic regression (MLR) models was developed to identify roadway, pedestrian, and traffic characteristics associated with driver yielding patterns for two different types of crosswalks in the four study areas.
In MLR modeling, the dependent variable (Y) is categorized into three types: non-yield, soft yield, and yield to pedestrians. These categories are coded numerically for analysis: 0, 1, and 2, respectively. Interpreting the coefficients allows us to understand the impact of each predictor variable on the log odds of being in a particular yielding behavior category compared to the reference category (i.e., 0 = non-yield). Following [56,57], the MLR model describing the log odds of driver yielding, Y is defined as:
L o g i t P r Y = 1 = ln P r Y = 1 1 P r Y = 1 = β 0 + β 1 x 1 i + β 2 x 2 i + + β k x k i + ε i
where Pr(Y = 1) is the probability of a driver i yielding to pedestrian(s), xki is the kth independent variable for the ith observation (i.e., driver), β0 is the model constant, βk is a parameter that defines the relationship between each independent variable in xki and the probability of a driver yielding the right of way, and εi is the error term predictor variables in the model.
The parameters in Equation (1) are typically determined using maximum likelihood estimation. The following equation provides the probability estimates for the driver’s yield response:
P r Y = e x p ( β 0 + β 1 x 1 i + β 2 x 2 i + + β k x k i + ε i ) 1 + e x p ( β 0 + β 1 x 1 i + β 2 x 2 i + + β k x k i + ε i )
The model in Equation (2) allows for determining the effect of each predictor on the odds of Y. More specifically, the odds ratio (OR) value represents the multiplicative factor of the odds of Y when the independent variable xki increases by one unit, with all other factors remaining constant. In other words, the odds ratio indicates the relative amount by which the odds of an outcome increase (OR > 1) or decrease (OR < 1) when the value of the corresponding independent variable increases by one unit [56,57]. The odds ratio of the event or outcome is calculated using Equation (3).
OR ( P r Y = e β 0 + β 1 x 1 i + β 2 x 2 i + + β k x k i + ε i
The modeling was completed in two stages. In the first stage, predictors that should be used to develop an MLR model were identified through hypothesis testing. Pearson Chi-square tests assessed associations between the factors and driver yield behavior. The factors with significance at 0.05 were selected for further regression analysis.
Predictors found to be significant, at least at the 95% confidence level (p < 0.05) in hypothesis testing, were considered for the MLR model estimation in the second stage. After developing the model, the model’s fitness with the data was checked by examining the results of the model statistics and the Hosmer–Lemeshow test [58,59,60].
This study developed the MLR models for the four study sites: MLR1 for Site 1 (Hwy No. 306 Km. 4 + 970), MLR2 for Site 2 (Hwy No. 3242 Km. 11 + 625), MLR3 for Site 3 (Hwy No. 3242 Km. 18 + 110), and MLR4 for Site 4 (Hwy 407 Km. 24 + 700). The data from all four study sites were combined to formulate the MLR5 model for a comprehensive analysis. At each site, the MRL model was divided into two submodels: MRL(C1) for the case of zebra crossing and MRL(C2) for the case of smart crossing. Thus, a total of 10 MRL models were formulated in this study.

4. Results and Discussion

This section is divided into three subsections. The first part presents the distribution of driver yielding behavior. The second part presents the results of the descriptive statistics of the observed variables. The last part presents the factors influencing driver yielding behavior. The details are explained in the next subsections.

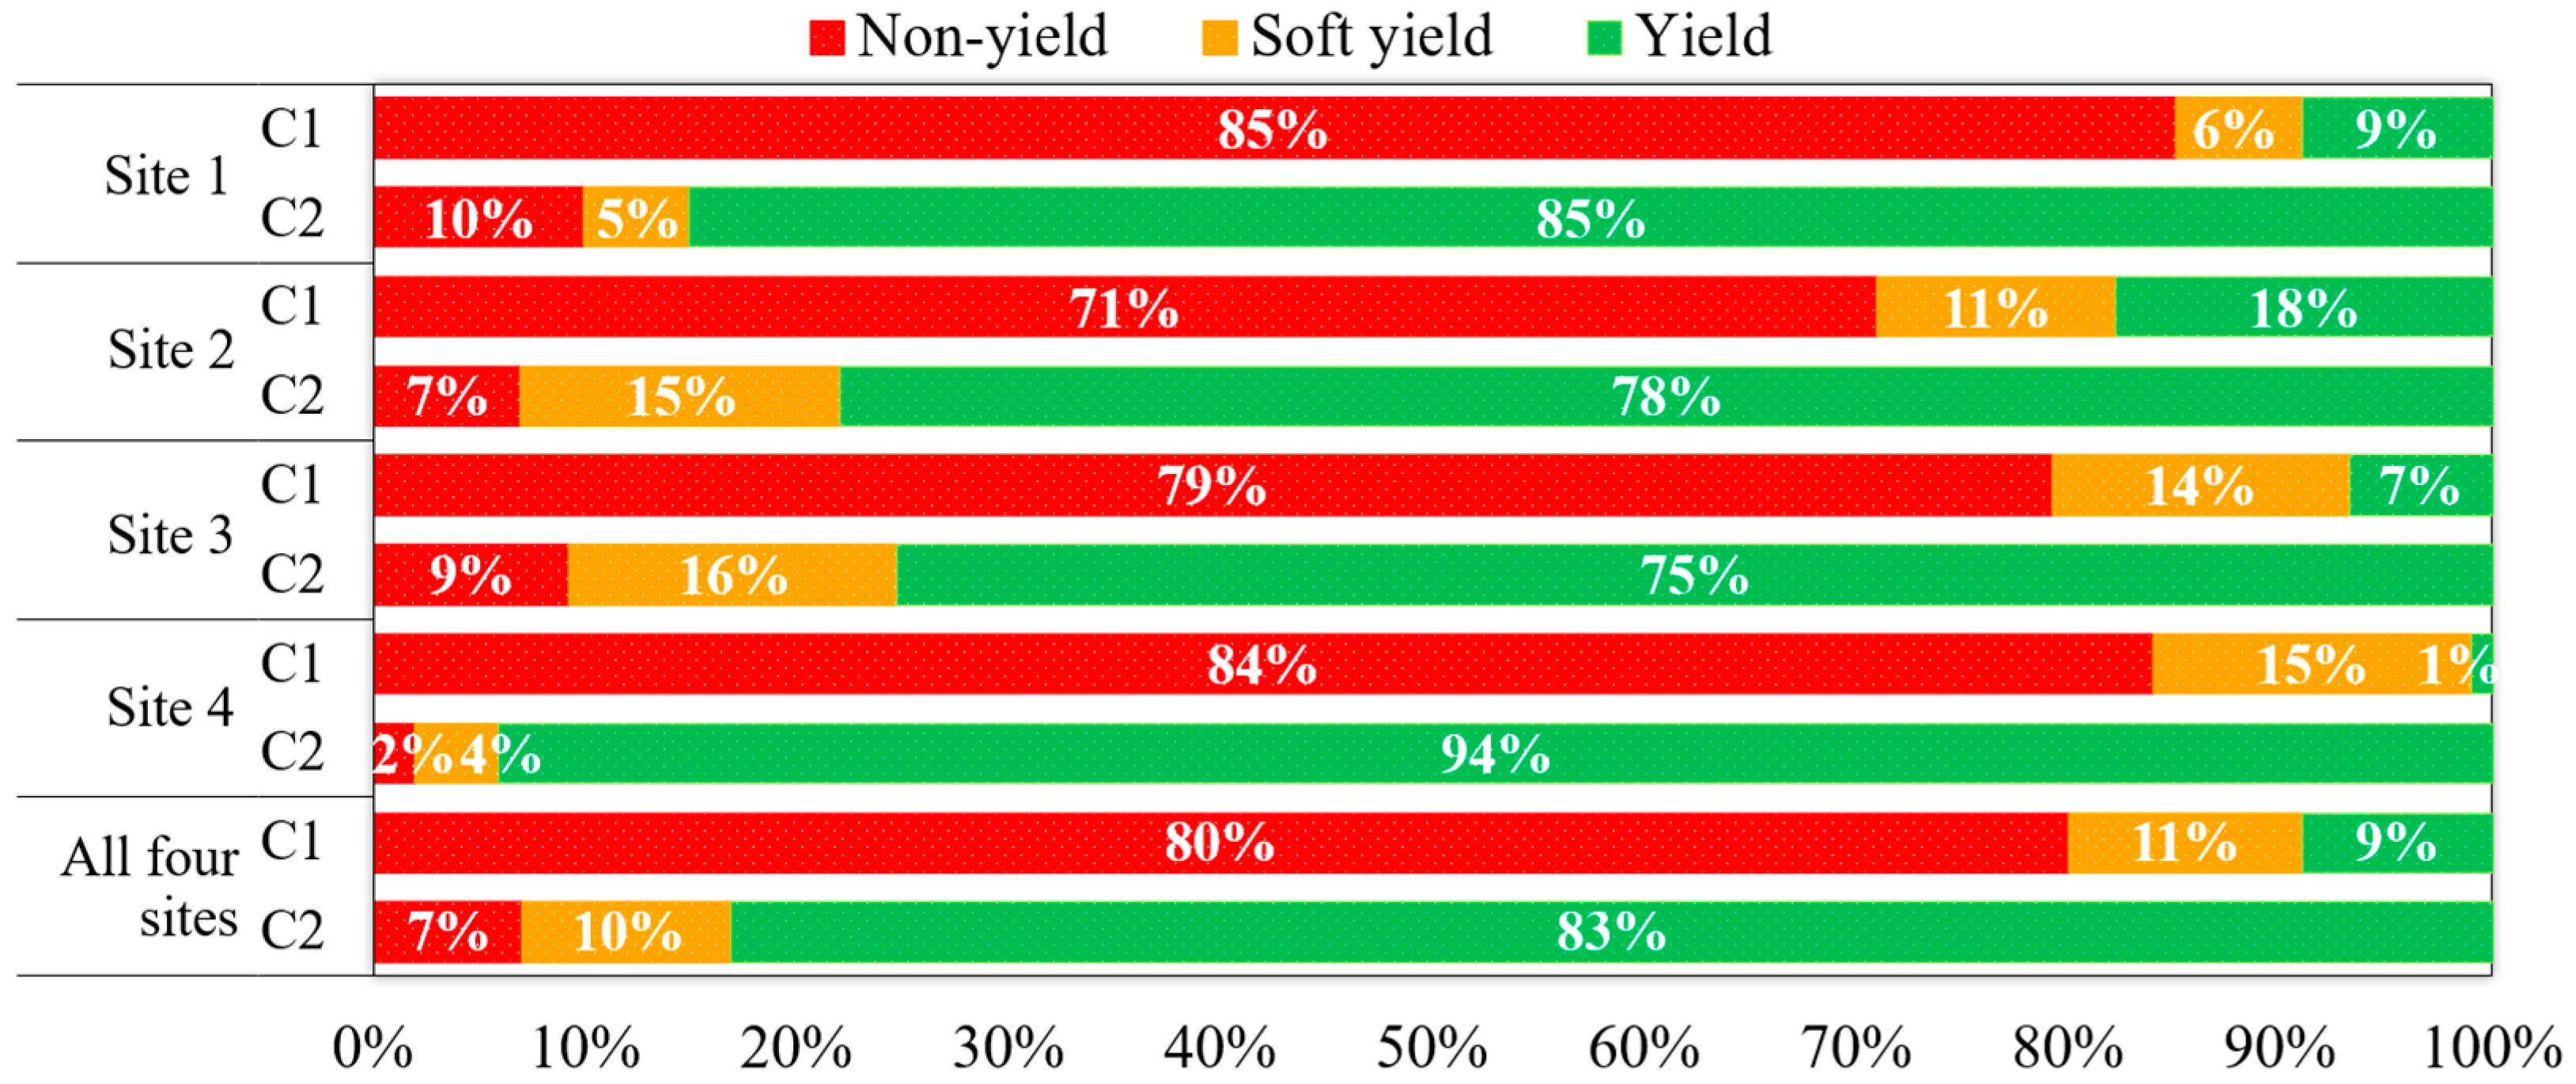
4.1. Distribution of Driver Yielding Behavior

Figure 2 presents the results of the descriptive statistics of driver yielding behavior. The results reveal a statistically significant difference in yielding behavior between the crosswalk layouts. For C1, over 70% of drivers do not yield at the crosswalk, less than 12% yield softly, and fewer than 9% yield. In contrast, C2 exhibits a notable improvement trend, signifying a substantial positive impact on drivers’ yielding behavior across diverse locations. The findings show a nearly 100% increase in the percentage of drivers yielding, accompanied by a considerable decrease in drivers non-yielding before reaching the crosswalk. This observed improvement underlines the effectiveness of interventions associated with C2 and emphasizes its potential to positively influence yielding behavior at various locations. This finding implies that the differences in yielding behavior at the two crosswalk types are due to the different perceptions that might prompt the drivers to be more cautious. These differences are caused exclusively by the driver’s behavior at the approach to the crosswalk, especially when the timing of the traffic signal plays a significant role in influencing driver behavior. If the signal provides sufficient time for pedestrians to cross safely and is well coordinated with the traffic flow, drivers are more likely to yield.
The results also indicate that a minority of drivers in C2 still engage in risky behaviors. These behaviors include disobeying traffic rules before reaching the crosswalk area and accelerating during the yellow light or at the beginning of the red-light phase. During the initial phase of the red light, a subset of vehicles exhibited behaviors that enhanced pedestrian safety, particularly during peak hours. Some drivers opted to slow down and wait for pedestrians to cross the road to a pedestrian refuge island. Subsequently, they carefully assessed for a safe gap at the signal stage before proceeding through a crosswalk. These results aligned with our previous study [18]. We evaluated the effectiveness of improving a midblock zebra crossing to a zebra crossing with traffic markings and warning signs, and finally to a smart pedestrian crossing. The results revealed a statistically significant increase of approximately 40% in drivers’ yielding behavior after improving the zebra crossing, with an even more substantial difference of approximately 96% observed after upgrading to the smart crossing. These results underscore the importance of upgrading zebra crossings to smart pedestrian crossings.
Moreover, this study determined the 85th percentile speeds of MC and PC to describe the different driving behaviors while entering a crosswalk before and after upgrading from C1 to C2. As presented in Table 5, for C1, the 85th percentile speeds of MC were 78, 72, and 65 km/h in the cases of NY, SY, and Y, respectively. Similarly, for PC in C1, the 85th percentile speeds were 93, 82, and 75 km/h for NY, SY, and Y, respectively. After the installation of C2, enhancements such as traffic markings, traffic signs, and traffic signal lamps improved drivers’ visibility. Consequently, drivers consistently and significantly reduced their vehicle speeds. The 85th percentile speeds of MC were 65, 58, and 50 km/h in the cases of NY, SY, and Y, respectively. Similarly, for PC, the 85th percentile speeds consecutively were 77, 69, and 61 km/h for NY, SY, and Y. However, these 85th percentile speeds were still high. Notably, the minimum speed drivers adopt to yield to a pedestrian (calculated from the 15th percentile speed) in the cases of C1 and C2 were still far from the safe speed for pedestrians (i.e., 30 km/h). These high speeds were due to various factors, including drivers’ non-compliance with the posted speed limit, shortcomings in enforcing traffic regulations, and insufficient implementation of traffic-calming measures.

4.2. Results of Descriptive Statistics of Observed Variables

The results of the descriptive statistics of observed variables presented in Table 6 show that the percentage of the vulnerable group (female, children, and elderly) was considerably higher than the non-vulnerable group (male and adult). Examination of the distribution of pedestrian waiting areas on sidewalks revealed proportions ranging from 58.2% to 78.6%. The proportion of vehicles at all sites showed that PCs accounted for more than 60% of the vehicles, followed by MCs. Additionally, in the case of C1, most drivers exhibited behavior indicating that roadside parking near a crosswalk was expected, with more than 52.4% of drivers engaging in this practice. Subsequently, after the upgrade to C2, the impact on driver behavior, particularly their adherence to traffic laws and regulations, was evident. There was a significant reduction in the percentage of roadside parking, ranging from 28.6% to 31.7%.
The results of the temporal distribution of continuous variables presented in Table 7 show that the average number of pedestrians crossing at crosswalks each time ranges from 2.1 to 3.7 persons/stop-yield. The longer pedestrian waiting time and crossing time in the case of C1 increase the trend of risky crossing behavior. The C2 includes sensors that detect pedestrians waiting, optimize pedestrian signal phases, and significantly reduce waiting times. The results of average vehicle speed for MCs and PCs in the C1 and C2 indicated that they decreased substantially after the C2 improvements. The number of vehicles approaching and traversing the crosswalk decreased, ranging from 2.5 to 4.5 vehicles. This reduction enhances drivers’ visibility and ability to monitor traffic flow, resulting in more orderly vehicle movement. The results of headway between the first and second vehicles in the case of C2 were higher than those in the case of C1, posing decreased challenges for drivers in terms of identifying suitable gaps and times to yield to pedestrians. Regarding the post-encroachment time (PET) between the first vehicle (i.e., MC or PC) and pedestrian(s), the higher PET after C2 implementation contributed to a reduction in the crash risk and the severity level in the case of a collision.

4.3. Factors Influencing Driver Yielding Behavior

This section presents the significant factors influencing driver yielding behavior, and a comparative analysis of the results sheds light on the influence of factors across two different types of crosswalks (C1 and C2). Table 8 and Table 9 present the p-value, obtained from the Pearson Chi-square test, of all factors considered in the 10 proposed MLR models. Notably, each study site was divided into two sub-MLR models for the cases of C1 and C2.
In general, regarding MLR5 models, the significant influencing factors include the number of traffic lanes (x1), traffic lane width (x2), crosswalk width (x3), crosswalk length (x4), vulnerable group (x6), the number of pedestrians (x7), the speed of the first vehicle entering a crosswalk (x12), the number of vehicles entering a crosswalk (x13), headway between the first and second vehicles (x14), the PET between the first vehicle and pedestrian(s) (x15), and the presence of roadside parking (x16). These factors were identified as the most influential factors affecting driver yielding behavior, demonstrating statistical significance in predicting the probability of drivers yielding (Y) and soft yield (SY) compared to non-yield (NY).
Moreover, the resulting factors demonstrate a distinction in pedestrian crossing time (x10) as a significant factor influencing the yielding behavior of C1 but showing insignificance in the case of C2. The design and timing of signalized crosswalks can be optimized to facilitate efficient traffic flow. When pedestrian crossing time is well-coordinated with traffic signal phases, drivers may not perceive it as a significant factor influencing their yielding behavior and, as a result, may not alter their behavior based on this factor.
Table 8 and Table 9 also reveal that most observed factors correlate significantly with yield behavior occurrences. These factors were further used to describe the chance of NY, SY, and Y occurrences by applying the MLR technique. To ensure the consistency of the model, the driver yielding behavior of MLR1–MLR5 models was validated. The data extracted from the obtained model were evaluated. A comparison of the results from the prediction by the model and the actual observation showed that the model of the driver yielding behavior could correctly predict over 85% of the data. The coefficient estimates, their t-statistics, and the parameters for the utility functions confirmed that the model was well-fitted. Moreover, the ρ2 values in the tables indicated strong models regarding the overall goodness of fit. The results of MLR models are presented in Table 10 and Table 11.
The factors that consistently influence predicting driver yielding behavior across all MLR1–MLR4 models include the vulnerable group (x6), the speed of the first vehicle (x12), vehicle headway (x14), the PET (x15), and roadside parking (x16). This potential influence is mainly derived from perception and the display of similar behavioral characteristics. However, there are differences in the result of factors such as the number of pedestrians (x7), pedestrian crossing time (x10), and the number of vehicles (x13). One likely reason for these differences is the roadway characteristics (i.e., the number of traffic lanes, traffic lane width, crosswalk length, and the presence of refuge island) and environmental factors (i.e., roadside activities and land use of the road section).
The factors significantly correlated with yield behavior occurrences across all MLR1–MLR4 models were consistent with the MLR5 model. MLR5 can be considered representative for explaining overall behavior at all sites due to its consistency and comparability of data. This conclusion is supported by the results of the coefficient estimates and the parameters for the utility functions, all of which confirmed that the model was well-fitted.
The results of the MLR5 model revealed that factors related to roadway characteristics, such as the number of traffic lanes (x1), the width of a traffic lane (x2), the width of the crosswalk (x3), and the length of the crosswalk (x4), are significantly associated with driver behavior. In the case of C1, the positively signed coefficients are statistically significant in relation to driver Y and SY behaviors compared to NY. These results were expected and proved the hypothesis of this study. In urban areas, arterial roadways provide multiple lanes and overly wide lane widths (more than 3.0 m). Similarly, the C2, the positively signed coefficient, is statistically significantly associated with driver Y and SY behaviors compared to NY. The presence of OSB and zig–zag lines may serve as a visual cue for drivers to yield to pedestrians, and red-painted areas on the crosswalk lead to an improvement in clear driving visibility when approaching the crosswalk area. Implementing C2 significantly and positively impacts driver yielding behavior across various locations. It was designed to manage multi-lane traffic and the physical characteristics of the crosswalk, which are effective in accommodating mixed traffic conditions. These findings align with previous studies’ conclusions regarding the number of traffic lanes [27,32,34,35,42,43]. The width of traffic lanes (as indicated by previous research [26]), along with the width and length of the crosswalk [27,28,29], were identified as factors that affect drivers’ inclination to yield.
The presence of pedestrian refuge islands (x5) did not significantly influence predicting driver yielding behavior, which could be attributed to drivers perceiving refuge islands as a standard feature of crosswalks, and their presence may not considerably alter driver behavior. The effectiveness of a pedestrian refuge island in influencing driver behavior may depend on its visibility and design. If the island is not visible or well integrated into the road environment, drivers may not recognize it as a significant factor affecting their yielding behavior. This finding is inconsistent with previous studies conducted in the United States [27], India [32], and Poland [33]. The inconsistency may be due to the differences in enforcement practices and adherence to traffic rules across countries.
The key findings highlight three pedestrian characteristics, namely, the vulnerable group (x6), the number of pedestrians (x7), and pedestrian crossing time (x10), which are statistically significantly associated with yielding behaviors. The vulnerable group tended to perform Y (compared to NY) at 0.533 and 0.648 times in the cases of C1 and C2, respectively. At the same time, the vulnerable group tended to perform SY at 0.459 and 0.667 times in the cases of C1 and C2, respectively. This finding is consistent with the results of previous studies [34,46].
Meanwhile, the number of pedestrians (x7) significantly influenced the probability of yielding behavior. It tended to perform Y (compared to NY) at 0.552 and 0.639 times in the cases of C1 and C2, respectively. The number of pedestrian crossings tended to perform SY at 0.471 and 0.574 times in the cases of C1 and C2, respectively. It was observed that pedestrians crossing in a group tended to walk slower than when crossing alone. This finding is consistent with that of a previous study [27,28,29,30,31,34,36,37]. Thus, drivers exhibited a higher tendency to yield when there were multiple pedestrians waiting to cross. A pedestrian group of more than one person and the significant distance between the vehicle and the pedestrian reduce the likelihood of conflicts between them.
Regarding the pedestrian crossing time (x10) of C1, it significantly influenced the probability of yielding behaviors and tended to perform Y and SY at 0.684 and 0.506 times, respectively. If a pedestrian crosses quickly, drivers may perceive the crossing as less risky, potentially leading to a higher likelihood of yielding. Moreover, on average, pedestrians crossing in a large group walked at a slower crossing time than those crossing with a small group or alone. This finding is consistent with the previous research [30], which observed an increase of 50% in yielding behavior. However, it is essential to consider the various factors that impact pedestrian crossing time, as it is a complex interplay of multiple variables, including traffic conditions, the age and physical ability of pedestrians, the specific circumstances of the crossing, and long crosswalks that may disrupt the traffic flow, potentially leading to differences in yielding behavior.
The position of the pedestrian waiting area (x8) did not significantly influence the prediction of driver yielding behavior. The unmarked area and visibility in the pedestrian waiting area, possibly obscured by any barriers, may render its specific position less critical. Drivers are more inclined to respond to visible signals, such as traffic lights and pedestrian signals, rather than placing significant importance of the pedestrian waiting area. This finding is inconsistent with previous studies [27,28,35,37]. It is possible that the locations in the earlier studies had specific design elements and regulations that were more effective in shaping driver conduct. The lack of influence in Thailand may be due to a combination of factors, including insufficiently compelling design elements in the pedestrian infrastructure and different behavioral norms among drivers.
The pedestrian waiting time (x9) did not significantly influence the prediction of driver yielding behavior. The pedestrian waiting area is not highly visible; drivers may not be aware of the time when pedestrians have been waiting. This lack of awareness can reduce the impact of waiting time on driver behavior. Drivers may prioritize other immediate factors, such as road conditions, the presence of different vehicles, and the traffic flow, which may have influenced the importance of pedestrian waiting time. This result is inconsistent with a previous study in India [32], the United Arab Emirates [34], and the Czech Republic [36]. Longer pedestrian waiting times can trigger impatience and frustration, prompting risky behaviors like crosswalking or disregarding traffic signals. This increase in pedestrian violations due to prolonged waits can heighten safety concerns and impact driving behaviors, potentially leading to more pedestrian–vehicle conflicts and a higher risk of crashes. Drivers may react by becoming more cautious, anticipating unpredictable pedestrian movements, or feeling pressured to yield quickly, which could result in abrupt maneuvers or last-minute braking, increasing the risk of rear-end collisions.
Regarding traffic characteristics, the type of first vehicle entering a crosswalk area (x11) did not significantly influence the driver yielding behavior. Regardless of their vehicle type, drivers tend to exhibit similar compliance with traffic rules. Also, the overall behavior of the driver, rather than the specific vehicle type, may be more noticeable in their perception. This finding is inconsistent with previous research [27,30,31,32,37,50], which attributed variations in the level of compliance among drivers, the prevalence of different vehicle types in mixed traffic conditions, and differences in the perceived roles of various vehicles in traffic.
One worrying and widespread behavior observed in the current study was that the predictors related to the primary cause of vehicle-pedestrian collisions and yielding behavior are the speed of vehicles entering a crosswalk (x12). As expected, positive signed coefficients of the speed tended to perform Y at almost 0.750 times and SY at nearly 0.775 times. At higher speeds, drivers may have a limited reaction time, leading to a reduced stopping sight distance for safe detection and reaction to pedestrians and an increased stopping distance required for vehicles. This finding aligns with previous studies’ conclusions [30,33,36,37,38,39]. A vehicle moving at high speeds can make it difficult for the driver to perceive their surroundings, including pedestrians at crosswalks.
The number of vehicles entering a crosswalk (x13) significantly influenced the probability of Y at 0.509 and 0.633 times in the cases of C1 and C2, respectively. This finding implies that drivers may be able to give way to pedestrians in congested traffic due to the slow movement of traffic. Drivers may be more willing to Y (or SY) pedestrians. In situations with more vehicles, drivers are more confident in yielding to pedestrians, mainly because it would lessen the likelihood of rear-end crashes. Higher yielding was observed when another vehicle followed the leading vehicle. For instance, when the first vehicle’s driver yielded, it caused the vehicle behind it to stop. This finding is consistent with previous studies [27,28,30,31,35,37], which illustrate that the number of vehicles approaching crosswalks can impact driver yielding behavior. In areas with a higher concentration of vehicles, drivers may face traffic congestion or slower traffic flow. Under such circumstances, drivers may be more inclined to stop and let pedestrians cross the road.
An exciting discovery of this study is that new factors were not previously identified in previous studies. Among these newly identified factors are the headway between the first and second vehicles (x14) and the PET between vehicles and pedestrians (x15). The vehicle headway (x14) influences the probability of Y and SY behaviors by performing Y at 0.452 and 0.692 times in the case of C1 and C2, respectively. The headway of vehicles tended to perform SY at 0.357 and 0.557 times, respectively. This finding suggests that maintaining a longer headway between vehicles enables drivers to maintain safe distances and respond effectively, thus increasing the likelihood of yielding to pedestrians. Conversely, when vehicles are closely spaced with shorter headways, drivers may struggle to find opportunities to yield, feeling pressured to maintain traffic flow. A longer headway gives drivers more time and space to notice pedestrians, fostering increased awareness and safer yielding behaviors.
A general look at the PET between vehicles and pedestrians (x15) showed that it influenced the proximity and interaction between pedestrians and vehicles by performing Y at 0.582 and 0.625 times in the case of C1 and C2, respectively. This finding may be associated with a conflict that reflects the level of pedestrian safety at a crosswalk area.
Our results also hold implications for roadside parking (x16) as one of the main factors influencing the drivers’ tendency toward Y and SY behaviors at the crosswalk area. The MLR models’ results revealed that the drivers without roadside parking at the crosswalk areas of C1 and C2 tended to perform Y at almost 0.660 times and SY at nearly 0.570 times, higher than those with roadside parking. This result is consistent with the previous research [35]. One likely reason for the absence of roadside parking at the crosswalk area is associated with improved visibility for drivers observing pedestrians crossing.

5. Conclusions and Recommendations

This study investigated the impact of upgrading midblock crosswalks on urban arterial roads in Thailand from zebra crossings (C1) to smart pedestrian crossings (C2) on driver yielding behavior. The findings reveal a significant positive influence of the C2 upgrade on drivers yielding. The probability of drivers yielding at C2 increased by 74% compared to C1. The upgrade led to a reduction in vehicle speeds. The 85th percentile speeds of motorcycles (MC) and passenger cars (PC) approaching the crosswalk decreased by 18 km/h and 14 km/h, respectively, before yielding to pedestrians.
This study also found that drivers were more likely to yield to pedestrians crossing in groups (platoons). Additionally, lower vehicle speeds, vehicles traveling in platoons, increased headway (distance between vehicles), and longer post-encroachment time (PET, time between pedestrians entering a crosswalk and vehicle stopping) were all associated with a higher probability of driver yielding.
These findings suggest that upgrading midblock crosswalks to smart pedestrian crossings can significantly improve pedestrian safety by promoting driver yielding behavior. Additionally, this study highlights the importance of factors such as vehicle speed, pedestrian behavior, and traffic flow characteristics in influencing driver yielding decisions.
This study explores countermeasures to improve pedestrian safety at midblock crosswalks. For C1 zebra crossings, this study emphasizes traffic lane design as a primary factor influencing driver yielding behavior. Reducing lane width and incorporating red-painted areas are proposed to encourage “soft yielding” and complete stops. Additionally, physical improvements such as warning lights, street furniture, rumble strips, and clear pavement markings are recommended to enhance driver awareness of crosswalks.
Pedestrian safety can be further improved by reducing crossing distance. The report suggests implementing curb extensions and lowering curbs to shorten the time pedestrians spend exposed to traffic. Optimizing pedestrian crossing times can be achieved through curb extensions, tactile warnings, improved lighting, and staged crossings.
Traffic-calming measures are also recommended for C1 crosswalks. Raised pedestrian platforms and radar speed signs are proposed to reduce vehicle speeds, while stricter enforcement of existing roadside parking regulations can improve visibility and reduce conflicts. This study advocates for exploring road design changes, such as narrowing lanes and managing roadside parking through driveway restrictions near crosswalks, to create a safer pedestrian environment.
While C2 crossings use smart technology, this study highlights the importance of complementary physical upgrades. Signs and rumble strips can further emphasize lane narrowing for drivers, while dropped curbs and curb extensions can physically guide pedestrians and encourage driver yield.
The report emphasizes combining physical changes with additional traffic-calming measures. Raised pedestrian platforms equipped with traffic signals, pedestrian hybrid beacons (PHB), pelican crossings, and puffin crossings are all recommended for enhanced safety.
Enforcement strategies are crucial for C2’s effectiveness. This study suggests utilizing violation detection cameras, radar speed signs, license plate recognition (LPR), and other monitoring tools to ensure driver compliance with traffic regulations, particularly regarding yielding to pedestrians. The strict enforcement of existing roadside parking regulations is also emphasized to maintain optimal visibility and minimize pedestrian–vehicle conflicts.
This study only accounted for typical weather and daylight conditions. Further research may explore other factors, such as day/night variations, a more comprehensive range of weather conditions, and land use. Additionally, the impact of non-peak hour traffic and other safety issues should be examined, including rear-end collisions, the presence of advertising panels, different traffic signal controls, and pedestrian behavior at midblock crosswalks.

Author Contributions

Conceptualization, P.P., P.L., S.J. and N.K.; methodology, P.P., P.L., and S.J.; validation, P.P., P.L. and S.J.; formal analysis, P.P.; data curation, P.P.; writing—original draft preparation, P.P., P.L., S.J. and N.K.; writing—review and editing, P.P., P.L., S.J. and N.K. All authors have read and agreed to the published version of the manuscript.

Funding

This research study was supported by Faculty of Engineering, Academic year 2022, Prince of Songkla University, Thailand.

Institutional Review Board Statement

Not applicable.

Informed Consent Statement

Not applicable.

Data Availability Statement

The datasets used and analyzed during the present study are available on reasonable request from the corresponding author.

Conflicts of Interest

The authors declare no conflicts of interest. The funders had no role in this study’s design, data collection, analysis, interpretation, manuscript writing, or decision to publish the results.

References

  1. Chaudhari, A.; Gore, N.; Arkatkar, S.; Joshi, G.; Pulugurtha, S. Exploring pedestrian surrogate safety measures by road geometry at midblock crosswalks: A perspective under mixed traffic conditions. IATSS Res. 2020, 45, 87–101. [Google Scholar] [CrossRef]
  2. World Health Organization (WHO). Pedestrian Safety: A Road Safety Manual for Decision-Makers and Practitioners; World Health Organization: Geneva, Switzerland, 2013; Available online: https://www.who.int/publications/i/item/pedestrian-safety-a-road-safety-manual-for-decision-makers-and-practitioners (accessed on 25 October 2023).
  3. World Health Organization (WHO). Global Status Report on Road Safety 2018; WHO: Geneva, Switzerland, 2018; Available online: https://www.who.int/publications/i/item/9789241565684 (accessed on 25 October 2023).
  4. World Health Organization (WHO). Global Status Report on Road Safety 2023; WHO: Geneva, Switzerland, 2023; Available online: https://www.who.int/publications/i/item/9789240086517 (accessed on 25 October 2023).
  5. Department of Highways. Traffic Accidents on National Highways; Bureau of Highway Safety, Department of Highways, Ministry of Transport: Thailand, Bangkok, 2022. Available online: http://bhs.doh.go.th/download/accident (accessed on 30 October 2023).
  6. Department of Disease Control. Road Accident Fatalities 2011–2022; Road Accident Fatalities Integration System (3 Bases); Injury Prevention Division, Department of Disease Control: Bangkok, Thailand, 2022.
  7. Bangkok Post Public Company Limited. Cop Charged with Reckless Driving, Causing Female Doctor’s Death. Available online: https://www.bangkokpost.com/thailand/general/2252131 (accessed on 21 April 2024).
  8. United Nations Thailand. The Sustainable Development Goals in Thailand/Good Health and Well-Being. Available online: https://thailand.un.org/en/sdgs/3 (accessed on 21 April 2024).
  9. Road Safety Administration Center. Thailand Road Safety Master Plan 2022–2027; Department of Disaster Prevention and Mitigation, Ministry of Interior: Bangkok, Thailand, 2023.
  10. Department of Highways. A Study on Guidelines for the Installation of Safe Pedestrian Crossings; Bureau of Highway Safety, Department of Highways, Ministry of Transport: Bangkok, Thailand, 2023. Available online: http://www.doh.go.th/project/detail/66334 (accessed on 30 October 2023).
  11. Federal Highway Administration (FHWA). Guide for Improving Pedestrian Safety at Uncontrolled Crossing Locations; Report No. FHWA-SA-17-072; FWHA: Washington, DC, USA, 2018.
  12. Schneider, J.; Sanders, L. Pedestrian safety practitioners’ perspectives of driver yielding behavior across North America. Transp. Res. Rec. 2015, 2519, 39–50. [Google Scholar] [CrossRef]
  13. Siddiqui, A.; Chu, X.; Guttenplan, M. Crossing locations, light conditions, and pedestrian injury severity. Transp. Res. Rec. J. Transp. Res. Board 2006, 1982, 141–149. [Google Scholar] [CrossRef]
  14. Barton, B.K.; Kologi, S.M.; Siron, A. Distracted pedestrians in crosswalks: An application of the theory of planned behavior. Transp. Res. Part F 2016, 37, 129–137. [Google Scholar] [CrossRef]
  15. Zegeer, V.; Stewart, R.; Huang, H.; Lagerwey, P. Safety Effects of Marked versus Unmarked Crosswalks at Uncontrolled Locations; Final Report and Recommended Guidelines; Report no. FHWA-HRT-04-100; Federal Highway Administration: Washington, DC, USA, 2005.
  16. Papantoniou, P.; Yannis, G.; Christofa, E. Which factors lead to driving errors? A structural equation model analysis through a driving simulator experiment. IATSS Res. 2019, 43, 44–50. [Google Scholar] [CrossRef]
  17. Zegeer, V. Development of Crash Modification Factors for Uncontrolled Pedestrian Crossing Treatments; Report no. 841; NCHRP: Washington, DC, USA, 2017. [Google Scholar]
  18. Pechteep, P.; Luathep, P.; Kronprasert, N.; Jaensirisak, S. Safety effectiveness of an upgraded midblock pedestrian crossing on an urban arterial road. Asia-Pac. J. Sci. Technol. (APST) 2023, 28, 1–12. [Google Scholar]
  19. Pechteep, P.; Luathep, P.; Kronprasert, N.; Jaensirisak, S. Effectiveness of intelligent signalized pedestrian crossing at midblock locations on urban arterial roads in Thailand. In Proceedings of the 15th International Conference of Eastern Asia Society for Transportation Studies, Kuala Lumpur, Malaysia, 4–7 September 2023. [Google Scholar]
  20. Turner, S.; Fitzpatrick, K.; Brewer, M.; Park, S. Motorist Yielding to Pedestrians at Unsignalized Intersections: Findings from a National Study on Improving Pedestrian Safety. Transp. Res. Rec. 2006, 1982, 1–12. [Google Scholar] [CrossRef]
  21. Goddard, T.; Kahn, B.; Adkins, A. Racial bias in driver yielding behavior at crosswalks. Transp. Res. Part F Traffic Psychol. Behav. 2015, 33, 1–6. [Google Scholar] [CrossRef]
  22. Sogbe, E. An investigation into drivers’ yielding behaviour at marked uncontrolled pedestrian crossings in Ghana. IATSS Res. 2024, 48, 100–107. [Google Scholar] [CrossRef]
  23. Zhuang, X.; Wu, C. Pedestrian gestures increase driver yielding at uncontrolled mid-block road crossings. Accid. Anal. Prev. 2014, 70, 235–244. [Google Scholar] [CrossRef]
  24. Yannis, G.; Nikolaou, D.; Laiou, A.; Stürmer, Y.; Buttler, I.; Jankowska-Karpa, D. Vulnerable Road users: Cross-cultural perspectives on performance and attitudes. IATSS Res. 2020, 44, 220–229. [Google Scholar] [CrossRef]
  25. Dinh, D.; Vũ, N.; McIlroy, R.; Plant, K.; Stanton, N. Effect of attitudes towards traffic safety and risk perceptions on pedestrian behaviours in Vietnam. IATSS Res. 2020, 44, 238–247. [Google Scholar] [CrossRef]
  26. Fitzpatrick, K.; Brewer, A.; Avelar, R. Driver yielding at traffic control signals, pedestrian hybrid beacons, and rectangular rapid-flashing beacons in Texas. Transp. Res. Rec. J. Transp. Res. Board 2014, 2463, 46–54. [Google Scholar] [CrossRef]
  27. Porter, E.; Neto, I.; Balk, I.; Jenkins, K. Investigating the effects of Rectangular Rapid Flash Beacons on pedestrian behavior and driver yielding on 25 mph streets: A quasi-experimental field study on a university campus. Transp. Res. Part F 2016, 42, 509–521. [Google Scholar] [CrossRef]
  28. Zheng, Y.; Chase, T.; Elefteriadou, L.; Schroeder, B.; Sisiopiku, P. Modeling vehicle-pedestrian interactions outside crosswalks. Simul. Model. Pract. Theory 2015, 59, 89–101. [Google Scholar] [CrossRef]
  29. Govindaa, L.; Abhignab, D.; Nairc, M.; Shankar, R. Comparative Study of Pedestrian Crossing Behaviour at Uncontrolled Intersection and Midblock Locations. Transp. Res. Procedia 2020, 48, 698–706. [Google Scholar] [CrossRef]
  30. Anciaes, P.; Guardo, D.; Jones, P. Factors explaining driver yielding behaviour towards pedestrians at courtesy crossings. Transp. Res. Part F 2020, 73, 453–469. [Google Scholar] [CrossRef]
  31. Torres, C.; Sobreira, L.; Castro-Neto, M.; Cunto, F.; Vecino-Ortiz, A.; Allen, K.; Hyder, A.; Bachani, A. Evaluation of pedestrian behavior on mid-block crosswalks: A case study in Fortalezad-Brazil. Front. Sustain. Cities 2020, 2, 3. [Google Scholar] [CrossRef]
  32. Kadali, R.; Vedagir, P. Role of number of traffic lanes on pedestrian gap acceptance and risk taking behaviour at uncontrolled crosswalk locations. J. Transp. Health 2020, 19, 100950. [Google Scholar] [CrossRef]
  33. Olszewski, P.; Szagałaa, P.; Wolanski, M.; Zielinska, A. Pedestrian fatality risk in accidents at unsignalized zebra crosswalks in Poland. Accid. Anal. Prev. 2015, 84, 83–91. [Google Scholar] [CrossRef]
  34. Bendak, S.; Alnaqbi, M.; Alzarooni, Y.; Aljanaahi, M.; Alsuwaidi, J. Factors affecting pedestrian behaviors at signalized crosswalks: An empirical study. J. Saf. Res. 2021, 76, 269–275. [Google Scholar] [CrossRef]
  35. Tezcan, O.; Elmorssy, M.; Aksoy, G. Pedestrian crossing behavior at midblock crosswalks. J. Saf. Res. 2019, 71, 49–57. [Google Scholar] [CrossRef]
  36. Sucha, M.; Dostal, D.; Risser, R. Pedestrian-driver communication and decision strategies at marked crossings. Accid. Anal. Prev. 2017, 102, 41–50. [Google Scholar] [CrossRef]
  37. Figliozzi, A.; Tipagornwong, C. Pedestrian Crosswalk Law: A study of traffic and trajectory factors that affect non-compliance and stopping distance. Accid. Anal. Prev. 2016, 96, 169–179. [Google Scholar] [CrossRef]
  38. Bella, F.; Ferrante, C. Drivers’ Yielding Behavior in Different Pedestrian Crossing Configurations: A Field Survey. J. Adv. Transp. 2021, 2021, 8874563. [Google Scholar] [CrossRef]
  39. Avinasha, C.; Goreb, N.; Shriniwasc, A.; Gaurangd, J.; Manoranjan, P. Choice crossing behaviour model for Safety Margin of pedestrian at mid-blocks in India. Transp. Res. Procedia 2020, 48, 2329–2342. [Google Scholar] [CrossRef]
  40. European Commission. Road Safety in the European Union: Trends, Statistics, and Main Challenges. 2018. Available online: https://road-safety.transport.ec.europa.eu/system/files/2021-07/vademecum_2018.pdf (accessed on 29 October 2023).
  41. Schneider, J.; Sanatizadeh, A.; Shaon, R.; He, Z.; Qin, X. Exploratory analysis of driver yielding at low-speed, uncontrolled crosswalks in Milwaukee, Wisconsin. Transp. Res. Rec. 2018, 2672, 21–32. [Google Scholar] [CrossRef]
  42. Garder, E. The impact of speed and other variables on pedestrian safety in Maine. Accid. Anal. Prev. 2004, 36, 533–542. [Google Scholar] [CrossRef]
  43. Huang, F.; Stewart, R.; Zegeer, V. Evaluation of lane reduction “road diet” measures on crashes and injuries. Transp. Res. Rec. 2002, 1784, 80–90. [Google Scholar] [CrossRef]
  44. Zegeer, V.; Bushell, M. Pedestrian crash trends and potential countermeasures from around the world. Accid. Anal. Prev. 2012, 44, 3–11. [Google Scholar] [CrossRef]
  45. Martin, A. Factors Influencing Pedestrian Safety: A Literature Review; TRL: Wokingham, UK, 2006. [Google Scholar]
  46. Koh, P.; Wong, D.; Chandrasekar, P. Safety evaluation of pedestrian behavior and violations at signalized pedestrian crossings. Saf. Sci. 2014, 70, 143–152. [Google Scholar] [CrossRef]
  47. Alina, B.; Karla, C. Who is Safer on the Road, Men or Women? Transport for Development. 2021. Available online: https://www.blogs.worldbank.org/en/transport/who-safer-road-men-or-women (accessed on 25 October 2023).
  48. Dileep, R.; Koshy, I.; Sam, S. Study on driver yielding to pedestrians at unsignalized crosswalks. Int. J. Sci. Eng. Res. 2016, 7, 306–311. [Google Scholar]
  49. Tankasem, P.; Satiennam, T.; Satiennam, W.; Jaensirisak, S.; Rujopakarn, W. Effects of automated speed control on speeding intention and behavior on mixed-traffic urban arterial roads. IATSS Res. 2022, 46, 492–498. [Google Scholar] [CrossRef]
  50. Nikolaou, D.; Ntontis, A.; Michelaraki, E.; Ziakopoulos, A.; Yannis, G. Pedestrian safety attitudes and self-declared behaviour in Greece. IATSS Res. 2023, 47, 14–24. [Google Scholar] [CrossRef]
  51. Kröyer, H. Is 30 km/h a ‘safe’ speed? Injury severity of pedestrians struck by a vehicle and the relation to travel speed and age. IATSS Res. 2015, 39, 42–50. [Google Scholar] [CrossRef]
  52. Tanishita, M.; Sekiguchi, Y.; Sunaga, D. Impact analysis of road infrastructure and traffic control on the severity of pedestrian-vehicle crashes at intersections and non-intersections using bias-reduced logistic regression. IATSS Res. 2023, 47, 233–239. [Google Scholar] [CrossRef]
  53. Dinh, D.; Kubota, H. Drivers’ perceptions regarding speeding and driving on urban residential streets with a 30 km/h speed limit. IATSS Res. 2013, 37, 30–38. [Google Scholar] [CrossRef]
  54. Singh, M.; Pathivada, B.; Rao, K.; Perumal, V. Driver behaviour modelling of vehicles at signalized intersection with heterogeneous traffic. IATSS Res. 2022, 46, 236–246. [Google Scholar] [CrossRef]
  55. Yoh, K.; Okamoto, T.; Inoi, H.; Doi, K. Comparative study on foreign drivers’ characteristics using traffic violation and accident statistics in Japan. IATSS Res. 2017, 41, 94–105. [Google Scholar] [CrossRef]
  56. Washington, P.; Karlaftis, G.; Mannering, F.L. Statistical and Econometric Methods for Transportation Data Analysis; CRC Press Company: Boca Raton, FL, USA, 2003. [Google Scholar]
  57. Washington, S. Iteratively specified tree-based regression models: Theoretical development and example applied to trip generation. J. Transp. Eng. 2000, 126, 482–491. [Google Scholar] [CrossRef]
  58. Hosmer, D.; Lemeshow, S. Applied Logistic Regression; Wiley Series in Probability and Statistics; John Wiley & Sons: New York, NY, USA, 2000. [Google Scholar]
  59. McFadden, D. Conditional logit analysis of qualitative choice behavior. In Frontiers in Economics; Academic Press: Cambridge, MA, USA, 1974; pp. 105–142. ISBN 0-12-776150-0. [Google Scholar]
  60. McFadden, D.; Train, K. Mixed MNL models for discrete response. J. Appl. Econom. 2000, 15, 447–470. [Google Scholar] [CrossRef]
Figure 1. The study areas. (a) Typical zebra crossing (C1), (b) Smart pedestrian crossing (C2).
Sustainability 16 04118 g001
Figure 2. Descriptive statistics of driver behaviors.
Sustainability 16 04118 g002
Table 1. Summary of literature reviews on the factors influencing driver yielding behavior.
AuthorsMethodsNumber of Midblock CrosswalksFactors
Roadway Pedestrian Traffic Environmental
Linear RegressionBinary LogisticLogistic RegressionMultinomial Logistic RegressionModeling the Vehicle-Pedestrian Interactions (vpi)Type of CrosswalkNumber of Traffic LanesWidth of a Traffic LaneWidth and Length of CrosswalkPresence of Pedestrian Refuge IslandGenderAgeNumber of Pedestrian CrossingsPosition of Pedestrian Waiting AreaPedestrian Waiting TimePedestrian Crossing TimePedestrian Crossing SpeedPedestrian Behavior While CrossingType of VehiclesSpeed of VehiclesTraffic VolumeTraffic DensityStopping DistanceCycle Time of Traffic SignalVehicle HeadwayPost-Encroachment Time (Pet)Presence of Roadside ParkingPresence of Bus StopsCrosswalk EnvironmentLighting ConditionLand UseTime of DayDay of Week
Fitzpatrick et al. [26]----7 **-**------------------*----
Porter et al. [27]----2 -*-******----*-*------------
Zheng et al. [28]----19 *--*---**--*---*------**----
Govindaa et al. [29]----2 *--*-***---*---*---------*--
Anciaes et al. [30]----20 *---****--*--***----------**
Torres et al. [31]----4 *----***-- *-*-*------------
Kadali and Vedagir [32]----8 -*--*----*--**--------------
Olszewski et al. [33]----1--*--**-------*---------*-*-
Bendak et al. [34]----5 -*---***-*-**-----*-------**
Tezcan et al. [35]----4 -*---**-*------*-----*------
Sucha et al. [36]----4 ---*---*----*-***-----------
Figliozzi and Tipagornwong [37]----1-------**--*-***-*----------
Bella and Ferrante [38]----2 *--*----*-----*-------------
Avinasha et al. [39]- --4 -*----*----*****---------*--
This study----4-------------
Note: √ was considered in the study, - was not considered in the study, and * was a significant factor.
Table 2. The details of four study sites with traffic volume and pedestrian crossings.
Study SiteNumber
of Traffic Lanes
Width of the Traffic Lanes (m/Lane)Width of the Crossing Area
(m)
Presence of
Pedestrian Refuge Island
(m)
Average Traffic Volume
(Vehicles per Hour)
Pedestrian
Crossings
(Persons per Hour)
C1C2C1C2
1. Hwy No. 306 Km. 4 + 9704
(2 lanes per direction)
3.54.0No46383985197218
2. Hwy No. 3242 Km. 11 + 6254
(2 lanes per direction)
3.05.5Yes (1.3 m)61244802210225
3. Hwy No. 3242 Km. 18 + 1106
(3 lanes per direction)
3.53.0Yes (1.8 m)42285874145156
4. Hwy No. 407 Km. 24 + 7004
(2 lanes per direction)
3.56.0Yes (3.3 m)45523863190184
Table 3. Definition of yielding behavior.
Yielding BehaviorCrosswalksDescription
Non-yield (NY)C1The driver keeps the speed unchanged without yielding to pedestrians crossing at the crosswalk area.
C2The driver keeps the speed unchanged during the yellow light and runs through the crosswalk during the red light.
Soft yield (SY)C1The driver slows to less than 40 km/h and allows pedestrians to cross.
C2The driver slows to less than 40 km/h, allows pedestrians to cross when the yellow light is on, and runs through the crosswalk during the red light.
Yield (Y)C1The driver yields to the pedestrian by stopping before the stop lines.
C2The driver yields to the pedestrian by stopping before the stop lines once the red light is on.
Table 4. Variables considered in driver yielding behavior modeling.
VariablesCoding and DescriptionType
of Variables
References
Dependent variable
 Driver yielding behavior (Y)2 = Yield
1 = Soft yield
0 = Non-yield (reference category)
Dichotomous [20,21,22,23]
Independent variable
Roadway characteristics
 Number of traffic lanes (x1)Number of traffic lanes in each directionContinuous[27,32,34,35,42,43]
 Width of a traffic lane (m.) (x2)Average width of traffic lanes in each directionContinuous[26]
 Width of the crosswalk (m.) (x3)The width of the crosswalk in the study road sectionContinuous[27,28,29,36]
 Length of the crosswalk (m.) (x4)Length of the crosswalk in each directionContinuous[28]
 Presence of a pedestrian refuge island (x5)1 = Yes
0 = No
Dichotomous[27,32,33]
Pedestrian characteristics
 Vulnerable group (x6)1 = Vulnerable group (female, children, and elderly)
0 = Non-vulnerable group (male and adult)
Dichotomous[27,29,30,31,32,33,34,35,46,47,48]
 Number of pedestrians (persons/stop-yield) (x7)The number of pedestrians crossing the designated crosswalk area each time a vehicle yields to themContinuous[27,28,29,30,34,36,37]
 Position of the pedestrian waiting area (x8)1 = Sidewalk
0 = Others (shoulder or traffic lane)
Dichotomous[27,28,35,37]
 Pedestrian waiting time (s) (x9)The total time when pedestrian(s) waits at the curbside or median until the traffic is clear for crossingContinuous[32,34,36]
 Pedestrian crossing time (s) (x10)The total time it takes pedestrian(s) to complete their crossing from one side to the opposite side.
This duration does not include the waiting time.
Continuous[30]
Traffic characteristics
 Type of the first vehicle entering a crosswalk area (x11)1 = Passenger car (PC)
0 = Motorcycle (MC)
Dichotomous[27,30,31,32,37,50]
 Speed of the first vehicle entering a crosswalk (km/h) (x12)The spot speed of the first vehicle in the platoon passed within 25 m of the stop line at the crosswalk.Continuous[30,33,36,37,38,39]
 Number of vehicles entering a crosswalk (vehicles) (x13)The number of vehicles passing through the crosswalk in each direction before a pedestrian decides to cross the roadContinuous[27,28,29,30,31,35,36,37,49]
 Headway between the first and second vehicles (s) (x14)The time between the first and second vehicles entering the crosswalk areaContinuous-
 PET between the first vehicle and pedestrian (s) (x15)The time difference between a pedestrian leaving the encroachment area and the first conflicting vehicle entering this areaContinuous-
 Roadside parking (x16)1 = Yes
0 = No
Dichotomous[35]
Table 5. 85th percentile speeds of vehicles.
SitesVehicle Types85th Percentile Speeds (km/h)
Typical Zebra Crossing (C1)Smart Pedestrian Crossing (C2)
NYSYYNYSYY
Site 1MC706558665541
PC898170746753
Site 2MC726760645845
PC857768716460
Site 3MC757064605044
PC958779726955
Site 4MC716661685347
PC908471706459
All four sitesMC787265655850
PC938275776961
Table 6. Descriptive statistics of dichotomous variables.
VariablesMLR1MLR2MLR3MLR4MLR5
MLR1(C1)MLR1(C2)MLR2(C1)MLR2(C2)MLR3(C1)MLR3(C2)MLR4(C1)MLR4(C2)MLR5(C1)MLR5(C2)
Vulnerable group (x6)
 Vulnerable group59.1%54.8%65.2%60.3%51.6%59.8%62.8%63.8%59.7%59.7%
 Non-vulnerable group40.8%45.2%34.8%39.7%48.3%40.2%37.1%36.2%40.3%40.3%
Position of the pedestrian waiting area (x8)
 Sidewalk66.5%70.4%69.2%76.5%75.9%77.1%58.2%78.6%67.4%75.7%
 Others (shoulder or traffic lane)33.5%29.6%30.8%23.5%24.1%22.9%41.8%21.4%32.5%24.3%
Type of the first vehicle entering a crosswalk area (x11)
 MC33.3%36.3%36.8%33.1%30.8%37.8%39.1%35.2%34.7%35.6%
 PC66.7%63.7%63.2%66.9%69.2%62.2%61.9%64.8%65.2%64.4%
 Roadside parking (x16)
 Yes52.4%29.9%63.3%31.7%64.3%28.6%64.5%30.4%61.1%30.2%
 No 47.6%70.1%36.7%68.3%35.7%71.4%35.5%69.6%38.8%69.8%
Table 7. Descriptive statistics of continuous variables.
VariablesAverage (SD)
MLR1MLR2MLR3MLR4MLR5
MLR1(C1)MLR1(C2)MLR2(C1)MLR2(C2)MLR3(C1)MLR3(C2)MLR4(C1)MLR4(C2)MLR5(C1)MLR5(C2)
Number of pedestrians (persons/ stop-yield) (x7)2.8 (0.8)3.1 (0.6)3.5 (0.7)3.7 (0.5)2.5 (0.6)2.1 (0.8)3.6 (0.9)3.2 (0.3)3.6 (0.7)3.3 (0.8)
Pedestrian waiting time (s) (x9)30.4 (12.1)22.1 (10.2)25.2 (9.6)19.5 (11.6)38.5 (10.3)30.5 (13.1)40.6 (8.9)35.2 (13.1)29.7 (10.2)25.2 (11.7)
Pedestrian crossing time (s) (x10)45.5 (13.2)40.6 (10.7)51.8 (12.6)53.4 (14.6)44.6 (15.2)40.1 (12.3)48.4 (11.2)43.9 (14.4)49.6 (13.1)44.8 (12.9)
Speed of the first vehicle entering a crosswalk (km/h) (x12)70 (9.5)65 (11.2)75 (10.1)60 (8.4)68 (9.3)59 (10.2)69 (11.5)55 (12.4)71 (10.8)63 (11.7)
- For the case of MC (km/h)65.9 (10.2)58.1 (15.6)63.4 (10.9)55.2 (14.7)69.5 (10.1)60.5 (12.5)64.2 (11.4)59.7 (10.8)65.7 (10.6)57.4 (11.9)
- For the case of PC (km/h)79.8 (12.3)65.4 (14.6)75.5 (11.4)66.8 (12.8)85.6 (14.5)69.1 (15.6)83.7 (11.5)68.5 (13.2)79.4 (12.4)67.5 (13.1)
Number of vehicles entering a crosswalk (vehicles) (x13)3.5 (0.7)2.7 (0.5)2.9 (0.6)3.4 (0.3)2.5 (1.0)2.8 (0.7)4.5 (1.1)3.6 (0.9)3.4 (0.8)3.1 (0.5)
Headway between the first and second vehicles (s) (x14)9.7 (8.4)10.5 (4.6)8.8 (5.8)13.5 (4.2)4.9 (5.1)6.9 (3.9)6.0 (3.4)8.5 (4.1)7.4 (5.6)9.2 (4.4)
PET between the first vehicle and pedestrian (s) (x15)2.1 (0.8)3.2 (0.5)2.5 (0.7)3.6 (1.0)2.8 (1.1)3.6 (0.9)2.0 (0.7)3.5 (0.6)2.7 (0.9)3.7 (1.1)
- For the case between MC and pedestrian(s) 2.4 (0.8)3.5 (0.2)2.1 (0.9)3.3 (0.5)3.1 (1.5)3.0 (1.0)2.6 (1.6)3.6 (1.1)2.6 (1.2)3.5 (0.4)
- For the between PC and pedestrian(s) 1.5 (0.6)2.9 (0.3)1.4 (0.7)3.1 (0.5)1.2 (0.8)3.2 (0.6)1.8 (1.0)2.9 (0.8)1.4 (0.8)3.2 (0.6)
Table 8. Factors influencing drivers’ yielding behavior compared to non-yield.
VariablesY vs. NY
MLR1MLR2MLR3MLR4MLR5
MLR1(C1)MLR1(C2)MLR2(C1)MLR2(C2)MLR3(C1)MLR3(C2)MLR4(C1)MLR4(C2)MLR5(C1)MLR5(C2)
p-Valuep-Valuep-Valuep-Valuep-Valuep-Valuep-Valuep-Valuep-Valuep-Value
x1 0.002 *0.001 *
x2 0.003 *0.005 *
x3 0.005 *0.002 *
x4 0.005 *0.008 *
x5 0.1470.138
x60.005 *0.009 *0.004 *0.003 *0.010 *0.005 *0.006 *0.005 *0.002 *0.006 *
x70.001 *0.000 *0.004 *0.000 *0.0970.1040.0660.1140.002 *0.001 *
x80.0470.0870.1250.2140.1850.1180.0680.1050.1240.091
x90.1450.5480.2270.0770.1140.2140.0980.2540.2740.314
x100.004 *0.1020.1130.0780.2050.1190.0890.0950.007 *0.098
x110.0740.0870.1020.1270.0980.0910.0750.1020.1100.096
x120.001 *0.003 *0.002 *0.001 *0.005 *0.003 *0.002 *0.001 *0.001 *0.002 *
x130.004 *0.001 *0.0790.0880.1030.1150.003 *0.007 *0.004 *0.001 *
x140.005 *0.003 *0.004 *0.001 *0.001 *0.000 *0.007 *0.009 *0.002 *0.001 *
x150.000 *0.001 *0.001 *0.001 *0.005 *0.001 *0.002 *0.001 *0.001 *0.000 *
x160.001 *0.010 *0.001 *0.008 *0.003 *0.009 *0.001 *0.002 *0.009 *0.007 *
N40040040040040040040040016001600
The description of the variables (X) are presented in Table 4. The reference category is non-compliance with law-obeying (i.e., non-yielding). N is the sample size. * Statistically significant is set at a 5% level.
Table 9. Factors influencing drivers’ soft yielding behavior compared to non-yield.
VariablesSY vs. NY
MLR1MLR2MLR3MLR4MLR5
MLR1(C1)MLR1(C2)MLR2(C1)MLR2(C2)MLR3(C1)MLR3(C2)MLR4(C1)MLR4(C2)MLR5(C1)MLR5(C2)
p-Valuep-Valuep-Valuep-Valuep-Valuep-Valuep-Valuep-Valuep-Valuep-Value
x1 0.005 *0.001 *
x2 0.006 *0.010 *
x3 0.010 *0.008 *
x4 0.009 *0.004 *
x5 0.1160.168
x60.003 *0.005 *0.010 *0.010 *0.003 *0.003 *0.008 *0.001 *0.004 *0.001 *
x70.000 *0.001 *0.000 *0.001 *0.0850.0970.1100.0910.001 *0.005 *
x80.2140.1060.1540.0890.1160.1630.2110.1620.1090.151
x90.2240.3140.1050.3250.0980.2410.1960.2280.1520.332
x100.008 *0.1250.006 *0.1540.2240.1740.0960.1040.005 *0.116
x110.0780.1070.0960.1240.1080.2130.0750.1030.0820.077
x120.002 *0.001 *0.000 *0.001 *0.001 *0.000 *0.003 *0.000 *0.001 *0.005 *
x130.006 *0.009 *0.0850.0640.0940.1010.001 *0.005 *0.004 *0.001 *
x140.001 *0.002 *0.007 *0.001 *0.002 *0.005 *0.001 *0.007 *0.001 *0.005 *
x150.000 *0.001 *0.001 *0.003 *0.000 *0.001 *0.000 *0.000 *0.003 *0.002 *
x160.008 *0.009 *0.004 *0.001 *0.005 *0.007 *0.002 *0.001 *0.008 *0.004 *
N40040040040040040040040016001600
The description of the variables (X) are presented in Table 4. The reference category is non-compliance with law-obeying (i.e., non-yielding). N is the sample size. * Statistically significant is set at a 5% level.
Table 10. Coefficient and odds ratio of the factors significantly influencing yielding behavior.
VariablesY vs. NY
MLR1MLR 2MLR 3MLR 4MLR 5
MLR1(C1)MLR1(C2)MLR2(C1)MLR2(C2)MLR3(C1)MLR3(C2)MLR4(C1)MLR4(C2)MLR5(C1)MLR5(C2)
βORβORβORβORβORβORβORβORβORβOR
x1 0.150.4020.350.433
x2 0.100.2960.410.397
x3 0.070.4780.290.568
x4 0.030.5030.180.517
x6
 Vulnerable group0.110.6160.210.5310.170.4410.200.6630.240.7140.110.6950.210.5890.190.5220.280.5330.180.648
 Non-vulnerable group 1.000 1.000 1.000 1.000 1.000 1.000 1.000 1.000 1.000 1.000
x70.210.7830.270.3350.200.8820.220.714 0.350.5520.270.639
x100.180.528 0.281.225 0.110.684
x120.160.4850.140.6690.110.5240.080.4480.220.3890.110.5360.280.2170.190.5430.300.4960.170.742
x130.200.7970.250.574 0.190.5580.210.6680.330.5090.410.633
x140.100.6580.110.7230.090.8650.130.8820.110.6930.380.4170.130.6910.100.7010.280.4520.310.692
x150.310.5170.330.6620.360.7210.470.7610.220.5210.320.5850.190.7740.290.6090.390.5820.410.625
x16
  Yes0.380.1141.000.6630.300.3961.120.5280.270.7210.380.6630.260.5541.070.6540.280.4820.310.658
  No 1.000 1.000 1.000 1.000 1.000 1.000 1.000 1.000 1.000 1.000
Intercept−2.21−2.19−2.34−2.47−2.15−2.34−2.33−2.15−2.43−2.25
−2LL1124.411044.321109.631120.541098.521077.451147.221103.411058.231266.20
ρ20.150.130.150.140.120.140.110.130.160.19
N40040040040040040040040016001600
The reference category is non-compliance with the law-obeying (non-yielding). The intercept is the predictor variable for the outcome probabilities. −2LL is the −2 log likelihood. ρ2 is a measure of pseudo-R-squared. N is the sample size. β is the coefficient of the variables, and OR is the odds ratio. The variables presented are statistically significant at a 5% level.
Table 11. Coefficient and odds ratio of the factors significantly influencing soft yielding behavior.
VariablesSY vs. NY
MLR1MLR 2MLR 3MLR 4MLR 5
MLR1(C1)MLR1(C2)MLR2(C1)MLR2(C2)MLR3(C1)MLR3(C2)MLR4(C1)MLR4(C2)MLR5(C1)MLR5(C2)
βOR βORβORβORβORβORβORβORβORβOR
x1 0.110.4520.210.617
x2 0.190.5530.280.652
x3 0.140.4070.170.574
x4 0.210.3620.240.563
x6
 Non-vulnerable group0.180.3580.170.4520.210.3920.150.4480.190.6410.250.5200.210.4400.200.3510.250.4590.330.667
 Vulnerable group 1.000 1.000 1.000 1.000 1.000 1.000 1.000 1.000 1.000 1.000
x70.170.5240.340.4710.180.3380.100.525 0.350.4710.320.574
x100.120.587 0.231.825 0.180.506
x120.130.6690.190.7410.220.7710.100.7790.350.7110.190.8810.110.6590.390.5740.310.6850.350.774
x130.100.6320.090.582 0.090.6690.110.6030.300.4450.380.587
x140.110.5090.110.5520.130.5050.130.4710.090.6790.100.7020.140.8010.120.5960.240.3570.190.557
x150.190.5820.190.3340.180.3200.180.4410.130.5030.250.3690.100.5480.190.4520.260.6740.330.752
x16
  Yes0.140.6650.140.7450.150.5210.100.6320.100.4070.180.4330.130.6630.120.4790.280.4410.390.570
  No 1.000 1.000 1.000 1.000 1.000 1.000 1.000 1.000 1.000 1.000
Intercept−2.18−2.20−2.18−2.32−2.19−2.34−2.13−2.28−2.33−2.41
−2LL1121.361103.691064.581123.021096.571077.251147.201109.331085.411259.36
ρ20.120.130.150.140.120.160.140.130.150.16
N40040040040040040040040016001600
The reference category is non-compliance with the law-obeying (non-yielding). The intercept is the predictor variable for the outcome probabilities. −2LL is the −2 log likelihood. ρ2 is a measure of pseudo-R-squared. N is the sample size. β is the coefficient of the variables, and OR is the odds ratio. The variables presented are statistically significant at a 5% level.
Disclaimer/Publisher’s Note: The statements, opinions and data contained in all publications are solely those of the individual author(s) and contributor(s) and not of MDPI and/or the editor(s). MDPI and/or the editor(s) disclaim responsibility for any injury to people or property resulting from any ideas, methods, instructions or products referred to in the content.

