Article

Influence of Spring Dust Storm on Atmospheric Particulate-Bound Mercury in a Typical Inland City of Northern China: Characteristics, Sources, and Risk Assessment

1
School of Environmental Science and Engineering, Shaanxi University of Science and Technology, Xi’an 710021, China
2
Key Laboratory of Aerosol Chemistry and Physics, State Key Laboratory of Loess and Quaternary Geology, Institute of Earth Environment, Chinese Academy of Sciences, Xi’an 710061, China
3
National Observation and Research Station of Regional Ecological Environment Change and Comprehensive Management in the Guanzhong Plain, Xi’an 710061, China
4
State Key Laboratory of Cryospheric Science, Northwest Institute of Eco-Environment and Resources, Chinese Academy of Sciences, Lanzhou 730000, China
*
Author to whom correspondence should be addressed.
Sustainability 2024, 16(10), 4096; https://doi.org/10.3390/su16104096
Submission received: 25 March 2024 / Revised: 4 May 2024 / Accepted: 9 May 2024 / Published: 14 May 2024

Abstract

:
Particulate-bound mercury (PBM) has a large dry-deposition rate and removal coefficient, both of which import mercury into terrestrial and marine ecosystems, causing global environmental problems. In order to illustrate the concentration characteristics, main sources, and health risk of PBM in the atmospheric environment during the spring dust storm period in Xi’an in 2022, PM2.5 samples were collected in Xi’an in March 2022. The concentration of PBM and the PM2.5 composition, including water-soluble ions and elements, were analyzed. The input of dust caused a significant increase in the concentration of PBM, Ca2+, Na+, Mg2+, SO42−, and metal elements in the aerosol. The research results revealed that the dust had a strong enrichment influence on the atmospheric PBM in Xi’an. Anthropogenic mercury emissions and long-distance migration in the sand source area promote the rise in PBM concentration and should be included in the mercury inventory. The values of the risk index for a certain metal (Eri) (572.78–1653.33) and the geo-accumulation index (Igeo) (2.47–4.78) are calculated during this study, showing that atmospheric PBM has a strong pollution level with respect to the ecological environment and that Hg mainly comes from anthropogenic mercury emissions. The non-carcinogenic health risk of atmospheric PBM in children (8.48 × 10⁻²) is greater than that in adults (1.01 × 10⁻²). The results show that we need to pay more attention to children’s health in the process of atmospheric mercury pollution control. This study discusses the distribution characteristics of PBM during spring sandstorms and the effects of atmospheric mercury on residents’ health, providing a basis for studying the sustainable development of environmental health and formulating effective strategies for mercury emission control.

Graphical Abstract

1. Introduction

Mercury (Hg) is liquid at room temperature, volatile, and highly toxic to biota [1]. Mercury in the environment can bio-accumulate through the food chain and is classified by the United States Environmental Protection Agency (USEPA) as a persistent bio-accumulative toxic (PBT) chemical [2,3]. Hg is ubiquitous and can be transported over long distances in the atmosphere, resulting in global mercury pollution. Gaseous elemental mercury (GEM) contributes approximately 95% of the mercury content. Because of the stability of Hg0, GEM can remain in the atmosphere for two-to-three years [4]. Particulate-bound mercury (PBM) and gaseous oxidized mercury (GOM) accounts for about 5% of the total atmospheric Hg. Compared to GEM, PBM is more likely to be deposited through atmospheric wet/dry-deposition processes due to its high scavenging coefficient and dry-deposition frequency [5]. Although PBM makes up a smaller percentage of atmospheric mercury, PBM is critical to the circulation of mercury in the ecosystem and closely related to the scattering and transport of mercury [6,7].
Human emissions and natural emissions are the two main source types of atmospheric mercury. Natural sources include volcanic and geothermal activity, dust storms, plant transpiration, forest fires, etc. [8,9]. Anthropogenic sources of mercury in the atmosphere include coal-burning emissions, waste incineration, metal smelting, and indigenous gold refining [10,11]. Global anthropogenic sources release about 2100 t of mercury into the atmosphere each year [12,13,14]. China is one of the world’s largest anthropogenic mercury emitters, accounting for about 33% of the total global atmospheric mercury emissions [8,13]. Two main ways of mercury emission are coal firing and the smelting of non-ferrous metals [15]. In 2005, the mercury emissions from coal burning were estimated at 334 t in China, representing the largest source of anthropogenic mercury emissions in the country that year [16]. In order to create a better control policy for mercury pollution, it is very important to determine its emission sources. The Taklimakan Desert in western China and the Gobi Desert in southern Mongolia and northern China are major sources of dust in East Asia [17]. During the spring and early summer of each year, surface dust in the Gobi Desert region is carried and transported by frontal cooling systems and Mongolian cyclone depressions to leeward regions, including North America [18,19]. Located in the Guanzhong Basin, Xi’an is the largest city in northwest China, close to the dust region of East Asia. The high load of aerosols remains a major air quality problem. Sandstorms, most common in the dry spring, are another atmospheric phenomenon in Xi’an, resulting in a large amount of sand and dust input from desert areas [20,21]. Dust is responsible for 7% of all natural mercury emissions [14]. Sandstorms, coal burning, and long-distance air transport are believed to be the main causes of PM2.5 and PBM pollution in Xi’an’s atmosphere. It is important to inspect the concentration and sources of PM2.5 and PBM in Xi’an because they also lead to high aerosol loads in other Asian cities [22]. Meanwhile, domestic studies on atmospheric particulate mercury in industrial cities are mainly concentrated in large cities with strong human activities, such as Jinan [23] and Guiyang [24]. In recent decades, some studies on dust storms in China have paid attention to atmospheric particulate matter mass concentration and health risks, with few studies studying the effect of dust storms on atmospheric PBM concentrations. In this study, the effects of atmospheric PBM on humans and the environment under dust storm weather were evaluated by monitoring the atmospheric PBM.
In March 2022, samples were taken in the inland Chinese city of Xi’an to determine the changes in PM2.5 concentration and PBM content caused by dust storms. We identified the sources of PBM in Xi’an during dust storms and assessed the health effects of dust on the residents. Therefore, this research aiming to understand the spring dust atmospheric PM2.5 in the northwest area provides an important opportunity.

2. Materials and Methods

2.1. Sample Collection

The Guanzhong Basin is located in the north of the Loess Plateau and to the south of the Qinling Mountains. It stretches from Baoji in the west to Tongguan in the east, totaling about 300 km from east to west. Xi’an is a typical inland city, located in the middle of the Guanzhong Basin. Under such topographic characteristics, pollutants are not easily dispersed and removed and tend to accumulate. The sampling sites in Xi’an (34.38° N, 108.97° E) are shown in Figure S1. The sampling periods in Xi’an ran from the 1st to the 31st March 2022. The atmospheric PM2.5 sample collection process has been described in another study [25] and is summarized in Text S1.

2.2. PM2.5 and PBM Concentration Analysis

Before sample analysis, the filter samples were balanced in the drying dish for 48 h to remove water. The total mass of PM2.5 (µg) was obtained by the gravimetric method. Within 23 h, the air volume passing through the filter was 140 m3. The procedure for calculating the mean mass concentration of PM2.5 is described in Text S2.
A 1/6 portion of the filter sample was cut for the analysis of the PBM content using a Leeman Hydra-IIC Direct Hg Analyzer (Teledyne Leeman Laboratories, Hudson, NH, USA). To ensure the quality of the sample analysis, the analyses of the method blank, filter blank, and standard reference samples (GSS-9) were carried out. The PBM concentration (pg m−3) and PBM deposition flux calculations are summarized in Text S3. The details on instrument calibration and the standards used for PBM are presented in Text S4. The mercury concentrations of the blank samples and the GSS-9 samples are presented in Tables S1 and S2.

2.3. Chemical Analysis

The samples were filtered and then analyzed for water-soluble ions and elements. The Dionex-600 ion chromatograph (DX-600, Dionex, Sunnyvale, CA, USA) and the Dionex-2500 ion chromatograph (ICS-2500, Dionex, USA) performed the inorganic water-soluble ion analysis of the samples. The concentrations of 20 elements (Al, Fe, Mn, Mg, Se, Sr, K, Na, Ca, Co, Cr, Ni, Cu, Ga, Rb, Pb, Zn, Cd, Ba, and As) were determined with an Inductively Coupled Plasma Mass Spectrometer (Agilent 7900 ICP-MS, Beijing, China). The sample filtration method and measurement process of the water-soluble ions and elements have been described in other studies [26,27], and relevant details are shown in Text S5. Enrichment factors (EFs) were used to assess the relative contributions of anthropogenic and natural Hg to the atmospheric PBM [28]. The formula for calculating EFs is presented in Text S5.

2.4. Source Analysis

This study was based on the TrajStat plug-in Meteoinfo software (http://www.meteothinker.com, accessed on 24 March 2024). In order to assess the potential source of PBM, the back trajectory-clustering technique, the potential source contribution function (PSCF) model, and the concentration-weighted trajectory (CWT) model were used. The weighted potential source contribution function (WPSCF) and the weighted concentration weighted trajectory (WCWT) were introduced to reduce the uncertainty of PSCF and CWT. The PM10 data were downloaded from the Ministry of Ecology and Environment of the People’s Republic of China (https://www.mee.gov.cn, accessed on 24 March 2024). The methods of back trajectory and source apportionment analysis have been shown elsewhere [26,29,30], and details of the source analysis methods are summarized in Text S6.

2.5. Risk Assessment

The potential ecological risk index (RI) is a commonly used metal pollution assessment method, proposed by Hakanson [31]. The Eri can be divided into five classes (Table S3). The geo-accumulation index (Igeo) is a heavy metal pollution evaluation method. It is often used to evaluate the ecological risk of heavy metals in particulate matter. The Igeo classification of pollution levels is shown in Table S4. The non-carcinogenic health risks of PBM were calculated for three exposure routes: oral ingestion, respiratory inhalation, and skin contact. Details of the determination and calculation formula of the PBM risk assessment are presented in Text S7. To evaluate the effect of mercury in PM2.5 on the health risk of residents in Xi’an city, we quantified each person’s daily exposure to PBM. The daily accumulation of mercury in adults and children through oral ingestion was converted into the daily intake of flour, vegetables, and aquatic products. This method of converting the daily amount of Hg in PM2.5 is shown in Text S8. Cu, Zn, Pb, and V are non-carcinogenic; Cr (VI), Cd, Ni, and As are carcinogenic. In the calculation process of non-carcinogenic health risk assessment, the effects of Cd, Ni, and As on human health were also calculated. The calculation details of the carcinogenic risk assessment and the non-carcinogenic risk assessment for these elements are in Text S7.

3. Results and Discussion

3.1. Concentration of PBM

3.1.1. Characteristics of PBM Concentrations

March is the transition month between winter and summer, and it is also the period when the number of dusty days in Xi’an increases. The PBM concentration, PM2.5 concentration, and PBM/PM2.5 mass ratios (Hg mass contents) in Xi’an are shown in Table 1, and the comparison of the PBM concentration with other regions of the world is shown in Table S5. The concentrations of PBM in Xi’an in March range from 20.59 to 186.11 pg m−3, with an average of 83.57 ± 30.97 pg m−3, which is much higher than the concentrations of background PBM reported in various northern hemisphere regions (<1.0–5.0 pg m−3) [32]. The atmospheric PBM concentrations of Xi’an is significantly lower than in most urban areas in China such as Qingdao (270 pg m−3) and Shanghai (341 ± 187 pg m−3) [33]. The PBM concentration in Xi’an is higher than that in Lhasa (80 pg m−3) [34] and the concentration of background PBM measured in remote areas of Huaniao Island (29.0 pg m−3) [35], Mt. Waliguan (19.4 ± 18.1 pg m−3) [36], and Mt. Gongga (30.7 pg m−3) [37] in China. The average PBM concentration in Xi’an is similar to the PBM levels in Ho Chi Minh (67.3 ± 45.9) [38] and also 22–23-fold lower than the PBM levels measured in Kathmandu (1855.4 ± 780.8 pg m−3) [39]. This indicates that there are high emission sources of mercury pollution in Southeast Asia. Compared with the atmospheric PBM concentrations observed in the Northern America and Europe regions [40,41,42,43], the PBM levels in Xi’an are high, suggesting that China and other regions in Asia are significantly affected by anthropogenic mercury emissions.
The PBM/PM2.5 mass ratio in Xi’an in March ranged from 247.56 ng g−1 to 1493.69 ng g−1, with a mean of 655.05 ng g−1, which was higher than the Hg background values in the area which is the source of sand in northwest China (0.01 mg kg−1) and the background values of Hg in the soil of the Shaanxi province (0.03 mg kg−1). The enrichment factor of PBM is 8.25–49.79, with a mean value of 2.79 (the background value of 0.03 mg kg−1 was used). The results indicate that Hg from human activities and dust from regional pollution are major inputs for atmospheric PBM [44]. The PBM/PM2.5 mass ratio in Xi’an is higher than those in Lumbini (488.9 ± 489.9 ng g−1) in Nepal and in many cities in China, such as Shanghai (1030 ± 2850 ng g−1) [45]. The PBM concentration was positively correlated with the PM2.5 concentration, but the correlation was weak (R2 = 0.27) (Figure S2a), indicating that the PBM concentration was related to the aerosol mass. The PBM concentration and PBM/PM2.5 ratio are not correlated (Figure S2b), which explains why the Hg in aerosols contributes less to atmospheric PBM and why the direct emission source and transport source of PBM have a significant effect on the mercury content [46]. The PM2.5 mass and PBM/PM2.5 ratio are negatively correlated (Figure S2c). This result is like the behavior of aerosol in Qingdao, which is due to the high concentration of aerosol particles in the atmosphere caused by the dust storms. Under special meteorological conditions (sand dust days), high levels of PM2.5 in the atmosphere dilute the content of ambient PBM [47].

3.1.2. Characteristics of Atmospheric PBM under Dust Days

The variation in the PBM and PM2.5 concentrations in Xi’an in March 2022 are shown in Figure 1. As shown in Figure 1, the PM2.5 and PBM concentrations began to increase from 13 March, and the concentration peaked on the 14th and 15th March. The PM2.5 and PM10 were 173.07 and 333.55 μg m−3 during the dust storm period, respectively. The average PM2.5 concentration in the non-dust storm period (161.10 μg m−3) was lower than that in the dust storm period (173.07 μg m−3). This suggests that there is a significant amount of fine particulate matter in the Asian dust storm period. The PM10 concentrations significantly increased (Figure S3), indicating that dust storms are very significant contributors of the coarse fraction.
Under the action of northwest wind, the main body of sand and dust continued to be transported to the southeast. The PBM concentrations ranged from 69.02 to 123.68 pg m−3, with an average of 87.97 ± 15.32 pg m−3 during the pre-dust storm period, from 92.34 to 186.11 pg m−3, with an average of 129.07 ± 44.48 pg m−3 during the dust storm period, and from 35.14 to 105.08 pg m−3, with an average of 67.92 ± 24.00 pg m−3 during the post-dust storm period (Table 1). The average PBM concentration was highest during the dust storm period. The longer the time the air mass spent in the polluted zone, the greater the accumulation of Hg in the aerosol. March is still a heating time in northern China. The Hg from burning coal for heating remains a major source of atmospheric PBM, contributing approximately 40% of China’s total anthropogenic emissions [15]. According to a survey, the deadline for heating in Xi’an was the 15th of March 2022, and precipitation started on the 17th of March. The end of heating and the scavenging of PM2.5 by precipitations resulted in lower PBM concentrations [48].
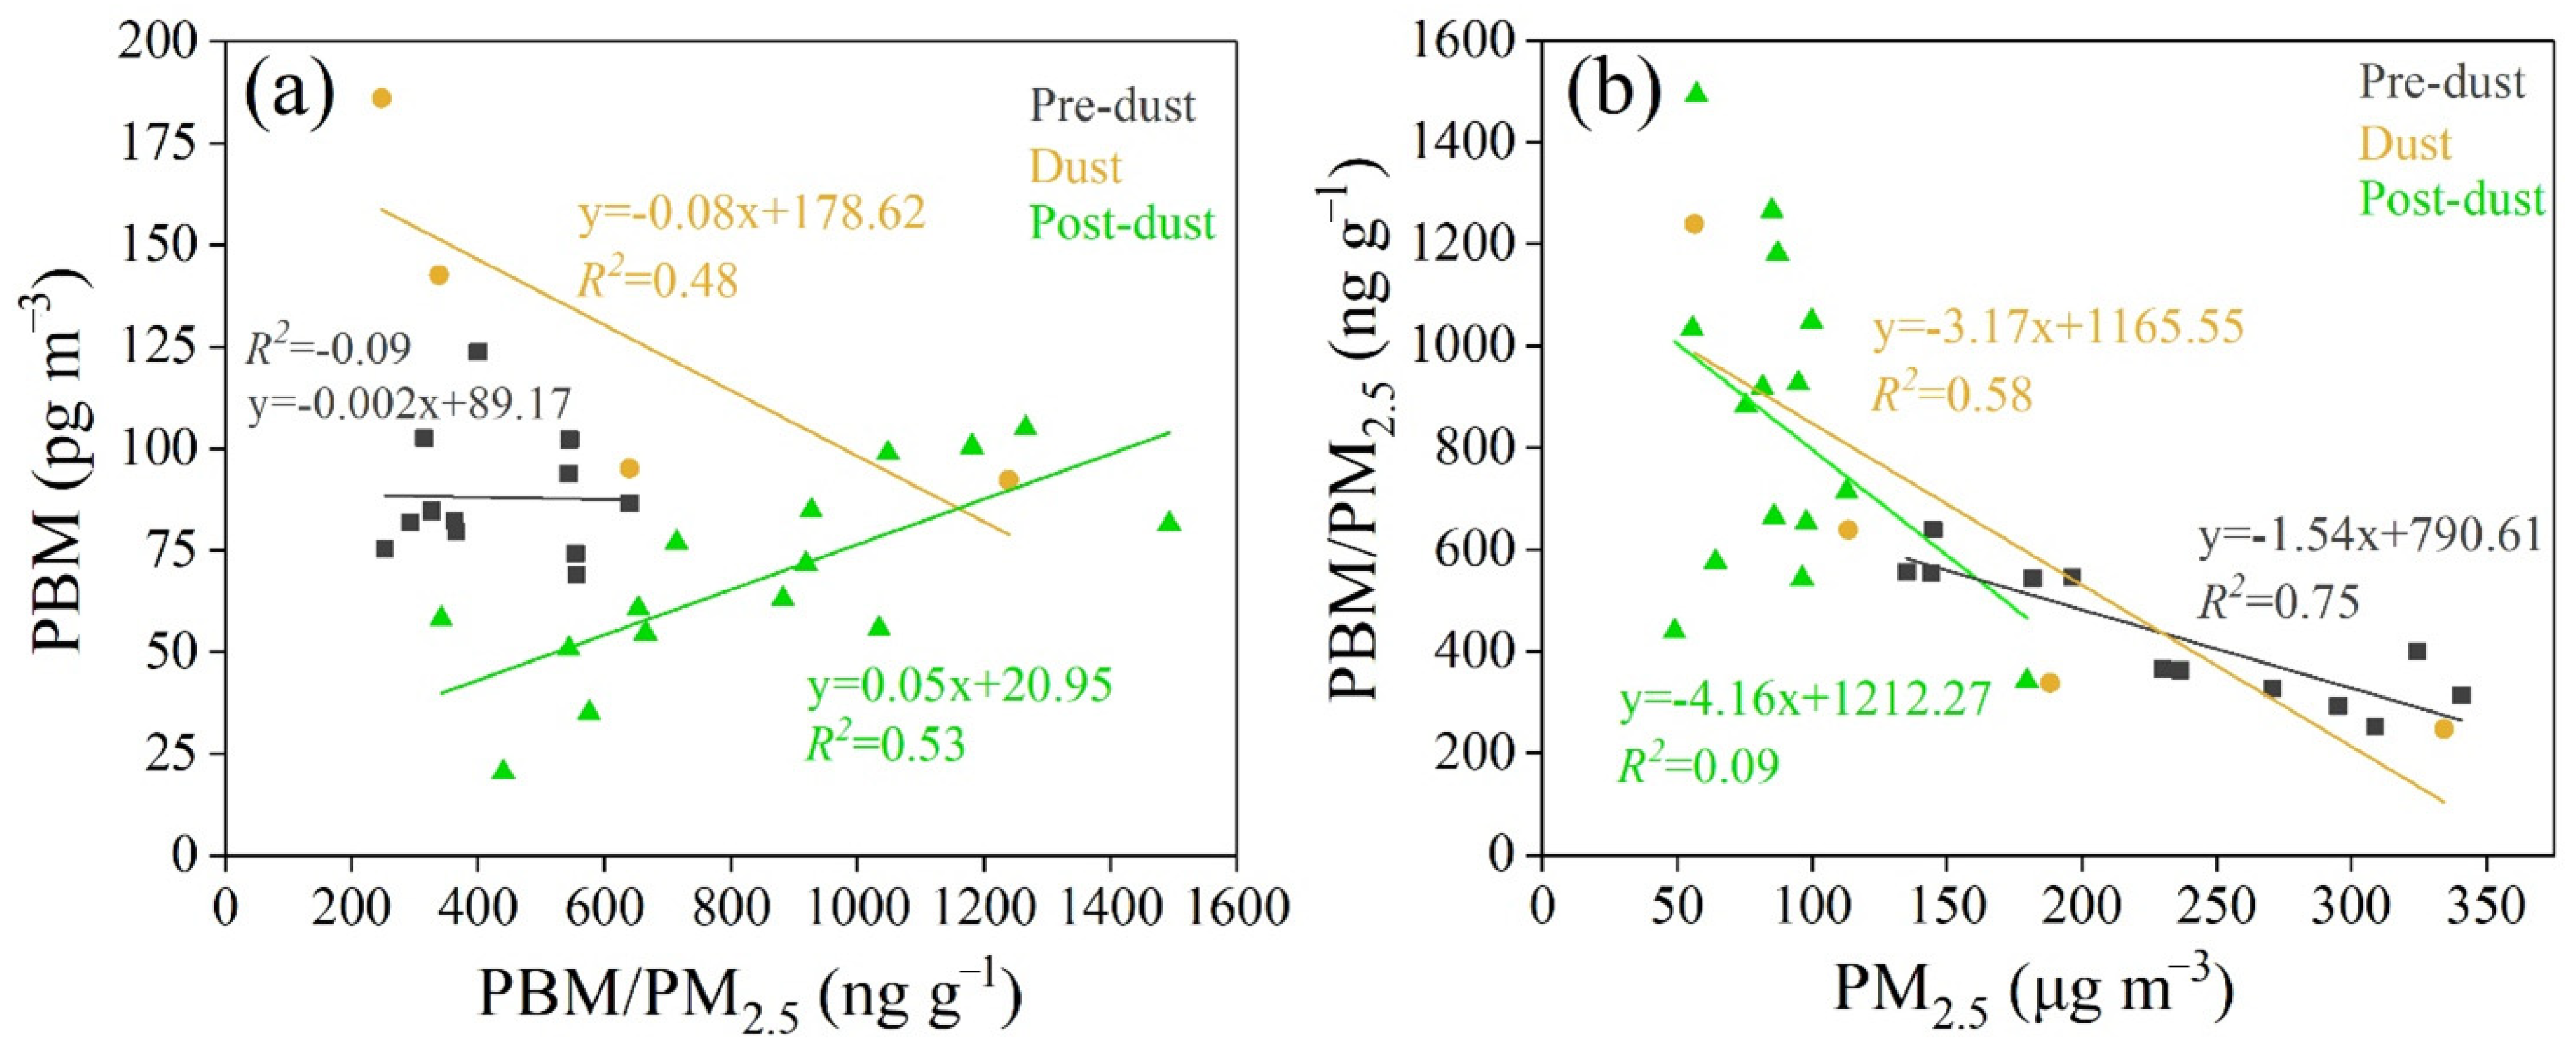
The PBM concentration and the PBM/PM2.5 ratio and the PBM/PM2.5 ratio and the PM2.5 content were negatively correlated in the dust storm period (Figure 2). The stronger the dust became, the lower the PBM/PM2.5 was, suggesting that a larger proportion of particles with a low mercury content were present. This result is similar to the change in the PBM/PM2.5 ratio during the Qingdao dust storm period [49]. The average PBM/PM2.5 mass ratio was the highest, but the PM2.5 and PBM concentrations were the lowest during the post-dust storm period (Table 1). Due to the scavenging effect of precipitation, the removal of atmospheric pollutants (PBM and PM2.5) was clear [50]. There was a significant positive correlation between the PBM concentration and the PBM/PM2.5 ratio during the post-dust storm period (Figure 2a), suggesting that the PBM mainly came from the emission of local pollutants [51].

3.1.3. Deposition of Atmospheric PBM

Xi’an has a temperate continental monsoon climate with little rainfall in the spring. The removal of PBM in the atmosphere is mainly by means of dry-deposition. The diameter of particles affects the deposition rate. By referring to the results of the William model with different diameters in Qingdao (the particle diameter of flat dust in Qingdao is about 2 μm),the deposition rate of PBM 0.5 cm s−1 was used to estimate the dry-deposition flux of Hg during dust and non-dust days. As shown in Table S8, the highest value of the PBM dry-deposition flux was 3.35 ng m−2 h−1, the lowest value was 1.66 ng m−2 h−1, and the average value was 2.32 ng m−2 h−1 on dust days. On non-dust days, the PBM dry-deposition flux was 1.40 ng m−2 h−1, which was about 1/2 of the mercury deposition flux on dust days. The area of Xi’an is 10,752 km2. In 2022, the dust period ran from the 13th to the 16th of March and the 11th of April. In 2023, there were about 15 days of dust storms in Xi’an, from the 10th to the 12th of March, the 21st to the 23rd of March, the 10th to the 13th of April, the 19th to the 20th of April, and the 27th to the 29th of April. According to the research data from March 2022, it could be estimated that the PBM deposition amount in the non-dust storm period of Xi’an city in 2022 was 130.03 kg, the maximum deposition amount in the dust storm period was 4.33 kg, the minimum deposition amount was 2.14 kg, and the average deposition amount was 2.99 kg. It was estimated that the PBM deposition amount in the non-dust storm period of Xi’an in 2023 was 126.44 kg. In the dust storm period of 2023, the maximum PBM deposition amount of Xi’an was 12.94 kg, the minimum deposition amount was 6.42 kg, and the average deposition amount was 8.99 kg.
In 2022, the average deposition flux was 12.37 g km−1 y−1. In 2023, the average deposition flux was 12.60 g km−1 y−1. With the increase in dust storm frequency in 2023, the deposition flux of PBM in Xi’an city in 2023 was greater than that in 2022. Large amounts of dust are imported from desert areas (especially in the spring) in Xi’an [52]. Therefore, in the mercury cycle, attention should be paid to the deposition of mercury during dust storms.

3.2. Effects of Natural and Anthropogenic Factors on Mercury Enrichment in PBM

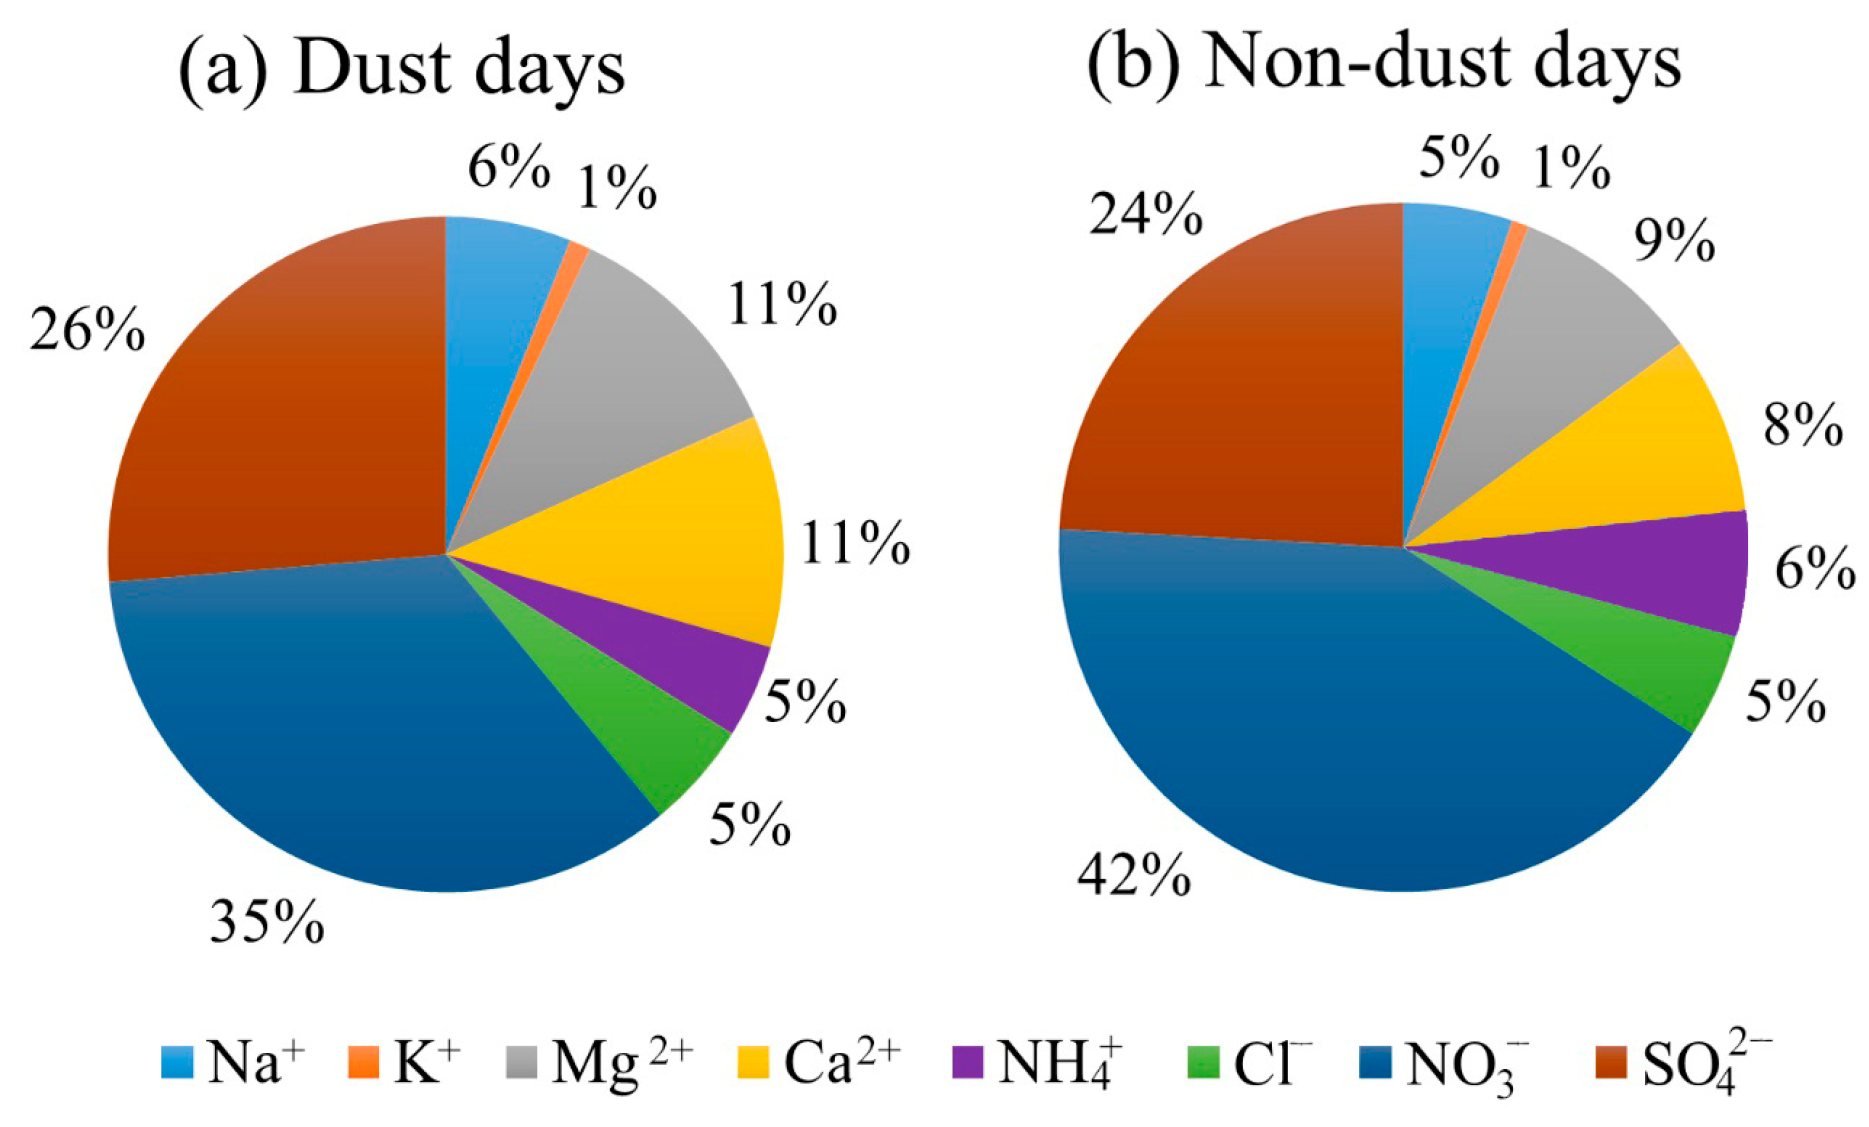
During dust storm and non-dust storm periods, the total ion concentrations for PM2.5 were 58.68 and 43.03 μg∙m−3, amounting to 33.91% and 26.73% of the PM2.5 mass, respectively. Due to crustal origin, the Ca2+, Na+, and Mg2+ concentrations during the dust storm periods were 1–2 times higher than those in the non-dust storm periods (Table S9). The variations in SO42− and NO3 are shown in Figure S4. The concentrations of Ca2+, Na+, Mg2+, and SO42− decreased from the dust storm to non-dust storm periods (Figure 3a,b). SO42− increased noticeably on dust storm days, indicating that SO42− may exist in the form of Na2SO4 and CaSO4 and mainly come from the desert surface soil, followed by the photochemical oxidation of SO2 [17]. SO42− may be largely brought about by intrusive dust. On the contrary, due to the dilution of the invading dust, the concentrations of NO3 and NH4+ on dust storm days are lower than those on non-dust storm days (Figure 3 and Figure S4) [53]. Previous studies have revealed that K+ is enriched in aerosols due to biomass burning [54]. Xi’an is located inland, and the ocean has less influence on urban aerosol particles, so K+ and Cl possibly come from straw-burning emissions [55]. During the study period, SO42− and NO3 accounted for 64% of the water-soluble ions in Xi’an. The ions’ composition is similar to that in other cities in China, such as Beijing and Wuhan [56,57], where SO42− and NO3 are rich components in PM2.5. The ratio of SO42− to NO3 is 0.28–0.95. It may be related to the stricter pollution control measures for coal-related fixed sources in Xi’an in recent years and the relative increase in the contribution of mobile emissions [58].
The water-soluble ions in PM2.5 can be used as tracers of emission sources. To explore the potential influencing factors of Hg in PBM, the correlation between mercury concentration and water-soluble ions was analyzed. The regression analyses of PBM and soluble ions are shown in Figure 3c. The concentration of PBM is positively proportional to that of water-soluble ions (Na+, K+, Mg2+, Ca2+, Cl, and SO42−). The concentration of PBM was moderately correlated with Cl (R2 = 0.54) and weakly correlated with other water-soluble ions (R2 = 0.01–0.36). The positive correlations between Mg2+, Na+, and PBM indicate that the PBM concentration is affected by surface soil and dust [59]. In rural northern China, wheat and corn straw are used for cooking all year round and for heating in the winter and early spring (November to April). The PBM concentration and K+ and Cl are positively correlated, suggesting that PBM comes from biomass combustion. The positive correlation between PBM and SO42− possibly shows that PBM concentrations are linked to pollutants emitted by burning fossil fuels such as coal for heating. It is also generally believed that NO3 is related to traffic sources and that the Hg in the atmosphere comes from the exhaust emissions of gasoline-burning vehicles.

3.3. Potential Pollution Source of PBM

3.3.1. Sources of the Invading Dust

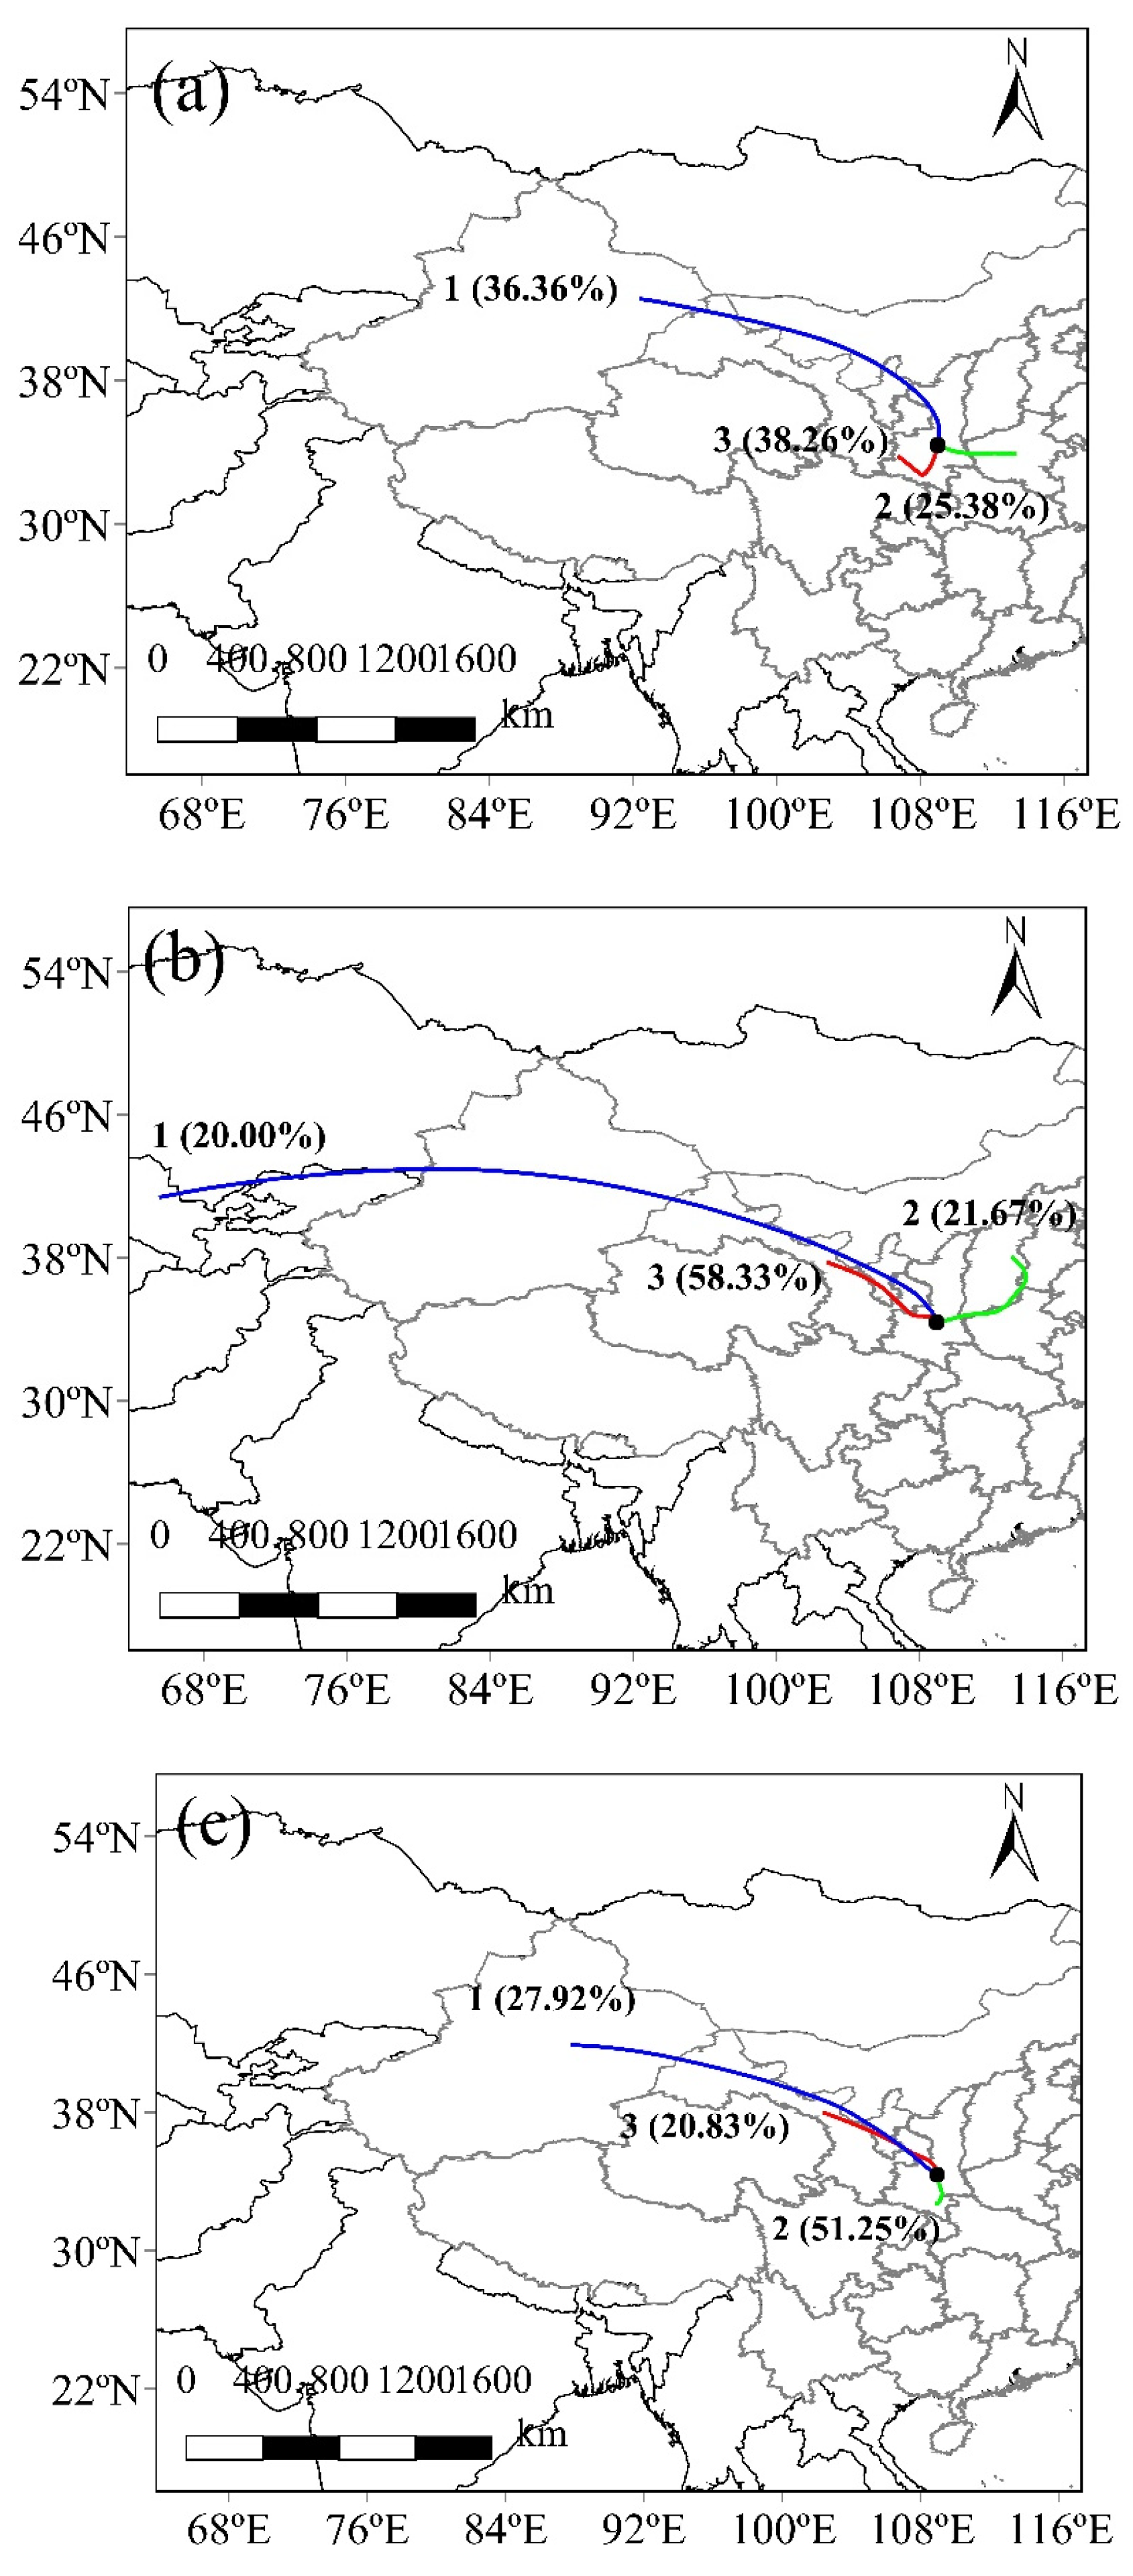
Using the EUCLIDEN algorithm of the Trajstat 3.5 software for the backward trajectory-clustering of air masses, three kinds of trajectories were classified based on the total spatial variance (Figure 4). The potential sources and transport paths of the dust process are explained below.
As shown in Figure 4a, in the pre-dust period, cluster 1 originated from the northwest of the country (Tibet, Inner Mongolia, and Gansu). It accounted for 36.36% of all trajectories, and the transport distance of the cluster was long. Clusters 2 and 3 corresponded to 25.38% and 38.26%, respectively, and had a shorter transport distance. The pollution air masses mainly came from the Henan province and the western and southern Shaanxi province. A cluster analysis was carried out at an interval of 1 h from the 13th to the 16th of March, when the dust storms affected the concentration of particles. It can be seen that there were three transport paths of sand and dust, all from the northwest and northeast directions of Xi’an (Figure 4b). Cluster 1 had the longest transport distance. The dust in Xi’an came from arid and semi-arid regions in China, such as Xinjiang and Inner Mongolia. Coarser particles could be brought by this air mass. Cluster 3, which accounted for the highest proportion of the total transport routes (58.33%), came from the Gansu province, and the transport distance was short. The clusters from the northwest of Xi’an accounted for 78.33% of the total trajectories. Cluster 2 came from the densely populated and economically developed northeast region (Henan, Shanxi, and Hebei), accounting for 21.67%. In this region, in the early spring, the northwest winds prevail, while, in the late spring, the southeast winds intensify [60]. In the post-dust period (Figure 4c), clusters 1 and 3 accounted for 48.75% of the trajectories and were influenced by the northwest winds from the Mongol–Siberian Plateau. Due to the influence of the southeast wind, cluster 2 originated from the southern Shaanxi province, accounting for 51.25% of the total trajectories.
The WPSCF and WCWT results for Xi’an in March 2022 are shown in Figure 5. The contribution levels of the potential source areas are represented by the colors in the figures, and the greater the WPSCF value, the higher the probability that the grid area is a potential source area of PBM (Figure 5a). The results of WCWT are shown in Figure 5b. The color reflects the PBM concentration level in the potential mercury source area. The higher the value, the larger the contribution of the area where the grid is located to the PBM concentration in Xi’an city. The WPSCF value of the PBM contains a relatively wide source region. The high values of WPSCF for PBM are mainly concentrated in several sources in Inner Mongolia, Ningxia, Gansu, Shaanxi, Hebei, and Henan. The WPSCF value distribution of PBM in Xi’an shows that Xi’an is mainly affected by the northwest region, the surrounding areas of the Shaanxi province, and the local PBM emission sources. Pollution in the heavily industrialized city of Lanzhou is dominated by sulfur dioxide from coal burning, which also leads to the emission of large amounts of mercury into the atmosphere [61]. The Hebei and Henan provinces are major sources of anthropogenic mercury emissions in China [62]. As depicted in Figure 5b, the results of WCWT and WPSCF for PBM concentration show similarities. Due to the slow transport speed, the residence time in polluted developed areas is long, leading to the accumulation of pollutants. The WCWT map for PBM showed that the WCWT values were mainly distributed in northwestern China and southern Inner Mongolia. The southwest of the Shaanxi province, the west of the Henan province, and the north of the Hebei province are the main potential source areas. These results indicate that we should pay attention not only to the emission of local pollution sources but also to other potential source areas when developing the emission and control strategy for atmospheric mercury in Xi’an.

3.3.2. Ratio of Trace Elements to Al in Dust Source

The average concentration of each component element during the study period is shown in Figure S5. With the exception of Zn and Cd, all the elements increased in the dust storm period compared to the non-dust storm period. The results show that dust has some influence on the element composition of aerosol. Other elements associated with the crust such as Ba and Mn also increased during the dust storm period. The source of Hg was further investigated by EF. In this paper, the mean background abundance of Hg (0.03 mg/kg) and Al (6.83 × 10⁵ mg/kg) in Shaanxi’s crust of surface layer A (China National Environmental Monitoring Centre, CNEMC, 1990) was defined as the calculated background concentration (CHg/CAl)crust of Hg [63]. The EF value (1650) during the dust storm in Xi’an exceeded 1000, revealing that the enrichment level of Hg reached “severe enrichment”. Compared with Yulin (EF = 53), a small town on the edge near the desert, Xi’an’s EF is relatively high in the spring. The results demonstrate that PBM pollution varies greatly between different regions. The EF values of PBM in Beijing (1704) in spring were similar to those in Xi’an’s dust storm period, suggesting that dust sources and anthropogenic emissions are mixed to varying degrees
Some studies have indicated that the tracers of dust sources can be expressed as the ratio of Ca, Mg, and Fe to Al [64]. Scatter plots of the ratios Ca/Al, Fe/Al, and Mg/Al are presented in Figure 6. The Ca/Al, Fe/Al, and Mg/Al ratios did not change significantly from the pre- to the post-dust storm period. The reduction in Ca/Al from the pre-dust storm to dust indicated that the invasion of dust had a significant effect on dust aerosols. According to the analysis of the aerosol elements collected on dust days, the average ratio of Ca/Al in the area was 1.5. This value is similar to the sand dust in the Loess Plateau (1.22) [65]. The Ca/Al ratio of PM2.5 in dust aerosols from the Taklimakan Desert is 1.65 [66], which is higher than the Ca/Al ratio of PM2.5 in Xi’an. This result shows that the dust aerosols transported into Xi’an from a long distance may have a dust mixture from the Taklimakan Desert in a far-western direction, as we found in the backward trajectory analysis (Figure 4).

3.4. Risk Assessment

3.4.1. Environmental Risk

The potential ecological risk assessment of the atmospheric PBM was carried out, and the evaluation results are presented in Table 2. Combined with the potential ecological risk index in Table S3, as shown in the results (Eri > 320), Hg presents a very high ecological hazard during the whole March research period. The mass concentration of Hg is not very high, and the content ratio in PM2.5 is low. However, due to its strong toxicity and high toxicity coefficient, PBM has the greatest potential harm to the ecology [67]. The conclusions of this study are similar to the ecological risk assessment results of PM2.5 mercury in Lanzhou city. As demonstrated in Table 2, the Igeo values of each period are greater than 0, indicating that Hg mainly comes from anthropogenic mercury emissions. The Igeo values range from 2.47 to 4.78, indicating that atmospheric PBM accounts for a strong degree of pollution. Especially in the dust storm period, the Eri and Igeo reach their highest values (1653.33 and 4.78). During the March period, the PBM is at high pollution levels. The results reveal that dust and anthropogenic sources have a great influence on PBM concentrations. Therefore, it is very important to strengthen the prevention and control of the atmospheric risks of low-concentration metal elements such as Hg.

3.4.2. Human Health Risk

An important component of total environmental risk includes the harm to human health caused by the combination of PM2.5 and heavy metals in the atmosphere, which has aroused widespread public concern in recent years. In this study, we assessed the non-carcinogenic health risks in children and adults living in Xi’an city. The non-carcinogenic risks of Hg in PM2.5 through three exposure routes (oral ingestion, inhalation, and dermal contact) are shown in Table S10. In terms of non-carcinogenic risk, an HI value between 5.95 × 10⁻³ and 1.60 × 10⁻¹ was less than the limit of 1 set by the USEPA, indicating that the non-carcinogenic risk of atmospheric PBM during the study period was within the safe range. As shown in Table S10, the values of HQ are HQing > HQinh > HQder, showing that the primary route of exposure is oral ingestion, followed by inhalation and dermal contact. This is mainly due to differences in heavy metal accumulation in the three exposure pathways and the sensitivity of human target organs to heavy metals. Oral ingestion is the main route of PBM exposure, and this finding is similar to other studies [38,68]. The HI value of children (8.48 × 10⁻²) was eight times higher than that of adults (1.01 × 10⁻²) during the whole study period. Because children are younger, have a lighter weight, and are much more sensitive to heavy metals than adults, it is easier for them to absorb metals from the digestive system [69]. Both for adults and children, the HI values in the dust storm period and the post-dust storm period were higher than those in the pre-dust storm period (Figure S6). This is mainly due to the higher mercury concentration and mercury mass content in the atmosphere during the dust storm period and the post-dust storm period. Finer particles may contain higher mercury mass fractions entering the respiratory system [70]. During the dust storm period, the maximum non-carcinogenic health risk value of PBM was 0.16. Between 2022 and 2023, a total of seven dust events occurred. The sum of the HI values of these seven dust processes was greater than 1. This shows that dust processes make mercury have a high non-carcinogenic risk effect on human health.
In addition to mercury, the hazards of other metals in PM2.5 are also a crucial component of human health risks. Table S11 shows the carcinogenic and non-carcinogenic health risk assessment for eight additional elements in PM2.5. The HI and CR values in children are higher than those in adults, indicating that the health risks to children’s health are greater and that high concentrations of metals are more harmful to the health of children. The integrated non-carcinogenic risk value (3.18) of Hg and other metal elements exceeds the safe value of 1, indicating that the metal elements in PM2.5 pose a non-carcinogenic risk to children’s health. Cr, Ni, As, and Cd are the carcinogens, and the integrated carcinogenic risk values for children and adults are 1.16 × 10⁻³ and 2.04 × 10⁻⁴, respectively (Table S11), indicating a high carcinogenic risk to the local population. Cr, Ni, As, and Cd in the atmosphere are mainly from coal combustion and smelting, and the control of pollutant emissions in the coal combustion and smelting industry can reduce their harm to the human body. In total, although the non-carcinogenic risk of Hg is low, the integrated non-carcinogenic risk of Hg and other metal elements is beyond the healthy level for children. The integrated carcinogenic and non-carcinogenic effects of metals in PM2.5 on human health should not be ignored.
Atmospheric PBM accounts for only a small proportion of the total atmospheric mercury, and it is important to consider the health risks of other forms of atmospheric mercury in order to fully assess the health risks of atmospheric mercury. There are many PBM health risk assessments for street dust [71], but there are few similar studies on atmospheric particulate matter in Xi’an. The results of this study lay a good foundation for further understanding the distribution of mercury in different media and supplement the understanding of mercury at the regional level.

3.5. Quantification of Oral Ingestion Exposure Pathways to Mercury

Oral ingestion is the main route of mercury exposure. We quantified the ingestion of wheat flour, vegetables, and aquatic products that leads to an intake of mercury that is equivalent to the daily accumulation due to exposure to PBM for adults and children. In the calculation, the maximum and minimum CDIing values for children and adults during the study period were used as the daily mercury intake content (Table S10). The concentrations of Hg in wheat flour, vegetables, and aquatic products are shown in Table S12. As described in Table 3, we can clearly see that the daily intake of mercury through oral exposure corresponds to the amount of food. Wheat flour is the staple food consumed by people in the Shaanxi province. The amount of mercury accumulated daily in adults and children through oral exposure is equivalent to eating, respectively, 9.97–50 g and 27.97–139.85 g of wheat flour per day. Due to the different distribution of body weight, intake rates, concentration of mercury in food, and bioavailability, the methods for quantifying the daily intake of mercury need to be further optimized. We should be concerned about the potential health risks caused by PBM, especially during the dust storm period in northwest China.

4. Conclusions

In this study, the mean concentrations of PM2.5 and PBM on dust days in March 2022 were 173.07 μg m−3 and 129.07 pg m−3, respectively, higher than those during non-dust days (153 μg m−3 and 76.83 pg m−3). Moreover, the peak value of PM2.5 was 334.34 μg m−3 and that of PBM was 186.11 pg m−3 during the dust storm period, indicating that dust had a strong enrichment effect on atmospheric PBM in Xi’an. Ca2+, Na+, Mg2+, SO42−, and metal elements significantly increased the correlation between PBM and water-soluble ions, highlighting the influence of natural sources (surface soil) and anthropogenic sources (biomass burning and fossil fuel burning) on PBM. The Ca/Al ratio in arid and semi-arid areas such as Xinjiang and Inner Mongolia in China, as a tracer analysis, shows that the invading dust aerosols may come from the northwestern desert in China (Taklimakan Desert). Igeo values greater than 0 at all times indicate that mercury is mainly from anthropogenic mercury emissions. Due to the strong toxicity and toxicity coefficient of mercury, in the dust storm period and later dust storm periods, PBM posed a moderate pollution level to the ecological environment. Oral ingestion was the primary exposure route, followed by respiratory and skin contact exposure routes. Compared to adults, children have a greater non-carcinogenic risk for PBM. Meanwhile, we should pay attention to the integrated carcinogenic and non-carcinogenic health effects of metal elements in atmospheric particles on the human body. This study provides a data basis for the study of atmospheric mercury concentration changes during spring sandstorms in northwest China and an important opportunity for understanding the impact of atmospheric mercury on the health of residents, as well as helps formulate effective mercury emission control strategies to minimize the adverse effects of mercury on human health and the environment.

Supplementary Materials

The following supporting information can be downloaded at https://www.mdpi.com/article/10.3390/su16104096/s1. References [72,73,74,75,76,77,78,79,80,81,82,83,84,85,86,87,88,89] are cited in Supplementary Materials.

Author Contributions

X.L.: supervision, conceptualization, writing—review and editing, validation, project administration, and funding acquisition. R.Z.: formal analysis, methodology, software, writing—original draft, and writing—review and editing. L.T.: writing—review and editing. J.G. (Jingning Guo): data curation. W.Y.: data curation. J.G. (Junming Guo): conceptualization, methodology, and writing—review and editing. All authors have read and agreed to the published version of the manuscript.

Funding

This work was supported by the National Natural Science Foundation of China (42177366), the State Key Laboratory of Cryospheric Sciences, the Chinese Academy of Sciences (SKLCSZZ-2023), the State Key Laboratory of Loess and Quaternary Geology (SKLLQG2133), the Key Laboratory for Ecology and Environment of River Wetlands in Shaanxi Province (SXSD202403), and the Scientific Research Program Funded by Shaanxi Provincial Education Department (Program No. 21JP040).

Institutional Review Board Statement

Not applicable.

Informed Consent Statement

Not applicable.

Data Availability Statement

Data will be made available upon request.

Conflicts of Interest

The authors declare that they have no known competing financial interests or personal relationships that could have appeared to influence the work reported in this paper.

References

  1. Schroeder, W.H.; Munthe, J. Atmospheric mercury—An overview. Atmos. Environ. 1998, 32, 809–822. [Google Scholar] [CrossRef]
  2. U.S. EPA. Mercury Study Report to Congress; Office of Air Quality Planning and Standards and Office of Research and Development, US Environmental Protection Agency: Washington, DC, USA, 1997.
  3. Hammerschmidt, C.R.; Fitzgerald, W.F. Methylmercury in freshwater fish linked to atmospheric mercury deposition. Environ. Sci. Technol. 2006, 40, 7764–7770. [Google Scholar] [CrossRef] [PubMed]
  4. Cohen, M.; Artz, R.; Draxler, R.; Miller, P.; Poissant, L.; Niemi, D.; Ratte, D.; Deslauriers, M.; Duval, R.; Laurin, R.; et al. Modeling the atmospheric transport and deposition of mercury to the Great Lakes. Environ. Res. 2004, 95, 247–265. [Google Scholar] [CrossRef] [PubMed]
  5. Lu, J.; Schroeder, W. Sampling and determination of particulate mercury in ambient air: A review. Water Air Soil Pollut. 1999, 112, 279–295. [Google Scholar] [CrossRef]
  6. Lindberg, S.; Brooks, S.; Lin, C.; Scott, K.; Meyers, T.; Chambers, L.; Landis, M.; Stevens, R. Formation of reactive gaseous mercury in the Arctic: Evidence of oxidation of Hg to gas-phase Hg-II compounds after Arctic sunrise. Water Air Soil Pollut. Focus 2001, 1, 295–302. [Google Scholar] [CrossRef]
  7. Zhang, H.; Fu, X.; Wang, X.; Feng, X. Measurements and distribution of atmospheric particulate-bound mercury: A review. Bull. Environ. Contam. Toxicol. 2019, 103, 48–54. [Google Scholar] [CrossRef] [PubMed]
  8. Streets, D.G.; Devane, M.K.; Lu, Z.; Bond, T.C.; Sunderland, E.M.; Jacob, D.J. All-time releases of mercury to the atmosphere from human activities. Environ. Sci. Technol. 2011, 45, 10485–10491. [Google Scholar] [CrossRef] [PubMed]
  9. Obrist, D. Atmospheric mercury pollution due to losses of terrestrial carbon pools? Biogeochemistry 2007, 85, 119–123. [Google Scholar] [CrossRef]
  10. Streets, D.G.; Hao, J.; Wu, Y.; Jiang, J.; Chan, M.; Tian, H.; Feng, X. Anthropogenic mercury emissions in China. Atmos. Environ. 2005, 39, 7789–7806. [Google Scholar] [CrossRef]
  11. Wilson, S.J.; Steenhuisen, F.; Pacyna, J.M.; Pacyna, E.G. Mapping the spatial distribution of global anthropogenic mercury atmospheric emission inventories. Atmos. Environ. 2006, 40, 4621–4632. [Google Scholar] [CrossRef]
  12. Pacyna, E.G.; Pacyna, J.; Sundseth, K.; Munthe, J.; Kindbom, K.; Wilson, S.; Steenhuisen, F.; Maxson, P. Global emission of mercury to the atmosphere from anthropogenic sources in 2005 and projections to 2020. Atmos. Environ. 2010, 44, 2487–2499. [Google Scholar] [CrossRef]
  13. Pacyna, E.G.; Pacyna, J.M.; Steenhuisen, F.; Wilson, S. Global anthropogenic mercury emission inventory for 2000. Atmos. Environ. 2006, 40, 4048–4063. [Google Scholar] [CrossRef]
  14. Pirrone, N.; Cinnirella, S.; Feng, X.; Finkelman, R.B.; Friedli, H.R.; Leaner, J.; Mason, R.; Mukherjee, A.B.; Stracher, G.B.; Streets, D.; et al. Global mercury emissions to the atmosphere from anthropogenic and natural sources. Atmos. Chem. Phys. 2010, 10, 5951–5964. [Google Scholar] [CrossRef]
  15. Wu, Y.; Wang, S.; Streets, D.G.; Hao, J.; Chan, M.; Jiang, J. Trends in anthropogenic mercury emissions in China from 1995 to 2003. Environ. Sci. Technol. 2006, 40, 5312–5318. [Google Scholar] [CrossRef] [PubMed]
  16. Jiang, J.; Hao, J.; Wu, Y.; Duan, L.; Tian, H. Preliminary study on atmospheric mercury emission and control in China. Environ. Sci. Technol. 2005, 26, 34–39. (In Chinese) [Google Scholar]
  17. Wu, C.; Wang, G.; Cao, C.; Li, J.; Li, J.; Wu, F.; Huang, R.; Cao, J.; Han, Y.; Ge, S.; et al. Chemical characteristics of airborne particles in Xi’an, inland China during dust storm episodes: Implications for heterogeneous formation of ammonium nitrate and enhancement of N-deposition. Environ. Pollut. 2019, 244, 877–884. [Google Scholar] [CrossRef] [PubMed]
  18. Leaitch, W.; Macdonald, A.; Anlauf, K.; Liu, P.; Toom-Sauntry, D.; Li, S.; Liggio, J.; Hayden, K.; Wasey, M.; Russell, L.; et al. Evidence for Asian dust effects from aerosol plume measurements during INTEX-B 2006 near Whistler, BC. Atmos. Chem. Phys. 2008, 8, 18531–18589. [Google Scholar] [CrossRef]
  19. VanCuren, R.A.; Cahill, T.A. Asian aerosols in North America: Frequency and concentration of fine dust. J. Geophys. Res.—Atmos. 2002, 107, AAC 19-1–AAC 19-16. [Google Scholar] [CrossRef]
  20. Cao, J.; Lee, S.; Zhang, X.; Chow, J.C.; An, Z.; Ho, K.; Watson, J.G.; Fung, K.; Wang, Y.; Shen, Z. Characterization of airborne carbonate over a site near Asian dust source regions during spring 2002 and its climatic and environmental significance. J. Geophys. Res.-Atmos. 2005, 110, D03203. [Google Scholar] [CrossRef]
  21. Zhang, Q.; Shen, Z.; Cao, J.; Ho, K.; Zhang, R.J.; Bie, Z.; Chang, H.; Liu, S. Chemical profiles of urban fugitive dust over Xi’an in the south margin of the Loess Plateau, China. Atmos. Pollut. Res. 2014, 5, 421–430. [Google Scholar] [CrossRef]
  22. Wang, Y.; Zhuang, G.; Sun, Y.; An, Z. The variation of characteristics and formation mechanisms of aerosols in dust, haze, and clear days in Beijing. Atmos. Environ. 2006, 40, 6579–6591. [Google Scholar] [CrossRef]
  23. Li, Y.; Wang, Y.; Li, Y.; Li, T.; Mao, H.; Talbot, R.; Nie, X.; Wu, C.; Zhao, Y.; Hou, C.; et al. Characteristics and potential sources of atmospheric particulate mercury in Jinan, China. Sci. Total Environ. 2017, 574, 1424–1431. [Google Scholar] [CrossRef] [PubMed]
  24. Fu, X.; Feng, X.; Qiu, G.; Shang, L.; Zhang, H. Speciated atmospheric mercury and its potential source in Guiyang, China. Atmos. Environ. 2011, 45, 4205–4212. [Google Scholar] [CrossRef]
  25. Turnbull, A.B.; Harrison, R.M. Major component contributions to PM10 composition in the UK atmosphere. Atmos. Environ. 2000, 34, 3129–3137. [Google Scholar] [CrossRef]
  26. Filonchyk, M.; Peterson, M.P.; Zhang, L.; Yan, H. An analysis of air pollution associated with the 2023 sand and dust storms over China: Aerosol properties and PM10 variability. Geosci. Front. 2024, 15, 101762. [Google Scholar] [CrossRef]
  27. Liu, J.; Scheuer, E.; Dibb, J.; Ziemba, L.D.; Thornhill, K.; Anderson, B.E.; Wisthaler, A.; Mikoviny, T.; Devi, J.J.; Bergin, M.; et al. Brown carbon in the continental troposphere. Geophys. Res. Lett. 2014, 41, 2191–2195. [Google Scholar] [CrossRef]
  28. Steding, D.J.; Flegal, A.R. Mercury concentrations in coastal California precipitation: Evidence of local and trans-Pacific fluxes of mercury to North America. J. Geophys. Res.—Atmos. 2002, 107, ACH 11-1–ACH 11-7. [Google Scholar] [CrossRef]
  29. Shukla, A.K.; Lalchandani, V.; Bhattu, D.; Dave, J.S.; Rai, P.; Thamban, N.M.; Mishra, S.; Gaddamidi, S.; Tripathi, N.; Vats, P.; et al. Real-time quantification and source apportionment of fine particulate matter including organics and elements in Delhi during summertime. Atmos. Environ. 2021, 261, 118598. [Google Scholar] [CrossRef]
  30. Tian, L.; Li, J.; Zhao, S.; Tang, J.; Li, J.; Guo, H.; Liu, X.; Zhong, G.; Xu, Y.; Lin, T.; et al. DDT, Chlordane, and Hexachlorobenzene in the air of the pearl river delta revisited: A tale of source, history, and monsoon. Environ. Sci. Technol. 2021, 55, 9740–9749. [Google Scholar] [CrossRef]
  31. Hakanson, L. An ecological risk index for aquatic pollution control. A sedimentological approach. Water Res. 1980, 14, 975–1001. [Google Scholar] [CrossRef]
  32. Keeler, G.; Glinsorn, G.; Pirrone, N. Particulate mercury in the atmosphere: Its significance, transport, transformation and sources. Water Air Soil Pollut. 1995, 80, 159–168. [Google Scholar] [CrossRef]
  33. Bo, D.; Cheng, J.; Xie, H.; Zhao, W.; Wei, Y.; Chen, X. Mercury concentration in fine atmospheric particles during haze and non-haze days in Shanghai, China. Atmos. Pollut. Res. 2016, 7, 348–354. [Google Scholar] [CrossRef]
  34. Yu, B.; Yang, L.; Liu, H.; Xiao, C.; Bu, D.; Zhang, Q.; Fu, J.; Zhang, Q.; Cong, Z.; Liang, Y.; et al. Tracing the transboundary transport of mercury to the Tibetan Plateau using atmospheric mercury isotopes. Environ. Sci. Technol. 2022, 56, 1568–1577. [Google Scholar] [CrossRef] [PubMed]
  35. Yu, G.; Qin, X.; Xu, J.; Zhou, Q.; Wang, B.; Huang, K.; Deng, C. Characteristics of particulate-bound mercury at typical sites situated on dust transport paths in China. Sci. Total Environ. 2019, 648, 1151–1160. [Google Scholar] [CrossRef] [PubMed]
  36. Fu, X.; Feng, X.; Liang, P.; Deliger; Zhang, H.; Ji, J.; Liu, P. Temporal trend and sources of speciated atmospheric mercury at Waliguan GAW station, Northwestern China. Atmos. Chem. Phys. 2012, 12, 1951–1964. [Google Scholar] [CrossRef]
  37. Fu, X.; Feng, X.; Zhu, W.; Zheng, W.; Wang, S.; Lu, J.Y. Total particulate and reactive gaseous mercury in ambient air on the eastern slope of the Mt. Gongga area, China. Appl. Geochem. 2008, 23, 408–418. [Google Scholar] [CrossRef]
  38. Nguyen, L.S.P.; Hien, T.T.; Truong, M.T.; Chi, N.D.T.; Sheu, G.R. Atmospheric particulate-bound mercury (PBM10) in a Southeast Asia megacity: Sources and health risk assessment. Chemosphere 2022, 307, 135707. [Google Scholar] [CrossRef] [PubMed]
  39. Guo, J.; Kang, S.; Huang, J.; Zhang, Q.; Rupakheti, M.; Sun, S.; Tripathee, L.; Rupakheti, D.; Panday, A.K.; Sillanpää, M.; et al. Characterizations of atmospheric particulate-bound mercury in the Kathmandu Valley of Nepal, South Asia. Sci. Total Environ. 2017, 579, 1240–1248. [Google Scholar] [CrossRef]
  40. Brooks, S.; Luke, W.; Cohen, M.; Kelly, P.; Lefer, B.; Rappenglück, B. Mercury species measured atop the Moody Tower TRAMP site, Houston, Texas. Atmos. Environ. 2010, 44, 4045–4055. [Google Scholar] [CrossRef]
  41. Pyta, H.; Widziewicz-Rzońca, K.; Słaby, K. Inhalation exposure to gaseous and particulate bound mercury present in the ambient air over the polluted area of southern Poland. Int. J. Environ. Res. Public Health 2020, 17, 4999. [Google Scholar] [CrossRef]
  42. Song, X.; Cheng, I.; Lu, J. Annual atmospheric mercury species in downtown Toronto, Canada. J. Environ. Monit. 2009, 11, 660–669. [Google Scholar] [CrossRef] [PubMed]
  43. Moreda-Piñeiro, J.; Rodríguez-Cabo, A.; Fernández-Amado, M.; Piñeiro-Iglesias, M.; Muniategui-Lorenzo, S.; López-Mahía, P. Levels and sources of atmospheric particle-bound mercury in atmospheric particulate matter (PM10) at several sites of an Atlantic Coastal European Region. Atmosphere 2019, 11, 33. [Google Scholar] [CrossRef]
  44. Sun, R.; Sun, G.; Kwon, S.Y.; Feng, X.; Kang, S. Mercury biogeochemistry over the Tibetan Plateau: An overview. Crit. Rev. Environ. Sci. Technol. 2021, 51, 577–602. [Google Scholar] [CrossRef]
  45. Xiu, G.L.; Jin, Q.; Zhang, D.; Shi, S.; Huang, X.; Zhang, W.; Bao, L.; Gao, P.; Chen, B. Characterization of size-fractionated particulate mercury in Shanghai ambient air. Atmos. Environ. 2005, 39, 419–427. [Google Scholar] [CrossRef]
  46. Das, R.; Wang, X.; Khezri, B.; Webster, R.D.; Sikdar, P.K.; Datta, K. Mercury isotopes of atmospheric particle bound mercury for source apportionment study in urban Kolkata, India. Elementa 2016, 4, 000098. [Google Scholar] [CrossRef]
  47. Lynam, M.M.; Dvonch, J.T.; Hall, N.L.; Morishita, M.; Barres, J.A. Spatial patterns in wet and dry deposition of atmospheric mercury and trace elements in central Illinois, USA. Environ. Sci. Pollut. Res. 2014, 21, 4032–4043. [Google Scholar] [CrossRef] [PubMed]
  48. Dai, Z.H.; Feng, X.B.; Sommar, J.; Li, P.; Fu, X.W. Spatial distribution of mercury deposition fluxes in Wanshan Hg mining area, Guizhou province, China. Atmos. Chem. Phys. 2012, 12, 6207–6218. [Google Scholar] [CrossRef]
  49. Zhang, Y.; Liu, R.; Wang, Y.; Cui, X.; Qi, J. Change characteristic of atmospheric particulate mercury during dust weather of spring in Qingdao, China. Atmos. Environ. 2015, 102, 376–383. [Google Scholar] [CrossRef]
  50. Zhang, H.; Fu, X.W.; Lin, C.J.; Wang, X.; Feng, X.B. Observation and analysis of speciated atmospheric mercury in Shangri-La, Tibetan Plateau, China. Atmos. Chem. Phys. 2015, 15, 653–665. [Google Scholar] [CrossRef]
  51. Duan, L.; Cheng, N.; Xiu, G.; Wang, F.; Chen, Y. Characteristics and source appointment of atmospheric particulate mercury over East China Sea: Implication on the deposition of atmospheric particulate mercury in marine environment. Environ. Pollut. 2017, 224, 26–34. [Google Scholar] [CrossRef]
  52. Shen, Z.; Cao, J.; Arimoto, R.; Han, Z.; Zhang, R.J.; Han, Y.; Liu, S.; Okuda, T.; Nakao, S.; Tanaka, S. Ionic composition of TSP and PM2.5 during dust storms and air pollution episodes at Xi’an, China. Atmos. Environ. 2009, 43, 2911–2918. [Google Scholar] [CrossRef]
  53. Tang, M.; Cziczo, D.J.; Grassian, V.H. Interactions of water with mineral dust aerosol: Water adsorption, hygroscopicity, cloud condensation, and ice nucleation. Chem. Rev. 2016, 116, 4205–4259. [Google Scholar] [CrossRef] [PubMed]
  54. Chow, J.C.; Watson, J.G.; Kuhns, H.; Etyemezian, V.; Lowenthal, D.H.; Crow, D.; Kohl, S.D.; Engelbrecht, J.P.; Green, M.C. Source profiles for industrial, mobile, and area sources in the Big Bend Regional Aerosol Visibility and Observational study. Chemosphere 2004, 54, 185–208. [Google Scholar] [CrossRef] [PubMed]
  55. Jacobs, J.; Kreutzer, R.; Smith, D. Rice burning and asthma hospitalizations, Butte County, California, 1983-1992. Environ. Health Perspect. 1997, 105, 980–985. [Google Scholar] [CrossRef] [PubMed]
  56. Huang, F.; Zhou, J.; Chen, N.; Li, Y.; Li, K.; Wu, S. Chemical characteristics and source apportionment of PM2.5 in Wuhan, China. J. Atmos. Chem. 2019, 76, 245–262. [Google Scholar] [CrossRef]
  57. Shen, R.; Schäfer, K.; Shao, L.; Schnelle-Kreis, J.; Wang, Y.; Li, F.; Liu, Z.; Emeis, S.; Schmid, H.P. Chemical characteristics of PM2.5 during haze episodes in spring 2013 in Beijing. Urban Clim. 2017, 22, 51–63. [Google Scholar] [CrossRef]
  58. Li, R.; Zhang, M.; Du, Y.; Wang, G.; Shang, C.; Liu, Y.; Zhang, M.; Meng, Q.; Cui, M.; Yan, C. Impacts of dust events on chemical characterization and associated source contributions of atmospheric particulate matter in northern China. Environ. Pollut. 2023, 316, 120597. [Google Scholar] [CrossRef] [PubMed]
  59. Xu, L.; Chen, J.; Niu, Z.; Yin, L.; Chen, Y. Characterization of mercury in atmospheric particulate matter in the southeast coastal cities of China. Atmos. Pollut. Res. 2013, 4, 454–461. [Google Scholar] [CrossRef]
  60. Yang, L.; Zhang, S.; Huang, Z.; Yang, Y.; Wang, L.; Han, W.; Li, X.Y. Characteristics of Dust Events in China from 2015 to 2020. Atmosphere 2021, 12, 952. [Google Scholar] [CrossRef]
  61. Yin, X.; Zhou, W.; Kang, S.; de Foy, B.; Yu, Y.; Xie, J.; Sun, S.; Wu, K.; Zhang, Q. Latest observations of total gaseous mercury in a megacity (Lanzhou) in northwest China. Sci. Total Environ. 2020, 720, 137494. [Google Scholar] [CrossRef]
  62. Lindberg, S.; Bullock, R.; Ebinghaus, R.; Engstrom, D.; Feng, X.; Fitzgerald, W.; Pirrone, N.; Prestbo, E.; Seigneur, C. A synthesis of progress and uncertainties in attributing the sources of mercury in deposition. AMBIO 2007, 36, 19–33. [Google Scholar] [CrossRef]
  63. CNEMC. Background Abundance of Soil Elements in China; China National Environmental Monitoring Centre: Beijing, China, 1990. (In Chinese) [Google Scholar]
  64. Shen, Z.; Cao, J.; Arimoto, R.; Zhang, R.J.; Jie, D.; Liu, S.; Zhu, C. Chemical composition and source characterization of spring aerosol over Horqin sand land in northeastern China. J. Geophys. Res. 2007, 112, D14315. [Google Scholar] [CrossRef]
  65. Cao, J.; Chow, J.; Watson, J.; Wu, F.; Han, Y.; Jin, Z.; Shen, Z.; An, Z. Size-differentiated source profiles for fugitive dust in the Chinese Loess Plateau. Atmos. Environ. 2008, 42, 2261–2275. [Google Scholar] [CrossRef]
  66. Wang, Q.; Zhuang, G.; Li, J.; Huang, K.; Zhang, R.J.; Jiang, Y.; Lin, Y.; Fu, J.S. Mixing of dust with pollution on the transport path of Asian dust—Revealed from the aerosol over Yulin, the north edge of Loess Plateau. Sci. Total Environ. 2011, 409, 573–581. [Google Scholar] [CrossRef] [PubMed]
  67. Huang, S.; Tu, J.; Liu, H.; Hua, M.; Liao, Q.; Feng, J.; Weng, Z.; Huang, G. Multivariate analysis of trace element concentrations in atmospheric deposition in the Yangtze River Delta, East China. Atmos. Environ. 2009, 43, 5781–5790. [Google Scholar] [CrossRef]
  68. Huang, M.; Chen, X.; Shao, D.; Zhao, Y.; Wang, W.; Wong, M.H. Risk assessment of arsenic and other metals via atmospheric particles, and effects of atmospheric exposure and other demographic factors on their accumulations in human scalp hair in urban area of Guangzhou, China. Ecotoxicol. Environ. Saf. 2014, 102, 84–92. [Google Scholar] [CrossRef] [PubMed]
  69. Sah, D.; Verma, P.K.; Kandikonda, M.K.; Lakhani, A. Pollution characteristics, human health risk through multiple exposure pathways, and source apportionment of heavy metals in PM10 at Indo-Gangetic site. Urban Clim. 2019, 27, 149–162. [Google Scholar] [CrossRef]
  70. Cui, L.; Wu, Z.; Han, P.; Taira, Y.; Wang, H.; Meng, Q.; Feng, Z.; Zhai, S.; Yu, J.; Zhu, W.; et al. Chemical content and source apportionment of 36 heavy metal analysis and health risk assessment in aerosol of Beijing. Environ. Sci. Pollut. Res. 2020, 27, 7005–7014. [Google Scholar] [CrossRef] [PubMed]
  71. Lu, X.; Wu, X.; Wang, Y.; Chen, H.; Gao, P.; Fu, Y. Risk assessment of toxic metals in street dust from a medium-sized industrial city of China. Ecotoxicol. Environ. Saf. 2014, 106, 154–163. [Google Scholar] [CrossRef] [PubMed]
  72. Fang, F.; Wang, Q.; Liu, R.; Ma, Z.; Hao, Q. Atmospheric particulate mercury in Changchun city, China. Atmos. Environ. 2001, 35, 4265–4272. [Google Scholar] [CrossRef]
  73. Lyman, S.N.; Gustin, M.S.; Prestbo, E.M.; Marsik, F.J. Estimation of dry deposition of atmospheric mercury in Nevada by direct and indirect methods. Environ. Sci. Technol. 2007, 41, 1970–1976. [Google Scholar] [CrossRef]
  74. Huang, J.; Kang, S.; Guo, J.; Zhang, Q.; Cong, Z.; Sillanpää, M.; Zhang, G.; Sun, S.; Tripathee, L. Atmospheric particulate mercury in Lhasa city, Tibetan Plateau. Atmos. Environ. 2016, 142, 433–441. [Google Scholar] [CrossRef]
  75. Polissar, A.V.; Hopke, P.K.; Harris, J.M. Source regions for atmospheric aerosol measured at Barrow, Alaska. Environ. Sci. Technol. 2001, 35, 4214–4226. [Google Scholar] [CrossRef] [PubMed]
  76. Wang, Y.; Zhang, X.; Arimoto, R. The contribution from distant dust sources to the atmospheric particulate matter loadings at Xi’an, China during spring. Sci. Total Environ. 2006, 368, 875–883. [Google Scholar] [CrossRef] [PubMed]
  77. Zhang, X.; Eto, Y.; Aikawa, M. Risk assessment and management of PM2.5-bound heavy metals in the urban area of Kitakyushu, Japan. Sci. Total Environ. 2021, 795, 148748. [Google Scholar] [CrossRef]
  78. Li, H.; Chen, Q.; Wang, C.; Wang, R.; Sha, T.; Yang, X.; Ainur, D. Pollution characteristics of environmental persistent free radicals (EPFRs) and their contribution to oxidation potential in road dust in a large city in northwest China. J. Hazard. Mater. 2023, 442, 130087. [Google Scholar] [CrossRef] [PubMed]
  79. Wei, M.; Zhang, X.; Zhang, K.; Ussher, S.J.; Lu, W.; Li, J.; Meng, F. The characteristics of atmospheric particles and metal elements during winter in BeiJing: Size distribution, source analysis, and environmental risk assessment. Ecotoxicol. Environ. Saf. 2021, 211, 111937. [Google Scholar] [CrossRef] [PubMed]
  80. Schleicher, N.; Schäfer, J.; Blanc, G.; Chen, Y.; Chai, F.; Cen, K.; Norra, S. Atmospheric particulate mercury in the megacity Beijing: Spatio-temporal variations and source apportionment. Atmos. Environ. 2015, 109, 251–261. [Google Scholar] [CrossRef]
  81. Kim, P.R.; Han, Y.J.; Holsen, T.M.; Yi, S.M. Atmospheric particulate mercury: Concentrations and size distributions. Atmos. Environ. 2012, 61, 94–102. [Google Scholar] [CrossRef]
  82. Sakata, M.; Marumoto, K. Formation of atmospheric particulate mercury in the Tokyo metropolitan area. Atmos. Environ. 2002, 36, 239–246. [Google Scholar] [CrossRef]
  83. USEPA. Supplemental Guidance for Developing Soil Screening Levels for Superfund Sites; Peer Review Draft; Office of Solid Waste and Emergency Response (OSWER): Washington, DC, USA, 2001; Volume 9355, pp. 4–24.
  84. Jiang, N.; Liu, X.; Wang, S.; Yu, X.; Yin, S.; Duan, S.; Wang, S.; Zhang, R.; Li, S. Pollution characterization, source identification, and health risks of atmospheric-particle-bound heavy metals in PM10 and PM2.5 at multiple sites in an emerging megacity in the central region of China. Aerosol Air Qual. Res. 2019, 19, 247–271. [Google Scholar] [CrossRef]
  85. USEPA. Human Health Evaluation Manual. In Risk Assessment Guidance for Superfund; Office of Soild Waste and Emergency Response: Washington, DC, USA, 1989. [Google Scholar]
  86. Sun, G.; Li, Z.; Bi, X.; Chen, Y.; Lu, S.; Yuan, X. Distribution, sources and health risk assessment of mercury in kindergarten dust. Atmos. Environ. 2013, 73, 169–176. [Google Scholar] [CrossRef]
  87. Lei, L.; Liang, D.; Yu, D.; Chen, Y.; Song, W.; Li, J. Human health risk assessment of heavy metals in the irrigated area of Jinghui, Shaanxi, China, in terms of wheat flour consumption. Environ. Monit. Assess. 2015, 187, 647. [Google Scholar] [CrossRef] [PubMed]
  88. Li, G.; Su, H.; Duan, M.; Ma, W.; Sun, X. Analysis and evaluation of heavy metal pollution in vegetables in Xi’an City. Acta Bot. Boreali-Occident. Sin. 2008, 28, 1904–1909. (In Chinese) [Google Scholar]
  89. Ren, H.; Tian, Q.; Yang, Y.; Hou, S. Distribution characteristics and edible safety evaluation of heavy metals in aquatic products from Shaanxi Province. Anhui Agricul. Sci. 2017, 45, 81–84. [Google Scholar]
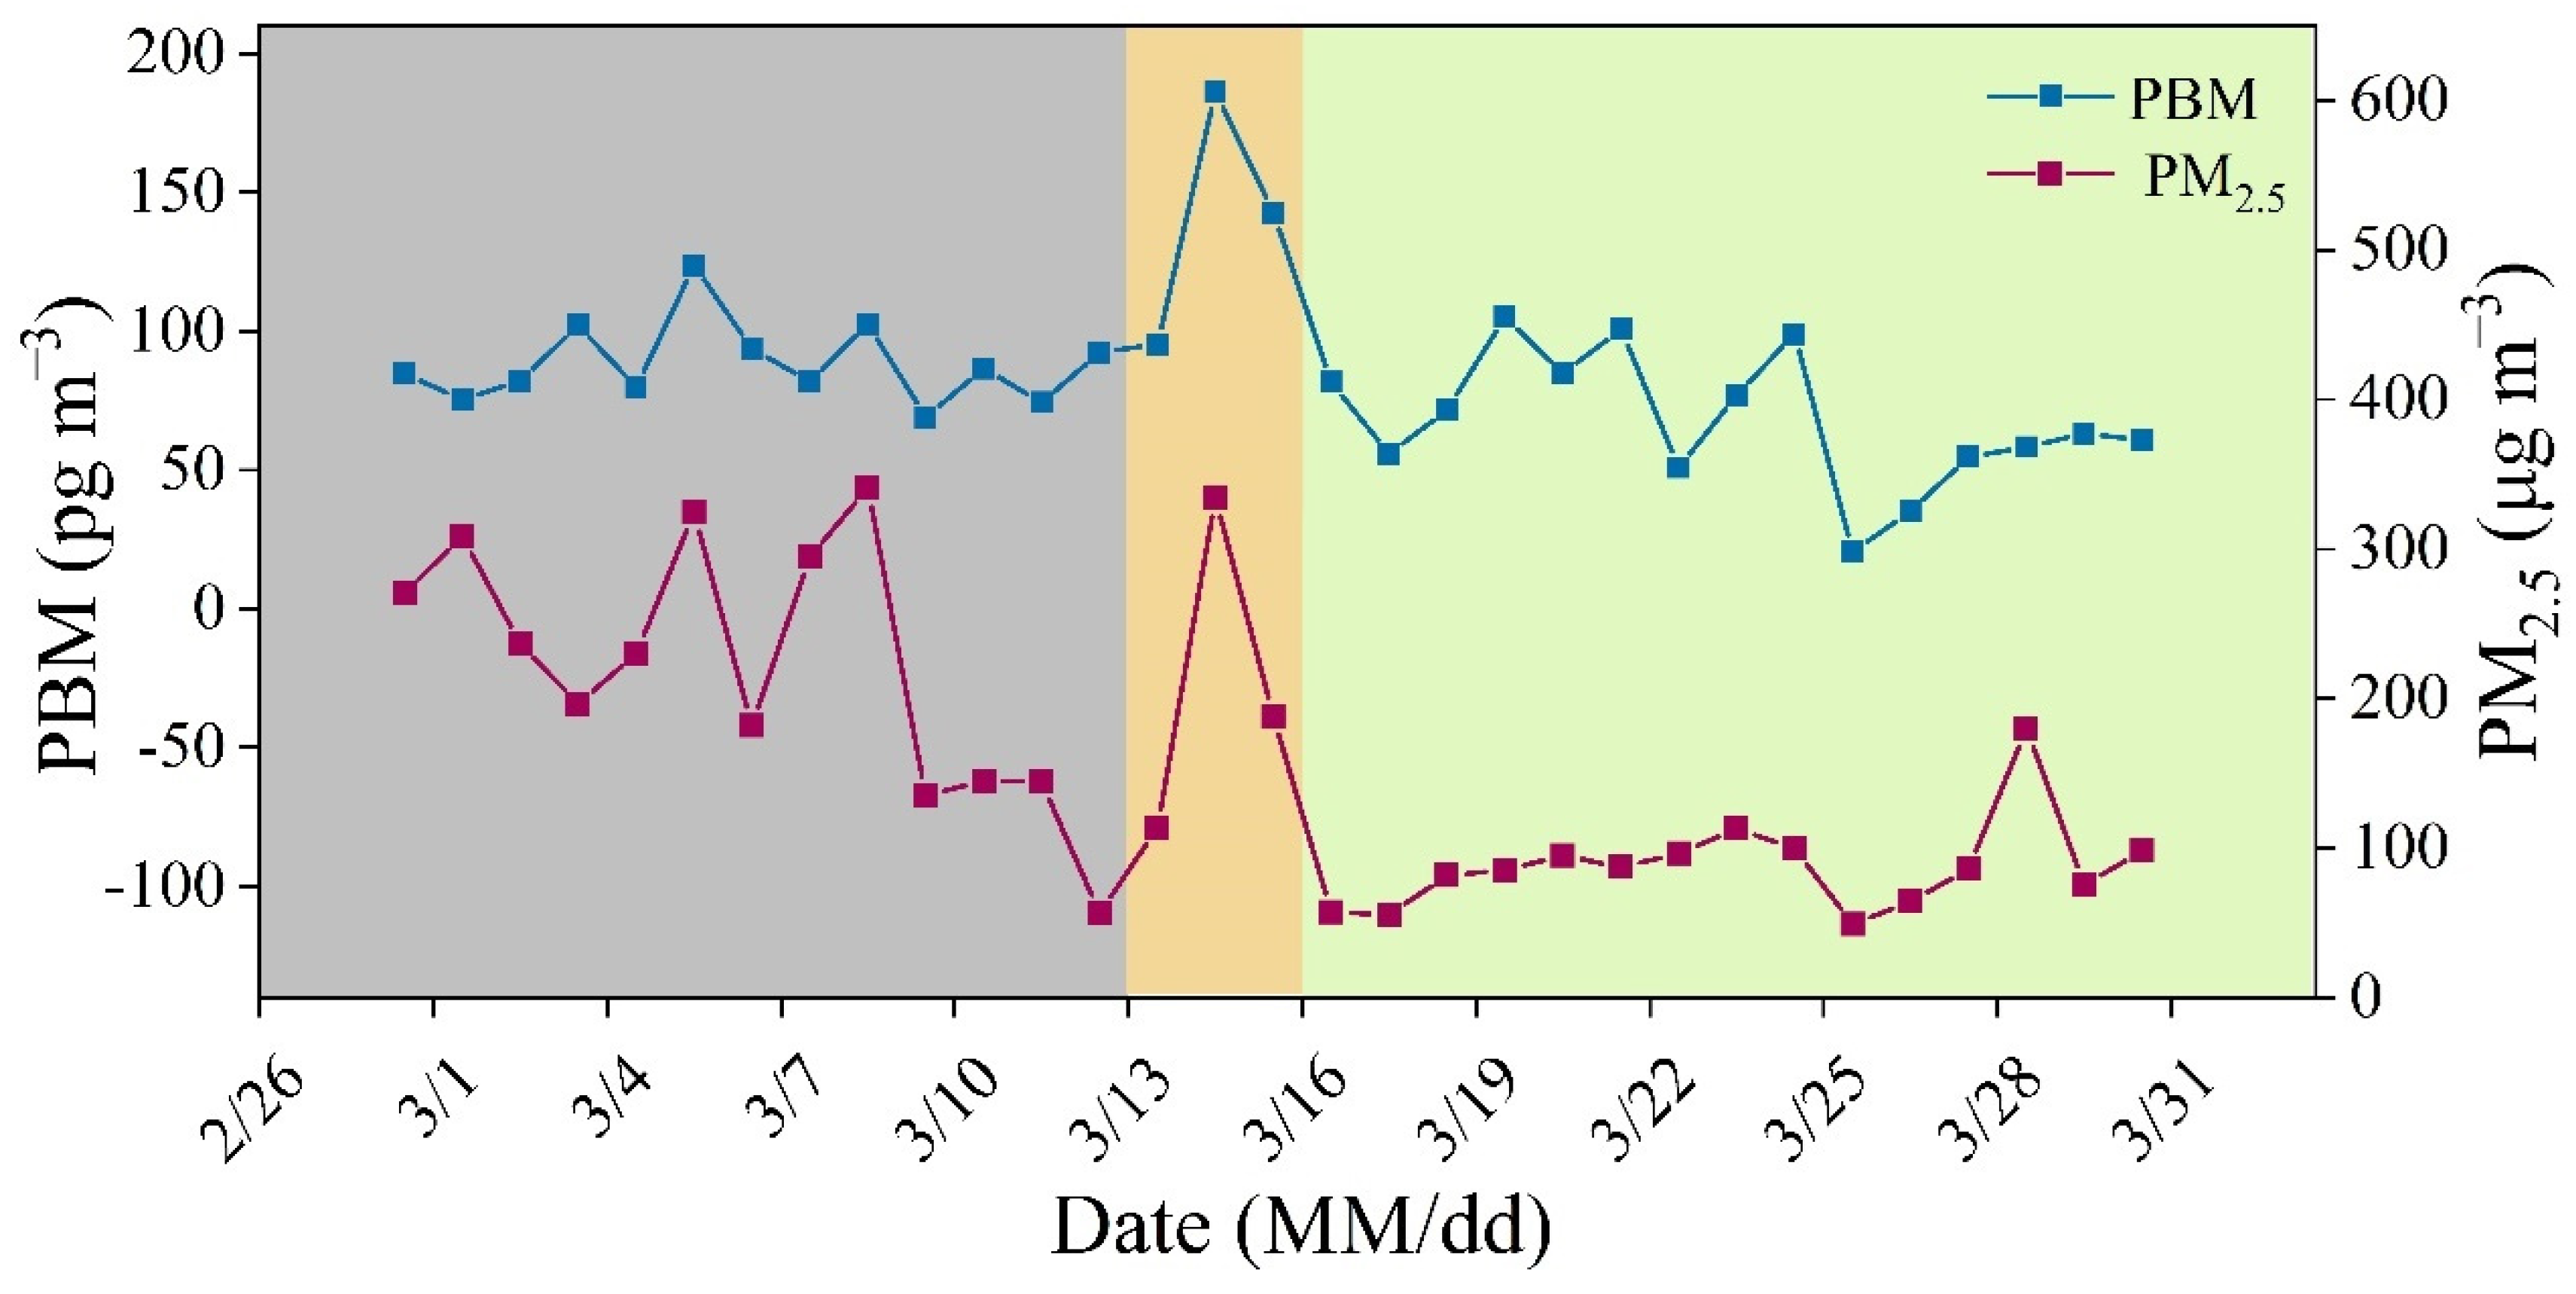
Figure 1. Concentrations variation in PBM and PM2.5 during the sampling period. (The gray shading highlights the pre-dust storm period, the yellow shading highlights the dust storm period, the green shading highlights the post-dust storm period).
Sustainability 16 04096 g001
Figure 2. PBM concentration and PBM/PM2.5 ratio (a); PBM/PM2.5 ratio and PM2.5 mass (b).
Sustainability 16 04096 g002
Figure 3. The mass loading percentage (%) of water-soluble ions in PM2.5 in dust storms (a) and non-dust storms (b), and the regression of PBM with ion constituent concentrations (Na+, NH4+, K+, Mg2+, Ca2+, Cl, SO42−, and NO3) during the sampling period (c).
Sustainability 16 04096 g003aSustainability 16 04096 g003b
Figure 4. 48 h backward trajectories (every 1 h on sampling days) for pre-dust storm (a), dust storm (b), and post-dust storm (c) in Xi’an. The black spot represents the sampling site. (The software used was MeteoInfo-Map 3.5).
Sustainability 16 04096 g004
Figure 5. The WPSCF (a) and WCWT (b) of PBM concentrations during the sampling period. The WPSCF and WCWT represent the weighting function analysis for PSCF and CWT. The dark spot represents the sampling site.
Sustainability 16 04096 g005
Figure 6. Ratios of Ca/Al (a), Mg/Al (b), and Fe/Al (c) vs. Al in the aerosol.
Sustainability 16 04096 g006
Table 1. Statistical summary of the concentration of PBM, PM2.5, Hg mass content, and dry-deposition in Xi’an.
PeriodDatePBM (pg m−3)
(Mean ± SD)
PM2.5 (μg∙m−3)PM10 (μg∙m−3)PBM/PM2.5 (ng g−1)Dry-Deposition (μg m−2)
Pre-dust 3.1–3.1287.97 ± 15.32234.02245.94375.910.46
Dust3.13–3.16129.07 ± 44.48173.07333.55745.770.22
Post-dust 3.17–3.3167.92 ± 24.0088.18123.62770.240.44
Whole3.1–3.3183.57 ± 30.97155.59171.27537.711.12
Table 2. The Eri and Igeo values during the pre-dust storm, dust storm, and post-dust storm periods.
Period EriIgeo
Pre-dustMean value572.783.25
DustMean value821.543.77
Maximum value1653.334.78
Minimum value333.332.47
Post-dustMean value1127.714.23
Whole 873.393.86
Table 3. The daily intake of wheat flour, vegetables, and aquatic products for adults and children.
ResidentFood TypeMaximum Intake (g day−1)Minimum Intake (g day−1)Average Intake (g day−1)
Children Wheat flour139.8527.9773.94
Leafy vegetables51.1310.2327.03
Solanaceous vegetables401.6080.32212.33
Aquatic products7.821.564.13
AdultWheat flour509.9726.38
Leafy vegetables18.283.659.64
Solanaceous vegetables143.5828.6375.76
Aquatic products2.790.561.48
Disclaimer/Publisher’s Note: The statements, opinions and data contained in all publications are solely those of the individual author(s) and contributor(s) and not of MDPI and/or the editor(s). MDPI and/or the editor(s) disclaim responsibility for any injury to people or property resulting from any ideas, methods, instructions or products referred to in the content.