Article

Kinetic Modeling of Co-Pyrogasification in Municipal Solid Waste (MSW) Management: Towards Sustainable Resource Recovery and Energy Generation

by
Anabel Fernandez
1,†,
Daniela Zalazar-García
1,†,
Carla Lorenzo-Doncel
2,
Diego Mauricio Yepes Maya
3,
Electo Eduardo Silva Lora
4,
Rosa Rodriguez
1 and
Germán Mazza
5,*
1
Instituto de Ingeniería Química, Facultad de Ingeniería, Universidad Nacional de San Juan, Grupo Vinculado al PROBIEN (CONICET-UNCo), Av. Libertador San Martín (Oeste) 1109, San Juan J5400ARL, Argentina
2
Departamento de Ingeniería Química, Facultad de Ingeniería, Universidad Nacional de San Juan, Av. Libertador San Martín (Oeste) 1109, San Juan J5400ARL, Argentina
3
Núcleo de Excelência em Geração Termelétrica e Distribuída (NEST), Instituto de Engenharia Mecânica, Universidade Federal de Itajubá, Av. BPS 1303, Itajubá 37500-903, MG, Brazil
4
Instituto de Engenharia Mecânica, Universidade Federal de Itajubá, Av. BPS 1303, Itajubá 37500-903, MG, Brazil
5
Instituto de Investigación y Desarrollo en Ingeniería de Procesos, Biotecnología y Energías Alternativas, PROBIEN (CONICET-Universidad Nacional del Comahue), Calle Buenos Aires 1400, Neuquén Q8300IBX, Argentina
*
Author to whom correspondence should be addressed.
These authors contributed equally to this work.
Sustainability 2024, 16(10), 4056; https://doi.org/10.3390/su16104056
Submission received: 18 April 2024 / Revised: 9 May 2024 / Accepted: 10 May 2024 / Published: 13 May 2024

Abstract

:
This study addresses the co-pyrogasification of municipal solid waste (MSW) from the Environmental Technology Park, San Juan, Argentina. This process involves heating waste at high temperatures in a low-oxygen or oxygen-free atmosphere as a sustainable strategy for waste management and energy generation. The principal objective is to focus on understanding the MSW co-pyrogasification kinetics to enhance performance in reactor design. A representative sample of MSW collected over a month was analyzed, focusing on the variation in mass proportions of plastic, organic matter, and paper. The empirical methodology included the deconvolution of macro-TGA curves and deep learning algorithms to predict and validate macro-TG data during co-pyrogasification. The findings reveal that MSW is a solid matrix more easily treated on thermochemical platforms, with kinetic and thermodynamic parameters favoring its processing. This approach suggests that MSW co-pyrogasification may represent a feasible alternative for resource recovery and bioenergy production, supporting the policies for the transition to a cleaner future and a circular economy.

1. Introduction

Municipal solid waste (MSW) poses a significant global challenge, particularly for urban areas experiencing rapid population growth [1]. Landfills, the most common MSW management strategy, have limitations such as restricted capacity, environmental concerns (odor, harmful byproducts), and reliance on readily available land. While incineration allows for volume reduction and energy recovery, it can also generate toxic pollutants. Therefore, developing sustainable and efficient alternatives for MSW management is crucial.
The limitations of landfills in dealing with this problem drive the exploration of alternatives, with incineration emerging as a widely accepted solution. Although incineration can permanently break down plastic waste, providing significant volume reduction and thermal energy recovery, it also releases toxic pollutants, posing environmental and health risks. Thorough research and analysis of alternative practices for landfill disposal have become imperative for sustainable and equitable global development. Cheng et al. [2] developed a new emulsified waste oil-based collector, which was fabricated through a combination of transesterification and ultrasonic emulsification techniques. This innovation aims to improve flotation efficiency while simultaneously reducing the collector dosage. They optimized its preparation and compared it with diesel and waste-fried oil collectors. Additionally, this collector displayed improved contact angle and adherence to coal surface functional groups, enhancing coal hydrophobicity. Furthermore, in a separate investigation [3], waste cooking oil was used in the production of various soap product forms via saponification. The mature soap was then treated with surfactants and ground to produce liquid soap and soap powder.
Thermochemical treatments, such as pyrogasification, have produced higher fuel yields and value-added chemicals than typical bioprocesses. This process consists of heating waste at high temperatures in a low-oxygen or oxygen-free environment and transforming solids into biochar, bio-oil, and gas. This approach aims to recover energy and decrease the carbon footprint associated with plastics by reducing greenhouse gas emissions and CO2 levels while also addressing environmental contamination [4,5].
This study explores the viability of co-pyrogasification as an effective approach for converting MSW to desirable resources. Co-pyrogasification allows MSW components (plastics, paper, organic matter) to be transformed into valuable products like biochar, bio-oil, and syngas, potentially reducing reliance on landfills and incineration. However, the efficiency of co-pyrogasification strongly depends on the complex composition of MSW, which varies according to location and time [4]. Understanding the kinetics and thermodynamics of the process for different MSW compositions is essential for enhancing conversion rates and product yields [6,7].
In this context, macro-TGA is an efficient method for analyzing the co-pyrogasification performance of the kinetics of MSW [8,9]. Also, a detailed study of the deconvolution of TGA curves applied to co-pyrogasification fulfills multiple fundamental purposes. Firstly, it aids in understanding the breakdown of macro-components like organic matter, paper, and plastic, determining their specific contributions [5]. Secondly, it allows for the optimization of temperature and time parameters to maximize desired product yields. Finally, it facilitates insights into the mechanisms of MSW breakdown during co-pyrogasification, thereby validating and improving kinetic models and enabling more precise predictions of mixture thermal behavior [10]. In this regard, Liu et al. [11] performed a comprehensive analysis of deconvoluting the TGA curves employed in co-pyrogasification. In the first step, they investigated the breakdown of macro-components, identifying contributions ranging from organic matter to paper and polyethylene. As a result, they shed light on specific synergistic effects and investigated the effects of diverse reactor technologies on the co-pyrogasification of pinewood and polypropylene. Xie et al. [12] used thermogravimetric tests to explore corn stalk and low-density polyethylene (LDPE) co-pyrogasification, dividing the behaviors into two stages and determining the devolatilization index. These authors provided a detailed insight into the synergy between corn stalk and LDPE, demonstrating how this material combination affects product creation. This insight came via the deconvolution of thermogravimetric curves to four theoretical components employing Fraser-Suzuki’s approach. Luo et al. [13] used the Fraser–Suzuki deconvolution model to decompose the derivative thermogravimetric curve (DTG) into seven pseudo-components for the co-pyrogasification of biomass and waste tires. Kinetic assessment using isoconversional methods and the master plot methodology revealed variations in activation energy for every theoretical component, providing information on its thermal stability. The advantage of using isoconversional methods is that they are model-free (they do not require a specific kinetic model to be a-priori assumed) and do not require pre-exponential factor prediction.
Current progress in machine learning, especially artificial neural networks (ANNs), has sparked interest in chemical engineering due to its efficiency and versatility in dealing with various types of operations and processes in the fields of this discipline. Nevertheless, although these approaches have proven effective in many fields, their application in specialized areas such as pyrogasification, thermal analysis, and thermos-kinetic investigations remains nascent. ANNs (modeled after biological neural systems) have several advantages, including the capacity to approximate non-linear functions and tolerate noisy data. However, when it comes to thermo-kinetic analysis, most reviewed papers favor data-driven methodologies (black box) over mechanistic or parametric models (white box) [14]. As a result, artificial neural network models fed with temperature and time variables have substantial drawbacks, such as ambiguous interpretation [15] and limited generalizability for predicting conversion rate data.
This study aims at achieving a comprehensive understanding of the kinetics and thermodynamics of MSW co-pyrogasification by integrating multiple approaches. Its novelty lies in combining experimental data analysis techniques like macro-TGA and deconvolution with advanced machine learning via ANN models to obtain a more comprehensive insight into the process. These findings contribute substantially to enhancing sustainable MSW management practices, offering valuable insights for optimizing resource recovery and mitigating environmental impact.

2. Materials and Methods

MSW samples were compiled from the Environmental Technology Park, San Juan, Argentina, by applying random sampling. The inorganic fraction of MSW was separated into plastic and paper fractions, and then each of them was homogeneously mixed, pulverized, and screened via a 100-standard mesh. The same procedure was followed with the organic matter fraction. Mixtures were prepared in a 50/50 weight ratio: plastic/paper (PP) and plastic/organic matter (PO). In addition, plastic waste (PW) was used without mixing.
Macro-TGA experiments on waste blends were performed using a microbalance connected to a computer and a temperature controller, in a N2 atmosphere with 50 mL/min flow rate and at 10, 15, and 20 K/min. The masses of all the samples were set to 5 g to minimize the limitations of heat and mass transport. The macro-TG equipment is the same as that used by Torres-Sciancalepore et al. [5]. Additionally, the size of the particles was determined to be within the range of 0.212–0.250 mm [5,16].

3. Kinetic Modeling and Artificial Neural Network Approaches

3.1. Kinetic Study

In this study, multi-step modeling involving independent parallel reactions was adopted by isolating the chemical reactions utilizing deconvolution of the macro-TG data. Then, A, E, and f(α) were determined for every step or reaction identified. The main formulation of this method is summarized in Section S1 of the Supplementary Material. The α can be obtained from the registers of mass left (TG experiments) according to Equations (S1.1)–(S2.10). The rate of the chemical reaction can be assessed by monitoring alterations in α over time (dα/dt) or temperature over time (dα/dT).

3.2. Deconvolution Procedure

A systematic approach can be utilized to discern the reactions taking place during the complex co-pyrogasification: the primary curve of dα/dT can be divided into multiple peaks, each indicative of a separate reaction [17,18,19]. Deconvolution was conducted to isolate the individual peaks, and each peak was then analyzed using the Lorentz function (Equation (1)) in MATLAB ONLINE (https://matlab.mathworks.com/; accessed on 1 April 2024):
y i d α i dT = 2 v π w 4 T x c 2 + w 2
here, xc, v, and w are fit parameters acquired using the Levenberg–Marquardt iteration algorithm, while αi, yi, and T denote the individual conversion, the contributed fraction of the i-th reaction, and the temperature, respectively. These chemical reactions could be associated with the decomposition of the mixture component.

3.3. Determination of the Kinetic Parameters

An overview of the aspects addressed in this paper regarding the application of isoconversional methods is included in the Supplementary Material, drawing from the authors’ prior publications [20].
Regarding the calculation of the pre-exponential factor, the Supplementary Material encompasses the inclusion of the efficient method known as the compensation effect.
To determine the reaction model, the master plots method was used. The conversion function, f(α), was established by contrasting experimental curves with those derived from theoretical models (Table S2.1, Supplementary Material). This approach, known as the master plots method [21], is elaborated upon in the Supplementary Material.

3.4. Thermodynamic Parameters

The primary properties of thermodynamics, including the activation entropy ( S ) and activation enthalpy ( H ), can be determined according to the following equations:
H = E T m + 273
S = R ln h   ×   A k B T m + 273
here, Tm represents the temperature (in °C) at which the maximum rate of mass decomposition occurs; kB stands for Boltzmann’s constant (1.38 × 10⁻²³ (J/K)), and h stands for Planck’s constant, which is equivalent to 6.63 × 10⁻³⁴ (Js). Likewise, employing thermodynamic principles allows for the calculation of the activation Gibbs energy (∆G).
G = H     T m + 273 S
The A and E values utilized in the calculation are similar to those derived from the compensation effect and the isoconversional methods, respectively.

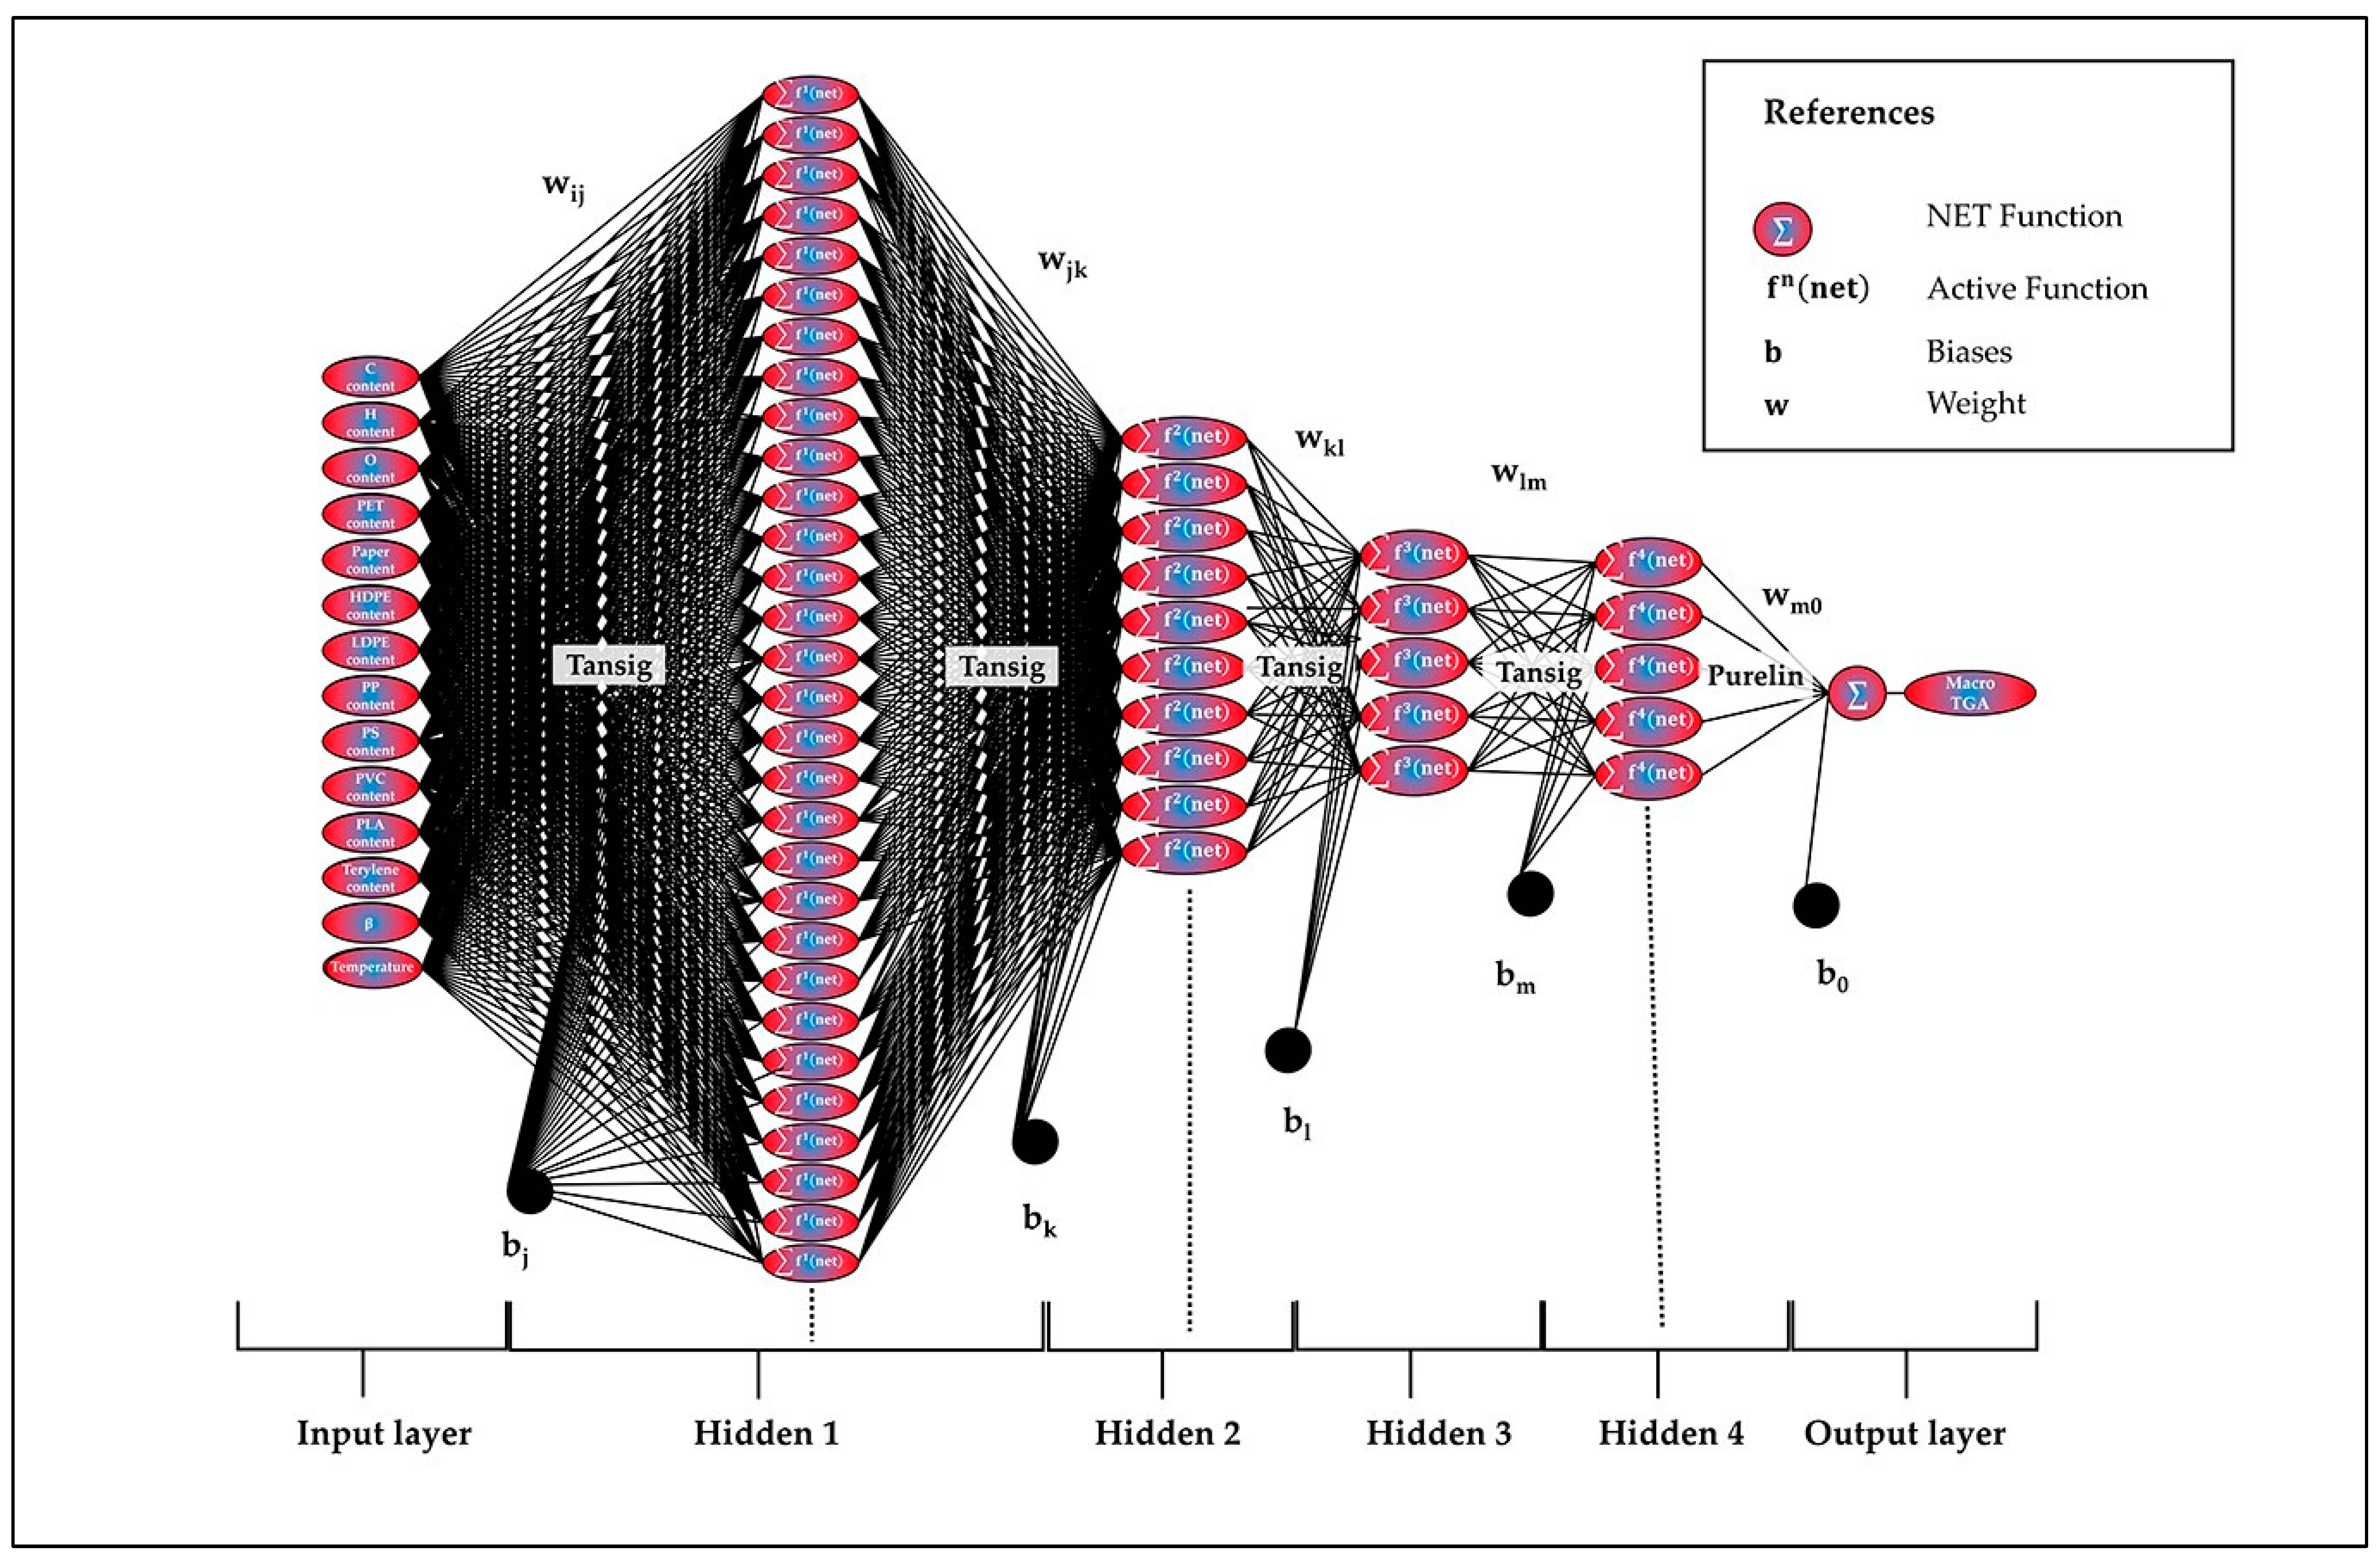
3.5. Artificial Neural Networks

The Backpropagation Neural Network (BPNN) was used as a tool for predicting “experimental” results corresponding to the complex pyrogasification process.
This neural network model uses the Levenberg–Marquardt algorithm, which is suitable for nonlinear systems. It was considered that temperature, heating rate, carbon, hydrogen, and oxygen concentrations of agro-industrial and organic wastes, as plastic fractions in the solid mixture, significantly influence pyrogasification. Therefore, they were established as input parameters. Except for the ‘purelin’ function used in the output layer, all other layers were configured with the ‘tansig’ function as a transfer function. During training, the BPNN was employed to fine-tune the network weights and biases to minimize the mean squared error (MSE). The net.trainParam.goal parameter was used to set a desired performance goal (0.001) using MATLAB ONLINE, accessed on 1 April 2024. Figure 1 shows the grid topology of the BPNN utilized in this study. The connections in Figure 1 represent the interconnected pathways through which information flows within the ANN. Those elements are crucial for network functionality and determine how it processes and analyzes data. This intricate network of connections empowers the ANN to acquire knowledge and represent complex relationships within the data. In Figure 1, each input variable node is connected to all nodes in the first hidden layer, with lines representing adjustable weights optimized during training. The connections extend through multiple hidden layers where inputs are transformed by activation functions. The network culminates in an output layer where the final ANN output is produced after all transformations, allowing the ANN to learn and model complex data relationships.
The training matrix was created using experimental data from the TGA and macro-TGA studies described in Table 1. These data were extracted using the online application, Automeris (https://automeris.io/documentation.html; accessed on 1 April 2024) [22]. The input parameter matrix consisted of 14 columns representing the following variables: percent mass composition of carbon, hydrogen, oxygen, carbon from organic matter, PET (polyethylene terephthalate), paper, high-density polyethylene (HDPE), low-density polyethylene (LDPE), polystyrene (PS), polypropylene (PPR), polyvinyl chloride (PVC), polylactic acid (PLA), terylene, heating rate (β), and temperature. The output variable matrix consisted of a single column representing the mass left. A total of 21 points were introduced from 47 TGA experiments with different solid samples and compositions. Therefore, we had an input matrix X of size 966 × 14 and an output matrix of 966 × 1. Of these data, 80% were used for training and 20% for validation.
Once the neural network was generated, the results of the co-pyrogasification experiments conducted in this study were compared with the values predicted by the BPNN under the same conditions of waste composition, heating rate, and temperature. This comparison is useful as it provides an indirect validation of the experiments performed in this study with those obtained from the literature cited in Table 1, which represents different experiments. This validation provides additional support for the divergent findings of this study, demonstrating that the results generated by the BPNN agree with both the specific experimental data from this study and the data utilized for the training and validation of the network.
Thus, the BPNN was trained and validated using data from the literature, providing a solid foundation for its predictive ability. Subsequently, it was tested with experimental data, leading to indirect validation and increased confidence in the BPNN predictions.
Key validation parameters of the artificial neural network (ANN) model, including mean absolute error (MAE), root mean square error (RMSE), and determination coefficient (R2), were employed to evaluate the accuracy of the model. A decrease in error between model predictions and experimental values, along with an increase in correlation, signifies enhanced predictive capability of the model [29].
M A E = 1 N i = 1 N Y i Y p i
RMSE = 1 N i = 1 N Y i Y pi 2
R 2 = 1 i = 1 N Y i Y pi 2 i = 1 N ( Y i Y - ) 2
Y - , Yi, and Ypi are the average of the experimental value, the experimental value, and the predicted value, and N is the predicted point number.

4. Results

4.1. Raw Material Characterization

The results of elemental and proximate analysis of MSW components are displayed in Table 2.

4.2. Macro-Thermogravimetric Analysis

4.2.1. Thermal Analysis

Figure 2 shows the mass left evolution curves for the three distinct heating rates employed in the macro-TG experiments. The curves reveal the decomposition of multiple components at different stages. Pyrogasification is a complex process that can be divided into stages, as evidenced by the shoulders in the derivative curves.

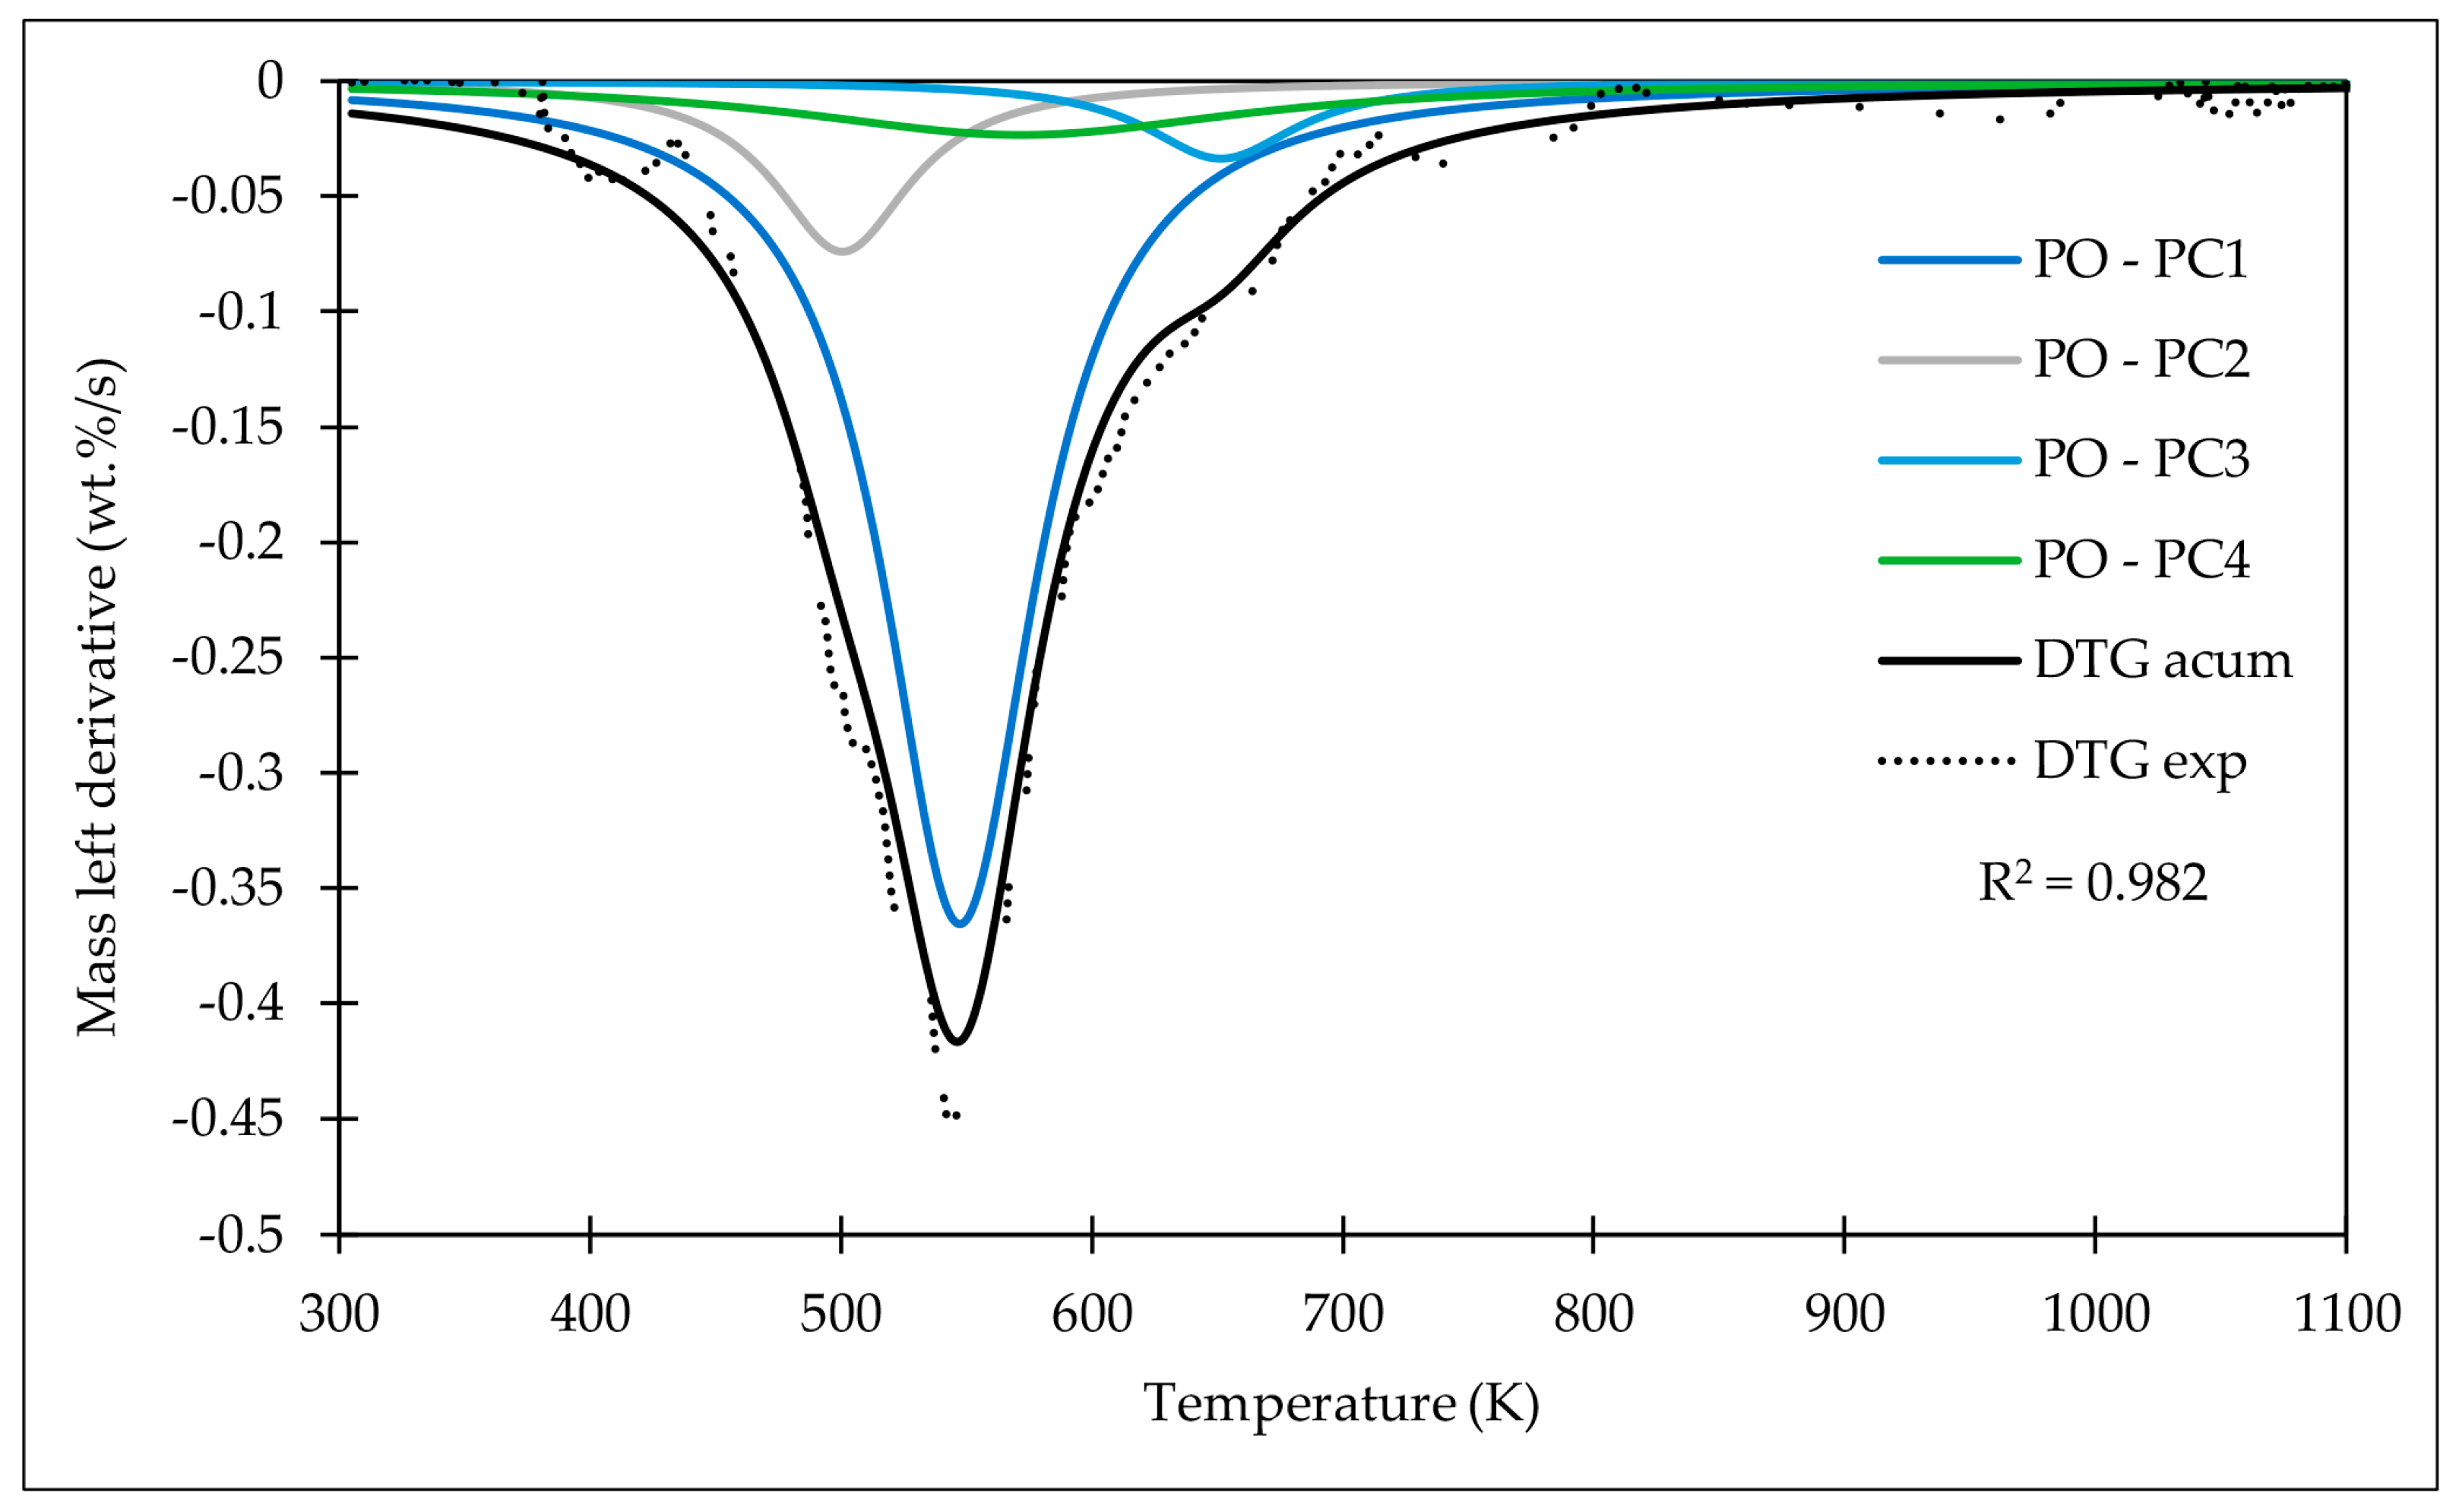
4.2.2. Deconvolution Analysis

The dα/dT curves were deconvoluted by applying the optimal fitting method using MATLAB ONLINE, with a separate analysis conducted for each suggested parallel reaction. The accuracy of the fitting was evaluated by examining the R2 value, which indicates the alignment of the “Cumulative Fit Peak” with the initial experimental data.
The deconvolution curves permitted the detection of the different reactions: PW, PO-PC1, PO-PC2, PO-PC3, PO-PC4, PP-PC1, and PP-PC2. Figure 3 shows the deconvolution of the PO mixture; therefore, the pseudo-components found are LDPE, cellulose, hemicellulose, and lignin [26]. These results indicate that the plastic fraction is principally composed of LDPE.

4.3. Kinetic Parameters for the Multi-Step Mechanism

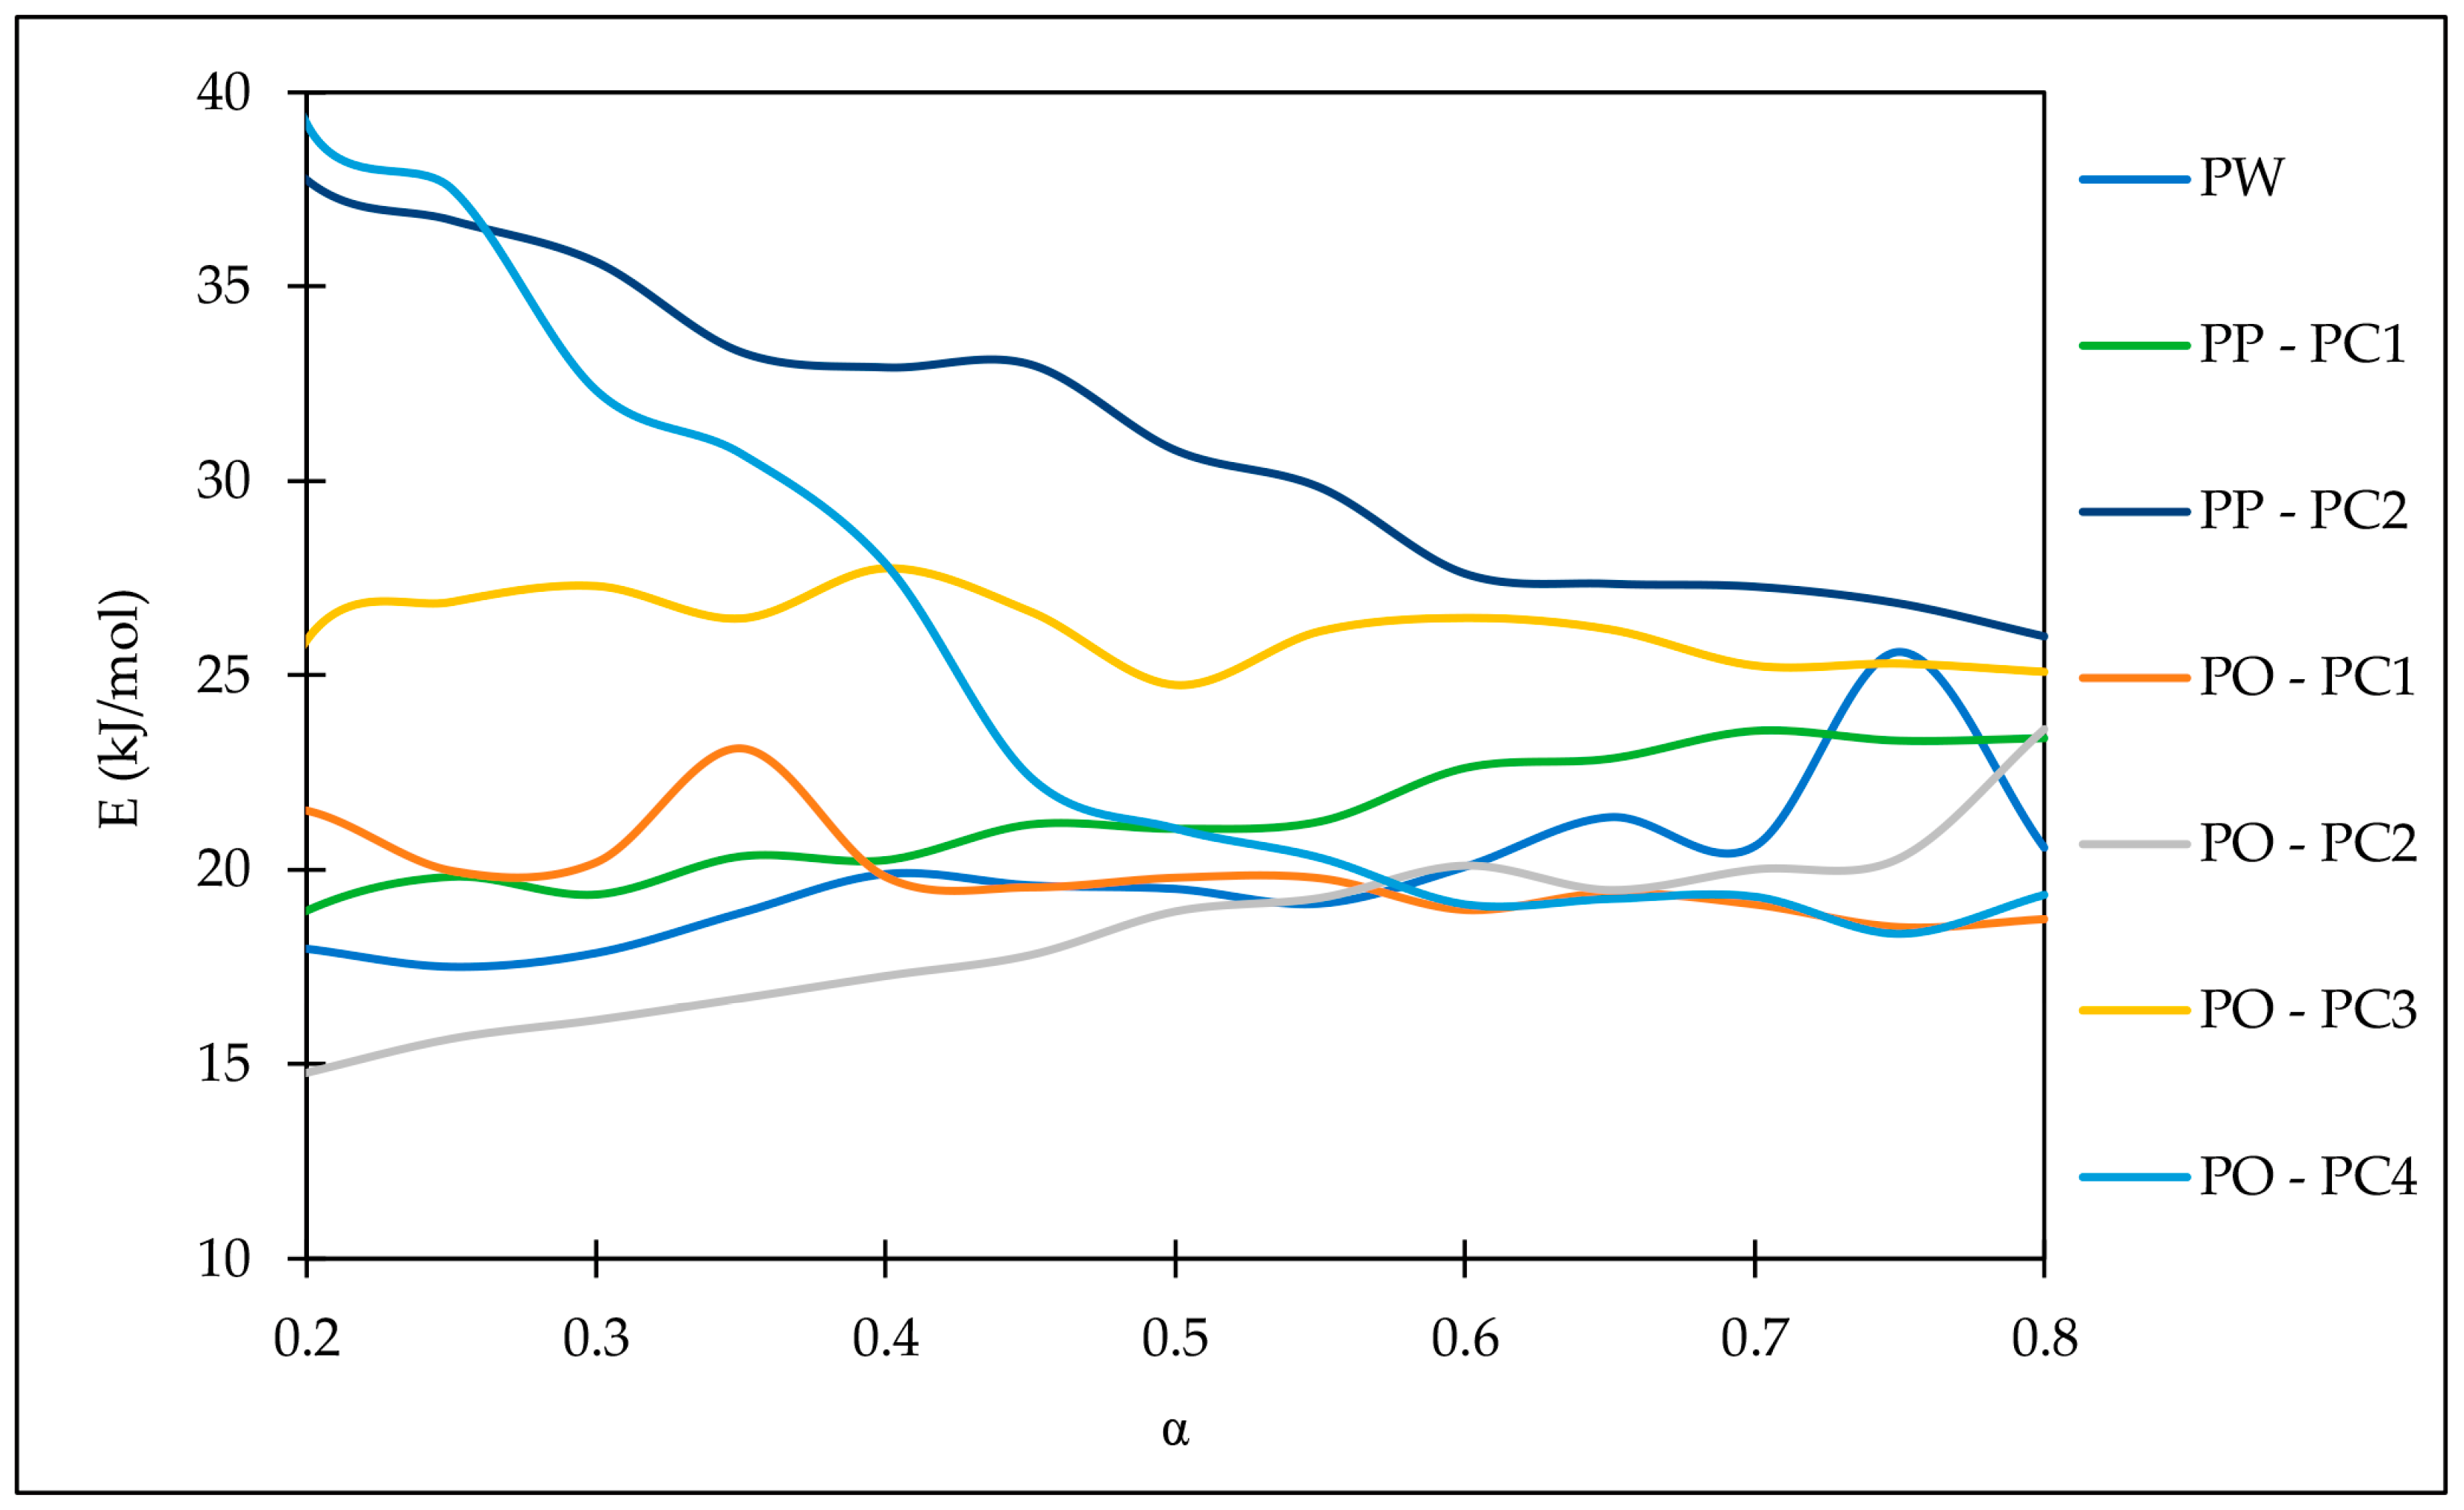
4.3.1. Activation Energy

E was calculated using the isoconversional method. Comprehensive results tables, illustrating E as a function of α for each pseudo-component employing the FWO, KAS, and Starink approaches along with the arithmetic mean and determination coefficient values, are available in the Supplementary Material (Tables S3.1–S3.7). Figure 4 displays the graphical representations of E for all processes based on the FWO approximation, which consistently exhibited the lowest AAD and MSE and the highest R2 across all occasions.

4.3.2. Pre-Exponential Factor

The compensation method approach was utilized to calculate the A. Table 3 shows the values obtained for all pseudo-components.

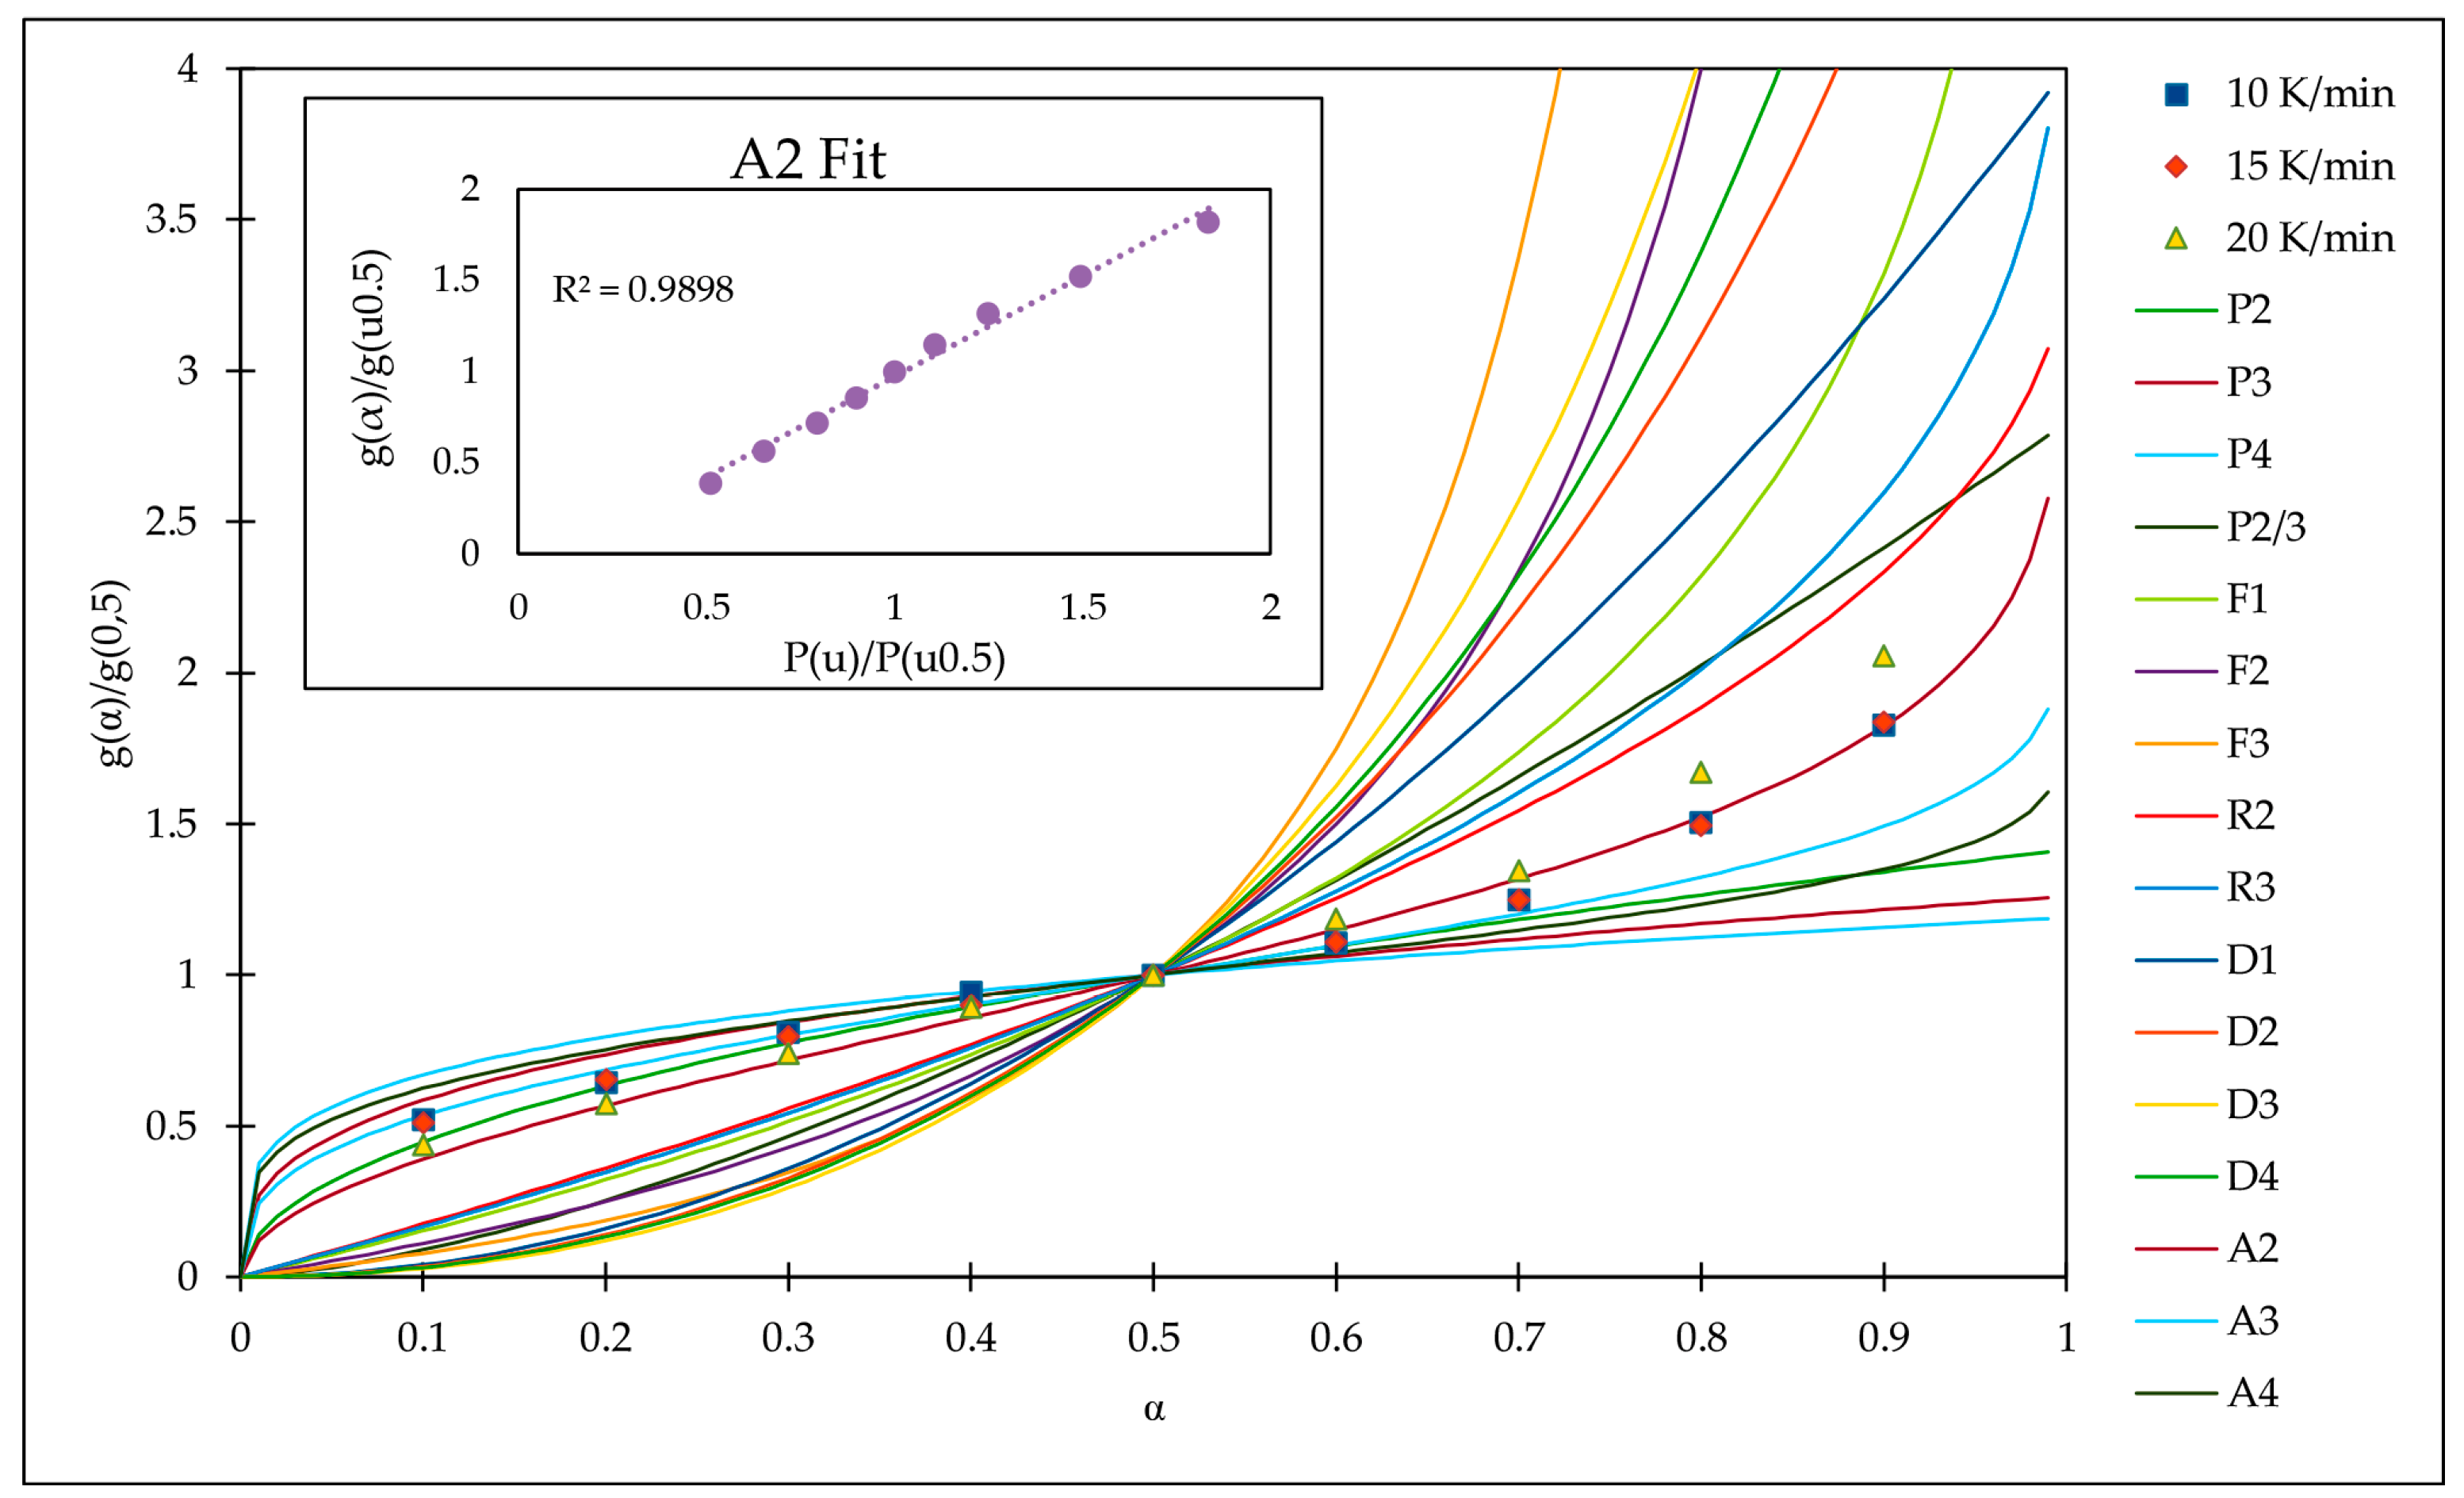
4.3.3. Reaction Mechanism

Figure 5 displays the predicted and experimental master plots for the PP-PC2 pyrogasification reaction. The best-fitting model agrees with the Avrami–Erofeev model (A2) of nucleation and growth.

4.4. Thermodynamic Parameters

Table 4 displays the results of the maximum reaction rate, temperature, and thermodynamic parameters obtained for the pyrogasification of MSW.

4.5. Artificial Neural Networks

The appropriate configuration of an artificial neural network (ANN) involves adjusting different parameters. The density of neurons in these hidden layers plays a crucial role in the overall performance of the ANN model. Hence, the main objective is to determine the most appropriate number of neurons. The prediction efficiency of different ANN architectures has been evaluated to achieve this. The ANN parameters are shown in Table 5. Figure 6 displays the neural network prediction and experiments mass left values of PW at 15 K/min.

5. Discussion

5.1. Raw Material Characterization

Table 2 reviews the values obtained from the ultimate and proximate analysis, as well as the heating values for PW, PA, and OM. In the proximate analysis of PW, volatile matter accounted for 99.7%, with ash content at 0.3%, while fixed carbon was not detected. Al-Salem et al. [1] previously presented various compositions of different plastic materials discovered in waste in the range of 91.03–99.64% for volatile matter, 0.21–8.28% for fixed carbon, and 0.14–6.12% for ash. The proximate analysis of PW aligns with the ranges for plastic materials provided in the bibliography. It is noteworthy that PW has a lower ash content compared to solid fossil fuels. This characteristic reduces the adverse effects on thermochemical systems [30]. The high volatile material and low ash content make it appropriate for bio-oil production through rapid cooling and condensation of volatile gases (condensable fraction) and pyrolytic bio-syngas (non-condensable gases fraction). These products are significant for bioenergy generation through the pyrogasification of PW.
The HHV values are consistent with those reported by other researchers studying similar waste materials [31,32,33]. Lignocellulosic biomass usually has lower fixed carbon and higher volatile matter content compared with mineral coal [34]. The presence of inorganic compounds, as indicated by ash content, tends to decrease HHV.

5.2. Thermal Analysis

The co-pyrogasification process involves heterogeneous chemical reactions. The presence of a discernible ‘peak’ in the DTG curves indicates the necessity for a kinetic analysis involving a multistep mechanism. The deconvolution method as is available in the software MATLAB Online (https://matlab.mathworks.com/; accessed on 1 April 2024) was used to analyze the DTG registers. The temperature range of the most significant mass left (473–700 K) was used to minimize the effects of drying and char formation stages. Two stages were obtained for the PP mixture, the first (paper) occurred in the temperature range of 500–700 K, while the second stage (PW, specifically LDPE) appeared between 600 and 800 K. Four stages were obtained for the PO mixture; the first (cellulose) occurred in the temperature range of 350–600 K, the second stage (hemicellulose) occurred between 450 and 550 K, the third stage (PW, specifically LDPE) occurred between 600 and 700 K, and the last stage (lignin) occurred between 450 and 750 K. The PW curves were not deconvoluted due to this fraction being mainly composed of a single component (LDPE). The determined curves are in good agreement with the experimental data, as demonstrated by the correlation factors (R2 > 0.9). The number of pseudo-peaks obtained was satisfactory, confirming the meaningful application of the deconvolution results for subsequent kinetic analyses. Figure 3 depicts the modeling of DTG profiles for PO co-pyrogasification, showing deconvolution peaks at different heating rates. Four pseudo-peaks consistently emerged at all studied heating rates. It is important to note that analogous behavior was observed across all the experiments.

5.3. Kinetic Parameters for the Multi-Step Mechanism

5.3.1. Activation Energy

Figure 4 displays the trend of E calculated for PW pyrogasification using the FWO approach. The values obtained from the KAS and Starink approaches (Tables S3.1–S3.7) are presented in the Supplementary Material. It can be observed there that no significant changes in E relative to conversion levels are noted. It is important to note that the variation in E for PW is lower compared to plastics blended with PA and OM, namely PP-PC2 and PO-PC3, respectively. The difference observed may be due to the breakdown of lignin and cellulose, which have complex structures that usually require a lot of energy to decompose at high temperatures. As a result, char formation took place, causing E in the mixtures studied [35]. The values reported are in agreement with those in the bibliography [27,36].
During the co-pyrogasification process, cellulose decomposition occurred mostly before a conversion level of 0.4. The change in the activation energy remained relatively constant in the conversion range between 0.5 and 0.7, suggesting simultaneous degradation of both mixture components [37].

5.3.2. Pre-Exponential Factor

Table 3 indicates that for the multi-step mechanism, reactions PO-PC3 and PP-PC2 exhibit A with considerably higher values than PW. An increase in E for these reactions, which compensates for the change in A, is also shown in the table. Additionally, A, a global trend, increases with the heating rate [38].

5.3.3. Reaction Mechanism

Figure 5 presents the master plots for the determination of the PP-PC2 pyrogasification reaction model. This is a reaction model of order n for all pseudocomponents based on comparing predicted (g(α)/g(0.5) versus α) and experimental curves. The initial decomposition steps are controlled by the reaction model A2 (Avrami–Erofeev). Wang et al. [39] also showed that pyrogasification occurs based on the Avrami–Erofeev nucleation model, A2.
The Avrami–Erofeev model accurately describes the evolution of transformation in solid systems, which states that the rate of phase transformation is proportional to the amount of unreacted material and a function of the transformed fraction. The Avrami–Erofeev model suggests that the reaction kinetics are diffusion-controlled, thus indicating that the reaction rate is contingent upon the mobility of atoms or molecules within the solid material [40].

5.4. Thermodynamic Parameters

The pyrogasification process is recognized for its intricate nature, occasionally leading to a negative entropy value. This phenomenon may be ascribed to the formation of stable products, such as biochar, contrasting with the compounds present in MSW. These products exhibit a simpler and more ordered molecular structure [35]. The ΔS values are small, indicating that the materials have undergone physical or chemical aging processes that have brought them close to their thermodynamic equilibrium state.
The positive ΔH values signify that pyrogasification requires heat energy to elevate the energy levels of the reagents to their transition states. ΔG underscores the heightened energy content in the product from the thermal conversion of MSW, while ΔS serves as a crucial parameter reflecting the randomness or disorder of energy and matter within a reactor. Moreover, the conditions ΔG > 0 and ΔS < 0 denote that the pyrogasification process in the thermogravimetric analyzer is non-spontaneous.
From the description given above, one could argue that the reactivity of the studied thermal decomposition is restricted, necessitating external energy sources to supply additional heat for the generation of the activated complex [41].
The results found in this study are similar to those of several other authors [7,37,42].

5.5. Artificial Neural Networks

Experiments performed with PW, PP, and PO at β of 10, 15, and 20 K/min were validated by comparing predicted values under the same conditions. The effectiveness of the predictions was evaluated using the error parameters MAE, RMSE, and R2. Figure 4 shows the comparison between the theoretical values and the experimental data, demonstrating a significant consistency among them and thus highlighting the good development of the ANN. The best accuracy was realized using the network modeling PW co-pyrogasification at 15 K/min, with an R2 value of 0.96, an MAE value of 3.2, and an RMSE value of 3.99.
These results not only indicate a high predictive ability of ANNs but also indirectly validate the consistency of the experiments with the literature included in Table 5.
Furthermore, this study underscores the validity of macro-TGA as an effective tool for investigating the kinetics of biomass decomposition of various wastes under both inert and low-oxygen atmospheres.

6. Conclusions

This study provides a comprehensive characterization of the thermodynamic and kinetic parameters involved in the co-pyrogasification process of different wastes, such as PW, PP, and PO. Some notable findings are:
Raw material characterization:
  • PW’s high volatile and low ash contents make it appropriate for bio-oil production, crucial for bioenergy generation via PW pyrogasification.
  • PW shares characteristics with lignocellulosic biomass, enhancing its potential as an alternative feedstock with favorable pyrogasification qualities.
Thermal analysis:
  • Co-pyrogasification involves heterogeneous chemical reactions, evident from distinct ‘shoulders’ in DTG curves, necessitating multi-step kinetic analysis for accuracy.
  • Deconvolution analysis identified stages in PP and PO mixtures, each representing components like cellulose, hemicellulose, LDPE, and lignin, with distinct decomposition temperature ranges.
Kinetic analysis:
  • PW exhibits reduced activation energy variation compared to blends of PA and OM due to the complex structures of lignin and cellulose, necessitating higher energy inputs for decomposition, leading to char formation.
  • Pyrogasification of PP-PC2 predominantly follows the Avrami–Erofeev model, providing insights into diffusion-controlled kinetics during solid-state reactions.
  • Understanding activation energy variation in pyrogasification is crucial for optimizing parameters and predicting feedstock behavior, guiding future process design.
ANN:
  • Strong agreement between predicted and experimental data confirms result consistency, enhancing confidence in their reliability and significance.
  • Macro-TGA effectively explores decomposition kinetics in various waste materials, validated by ANNs, highlighting their utility in characterizing pyrogasification behaviors.
The main results of this study have key policy implications for the waste management and bioenergy sectors and are in direct connection with actions like:
  • Encouraging investment in pyrogasification technologies, especially those using PW and organic materials through financial incentives and research grants.
  • Allocating funds for research and development initiatives to improve pyrogasification technologies and explore new applications.
  • Fostering international collaboration to share knowledge and best practices in pyrogasification and waste management, advancing the transition to a circular economy.
  • Supporting public awareness campaigns and education to promote understanding of pyrogasification technologies and sustainable waste management practices.
Moreover, future work includes:
  • Exploring more complex waste mixtures and varied process conditions to broaden the scope of understanding.
  • Studying scale-up and implementation of optimized pyrogasification processes in practical settings.
  • Assessing environmental impacts and techno-economic feasibility.
  • Continuing the development of AI applications to refine characterization and prediction capabilities.
Pursuing these future research directions will contribute to advancing the field of waste pyrogasification and co-pyrogasification, fostering sustainable waste management practices and resource recovery.

Supplementary Materials

The following supporting information can be downloaded at https://www.mdpi.com/article/10.3390/su16104056/s1: S1. Kinetic modeling; Section S2: Kinetic parameters; Subsection S2.1: Isoconversional methods; Subsection S2.2: Compensation Effect; Table S2.1: Conversion function, f(α), and integral rate, g(α), for different reaction models; Subsection S2.3: Master-plots; Section S3: Activation energy through isoconversional methods results for a multi-step mechanism; Table S3.1: Activation energy (including statistical parameters) from isoconversional methods, for PW pyrogasification; Table S3.2: Activation energy (including statistical parameters) from isoconversional methods, for PP-PC1 pyrogasification; Table S3.3: Activation energy (including statistical parameters) from isoconversional methods, for PP-PC2 pyrogasification; Table S3.4: Activation energy (including statistical parameters) from isoconversional methods, for PO-PC1 pyrogasification; Table S3.5: Activation energy (including statistical parameters) from isoconversional methods, for PO-PC2 pyrogasification; Table S3.6: Activation energy (including statistical parameters) from isoconversional methods, for PO-PC3 pyrogasification; Table S3.7: Activation energy (including statistical parameters) from isoconvesional methods, for PO-PC4 pyrogasification. References [43,44,45,46,47] are cited in the Supplementary Materials.

Author Contributions

A.F.: Conceptualization, Methodology, Formal analysis, Investigation, Writing—original draft; D.Z.-G.: Conceptualization, Formal analysis, Investigation, Writing—original draft, Software; C.L.-D.: Methodology, Formal analysis, Validation; D.M.Y.M.: Formal analysis, Visualization, Investigation; E.E.S.L.: Visualization, Writing—review and editing; R.R.: Conceptualization, Resources, Writing—review and editing, Supervision, Project administration, Funding acquisition; G.M.: Formal analysis, Visualization, Resources, Writing—review and editing, Supervision, Project administration, Funding acquisition. All authors have read and agreed to the published version of the manuscript.

Funding

The authors wish to acknowledge the support of the following Argentine institutions: the University of San Juan (PDTS Res. 1054/18) (CICITCA 2023-2024. Res.21/I1578); the University of Comahue (PIN 2022-04/I260); National Scientific and Technical Research Council, CONICET (Project PUE PROBIEN-CONICET 22920150100067 and PIP 2021-2023—No. 11220200100950CO); FONCYT PICT-2021-I-INVI-00839, PICT-2021-INVI-00803 and PICT 2019-01810. FONCYT-PICTA RESOL-2022-87 Project Number 20 (2022). Anabel Fernandez, Daniela Zalazaar-García, Rosa Rodriguez, and Germán Mazza are Research Members of CONICET, Argentina.

Institutional Review Board Statement

Not applicable.

Informed Consent Statement

Not applicable.

Data Availability Statement

Data will be made available on request.

Conflicts of Interest

The authors declare that they have no known conflicts of interest or personal relationships that could have appeared to affect the work reported in this paper.

Nomenclature

APre-exponential factor
aKinetic compensation effect parameter (intersect),
AADAverage absolute deviation
ANNArtificial neural network
b Kinetic compensation effect parameter (slope)
BPNNBackpropagation neural network
FWOFlynn–Wall–Ozawa
h Planck constant, Js
HDPEHigh-density polyethylene
HHVHigher heating value, MJ/kg
KASKissinger–Akahira–Sunose
kbBoltzmann constant, J/K
KCEKinetic compensation effect
LDPELow-density polyethylene
MAEMean absolute error
MSEMean squared error
MSWMunicipal solid waste
NNumber of predicted points
PAPaper
PC1Pseudo-component 1
PC2Pseudo-component 2
PC3Pseudo-component 3
PC4Pseudo-component 4
PLAPolylactic acid
POPlastic/organic matter 50/50
PPPlastic/paper 50/50
PPRPolypropylene
PSPolystyrene
PVCPolyvinyl chloride
PWPlastic waste
RGas constant, KJ/Kmol K
R2Determination coefficient
RMSERoot mean square error
TmTemperature of the maximum mass decomposition rate, °C
vFit parameter of the Levenberg–Marquardt iteration algorithm
wFit parameter of the Levenberg–Marquardt iteration algorithm
xcFit parameter of the Levenberg–Marquardt iteration algorithm
Y ¯ Average of the experimental mass left (wt. %)
YiExperimental value of mass left (wt. %)
YpiPredicted value of mass left (wt. %)
αDegree of conversion
βHeating rate, K/min
∆GActivation Gibbs energy, kJ/mol
∆HActivation enthalpy, kJ/mol
∆SActivation entropy, kJ/(K mol)

References

  1. Hoornweg, D.; Bhada-Tata, P.; Kennedy, C. Environment: Waste Production Must Peak This Century. Nature 2013, 502, 615–617. [Google Scholar] [CrossRef] [PubMed]
  2. Cheng, G.; Zhang, M.; Lu, Y.; Zhang, H.; Lau, E. Von New Insights for Improving Low-Rank Coal Flotation Performance via Emulsified Waste Fried Oil Collector. Fuel 2024, 357, 129925. [Google Scholar] [CrossRef]
  3. Cheng, G.; Zhang, M.; Lu, Y.; Zhang, Y.; Lin, B.; Von Lau, E. A Novel Method for the Green Utilization of Waste Fried Oil. Particuology 2024, 84, 1–11. [Google Scholar] [CrossRef]
  4. Zalazar-García, D.; Fernandez, A.; Cavaliere, L.; Deng, Y.; Soria, J.; Rodriguez, R.; Mazza, G. Slow Pyrolysis of Pistachio-Waste Pellets: Combined Phenomenological Modeling with Environmental, Exergetic, and Energetic Analysis (3-E). Biomass Convers. Biorefinery 2024, 14, 9197–9215. [Google Scholar] [CrossRef]
  5. Torres-Sciancalepore, R.; Fernandez, A.; Asensio, D.; Riveros, M.; Fabani, M.P.; Fouga, G.; Rodriguez, R.; Mazza, G. Kinetic and Thermodynamic Comparative Study of Quince Bio-Waste Slow Pyrolysis before and after Sustainable Recovery of Pectin Compounds. Energy Convers. Manag. 2022, 252, 115076. [Google Scholar] [CrossRef]
  6. Wang, Z.; Burra, K.G.; Lei, T.; Gupta, A.K. Co-Pyrolysis of Waste Plastic and Solid Biomass for Synergistic Production of Biofuels and Chemicals-A Review. Prog. Energy Combust. Sci. 2021, 84, 100899. [Google Scholar] [CrossRef]
  7. Singh, S.; Patil, T.; Tekade, S.P.; Gawande, M.B.; Sawarkar, A.N. Studies on Individual Pyrolysis and Co-Pyrolysis of Corn Cob and Polyethylene: Thermal Degradation Behavior, Possible Synergism, Kinetics, and Thermodynamic Analysis. Sci. Total Environ. 2021, 783, 147004. [Google Scholar] [CrossRef] [PubMed]
  8. Le, P.T.; Bui, H.T.; Le, D.N.; Nguyen, T.H.; Pham, L.A.; Nguyen, H.N.; Nguyen, Q.S.; Nguyen, T.P. Preparation and Characterization of Biochar Derived from Agricultural By-Products for Dye Removal. Adsorpt. Sci. Technol. 2021, 2021, 9161904. [Google Scholar] [CrossRef]
  9. Wu, S.; Li, Z. Experimental and Modeling Study on Centimeter Pine Char Combustion in Fast-Heating Macro TGA. Proc. Combust. Inst. 2023, 39, 3497–3508. [Google Scholar] [CrossRef]
  10. Durga, M.L.; Gangil, S.; Bhargav, V.K. Thermal Influx Induced Biopolymeric Transitions in Paddy Straw. Renew. Energy 2022, 199, 1024–1032. [Google Scholar] [CrossRef]
  11. Liu, X.; Burra, K.G.; Wang, Z.; Li, J.; Che, D.; Gupta, A.K. On Deconvolution for Understanding Synergistic Effects in Co-Pyrolysis of Pinewood and Polypropylene. Appl. Energy 2020, 279, 115811. [Google Scholar] [CrossRef]
  12. Xie, T.; Zhao, L.; Yao, Z.; Kang, K.; Jia, J.; Hu, T.; Zhang, X.; Sun, Y.; Huo, L. Co-Pyrolysis of Biomass and Polyethylene: Insights into Characteristics, Kinetic and Evolution Paths of the Reaction Process. Sci. Total Environ. 2023, 897, 165443. [Google Scholar] [CrossRef] [PubMed]
  13. Luo, G.; Wang, W.; Xie, W.; Tang, Y.; Xu, Y.; Wang, K. Co-Pyrolysis of Corn Stover and Waste Tire: Pyrolysis Behavior and Kinetic Study Based on Fraser-Suzuki Deconvolution Procedure. J. Anal. Appl. Pyrolysis 2022, 168, 105743. [Google Scholar] [CrossRef]
  14. Muravyev, N.V.; Luciano, G.; Ornaghi, H.L.; Svoboda, R.; Vyazovkin, S. Artificial Neural Networks for Pyrolysis, Thermal Analysis, and Thermokinetic Studies: The Status Quo. Molecules 2021, 26, 3727. [Google Scholar] [CrossRef] [PubMed]
  15. Rudin, C. Stop Explaining Black Box Machine Learning Models for High Stakes Decisions and Use Interpretable Models Instead. Nat. Mach. Intell. 2019, 1, 206–215. [Google Scholar] [CrossRef] [PubMed]
  16. Brems, A.; Baeyens, J.; Beerlandt, J.; Dewil, R. Thermogravimetric Pyrolysis of Waste Polyethylene-Terephthalate and Polystyrene: A Critical Assessment of Kinetics Modelling. Resour. Conserv. Recycl. 2011, 55, 772–781. [Google Scholar] [CrossRef]
  17. Motta, I.L.; Miranda, N.T.; Maciel Filho, R.; Wolf Maciel, M.R. Biomass Gasification in Fluidized Beds: A Review of Biomass Moisture Content and Operating Pressure Effects. Renew. Sustain. Energy Rev. 2018, 94, 998–1023. [Google Scholar] [CrossRef]
  18. Zhu, X.; Zhang, Y.; Ding, H.; Huang, L.; Zhu, X. Comprehensive Study on Pyrolysis and Co-Pyrolysis of Walnut Shell and Bio-Oil Distillation Residue. Energy Convers. Manag. 2018, 168, 178–187. [Google Scholar] [CrossRef]
  19. Pinzi, S.; Buratti, C.; Bartocci, P.; Marseglia, G.; Fantozzi, F.; Barbanera, M. A Simplified Method for Kinetic Modeling of Coffee Silver Skin Pyrolysis by Coupling Pseudo-Components Peaks Deconvolution Analysis and Model Free-Isoconversional Methods. Fuel 2020, 278, 118260. [Google Scholar] [CrossRef]
  20. Torres-Sciancalepore, R.; Nassini, D.; Asensio, D.; Bohé, A.; Rodriguez, R.; Fouga, G.; Mazza, G. Synergistic Effects of the Mixing Factor on the Kinetics and Products Obtained by Co-Pyrolysis of Rosa Rubiginosa Rosehip Seed and Husk Wastes. Energy Convers. Manag. 2024, 302, 118095. [Google Scholar] [CrossRef]
  21. Gotor, F.J.; Criado, J.M.; Malek, J.; Koga, N. Kinetic Analysis of Solid-State Reactions: The Universality of Master Plots for Analyzing Isothermal and Nonisothermal Experiments. J. Phys. Chem. A 2000, 104, 10777–10782. [Google Scholar] [CrossRef]
  22. Mogul, R.; Limaye, S.S.; Way, M.J. The CO2 profile and analytical model for the Pioneer Venus Large Probe neutral mass spectrometer. Icarus 2023, 392, 115374. [Google Scholar] [CrossRef]
  23. Ansah, E.; Wang, L.; Shahbazi, A. Thermogravimetric and Calorimetric Characteristics during Co-Pyrolysis of Municipal Solid Waste Components. Waste Manag. 2016, 56, 196–206. [Google Scholar] [CrossRef] [PubMed]
  24. Burra, K.G.; Gupta, A.K. Kinetics of Synergistic Effects in Co-Pyrolysis of Biomass with Plastic Wastes. Appl. Energy 2018, 220, 408–418. [Google Scholar] [CrossRef]
  25. Gunasee, S.D.; Carrier, M.; Gorgens, J.F.; Mohee, R. Pyrolysis and Combustion of Municipal Solid Wastes: Evaluation of Synergistic Effects Using TGA-MS. J. Anal. Appl. Pyrolysis 2016, 121, 50–61. [Google Scholar] [CrossRef]
  26. Gunasee, S.D.; Danon, B.; Görgens, J.F.; Mohee, R. Co-Pyrolysis of LDPE and Cellulose: Synergies during Devolatilization and Condensation. J. Anal. Appl. Pyrolysis 2017, 126, 307–314. [Google Scholar] [CrossRef]
  27. Hu, Q.; Tang, Z.; Yao, D.; Yang, H.; Shao, J.; Chen, H. Thermal Behavior, Kinetics and Gas Evolution Characteristics for the Co-Pyrolysis of Real-World Plastic and Tyre Wastes. J. Clean. Prod. 2020, 260, 121102. [Google Scholar] [CrossRef]
  28. Sette, P.; Fernandez, A.; Soria, J.; Rodriguez, R.; Salvatori, D.; Mazza, G. Integral Valorization of Fruit Waste from Wine and Cider Industries. J. Clean. Prod. 2020, 242, 118486. [Google Scholar] [CrossRef]
  29. Ni, Z.; Bi, H.; Jiang, C.; Sun, H.; Zhou, W.; Qiu, Z.; Lin, Q. Research on the Co-Pyrolysis of Coal Slime and Cellulose Based on TG-FTIR-MS, Artificial Neural Network, and Principal Component Analysis. Fuel 2022, 320, 123960. [Google Scholar] [CrossRef]
  30. Domenico, M.D.; Amorim, S.M.; Collazzo, G.C.; José, H.J.; Moreira, R.F.P.M. Coal Gasification in the Presence of Lithium Orthosilicate. Part 1: Reaction Kinetics. Chem. Eng. Res. Des. 2019, 141, 529–539. [Google Scholar] [CrossRef]
  31. Alam, M.; Bhavanam, A.; Jana, A.; Viroja, J.; Kumar, S.; Peela, N.R. Co-Pyrolysis of Bamboo Sawdust and Plastic: Synergistic Effects and Kinetics. Renew. Energy 2020, 149, 1133–1145. [Google Scholar] [CrossRef]
  32. Ma, M.; Xu, D.; Zhi, Y.; Yang, W.; Duan, P.; Wu, Z. Co-Pyrolysis Re-Use of Sludge and Biomass Waste: Development, Kinetics, Synergistic Mechanism and Industrialization. J. Anal. Appl. Pyrolysis 2022, 168, 105746. [Google Scholar] [CrossRef]
  33. Gouws, S.M.; Carrier, M.; Bunt, J.R.; Neomagus, H.W.J.P. Co-Pyrolysis of Coal and Raw/Torrefied Biomass: A Review on Chemistry, Kinetics and Implementation. Renew. Sustain. Energy Rev. 2021, 135, 110189. [Google Scholar] [CrossRef]
  34. Singh, Y.D.; Mahanta, P.; Bora, U. Comprehensive Characterization of Lignocellulosic Biomass through Proximate, Ultimate and Compositional Analysis for Bioenergy Production. Renew. Energy 2017, 103, 490–500. [Google Scholar] [CrossRef]
  35. Kaur, R.; Gera, P.; Jha, M.K.; Bhaskar, T. Pyrolysis Kinetics and Thermodynamic Parameters of Castor (Ricinus communis) Residue Using Thermogravimetric Analysis. Bioresour. Technol. 2018, 250, 422–428. [Google Scholar] [CrossRef]
  36. Wen, Y.; Zaini, I.N.; Wang, S.; Mu, W.; Jönsson, P.G.; Yang, W. Synergistic Effect of the Co-Pyrolysis of Cardboard and Polyethylene: A Kinetic and Thermodynamic Study. Energy 2021, 229, 120693. [Google Scholar] [CrossRef]
  37. Wang, W.; Luo, G.; Zhao, Y.; Tang, Y.; Wang, K.; Li, X.; Xu, Y. Kinetic and Thermodynamic Analyses of Co-Pyrolysis of Pine Wood and Polyethylene Plastic Based on Fraser-Suzuki Deconvolution Procedure. Fuel 2022, 322, 124200. [Google Scholar] [CrossRef]
  38. Martínez-Narro, G.; Royston, N.J.; Billsborough, K.L.; Phan, A.N. Kinetic Modelling of Mixed Plastic Waste Pyrolysis. Chem. Thermodyn. Therm. Anal. 2023, 9, 100105. [Google Scholar] [CrossRef]
  39. Wang, S.; Lin, H.; Ru, B.; Dai, G.; Wang, X.; Xiao, G.; Luo, Z. Kinetic Modeling of Biomass Components Pyrolysis Using a Sequential and Coupling Method. Fuel 2016, 185, 763–771. [Google Scholar] [CrossRef]
  40. Song, Z.; Li, M.; Pan, Y.; Shu, C.M. A Generalized Differential Method to Calculate Lumped Kinetic Triplet of the Nth Order Model for the Global One-Step Heterogeneous Reaction Using TG Data. J. Loss Prev. Process Ind. 2020, 64, 104094. [Google Scholar] [CrossRef]
  41. Tong, W.; Cai, Z.; Liu, Q.; Ren, S.; Kong, M. Evaluation of Biochar Combustion Reactivity under Pyrolysis Temperature: Microstructure Characterization, Kinetics and Thermodynamics. J. Energy Inst. 2020, 93, 1914–1923. [Google Scholar] [CrossRef]
  42. Mumbach, G.D.; Alves, J.L.F.; Da Silva, J.C.G.; De Sena, R.F.; Marangoni, C.; Machado, R.A.F.; Bolzan, A. Thermal Investigation of Plastic Solid Waste Pyrolysis via the Deconvolution Technique Using the Asymmetric Double Sigmoidal Function: Determination of the Kinetic Triplet, Thermodynamic Parameters, Thermal Lifetime and Pyrolytic Oil Composition for Clean. Energy Convers. Manag. 2019, 200, 112031. [Google Scholar] [CrossRef]
  43. da Silva, J.C.G.; de Albuquerque, J.G.; de Araujo Galdino, W.V.; de Sena, R.F.; Andersen, S.L.F. Single-step and multi-step thermokinetic study—Deconvolution method as a simple pathway for describe properly the biomass pyrolysis for energy conversion. Energy Convers. Manag. 2020, 209, 112653. [Google Scholar] [CrossRef]
  44. Vyazovkin, S.; Burnham, A.K.; Criado, J.M.; Pérez-Maqueda, L.A.; Popescu, C.; Sbirrazzuoli, N. ICTAC Kinetics Committee recommendations for performing kinetic computations on thermal analysis data. Thermochim. Acta 2011, 520, 1–19. [Google Scholar] [CrossRef]
  45. Liu, L.; Guo, Q.X. Isokinetic relationship, isoequilibrium relationship, and enthalpy-entropy compensation. Chem. Rev. 2001, 101, 673–695. [Google Scholar] [CrossRef]
  46. Garvín, A.; Ibarz, R.; Ibarz, A. Kinetic and thermodynamic compensation. A current and practical review for foods. Food Res. Int. 2017, 96, 132–153. [Google Scholar] [CrossRef]
  47. Coats, A.W.; Redfern, J.P. Kinetic Parameters from Thermogravimetric Data. Nature 1964, 201, 68–69. [Google Scholar] [CrossRef]
Figure 1. Grid topology of the BPNN.
Sustainability 16 04056 g001
Figure 2. Macro-TG curves for PW at heating rates of 10, 15, and 20 K/min.
Sustainability 16 04056 g002
Figure 3. Macro-DTG and deconvolution curves for PO co-pyrogasification at a 10 K/min heating rate.
Sustainability 16 04056 g003
Figure 4. Activation energy for the pyrogasification reaction of each pseudo-component at different conversion values determined using the FWO approach.
Sustainability 16 04056 g004
Figure 5. Master plots for reaction model determination of PP-PC2 pyrogasification.
Sustainability 16 04056 g005
Figure 6. Neural network prediction and experiments mass left values of PW at 15 K/min.
Sustainability 16 04056 g006
Table 1. TGA data and waste composition.
ReferenceTGA
Experiment
Type of BiomassType of PlasticPaperPaper, Plastic, and Biomass (Mass) RatioHeating Rate
(°C/min)
[23]1Wood--0/0/110
2--Paper1/0/010
3-PET-0/1/010
4WoodPET-0/7/310
5WoodPET-0/1/110
6WoodPET-0/3/710
[24]7-PPR-0/1/010
8-PPR-0/1/020
9-PPR-0/1/030
10-PET-0/1/010
11-PET-0/1/020
12-PET-0/1/030
13PinewoodPPR 0/75/2510
14PinewoodPPR 0/50/5010
15PinewoodPPR 0/25/7510
16Pinewood--0/0/110
17Pinewood--0/0/120
18Pinewood--0/0/130
[25]19-PVC-0/1/020
20-PPR-0/1/020
21-PS-0/1/020
22Branches--0/0/120
23Leaves--0/0/120
24Grass--0/0/120
25--Cardboard1/0/020
26--Hygienic paper1/0/020
27BranchesPPRCardboard1/1/120
[26]28--Cellulose1/0/010
29-LDPE-0/1/010
30-LDPECellulose1/1/010
[27]31-LDPE-0/1/010
32-HDPE-0/1/010
33-PPR-0/1/010
34-PS-0/1/010
35-Terylene-0/1/010
36-TeryleneLDPE1/1/010
37-TeryleneHDPE1/1/010
38-TerylenePPR1/1/010
[5]39Quince--0/0/15
40Quince--0/0/110
41Quince--0/0/115
42Pectin-Free Quince--0/0/15
43Pectin-Free Quince--0/0/110
44Pectin-Free Quince--0/0/115
[28]45Grape Marc--0/0/110
46Grape Marc--0/0/115
47Grape Marc--0/0/120
48Grape Stalk- 0/0/110
49Grape Stalk- 0/0/115
50Grape Stalk- 0/0/120
51Apple Pomace- 0/0/110
52Apple Pomace- 0/0/115
53Apple Pomace- 0/0/120
Table 2. Results of proximate ultimate analysis.
PWPAOM
C (%)82.242.140.8
H (%)16.46.05.4
N (%)--8.7
S (%)--6.5
O (%) 11.550.738.6
Moisture (%)-4.74.6
Ash (%) 20.31.29.3
Volatile matter (%)99.788.474.1
Fixed carbon (%) 2-10.412.0
HHV (MJ/kg)43.117.116.4
1 Calculated based on differences. 2 Dry basis.
Table 3. Kinetic parameters of the compensation effect and A for co-pyrogasification reactions.
Componentβ (K/min)abR2A (1/s)
PW100.223−2.4280.9787.42
150.202−2.2490.9475.88
200.192−1.5610.9759.45
PO-PC1100.308−4.7100.9034.05
150.291−4.2200.8944.81
200.273−3.9800.900421
PO-PC2100.339−4.8780.9034.04
150.321−4.3410.8984.87
200.244−2.2160.9999.84
PO-PC3100.262−4.5480.89710.06
150.268−4.1690.88017.51
200.228−2.2190.99842.13
PO-PC4100.345−5.0810.86836.46
150.335−4.6650.84143.11
200.274−2.2990.99597.26
PP-PC1100.312−4.5770.9148.09
150.275−4.0900.9105.91
200.254−2.1840.99925.41
PP-PC2100.279−4.4670.91067.45
150.271−4.1090.89976.35
200.269−3.8420.88992.56
Table 4. Thermodynamic parameters of co-pyrogasification.
MSWTm
(K)
E
(kJ/mol)
ΔH (kJ/mol)ΔG (kJ/mol)ΔS
(kJ/K mol)
PW5222016141−0.24
PO-PC15502015151−0.25
PO-PC25051814137−0.24
PO-PC36492621172−0.23
PO-PC45732520149−0.22
PP-PC15232117141−0.24
PP-PC25913126158−0.22
Table 5. ANN parameters.
MSWβ (K/min)ParameterValueRMSEMAER2
PW10Network topology14-30-10-5-5-1-15.835.020.89
1514-24-12-10-5-1-13.993.020.96
2014-22-15-5-1-15.034.240.95
PP1014-30-20-15-8-1-14.904.900.90
1514-30-20-15-8-1-16.594.840.90
2014-30-20-15-8-1-18.587.490.86
PO1014-30-20-15-8-1-110.697.970.88
1514-30-20-15-8-1-17.456.290.82
2014-30-20-15-8-1-16.705.570.86
Disclaimer/Publisher’s Note: The statements, opinions and data contained in all publications are solely those of the individual author(s) and contributor(s) and not of MDPI and/or the editor(s). MDPI and/or the editor(s) disclaim responsibility for any injury to people or property resulting from any ideas, methods, instructions or products referred to in the content.

