Abstract
The concept of maritime circularity has gained increasing attention to address challenges arising from the net-zero targets of the maritime industry. The circular economy provides potential solutions to address these challenges through reuse, remanufacturing, and recycling practices. However, the industry faces complex challenges, including inefficient reverse supply chains, a lack of awareness about circular economy principles, standardisation issues, and the need for digital infrastructure to provide vital information in the sector. These challenges prevent the implementation of circularity practices, as access to crucial data throughout the vessel’s life cycle is obstructed. This novel research aims to create a robust first-of-its-kind database solution specifically designed to support the industry’s shift towards circularity. The database will facilitate fast and transparent information flow between the stakeholders, providing foundations for asset tracking and a robust reverse supply chain. A case study was conducted to show that a database could help extract higher financial value from end-of-life ships by over 80%. The ageing fleet increases the urgency of utilising such a database, which could be a pivotal strategy for a sustainable and circular industry. This digital solution offers significant benefits to all industry stakeholders and allows holistic resource management, influencing maritime operations’ sustainability, resilience, and profitability.
1. Introduction
Maritime transport is the cornerstone of the global economy, responsible for carrying over 80% of the world’s trade volume [1]. As a pivotal player in global trade, logistics, and supply chains, it ensures the seamless flow of raw materials, finished goods, and other products across nations. However, this industry faces pressing environmental and social issues ranging from greenhouse gas emissions, air and water pollution, and safety concerns [2,3,4]. With projections indicating a tripling of trade volumes by 2050, these challenges are set to escalate if the sector remains rooted in its current practices [5].
As the industry sits at the intersection of environmental sustainability and economic viability, innovative solutions are increasingly being sought to tackle these complex challenges. One such solution is the concept of the circular economy (CE), a transformative economic framework aimed at reconfiguring production and consumption practices for sustainability [6]. CE is defined comprehensively as an economic system that minimises resource input and waste through material and energy loop management [7]. CE originates as a response to the linear economy’s wasteful and environmentally harmful nature [8,9], addressing future resource scarcity and environmental damage caused by the current take-make-waste practices [10,11,12]. A CE approach is pivotal for sustainable resource utilisation and aligns with the imperative for environmentally responsible economic models. Unlike the current linear economy, the CE model emphasises the need to extend the usable life of materials while retaining their value, thereby reducing waste and pollution [13].
The circular economy has gained significant attention as a potential panacea for the maritime industry’s multifaceted challenges. It offers an avenue to meet the industry’s challenging environmental goals, such as decarbonisation or net-zero targets, and opens up new economic opportunities. By utilising the outputs of certain economic activities as inputs for others, the CE approach aspires to cut down waste and elevate resource and energy efficiency [6]. Through the application of CE principles to a maritime case, the remanufactured maritime engine costs slightly more than half of the new engine cost, by 51.7% [14], while minimising material consumption potentially up to 30% for an engine block and crankshaft, and up to 98% for a turbocharger [15]. Moreover, CE applications are critical at the end-of-life stage to minimise the adverse impact on the environment and society at the ship recycling stage. In this context, transitioning from a linear to a more circular economy emerges as a vital strategy. It promises to mitigate adverse environmental and social impacts, drive sustainable growth, and create new economic opportunities in the maritime sector.
While the circular economy offers a roadmap towards sustainable growth, several barriers hinder its full-scale implementation in the maritime industry. These barriers include the absence of efficient reverse supply chain practices and take-back strategies that ensure the recovery and remanufacturing of valuable products at the end of their life cycle [16,17,18]. Furthermore, limited awareness and understanding of the benefits of circular economy principles among stakeholders in the maritime sector pose challenges to their adoption. Overcoming these barriers requires collaborative efforts between industry players, policymakers, and researchers to develop innovative solutions and promote knowledge sharing on circular economy practices in the maritime industry. This study revealed a severe lack of digital infrastructure for data availability, which hinders the dissemination and use of vital information needed for circular practices. Addressing this issue would involve investing in developing digital platforms and systems that can facilitate data collection, analysis, and sharing across the maritime sector. Additionally, promoting awareness and training on the benefits and implementation of circular economy practices can help stakeholders overcome resistance to change and foster a culture of sustainability in the industry.
Indeed, the current environment indicates a significant gap. Currently, there needs to be a working, industry-wide infrastructure to facilitate a transition from a linear to a circular economy in the maritime sector, and even theoretical explorations of this topic are limited. This novel research aims to bridge this gap by proposing a robust database solution that is the first of its kind, designed to support the industry’s transition towards circularity. This database will substantially benefit all industry stakeholders by providing a much-needed digital backbone for implementing circular economy principles. The structure of this database and its numerous benefits will be discussed in detail in the following chapters.
2. Materials and Methods
This study consists of a ten-step methodology, corresponding to four main research phases; Stakeholder Consultation and Needs Analysis (Steps 1–3), Investigation of Best Practices (Step 4), Database Development (Steps 5–8), and Testing, Validation, and Impact Estimation (Steps 9–10). Figure 1 illustrates the methodology adopted for this study. As the first step in this study, a maritime stakeholders-focused questionnaire was designed and sent out to 83 individuals from different stakeholder groups. Then, between 2021 and 2023, two online and three in-person semi-structured interviews and workshops were conducted with maritime professionals regarding enabling circular economy practices for the maritime industry. Step 3 combines the survey results and interview workshop outcomes to form a maritime industry analysis. After that, the connection between the circular economy and digitalisation was investigated in Step 4, which included diving into the details of material passports and eventually developing the maritime material passport (MMP) concept. Following these, the methodology involves developing (Steps 5–8) a database solution as a bridging strategy for enhancing the circularity of marine assets. This covers the creation of a comprehensive database that can track and manage the lifecycle of marine assets, including information on their catalogue specs, usage, upkeep, and disposal. The database solution aims to provide a centralised platform for stakeholders in the maritime industry to access and contribute data, facilitating better decision-making and resource optimisation for circular economy practices. In Step 9, a stakeholder validation workshop was organised to collect feedback and ensure end-user adoption of the suggested framework. In addition, a case study on a sample ship was conducted in Step 10 to demonstrate financial benefits and circularity impact.
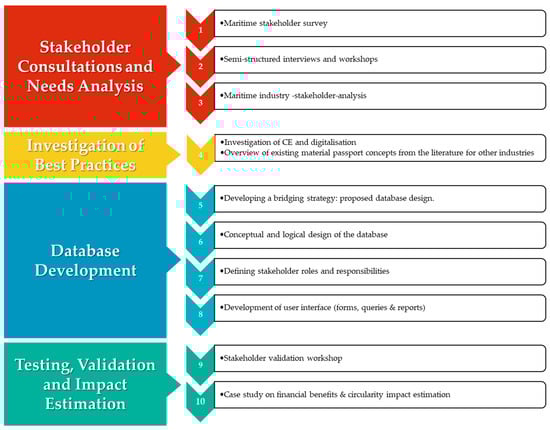
Figure 1.
Methodology.
3. Maritime Industry Analysis
The anticipated increase in world trade volume further highlights the importance of sustainable practices within the maritime sector. Unfortunately, the current environmental footprint of the shipping industry is significant; it is estimated that around 10–15% of SOx and NOx emissions globally are attributed to the maritime industry [19].
Merely focusing on the age demographics of the current fleet, the average age of cargo vessels stands around 22 years, as shown in Figure 2 [20,21]. This fact implies that a considerable portion of the fleet may not be equipped with the latest smart technologies, such as Internet of Things (IoT) sensors, on-time condition monitoring, or other I4.0 advancements. However, this also highlights an opportunity for the sector to leverage a fundamental digital infrastructure to enable circular economy principles to extend marine assets’ life and extract more value at their end-of-life phases.
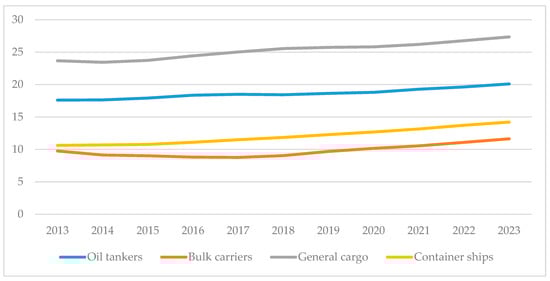
Figure 2.
World merchant fleet age by ship types.
Notably, the rise of digitalisation offers potential avenues to integrate advanced circular economy principles within the maritime domain. Nevertheless, there still needs to be a cohesive, industry-wide infrastructure to facilitate the adoption of a circular economy within the maritime sector. As of now, both empirical implementations and theoretical studies in this sphere are extremely limited, apart from a couple of literature review studies to identify the gaps [14,16,22,23,24] and the application of 3D printing on board for spare parts [25]. Moreover, the path to a circularity framework within the maritime industry is not straightforward. It is complex and requires gathering comprehensive feedback from all its stakeholders, namely ship designers, original equipment manufacturers (OEMs), shipyards, ship owners or operators, classification societies, regulatory bodies, port authorities, and local or international NGOs.
Most of the large, well-known OEMs in the maritime sector also provide products to other industries such as oil and gas, power generation, construction, and so on. Their circularity levels in those sectors are generally much higher than in the maritime sector [14]. In other words, even though they have capabilities to reuse or remanufacture, for instance, they are very limited in carrying out those restorative circular operations in the maritime industry, and this is mainly because of a need for a proper reverse supply chain [14,16,21]. A closed-loop supply chain in the maritime industry is necessary for OEMs to implement circular practices fully. Without an efficient system for collecting and refurbishing used products, the potential for reusing or remanufacturing in the sector remains largely unexplored. Consequently, OEMs in other industries have been more successful in achieving higher circularity levels than their maritime sector counterparts.
Feedback and insights from maritime stakeholders are invaluable to form a healthy closed-loop supply chain in the maritime domain. Only through this collaborative effort can a digital roadmap be developed that suits the sector’s unique needs. Furthermore, this collective strategy should focus on more than just newly built vessels. It should also encompass the existing fleet, providing a bridging solution which ensures both older and newer ships can operate sustainably while maximising value extraction. The maritime industry’s move towards decarbonisation, green shipping, and adopting the circular economy is necessary for the environment and a step towards a sustainable and prosperous future for world trade. In that sense, this section will enclose some key results from the maritime stakeholder survey, interviews, and workshops conducted by the authors.
3.1. A Stakeholder Survey
A comprehensive maritime stakeholder survey has been carried out in this study. A total of 83 participants, with an average of 10.5 years of experience in the sector, provided their feedback. Figure 3 represents the participation background per stakeholder category. As shown in the figure, there is a diverse representation from different stakeholder categories within the maritime industry. Moreover, a significant portion of the participants are in decision-making positions in their organisations. This indicates that the survey has captured a wide range of perspectives and insights from key individuals who significantly influence the maritime industry. Including decision-makers in the survey ensures that the findings and recommendations derived from this study will strongly impact future policies and strategies within the sector. According to the results, even though many barriers prevent a smooth and quick transition to a circular maritime industry [16], the potential is clearly evident. OEMs participating in the survey are especially aware of this potential. They expressed their willingness to invest in research and development to explore circular economy practices further. Additionally, the survey revealed that stakeholders believe collaboration between different maritime industry actors is crucial for successfully implementing circularity initiatives.
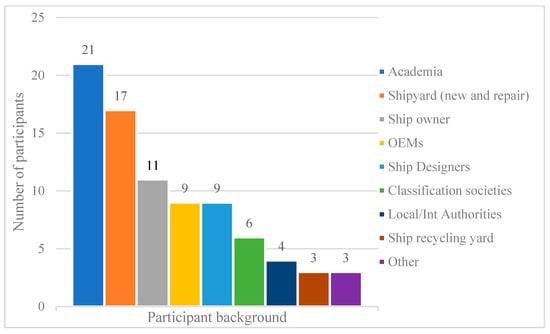
Figure 3.
Distribution of survey participants by maritime sub-sectors.
In the survey, there are specifically designed questions for different stakeholder groups. Depending on their role in the maritime sector, the participants were asked for different perspectives on the barriers and potential of transitioning to a circular maritime industry. This approach allowed for a comprehensive understanding of the challenges faced by various stakeholders, including shipbuilders, port authorities, and shipping companies. The diverse responses provided valuable insights into the specific areas that need to be addressed to facilitate a successful transition towards a more sustainable and circular maritime industry.
As illustrated in Figure 4, 86% of OEMs have declared that they are able to carry out advanced circular practices such as reuse, remanufacture, and repurpose (RRR) operations for on-board engines and hydraulic equipment. Half of the shipyard stakeholders have joined them in this declaration. Nearly two-thirds of this group stated that they have sufficient technical capabilities to remanufacture the components onboard vessels. The results demonstrate a strong presence of remanufacturing know-how in the industry, particularly among OEMs.
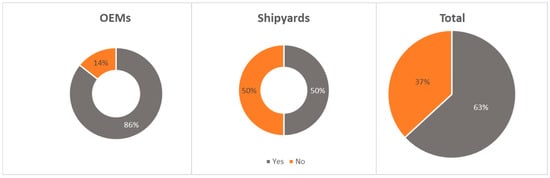
Figure 4.
Are OEMs able to reuse, remanufacture and repurpose (RRR) engines and hydraulic components?
After learning about the industry’s capacity to utilise these circular principles, participants from academia and OEMs are more precisely asked about their thoughts and intentions regarding RRR operations. There is a strong interest among academics and manufacturers in the industry, as shown in Figure 5, where more than 80% of the participants approve of these circular activities and prefer to carry them out. This high approval and willingness indicates a growing recognition of the economic and environmental benefits of RRR operations. It also suggests a strong potential for collaboration between academia and OEMs to develop and implement these circular practices in the maritime industry more extensively. On top of that, to further discover the intentions of OEMs and shipyards, this group was asked whether they would consider participating in a remanufacturing hub concept in the future. On a 1–5 Likert scale (1 meaning no and 5 meaning definitely yes), the stakeholder group responded with 3.74 points, as illustrated in Figure 6, responding “probably yes” to the question. Moreover, in the follow-up section, none of the participants directly rejected the idea of collaboration with third-party remanufacturers, as depicted in Figure 7.
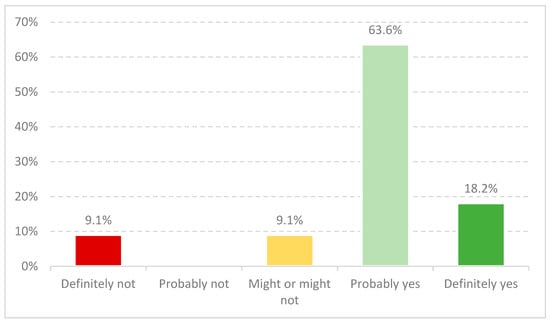
Figure 5.
OEM’s willingness to reuse, remanufacture, or repurpose.
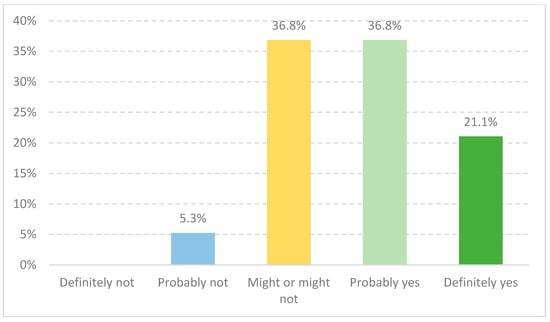
Figure 6.
Would you participate in remanufacturing hubs (OEMs, Shipyards)?
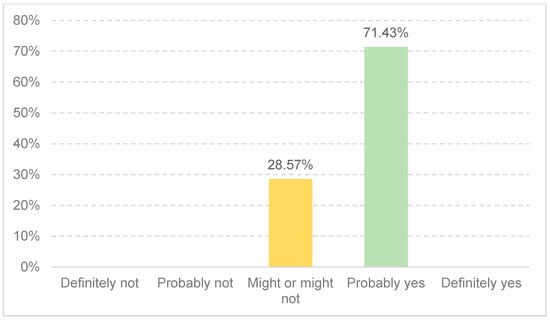
Figure 7.
Would you cooperate with third party remanufacturing companies if you provide the original parts and conduct inspections?
Overall, the questionnaire showed substantial interest among OEMs and shipyards in participating in remanufacturing valuable marine components and equipment. A moderate percentage supports the remanufacturing hub concept, too. While OEMs and shipyards did not express a definitive “yes” response, their average score of 3.74 suggests they are open to the idea. Additionally, the fact that none of the participants outright rejected collaboration with third-party remanufacturers indicates a potential willingness to explore partnerships in this area. Also, remanufacturing capability already exists within some OEMs and shipyards, which increases the chances of accurately applying circular economy principles in the maritime sector.
3.2. Insights from Interviews and Workshops
Two online (51 and 12 participants, respectively) and three in-person (14, 8, and 9 participants, respectively), semi-structured interviews and workshops were conducted with various maritime stakeholders regarding enabling circular economy practices in the sector. In these events, a wide range of topics were discussed, from the potential benefits of circular economy practices to existing barriers in the maritime domain. Best practices from other transportation industries (automotive, aviation), power generation, and construction industries were also put on the table. The primary objectives were strategies to address the current gaps and pave the way for a successful circular transformation.
Maritime professionals are aware that a good solution that enables circular economy principles in the maritime domain should be applied to existing fleets, as there are more than 56,000 vessels of 1000 GT and above sailing over the globe [26]. In this sense, three main strategy groups are identified: the first step is focused on creating a circular mindset for entire stakeholder groups, followed by the essential steps to realising maritime circularity, and the final strategy set is more concerned with the most advanced future solutions after the successful transition.
Creating a circular mindset includes building industrywide awareness, from ship designers to end customers (cargo owners), and everyone in between should be acknowledged, trained, or educated on the benefits and principles of maritime circularity. This strategy also fosters collaboration and knowledge-sharing among stakeholders to drive innovation and problem-solving in the industry. Additionally, it emphasises the importance of integrating circularity into policies, regulations, and industry standards to create a conducive environment for circular practices. Therefore, international authorities and classification societies have an important role in motivating other stakeholders, especially ship design and building communities. Such regulations and standards are necessary to ensure the widespread adoption of circular practices in the maritime industry. Without clear guidelines, shipbuilders may hesitate to invest in circular design and construction methods, fearing potential conflicts with existing regulations. Furthermore, the need for standards makes it difficult for shipowners and operators to assess the environmental performance of different vessels, hindering their ability to make informed decisions regarding sustainable shipping options.
Essential strategies to realise maritime circularity consist of a holistic approach to the lifecycle impact of vessels, digital asset tracking systems, and certified equipment remanufacturing. A holistic approach means taking into account shipbuilding emissions, raw material and recycled material contents and energies, as well as operation emissions due to fuel consumption and other consumables. In recent years, the goal of reducing emissions from shipping has become increasingly popular; however, most of the research so far has ignored the emissions during the shipbuilding, repair, and recycling stages, as their ratio is minimal compared to the operation stage. However, on the other hand, we have limited natural resources to produce as many goods as needed. Hence, it is crucial to consider raw material consumption to produce any marine equipment or a complete vessel. Lifecycle analysis (LCA) methods might be extremely handy at this point, and in the near future, most of the newly built vessels might benefit from standardised LCA applications. Asset tracking is an absolute must to enable almost all of the circular economy principles and even accurate LCA practices for new vessels. Following a component through its lifespan and accounting for all materials or subcomponents that might be reused, remanufactured, or recycled is a crucial step in this strategy. Even a basic asset tracking system that depends on its users to be operated manually might bring significant benefits to the industry, such as enabling remanufacturing through facilitating core component collection or estimating the end-of-life value of vessels or onboard equipment more accurately. From the circular economy aspect, the certified equipment manufacturing process is a complementary part of the essential strategy group. Certification here means having OEM and classification society approvals for the remanufactured products to be used in new or existing vessels without any issues. This certification ensures that the remanufactured products meet the required quality and safety standards, reassuring shipowners and operators. Additionally, by promoting remanufactured products, the industry can reduce its reliance on new raw materials and contribute to a more sustainable and resource-efficient future.
The final strategy involves long-term, advanced solutions following a successful circular economy transition. These strategies include real-time condition monitoring for marine assets using Internet of Things (IoT) and smart recovery decision-making (SRDM) systems to determine the optimum time and method of end-of-life practices and remanufacturing hubs to utilise economies of scale from reusing or remanufacturing operations. These strategies aim to maximise the lifespan of marine assets and minimise waste generation. By implementing IoT technology, real-time data can be collected to monitor the condition of assets, allowing for proactive maintenance and timely decision-making on when to retire or repurpose them. Additionally, establishing remanufacturing hubs will reduce the need for new production and create opportunities for job growth and economic development in the circular economy sector. Therefore, the next section will discuss the circular economy and digital solutions.
4. Circular Economy and Digital Solutions
4.1. Circular Economy and Digitalisation
The CE refers to a method of economic growth that emphasises reusing and recycling resources rather than creating new ones. In other words, it is a regenerative alternative to the take-make-waste extractive economic paradigm because it seeks to preserve as much value as possible in products, parts, and materials. In this sense, the CE paradigm is a visionary framework that aims to change industries into regenerative systems by putting more emphasis on closing, narrowing, and slowing down energy and material loops [27,28]. This concept has gained momentum as rapid technological advancements continue, and digitalisation plays a crucial role in enabling the circular economy. Digitalisation refers to integrating digital technologies and data-driven processes into various aspects of industries and systems. Digitalisation is being incorporated across various sectors to ensure sustainable material and energy utilisation without compromising the prospects of future generations [29]. In fact, innovative digital techniques have been applied across several industries and nations to integrate crucial CE technologies. These instruments include metrics for circularity, life cycle costing, life cycle impact assessment, and material passports. The adoption of such instruments, fuelled by digital innovation, has paid off in both environmental and economic terms [30]. In other words, the interaction of CE principles with digitalisation capabilities sets the stage for a healthy combination of economic development and environmental care.
There is a clear gap in research on digital tools to boost circular economy adaptation in the maritime sector. A predominant issue is the deficient data sharing, making it exceptionally difficult to measure the success of circular economy principles and to come up with accurate circularity indicators [31]. To tackle this, the EU’s Circular Economy Action Plan has proposed novel models driven by digital tools such as the Digital Product Passport (DPP), which provides essential product details [28,32]. These innovative tools can play an instrumental role in expanding circularity in the maritime sector, provided their potential is realised and harnessed effectively. The details of the DPP and Material Passport (MP) concepts will be discussed in the next section.
The CE landscape is complex and requires several data types to ensure effective implementation. Louma et al. [33] defined four key data types which are important for the effective implementation of the circular economy. These data types include customer behaviour data, which help us understand consumer preferences and behaviours; product or service lifetime data, which track the lifespan and usage patterns of products or services; system performance data, which measure the efficiency and effectiveness of the circular economy system; and material flows data, which track the movement of materials throughout the circular economy. Each data type uniquely supports the circular economy based on factors such as industry dynamics, product or service characteristics, and environmental conditions. However, the obvious thing is that as sectors and businesses work more towards a circular economy, the traditional ways of doing business will be strongly challenged. Enhancing CE would change prior linear supply chains into more open examples of cross-sectoral collaboration [34], forcing organisations to align their interests in order to support sustainable growth [35]. As a result, organisations are more reliant on active cooperation across many actors to realise, provide, and participate in value creation [31,36]. This necessitates the transformation of raw data into actionable insights [37], possibly through external collaborations [38,39], thereby amplifying the significance of trust within the value chain [31,40]. Ultimately, data act as a catalyst, supporting various CE principles (6R) and leveraging larger and closer-looped supply chains to enhance the circularity of the overall industry.
Even though the significance of data in the CE concept is widely recognised, there has been a lack of comprehensive investigation into its application for enhancing circularity on a systemic scale [31]. Various data types hold distinct value propositions within the CE ecosystem [41]. However, the majority of the cases presented in the literature have so far focused on a single strategy rather than embracing a comprehensive system-centric perspective or holistic consideration [31,42]. Such an approach results in an incomplete representation of both processes related to CE and the roles and responsibilities of the corresponding stakeholder groups. Thus, a broader perspective with a comprehensive industry viewpoint is needed for further advancements in the circular economy. Sharing information digitally is essential to accelerating the CE transition [43]. In recent years, digital platforms have been recognised as enablers of the CE because they facilitate transactions between networks that aim to reduce resource usage and waste generation [28,44,45]. The future of CE lies in harnessing these digital tools and platforms, translating data into actionable measures that promote circularity on a grand scale.
4.2. Existing Material Passport Concepts: MP, DPP and CMP
Many heavy industries, including transportation, power generation, and construction sectors, take up the challenge and aim to achieve environmental sustainability along with economic viability. On the other hand, advanced circular economy principles such as reuse, remanufacture, and repurpose become possible only if material movements are tracked and possible pathways are defined. One of the innovative solutions to address these issues are Material Passports (MP), which can be utilised case-by-case to assist decision-makers regarding the most favourable circular end-of-life practices amongst the 6R. For instance, in the construction industry, Schaubroeck et al. [46] have emphasised the importance of material pathways, the cascade database, and its potential in in-use buildings.
The term “material passport” has appeared in the literature under a variety of different names, including “material passport” (MP), “digital product passport” (DPP) [47,48], “circular material passport” (CMP) [49], and others. However, in essence, their purpose and functionality are very similar. These different names for the concept of a material passport reflect the various contexts and perspectives discussed in the literature. Despite the variations in terminology, all these terms refer to a tool or database that provides information about the materials used in a product or building, enabling better management of resources and promoting circular economy principles. Indeed, MPs are defined as data sets that describe the features of a product in order to analyse the product’s current use as well as its potential for end-of-life opportunities such as reuse and recycling [46]. The features may include the material composition of the product, such as valuable metals or rare earth elements, as well as the products’ subcomponents and parts, as they can be utilised separately from the prime product at the end-of-life stage.
Similarly, as the name suggests, the DPP concept specifies a digital passport that can be used to track tangible items. The goal is to digitalise product lifecycles so that the circular economy can be adopted and expanded [32]. The CMP concept broadly aligns with the MP and DPP concepts, with just one key distinction: CMP is a potential tool that seeks to support stakeholders’ decision-making towards circularity during the stages of product design, use or operation, and end-of-life [49].
Regardless of their industries, all variants of material passport systems or frameworks crucially depend on an intelligent database design to function properly. It is critical to rely on standardised, trustworthy, and consistent data on end products, equipment, subcomponent composition, and associated stakeholders, which is why digitalisation is necessary [49]. Acquiring data is critical for keeping a passport up-to-date and providing precise decision support when determining which circular economy principles to follow at the end-of-life stage for each product or subcomponent. In particular, data on products and assets already in use is critical because it allows for early assessments of an appropriate circular economy strategy at the end of the first life cycle [28]. Ideally, the data acquisition can be achieved through integrated cyber-physical systems [50] or, in other words, an Industry 4.0 (I4.0) application, such as smart products utilising the Internet of Things (IoT) [14]. These technologies enable real-time monitoring and tracking of product usage, performance, and condition. These data can inform decision-making regarding product reuse, remanufacturing, or recycling options for each product or subcomponent, ultimately contributing to a more sustainable circular economy.
4.3. Maritime Material Passport (MMP) Concept
Following different material passport applications in the literature, this study presents the novel MMP concept, which adapts MP, DPP, and CMP concepts for the maritime industry. A fundamental issue in maritime transportation is a lack of reliable and accurate data about the current fleet, i.e., cargo vessels and valuable onboard equipment. A certain level of transparency and information sharing is needed to reach circularity. Without the digitalisation of product and process information and covering the whole product lifecycle, exploiting the circular economy implementations would be extremely impractical [32,51]. In other words, the CE concept would remain a theory without large-scale real-life execution. Therefore, the MMP idea aims to bridge this gap by integrating digital technologies and data-sharing platforms in the maritime industry. This would enable stakeholders to track and trace onboard equipment and products throughout their lifecycle, ensuring transparency, accountability, and efficiency in data sharing. Additionally, the MMP concept also emphasises the importance of collaboration among stakeholders in the maritime sector, such as ship owners, shipyards, OEMs, and ship recyclers, to collectively achieve circularity goals. By implementing the MMP concept, the maritime industry can move closer to realising the full potential of circular economy principles and contribute to a more sustainable industry.
MMP requires a robust and efficient database structure like any digital passport solution. Within this study, a tailor-made database structure was created for this purpose through comprehensive stakeholder analysis and integrating user requirements into the structure of the database. The next chapter will dive into the details of the suggested database, the roles and responsibilities of maritime stakeholders, and the potential benefits of a successful implementation of MMP.
5. Bridging the Gap: Proposed Database Structure for MMP
The drive towards a circular economy within the maritime industry necessitates a systematic approach to managing material information across the lifecycle of maritime assets. One significant obstacle to achieving circularity is the disjointed or siloed nature of information regarding materials, their characteristics, and their end-of-life opportunities. Bridging this gap calls for a structured, secure, and easily accessible database system tailored for Material Passports (MMP). From a holistic point of view, as a solution that will rapidly move the industry forward, this study suggests a database solution that covers all maritime industry stakeholders to track up-to-date equipment and component information on marine vessels. This proposed database structure will provide a centralised platform for stakeholders to access and update equipment information and ensure standardised data integrity and ease of use.
This section delves into the architecture and functionalities of a proposed database system that seeks to centralise and standardise valuable onboard equipment such as main and auxiliary engines and hydraulic pumps. These pieces of equipment are selected in reference to the authors’ previous work showing they possess high RRR potential [14]. With an emphasis on conceptual and logical design, stakeholder involvement, and tangible benefits, the authors present a comprehensive roadmap for implementing an MMP database that can serve as a critical enabler for maritime circularity. This section also carries out a further database validation study using expert opinions from maritime stakeholders. Moreover, a case study was used to demonstrate the financial benefits of the advanced circular economy practices and the proposed digital infrastructure.
5.1. Conceptual and Logical Database Design
The maritime industry does not have an infrastructure to facilitate industry-wide sharing and standardisation of valuable onboard equipment. This lack of centralised information leads to inefficiencies and increased costs for maritime stakeholders. By implementing an MMP database, we can address this issue by creating a platform that allows for a standardised database structure’s conceptual and logical design. This will enable stakeholders to access and share information about main and auxiliary engines, hydraulic pumps, and other valuable equipment. Additionally, the involvement of stakeholders in the design process ensured that the database satisfied their specific needs and requirements.
With maritime assets being particularly complex and costly, MMP offers stakeholders a data-driven methodology to optimise asset management strategies. By utilising the standardised database structure, stakeholders can make informed decisions regarding maintenance schedules, performance analysis, and cost-effective replacements for their maritime assets. This data-driven approach enhances overall efficiency and reduces the risk of unexpected breakdowns or downtime, ultimately leading to significant cost savings in the long run. As per a bridging strategy, listing vessels and valuable onboard components and tracking the equipment’s specifications and condition information alone is a big step for the maritime industry. Therefore, this research focuses on a fundamental digital infrastructure design to bridge the gap in the sector.
An effective database design acts as the backbone to facilitate maritime circularity through material passports. The conceptual design of the database envisions the broad relationships among the various entities involved, including OEMs, component specs, physical onboard equipment, vessels, vessel owners, building and repairing shipyards, and ship recyclers. It sets the stage for defining what types of information should be stored and how they relate to one another. Figure 8 illustrates the entity-relationship diagrams for the database.
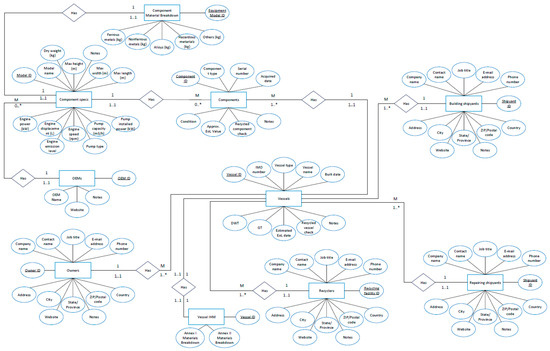
Figure 8.
Entity-relationship chart. 0.. * and 1.. * means any value between 0 and infinite, and 1 and infinite.
The logical design further refines this by specifying the database’s tables, fields, and relationships, ensuring that data redundancy is minimised, and data integrity is maintained. For example, a ‘Component Specs’ table could contain properties such as component weight, dimensions, engine power, speed, emission level, etc. On the other hand, a ‘Components’ table could capture physical components from the real world with different serial numbers and potential different applications and link those back to the ‘Component Specs’ table. Figure 9 briefly defines tables, forms, queries, and reports, which form the overall structure. The logical design consists of various entity tables and relationships based on entity-relationship diagrams and converted to database tables [52], as shown in Figure 10. In the maritime industry, building and repairing shipyards more often than not carry out both new building and repairing jobs interchangeably. Therefore, in the logical design, the same shipyards table is used to represent both building shipyards and repairing shipyards. In the ‘Vessels’ table, it is reflected that a vessel can have different building and repairing shipyards.
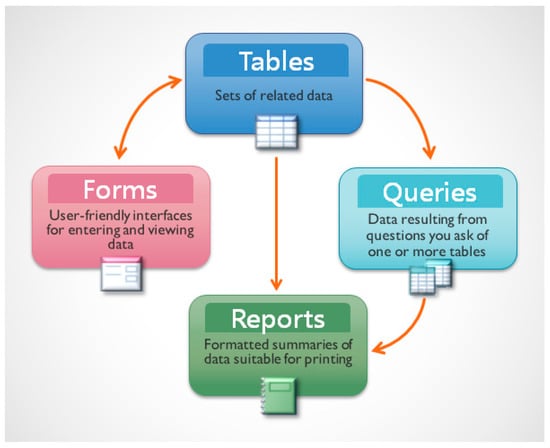
Figure 9.
Basic database elements, source: [53].
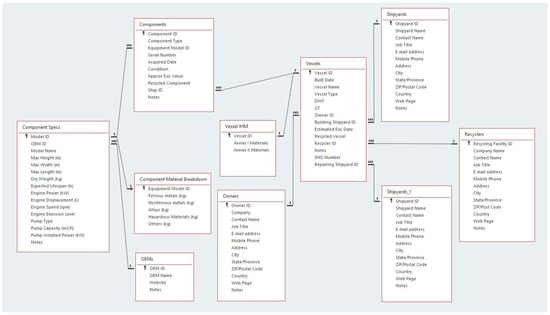
Figure 10.
Logical database design.
Overall, there are nine unique tables in the suggested database: OEMs Table, Component Specs Table, Component Material Breakdown Table, Components Table, Owners Table, Shipyards Table, Recyclers Table, Vessels Table, and Vessels Inventory of Hazardous Materials (IHM) Table. Only the Shipyards Table and the Vessels Table have two connections between them, as the former provides shipyard data for building and repairing shipyards for vessels. The tables are introduced as follows:
- OEMs Table:
Like all tables in the database, this table contains its own unique identification key (OEM ID). The table also stores information about maritime original equipment manufacturers, such as their names, website, and general notes.
- Shipyards Table:
Building and/or repair shipyard data are stored in this table. This table assigns a Shipyard ID to each unique shipyard in the system and stores their name, contact person and contact information, address, web page, and general note information. As a specific case, the shipyard’s table is connected to the vessel’s table in two ways: the first connection feeds building shipyard information, while the second feeds repairing shipyard information. Most shipyards in the maritime industry can carry out both of these functions. A vessel is built in a known shipyard; however, the vessel can receive repair services in any other shipyard worldwide. Therefore, the repairing shipyard reflects the latest shipyard that conducted the repair work for that ship.
- Owners Table:
Shipowner or operator company data are stored in this table, such as contact information, including company name, contact name, position, e-mail, phone number, and corporate webpage.
- Recyclers Table:
Ship recycling facility or recycling shipyard data are stored here. This table contains similar contact information, addresses, web page details, and the free-text notes section. And, it connects to the vessel’s table.
- Components Table:
The components table is where each individual onboard engine and pump information for each vessel is recorded. This table combines the data from the Component Specs and Vessels tables, reaching all components of all ships registered in the database and their OEM specifications.
- Component Specs Table:
Component catalogue specifications for each different equipment model should be recorded here by OEMs. These specifications include component dimensions (height, length, and width) and weight information, which are crucial for remanufacturing in transportation and material handling processes.
Since the database is designed for engines (main and auxiliary) and pumps within this study’s scope, there is a standard component specification table for these two commodities. Therefore, each component model in this table should be filled with the engine or pump technical detail sections. Engine specs are power, displacement, speed, and emission standards, while pump specs are type (gear, centrifugal, etc.), capacity, and installed power. Apart from that, the table also contains a free-text notes section for each record.
- Component Material Breakdown Table:
The material breakdown table is added as complementary to the component specifications table. They both store the technical details of onboard components; however, the breakdown table is specifically dedicated to the material content of each piece of equipment, including ferrous metals, nonferrous metals, alloys, hazardous materials, and other substances. Therefore, this table falls within the responsibility of OEMs.
- Vessels Table:
The Vessels Table stores ships’ data such as their building shipyard, built date, vessel name, IMO number, vessel type, DWT, and GT data, and vessels are matched with their owners, up to date (latest) repairing shipyards, and optionally (if known) their final destination, e.g., ship recyclers. There are sections in this table for entering estimated end-of-life dates and indicators showing whether the ship is recycled or not.
- Vessels IHM Table:
This table is dedicated to the IHM, which was adopted in 2009 at the Hong Kong International Convention (HKC) for the safe and environmentally sound recycling of ships. The convention dictates that all vessels above 500 Gross Tonnes (GT) will need to create and keep updated IHM records [54,55]. Moreover, European Regulation No. 1257/2013 on Ship Recycling (EU-SRR) aimed to facilitate early ratification of the HKC and raised the standards for EU-flagged vessels [56]. Thus, this table has been added as a connection point so that the database can contain IHM records for each vessel or interact with any external IHM recording system that may develop in the future.
5.2. Stakeholder Accounts, Roles and Responsibilities
For an MMP database to be effectively implemented and utilised, clearly defined stakeholder roles and responsibilities are imperative. In the context of the proposed database, these stakeholders include building and repairing shipyards, ship owners, OEMs, and ship recyclers. Each account type has varying access levels and responsibilities according to their organisation. In this system, an independent database management authority or administrator monitors the overall system, ensures smooth operation, and handles any errors that occur. Ideally, the database administrator should be from a non-profit, unbiased organisation, such as IMO or academia. The involvement of an independent database administrator from a non-profit or unbiased organisation like IMO or academia helps ensure the integrity and impartiality of the system. On the other hand, academia may not be able to handle such things as ISO standards not being implemented. Possibly, recognised organisations such as classification societies can provide such a service. The database administrator role is crucial in maintaining data accuracy, resolving conflicts, and addressing potential issues. The administrator can also provide guidance and support to stakeholders, ensuring they fully understand the system’s functionalities and how to utilise it for their specific needs effectively.
Database tables were explained in the previous section above. Other instruments of a functional database are forms, queries, and reports which are used for entering, viewing, and editing data for individual records, while reports present formatted summaries of data suitable for printing. Queries are the questions that users ask to single or multiple tables in the database, and queries can be used to produce reports as well. This section introduces the forms, queries, and reports that are essential tools for effective data management generated by the authors to cover all stakeholder groups. These tools allow stakeholders to interact with the database in a user-friendly manner, enabling them to input, retrieve, and analyse data efficiently.
5.2.1. Forms
In total, there are seven forms designed. Forms can constitute a basic interface for the database by allowing users to enter new records and view and edit existing data. Brief definitions of the forms are as follows.
The owner/operator form is designed for entering and editing ship operator companies’ corporate and contact information. It is connected to the Owner table in the database, and the database management authority should manage this information. And, when needed, ship owners/operators should inform the database management authority of any update requirements regarding their information here. Figure 11 shows an empty owner/operator form template below.
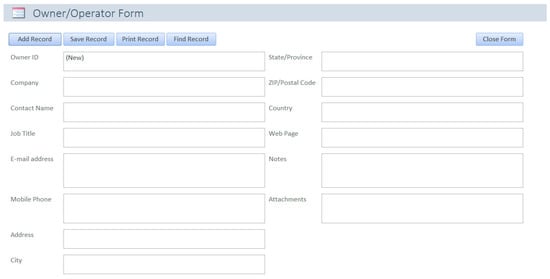
Figure 11.
Template owner/operator form.
The shipyard form is designed for entering and editing shipyards’ corporate and contact information. It is connected to the Shipyards table in the database, and the database management authority should manage this information. When needed, shipyards should inform the database management authority of any update requirements regarding their information here. Figure 12 shows a shipyard form template.
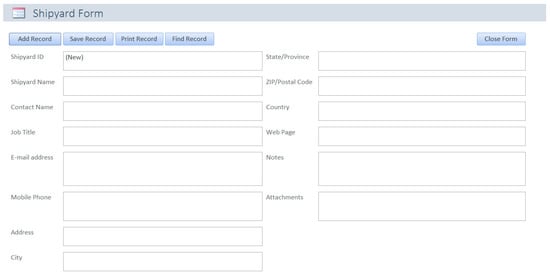
Figure 12.
Template shipyard form.
The recycling facility form is designed for entering and editing recycling shipyards’ or recyclers’ corporate and contact information. It is connected to the Recyclers table in the database, and the database management authority should manage this information. Recycling companies should inform the database management authority of any update requirements regarding their information here when needed. Figure 13 shows an empty recycling facility form example.
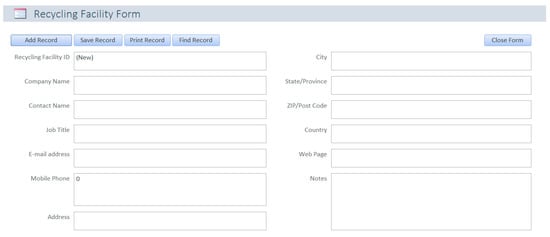
Figure 13.
Template recycling facility form.
The OEM form is designed for entering and editing OEMs’ corporate information. It is connected to the OEMs table in the database, and the database management authority should manage this information. When needed, OEMs should inform the database management authority of any update requirements regarding their information here. Figure 14 presents an OEM form template.
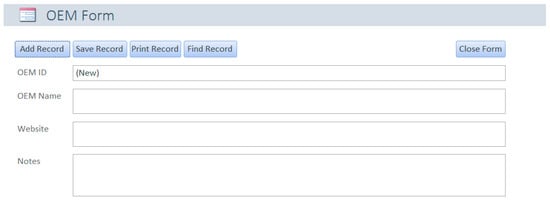
Figure 14.
Template OEM form.
The component specification form is connected to the Component Specs Table. In line with the database design, the main users of this form are OEMs. It is the OEM’s responsibility to provide component specification data. Therefore, this form is designed mainly for OEM usage, and OEM data are called from the OEM table. Thus, there is a drop-down list for selecting relevant OEMs on the upper right side of the form. Figure 15 shows the template form.
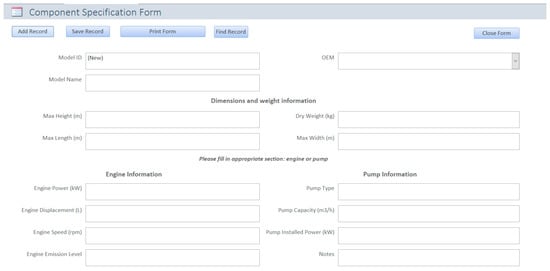
Figure 15.
Component specification template.
The component material breakdown form is connected to the Component Material Breakdown Table. Similar to the previous form, OEMs are the users of this form. The form should be filled out for each equipment model by their manufacturers, and the asset’s dry weight should be split into ferrous metals, nonferrous metals, alloys, hazardous materials, and other substances. Figure 16 illustrates a component material breakdown form template (the material data are covered at this stage as they are not publicly available information).
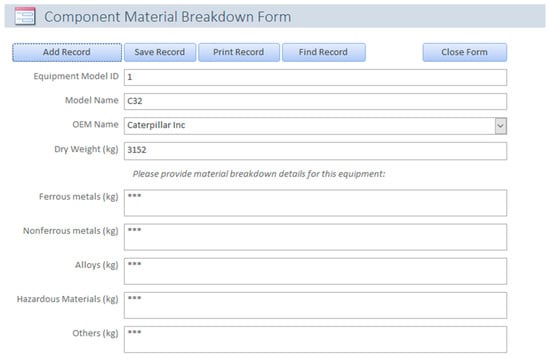
Figure 16.
Component material breakdown template. *** Covered data.
The vessel form is designed for entering and editing ships’ technical (building shipyard, built date, type, GT, etc.), ownership, and recycling information. The form is connected to the Vessels table in the database, which also connects to the Owners, Shipyards, and Recyclers tables. Therefore, the Building Shipyard, Repairing Shipyard, Owner, and Recycling Facility elements of the form are designed as drop-down lists calling data from relevant tables. The vessel type element is also a drop-down list of predefined ship types. Initially, the building shipyard should fill this form during a ship’s building stage. The shipyard should create a record for the vessel by providing—at least—the information on the left-hand side of the form.
The system automatically notifies shipowner organisations when a vessel is added, removed, or updated associated with their organisation. They can also query to see all the information about their ships. During the vessel’s service time, ship owners or shipyards can update the ship’s information if any changes happen. When the owner/operator enters or updates the repairing shipyard, the vessel’s information becomes visible to the repairing yard. The database managing authority should verify and approve them to keep the data updated.
The form also has an EoL part at the bottom right corner. Shipowners can enter an optional estimated EoL date or update it anytime. They can also specify a ship recycling facility if the recycling is planned. This will send the recycler a notification regarding their plan, and the recycler will then be able to see the vessel’s information, including all equipment on board. Finally, when the ship is recycled, the recycler should tick the Recycled Vessel box to indicate that decommissioning is complete. Figure 17 illustrates a vessel form template.
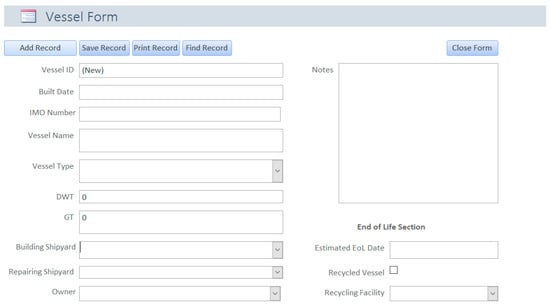
Figure 17.
Template vessel form.
The onboard components form (OBCF) is designed for adding, updating, or removing valuable components onboard vessels. The form is connected to the Components table in the database, with first-level connections between the Component Specs and Vessels tables. Thus, it is indirectly connected to all tables in the database. A pre-defined component-type drop list indicates whether it is the main engine, an auxiliary engine, a pump, etc. Model and ship selections are also designed as dropdown lists connected to their relevant tables in the database. For instance, a vessel should be recorded in the database by submitting a vessel form first; only then OBSF can call that specific ship from the Vessels Table. Component serial number, acquisition date, condition, and approximate EoL value are other data managed by OBCF.
Like the vessels form, OBCF should first be filled in by shipyards during the shipbuilding phase. The shipyard should submit a form for each valuable component on board, such as main and auxiliary engines, pumps, etc. Then, the shipowner organisation is automatically notified by the system when a component is added, removed, or updated onboard a vessel associated with their organisation. They can also make a query to see all the components on board their ships. During the vessel’s service time, ship owners or repairing shipyards can update the ship’s information if any changes happen. The database managing authority should verify and approve them to keep the data updated.
Finally, when the component is removed from the vessel for recycling or remanufacturing purposes, the recycling facility or repairing shipyard should tick the Recycled Component box to indicate that the component is removed from the ship, and they are no longer associated. Figure 18 depicts an empty onboard components form example.
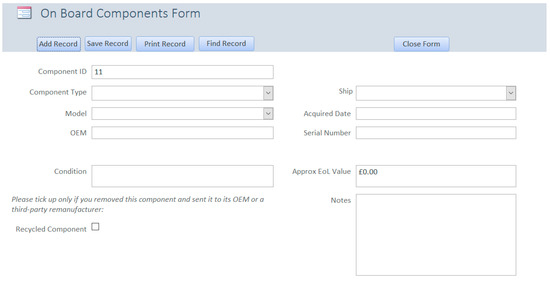
Figure 18.
Empty onboard components form.
5.2.2. Queries and Reports
While the forms explained in the previous section create data entering and editing interface process the database, queries, and reports allow the stakeholders to track vessels and components associated with their organisation regularly.
Within the scope of this study, some basic queries were written for the suggested database and are presented below. Structured Query Language (SQL) is used to write queries for communicating with the database. It is essential to underline that database queries are incredibly flexible tools that enable us to design tailor-made reports covering specific requirements. Therefore, apart from the queries shown below, any future report or function could be added later without any problem as long as the database includes that information.
Appendix A presents several queries written to provide valuable outputs for all stakeholder groups. Those queries are foundational examples of how the information stored in the database can be used; however, if any other information is needed, the database is capable of providing the requested information using SQL. The database management authority or administrator can create custom queries anytime and share their results with relevant stakeholder groups. Or, it can be converted to a standard report form and automated to produce regular reports that can be distributed to corresponding stakeholder accounts.
This section will provide sample query outputs and reports for each stakeholder group. The authors hope they help envisage the database’s potential use and offer a glimpse of how the information can be utilised. These sample query outputs and reports can serve as a starting point for stakeholders to understand the possibilities and tailor their own queries based on their specific needs. This might eventually end up with an extended database design for storing more detailed data or possible on-time condition monitoring functions. However, for now, this research focuses on the essential functions as a starting point and sticks to its main purpose of tracking onboard engines and pumps on commercial vessels while causing the minimum workload to maritime stakeholders.
Ship owner/operator:
Queries for ship owners or operators list the operating, recycled, and total assets (vessels and onboard equipment) associated with each ship owner. In other words, these queries show the data of the relevant assets for each particular shipowner organisation. Depending on their preference, the results are to be shared with the owners regularly, such as weekly, biweekly, or monthly. Query 1 in Appendix A shows all components on board all vessels registered for “Ship Owner C”, which includes the OEM name, component model, type, serial number, acquisition date, latest condition, approximate EoL value (if known), along with the vessel name and IMO number. In addition to these, two indicator columns show if the vessel and/or the components are recycled or decommissioned. Figure 19 shows the visual output of Query 1.
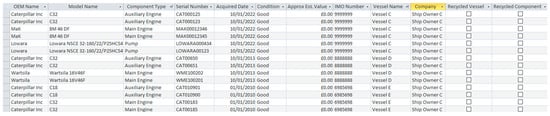
Figure 19.
Output of Query 1 for ship owners/operators.
On the other hand, Query 2 gathers information about the vessels belonging to “Ship Owner C” and shows vessel name, IMO number, GT, DWT, built date, building shipyard, latest repairing shipyard, recycling yard (shows as TBD—to be determined if not specified), and estimated EoL date (if entered). Figure 20 depicts a report sample created using Microsoft Access as the query’s output. Similarly, Query 3 is used to provide onboard equipment dimensions and dry weights along with basic vessel and component information for “Ship Owner C” as shown in Figure 21.
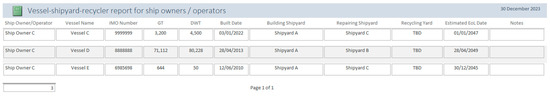
Figure 20.
Output of Query 2 for ship owners/operators in report format.
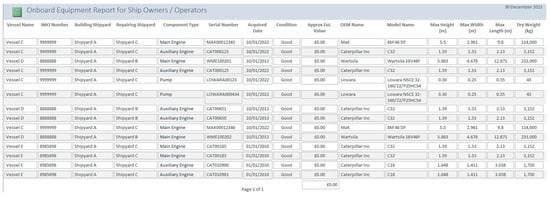
Figure 21.
Output of Query 3 for ship owners/operators in report format.
Building Shipyards:
Query 4 is a dedicated query for building shipyards, which lists all built vessels and their components. Figure 22 shows the outputs of Query 4 for “Shipyard A” in a standard report format using dummy inputs. In this way, new building shipyards can see all the vessels they have built with their onboard component information.
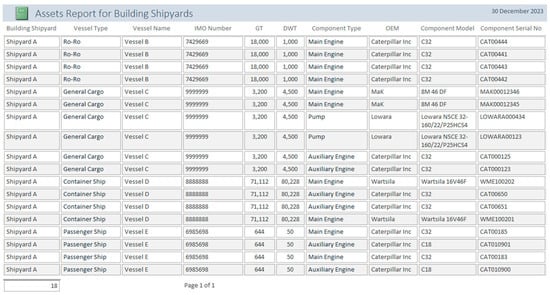
Figure 22.
Onboard assets report for building shipyards (Query 4).
Repairing Shipyards:
Unlike the building shipyards, the repairing shipyards have two different queries; the first contains vessel data, including owner and building shipyard contact info, while the other contains on-board equipment information for each vessel. Queries 5 and 6 represent vessel data and component data for “Shipyard C” as an example from our dummy database, and the outputs are shown in Figure 23 and Figure 24, respectively.

Figure 23.
Vessels report for repairing shipyards (Query 5).
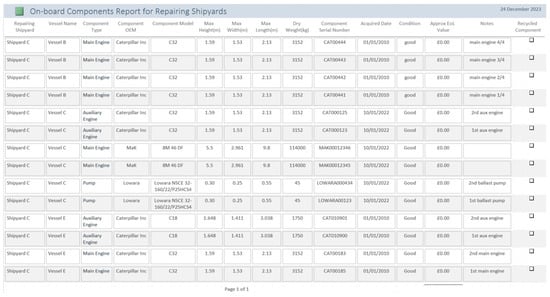
Figure 24.
Onboard assets report for building shipyards (Query 6).
Ship Recyclers:
Four separate queries have been written for ship recycling facilities. The first one (Query 7 in Appendix A) is focused on vessels assigned to the particular ship recycler and shows vessel information such as their name, IMO number, type, GT, DWT, built date, owner company, owner contact information, and notes. Query 8 dives into the on-board engine details on these vessels, while Query 9 illustrates onboard pump information. The former depicts engine specifications such as power, displacement, and speed, and the latter presents pump specs on top of common dimension and weight information for each component. Lastly, Query 11 is dedicated to the material breakdown of onboard components. Figure 25 and Figure 26 demonstrate the vessel and the onboard engine reports for “Recycling Facility B” as examples, while Figure 27 presents the material breakdown of onboard assets for the same recycling facility.
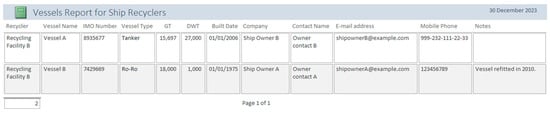
Figure 25.
Vessels report for ship recyclers (Query 7).
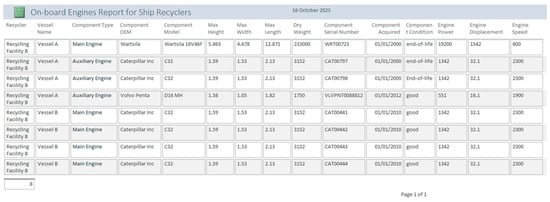
Figure 26.
Onboard engines report for ship recyclers (Query 8).
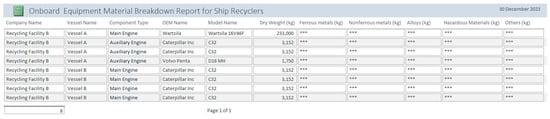
Figure 27.
Onboard equipment material breakdown report for ship recyclers (Query 11). *** Covered data.
OEMs:
A single query is created for OEMs to enable them to track all their components onboard entire vessels in the database. Query 10 represents an example of a “Caterpillar” branded components query from the dummy database, and Figure 28 displays its output in a straightforward report format.
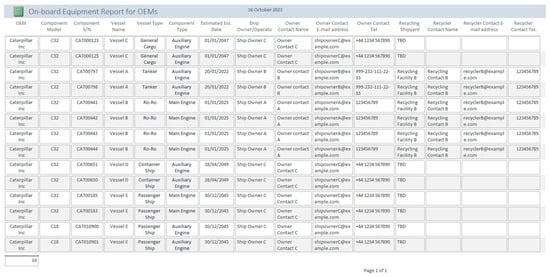
Figure 28.
Onboard equipment report for OEMs (Query 10).
5.3. Database Validation Workshop
The validation workshop, held at the University of Strathclyde, aimed to introduce the maritime database to experts from different stakeholder groups. Twelve highly experienced professionals (three per each stakeholder group) participated in the workshop: ship owners, original equipment manufacturers, shipyards (new build or repair), and ship recycling facilities. These experts were selected based on their extensive knowledge and involvement in the maritime industry, ensuring that their assessments would be valuable and representative of the end-users’ perspective. Appendix B includes their background and the expertise of participants.
The expert opinion scores collected from maritime experts play a crucial role in evaluating the database’s performance. These scores provide valuable insights into the tool’s functionality, simplicity, and long-term potential benefits. Using a 1–5 Likert scale, the experts rated the database based on its usefulness, ease of use, and potential benefits. These scores serve as quantitative indicators of the experts’ perceptions and can be used to identify areas of improvement or strengths in the database’s design and functionality. Table 1 shows expert opinion scores in these three dimensions, along with the current state of corresponding maritime stakeholders and the potential impacts discussed during the validation workshops.

Table 1.
Expert opinion scores for database validation.
During the workshop, experts had the opportunity to interact with the database and receive sample reports. As a result, they provided valuable feedback, which was used to amend database tables, add new columns, and update forms and reports. One expert from a shipyard stakeholder highlighted the database’s quick and hassle-free asset creation and updating functions, stating that it would not significantly increase their workload to add or amend data for the vessels they service. Another expert from an OEM stakeholder highlighted that the database’s detailed coverage of marine assets on the existing merchant fleet would be helpful for driving advanced circular economy applications such as driving remanufacturing forward in the maritime industry. Ultimately, the database can foster innovation and collaboration within the industry by providing a centralised platform for sharing crucial information regarding the reverse supply chain and increasing transparency in the sector. These discussions shed light on the far-reaching benefits the database can bring to the maritime sector.
5.4. A Case Study on Financial Benefits
This section presents a case study for an example vessel to demonstrate the potential benefits of the tool and the circular economy practices it will promote in the maritime domain. The ship owner of the case study vessel is one of the experts who participated in the database validation workshop in the previous section.
The case study presented in this section intentionally selected a vessel with a smaller gross tonnage (GT) than the world average to stay on the safe side in the generalisation steps in the following steps. The average of the entire world fleet of 105,395 commercial vessels is 14,581 gross tonnes (GT) [57], while the case study vessel has 8525 GT. This is because the total fleet contains ultra-large ships, such as ultra-large crude carriers (ULCC) or very large ore carriers (VLOC), with capacities exceeding 230,000 GT. These ultra-large ships can significantly elevate the world average and could potentially distort the results of the study. Therefore, the authors tried to prevent the presence of ultra-large ships in the entire fleet from skewing their findings and conclusions by choosing a vessel with the most common smaller GT.
The case study consists of six steps, as follows:
Step 1:
The ship owner company created a new record to enter the vessel into the database using the vessel form shown in Figure 29. The vessel’s IMO number is hidden for confidentiality purposes; also, instead of its real name, Vessel H is used for the case study.
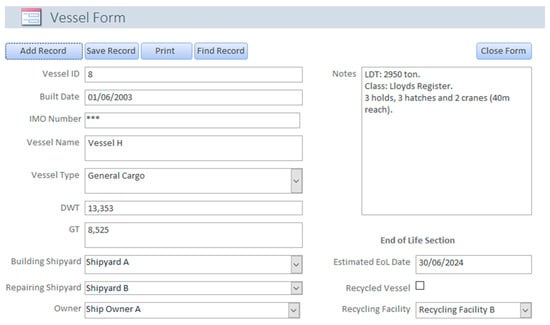
Figure 29.
Entering the vessel into the database. *** Covered data.
Step 2:
Then, the ship owner created onboard equipment records for the main and auxiliary machinery. The vessel’s first engineer and the latest shipyard in which the vessel had been dry-docked provided engine hours both current and during the last major overhaul records as presented in Figure 30.
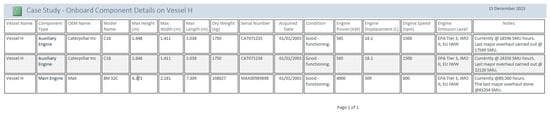
Figure 30.
Onboard component details of Vessel H.
Step 3:
Ideally, product specifications data should come from OEMs; however, for this case study, the authors reached out to local dealers of the equipment and entered product information themselves. That is the source of engine technical details, such as main dimensions, weight, power, displacement, and speed, illustrated in the material breakdown presented in Figure 31. Other information, such as the serial number, acquired date, and specific notes about each component, comes from Step 2, where the ship owner used the onboard components form to add assets to the vessel. At this point, authors do not have permission to publish material breakdowns for this equipment; therefore, they are hidden in Figure 31.
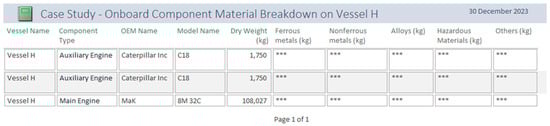
Figure 31.
The onboard component material breakdown details of Vessel H. *** Covered data.
Step 4:
In this step, the financial activity that would be generated as a result of recycling Vessel H using the current industry practice is estimated. Ship recycling stakeholders involved in the database validation step quoted the vessel’s value according to today’s market.
Considering today’s market, the scrap value (Vs) of purchasing the vessel from its owner as a ship recycling facility will be USD 1,475,000. On top of that, a 15% profit margin is added for ship recycling facilities [58], and the financial activity generated by the recycling process is estimated at USD 1,696,250. Furthermore, the recycling stakeholders (experts) provided their estimations on the breakdown of scrap values, as presented in Table 2.
Table 2.
Scrap value of Vessel H with current practices.
Once the vessel is sold to a recycling facility, it is marked as a recycled vessel in the database. The recycling facility is responsible for updating that information, and when it is updated, corresponding OEMs will be notified, so that they will be able to see their products onboard that particular vessel.
Step 5:
In Step 5, the potential end-of-life value of Vessel H once advanced circular economy practices are applied is investigated. The database aims to build the connection between ships’ end-of-life stages and equipment manufacturing stages. By creating a reverse supply chain, much-needed core component flow for remanufacturing operations will be provided for OEMs. That will result in financial benefits for all stakeholders involved in the process. Therefore, this step dives into the potential financial benefits of marine engine remanufacturing processes for Vessel H.
Firstly, similar to the current practice values, and values are the same. However, is zero, as the onboard equipment will be sent to remanufacturing facilities instead of the direct (as-is) resale or scrapping process.
Previous research on marine engine remanufacturing studies found that remanufactured engines kept 48.3% of their original value with respect to brand-new products [14]. This value was used to estimate the main and auxiliary engine remanufacturing savings, as shown in Table 3. Main engine remanufacturing savings () and auxiliary engine remanufacturing savings () are calculated using Equations (1) and (2), where AC is the acquisition cost and SF is the savings factor for the corresponding assets. In this study, both saving factors are taken as 45%.
Table 3.
Recycling value of Vessel H with advanced circular practices.
The estimated total savings from main and auxiliary engines () is obtained as USD 1,822,500 by using Equation (3). This value indicates significant benefits for three main stakeholders in the maritime industry: ship recyclers, OEMs, and ship owners. However, at this stage, it is not possible to assess in what percentages the value will be shared amongst these stakeholders, as the matter is complex and depends on many parameters, and the market has yet to form. At this stage, the authors can only say that ship recyclers will not make less profit by becoming suppliers in the reverse supply chain, so in the case study, the recycler is expected to have a share greater than Ve (USD 398,250.00).
On the other hand, when one looks at the industry-level financial activity originated from these advanced recycling processes, the total financial activity generated is estimated at USD 3,120,500 using Equation (4).
Step 6:
The final step of this case study is the comparison of the value generated with current industry practices (in Step 4) and the potential value generated with advanced circular practices (in Step 5).
The case study reveals that if all onboard engines could be remanufactured, the vessel could generate 83% more financial value, amounting to USD 3,120,500 instead of USD 1,696,250 at the end-of-life stage. The Vessel H case study highlights the significant financial benefits of implementing a functional reverse supply chain and widespread equipment remanufacturing applications in the maritime industry by comparing the value generated through current industry practices with the potential value generated through advanced circular practices. This not only increases the end-of-life financial value of vessels, as demonstrated by the 83% increase in value for Vessel H, but also showcases the broader potential outcomes of adopting advanced circular economy practices in this sector.
Impact Estimation of the Case Study
When one looks at the statistics of the world’s commercial fleet, it is seen that between 2014 and 2022, the average annual ship recycling gross tonnage was 18,791,032 GT [57]. That corresponds to around 2400 case-study size vessels being sent to recycling annually. If the potential impact of the circular economy approach in this research is directly generalised, the value increase would be around USD 3.40 billion annually. This significant value increase highlights the untapped potential of remanufacturing end-of-life engines in the maritime industry. By extending the lifespan of these engines, companies can not only save on costs, but can also contribute to a more sustainable and circular economy. With the aforementioned potential annual impact, it is clear that embracing circular economy principles has the potential to revolutionise the industry and create a more environmentally friendly future.
On the other hand, another approach to estimating the impact might be a time-independent, fleet-based analysis. The latest data indicate that there are currently 105,395 merchant vessels operating in the world, and European nations own 18,703 of those vessels [26]. The average size of the total fleet is 14,581 GT, which is nearly double the size of our case study vessel H. As explained earlier, deliberately choosing a smaller vessel than the world average ensures that authors do not overestimate the impact of the circular economy. In this sense, Equation (5) is created to estimate the potential impact of this case study.
where
N is the number of vessels in the impact group,
is the salvageable vessels ratio among the impact groups,
is the ratio of the salvageable engine per vessel in the impact group.
Table 4 below shows some important long-term impacts in three scenarios where circular practices reach 1% of the world fleet, the entire European fleet, and one-third of the total fleet. In these estimates, and is assumed to be 95% and 67%, respectively. That means 95% of the fleet is assumed to be recycled at some point in their lifespans. Some vessels can be lost, sunk, or unsalvageable due to other reasons. The authors also assume that, from every three engines that make it to a ship recycling yard, only two of them are remanufacturable. As shown in Table 4 below, the European fleet single-handedly has a USD 14.5 billion end-of-life value increase potential, while one-third of the world fleet nearly doubles this amount.
Table 4.
Long-term impact estimates.
6. Discussion
The presented database solution offers a myriad of benefits for the maritime industry. It will be the first big step to building the digital infrastructure to enhance circularity in the maritime domain. By implementing this database system, the maritime industry can overcome the challenges of disjointed information and achieve more efficient and effective management of material information, supporting the transition towards a circular economy.
Increased circularity can effectively lower cost pressures in supply chains by reducing the reliance on virgin raw material extraction and promoting the repurposing, reuse, and remanufacturing of materials. These pressures are mostly caused by the geographical concentration of mining and manufacturing activities, which makes the supply chain vulnerable to disruptions or shocks caused by different supply-side restrictions [59]. Once enabled, advanced circular economy principles can significantly reduce the need for virgin raw material extraction, which leads to both financial and environmental benefits.
On the other hand, the MMP concept brings numerous advantages, as the digitalisation of product information offers an unparalleled avenue for improvement. Since the MMP will enable multiple stakeholders to interact with product information on different levels at different stages of product life, the concept will work as a multi-tiered system. It will provide significant traceability features for the valuable onboard equipment. Currently, there is no way of tracking the end-of-life equipment, especially on old ships sent to scrapyards in the decommissioning stage. This results in a lack of core component recovery and prevents OEMs or third-party remanufacturers from applying circular solutions. Knowing which vessel has which engines onboard, along with their model year, specs, etc., can substantially improve the situation in the industry.
The database solution can assist the ship recycling facilities in revamping their business models by increasing their value-added proportion in the maritime industry. By positioning ship recyclers as a supplier of valuable core components rather than mere scrappers might further provide new cash flow through core collection and collaboration with OEMs, as presented in the case study. Furthermore, ship owners and recycling companies can benefit from more accurate end-of-life vessel value estimation with a proper equipment tracking system. Current practice in the industry mainly depends on assumptions using the vessels’ lightweight (total weight of the hull and onboard machinery). Naturally, the values of scrap steel, aluminium, and other materials are some of the essential parameters in current practice. The main drawback here is that the current approach considers potentially high-value items onboard no different than scrap steel in weight. As a future study, the database can be integrated with a valuation module for on-board materials that can used during surveys, supported with machine learning. This will help estimate the value of goods before the asset reaches the end-of-life and create new end-of-life solutions.
For example, several propulsion and auxiliary engines can be on board; at least some of them might be utilised for remanufacturing, or some of the core parts might be recovered and reused if processed properly, generating much more value than selling them as scrap metals. This will also facilitate further collaboration between owner and OEMS in terms of service plans, potential trade-in (or take-back) of old equipment, and discounts or incentives on new/remanufactured/reconditioned equipment.
The database solution also provides sufficient transparency among the key stakeholders. Ship owners and operators can give permission to specific repair shipyards or ship recycling facilities to see their assets and update the information when needed. And, when the information is updated, the owners will be notified so that every change will be double-checked. This is important because cargo vessels have a longer lifespan, usually over 25 years. During the life cycle, many factors, including onboard equipment, international rules, and regulations can change, the vessel can be retrofitted, and even its original design can be adjusted, and the ship can be revamped accordingly. For instance, current IHM requirements forced on existing and new vessels are a recent example of the fast-paced character of the maritime industry. In this complex, dynamic industry, advancing the circular economy in the maritime domain is nearly impossible without adequate transparency between the stakeholders. Hence, the same OEMs perform better in circularity in other transportation industries than in the maritime industry [16].
Moreover, this study revealed that maritime OEMs have capabilities and an appetite for circular practices. The database solution can provide them insight regarding their products in circulation, as it will disclose the estimated end-of-life date and recycling facility that will carry out the decommissioning. All these improvements can help OEMs assess their reverse supply chain potential, identify their potential focus groups, target products, estimated logistics expenses, and so on, to establish an effective core collection mechanism. It can further lead to market surveillance mechanisms to offer ship owners some specified discount on new equipment, called take-back or trade-in strategies.
When considering a broader framework, CE proves to be an enabler in achieving the Sustainable Development Goals (SDGs). CE serves as a bridging mechanism that integrates the aspirational nature of the SDGs with the operational realities of business and industry [27]. CE strategies can contribute to all SDGs but show a more substantial impact on SDGs 8 (Decent Work and Economic Growth), 12 (Responsible Consumption and Production), and 13 (Climate Action) [60]. Since the maritime industry plays a vital role in global commerce and is inherently interconnected with several aspects of sustainable development, integrating CE practices can effectively advance achieving these goals. By digitalising information related to ship components, from their life cycles to their recyclability, the maritime industry can optimise resource use, minimise waste, and thus significantly contribute to the sustainability agenda. In addition, the database will also establish a path to store and assess the hazardous materials on board ships, which will minimise the impact on the environment during the end-of-life stage, enabling mitigation strategies before the vessel arrives at the recycling facility. Moreover, CE’s digitalisation in the maritime domain can generate a chain reaction, driving policy changes and encouraging sustainable practices across sectors and regions. This digitised, transparent, and collaborative approach could pave the way for a more efficient pursuit of the SDGs while enhancing the maritime industry’s resilience and economic performance.
Lastly, the age profile of the existing merchant fleet highlights the urgent need for a circular economy-bridging strategy. With an average age of 22 years and 54.2% of the total fleet exceeding 15 years [26], there is a growing concern that these ageing assets will be dramatically underutilised, ultimately heading straight to scrapyards as mere scrap metal. Given that recent studies have shown up to 50% cost savings when opting for remanufactured engines over brand-new alternatives [14], the potential loss would be huge in all sustainability dimensions. The industry risks missing enormous opportunities for value recovery and sustainability without a strategy to incorporate these older assets into the circular economy. The timely implementation of circular economy practices, facilitated by the proposed database, can help transition these ageing vessels and components from liabilities into sustainable, value-generating assets.
7. Conclusions
Maritime circularity has gained significant attention due to the potential refit of the current fleet and end-of-life challenges created by the decarbonisation or net-zero targets of the maritime industry. As a transformative economic framework, the circular economy can address these challenges through reuse, remanufacture, and recycling practices. However, the lack of effective reverse supply chain and take-back plans, low knowledge of circular economy concepts and standardisation, and a serious lack of a digital framework for data availability in the industry present the maritime sector with a number of complex challenges. The absence of such infrastructure hinders access to vital information in the life cycle of a vessel and the implementation of circularity practices.
In order to address this challenge, this study has proposed a novel database solution for maritime stakeholders. The proposed database solution promises to revolutionise circularity in the maritime industry. Not only does it offer better material and asset management, but it also fosters transparency and enables more accurate value assessments of end-of-life ships. One key factor affecting such an application’s success is industry adoption. Therefore, the active involvement of maritime stakeholders was ensured in this study to assess the viability of the tool through a demonstration workshop.
Implementing circular economy principles in the maritime sector has the potential to decrease engine expenses and material usage substantially. Specifically, engine blocks and crankshafts could see a reduction of cost by up to 30%, while turbochargers could experience a remarkable decrease of 98%. Shifting from a linear to a circular economy can help reduce environmental and social effects, promote sustainable development, and generate fresh economic prospects. The case study vessel illustrates that by remanufacturing all engines on board, a significantly higher financial value of 83% can be achieved, totalling USD 3.1 million instead of USD 1.7 million at the end-of-life stage. When average annual ship recycling volume is considered, this extrapolates to a massive increase of USD 3.4 billion annually. This emphasises the potential for the circularity of end-of-life assets in the maritime industry to increase in value, thereby contributing to the sector’s overall sustainability. The urgency of implementing such a system is heightened by the ageing profile of the existing fleet, which otherwise faces the risk of underutilisation and relegation to scrapyards. Given the economic, environmental, and social advantages of remanufacturing and reusing older assets, the database could be a pivotal bridging strategy, transforming these ageing fleets from liabilities to sustainable, value-generating assets. The multi-stakeholder, multi-layer nature of this digital solution facilitates a holistic approach to resource management, directly influencing the sustainability, resilience, and profitability of maritime operations.
This novel study will enable future digital or material passport efforts in the maritime domain which will support reaching the Sustainable Development Goals (especially 8, 12, and 13). MMP can be utilised by various stakeholders as a leveraging concept creating benefits for each stakeholder as mentioned in Section 6. Moreover, it creates a crucial linkage between circular economy strategies and the broader objective of sustainable development. The case for advanced circularity in the maritime industry is a proposition for ecological responsibility and a blueprint for economic rejuvenation and long-term resilience. This positions the maritime industry not just as a beneficiary of digital and circular transformations but also as an essential player in the global quest for sustainable development.
As a future study, this database should further be implemented and tested in additional case studies in collaboration with stakeholders such as NGOs, shipyards, universities, ship owners, recycling facilities, OEMs, and so on. Moreover, the capabilities of the database can be enhanced through real-time condition monitoring as well as a valuation module supported by machine learning (which can be applied through IHM surveys and updates). The MMP can be further developed to the fundamental level, i.e., raw material content of assets, to increase the circularity.
Author Contributions
Conceptualization, D.O., S.A.G. and R.E.K.; Investigation, D.O., S.A.G. and O.T.; Formal analysis D.O.; methodology, D.O. and S.A.G.; writing—original draft preparation, D.O.; writing—review and editing, D.O., S.A.G. and O.T.; Supervision, R.E.K. and O.T.; funding acquisition, S.A.G. All authors have read and agreed to the published version of the manuscript.
Funding
This work was supported under the UKRI-funded project entitled “Circular Economy Network+ in Transportation Systems (CENTS)” (EP/S036237/1).
Institutional Review Board Statement
Not applicable.
Informed Consent Statement
Not applicable.
Data Availability Statement
The data presented in this study are available on request from the corresponding author.
Acknowledgments
The authors would like to thank the EPSRC and CENTS Network for their support.
Conflicts of Interest
The authors declare no conflicts of interest. The funders had no role in the design of the study; in the collection, analyses, or interpretation of data; in the writing of the manuscript; or in the decision to publish the results.
Appendix A
Query 1:
SELECT OEMs. [OEM Name], [Component Specs].[Model Name], Components.[Component Type], Components.[Serial Number], Components.[Acquired Date], Components.Condition, Components.[Approx EoL Value], Vessels.[IMO Number], Vessels.[Vessel Name], Owners.Company, Vessels.[Recycled Vessel], Components.[Recycled Component]
FROM Owners INNER JOIN (Vessels INNER JOIN (OEMs INNER JOIN ([Component Specs] INNER JOIN Components ON [Component Specs].[Model ID] = Components.[Equipment Model ID]) ON OEMs.[OEM ID] = [Component Specs].[OEM ID]) ON Vessels.[Vessel ID] = Components.[Ship ID]) ON Owners.[Owner ID] = Vessels.[Owner ID]
WHERE (((Owners.Company) = “Ship Owner C”));
Query 2:
SELECT Owners.Company, Vessels.[Vessel Name], Vessels.[IMO Number], Vessels.GT, Vessels.DWT, Vessels.[Built Date], [Building Shipyard].[Shipyard Name], [Repairing Shipyard].[Shipyard Name], Recyclers.[Company Name], Vessels.[Estimated EoL Date], Vessels.Notes
FROM Owners INNER JOIN (Recyclers INNER JOIN (Shipyards AS [Repairing Shipyard] INNER JOIN (Shipyards AS [Building Shipyard] INNER JOIN Vessels ON [Building Shipyard].[Shipyard ID] = Vessels.[Building Shipyard ID]) ON [Repairing Shipyard].[Shipyard ID] = Vessels.[Repairing Shipyard ID]) ON Recyclers.[Recycling Facility ID] = Vessels.[Recycler ID]) ON Owners.[Owner ID] = Vessels.[Owner ID]
WHERE (((Owners.Company) = “Ship Owner C”));
Query 3:
SELECT Vessels.[Vessel Name], Vessels.[IMO Number], [Building Shipyards].[Shipyard Name], [Repairing Shipyards].[Shipyard Name], Components.[Component Type], Components.[Serial Number], Components.[Acquired Date], Components.Condition, Components.[Approx EoL Value], OEMs.[OEM Name], [Component Specs].[Model Name], [Component Specs].[Max Height (m)], [Component Specs].[Max Width (m)], [Component Specs].[Max Length (m)], [Component Specs].[Dry Weight (kg)]
FROM Owners INNER JOIN (Shipyards AS [Building Shipyards] INNER JOIN (Shipyards AS [Repairing Shipyards] INNER JOIN (OEMs INNER JOIN ([Component Specs] INNER JOIN (Vessels INNER JOIN Components ON Vessels.[Vessel ID] = Components.[Ship ID]) ON [Component Specs].[Model ID] = Components.[Equipment Model ID]) ON OEMs.[OEM ID] = [Component Specs].[OEM ID]) ON [Repairing Shipyards].[Shipyard ID] = Vessels.[Repairing Shipyard ID]) ON [Building Shipyards].[Shipyard ID] = Vessels.[Building Shipyard ID]) ON Owners.[Owner ID] = Vessels.[Owner ID]
WHERE (((Owners.Company) = “Ship Owner C”))
ORDER BY Vessels.[Vessel Name], Components.[Component Type];
Query 4:
SELECT [Building Shipyards].[Shipyard Name], Vessels.[Vessel Type], Vessels.[Vessel Name], Vessels.[IMO Number], Vessels.GT, Vessels.DWT, Components.[Component Type], OEMs.[OEM Name], [Component Specs].[Model Name], Components.[Serial Number]
FROM OEMs INNER JOIN ([Component Specs] INNER JOIN (Shipyards AS [Building Shipyards] INNER JOIN (Vessels INNER JOIN Components ON Vessels.[Vessel ID] = Components.[Ship ID]) ON [Building Shipyards].[Shipyard ID] = Vessels.[Building Shipyard ID]) ON [Component Specs].[Model ID] = Components.[Equipment Model ID]) ON OEMs.[OEM ID] = [Component Specs].[OEM ID]
WHERE ((([Building Shipyards].[Shipyard Name]) = “Shipyard A”))
ORDER BY Vessels.[Vessel Name], Components.[Component Type];
Query 5:
SELECT [Repairing Shipyard].[Shipyard Name], Vessels.[Vessel Name], Vessels.[Vessel Type], Vessels.DWT, Vessels.GT, Owners.Company, Owners.[Contact Name], Owners.[Mobile Phone], Owners.[E-mail address], [Building Shipyard].[Shipyard Name], [Building Shipyard].[Contact Name], [Building Shipyard].[E-mail address], [Building Shipyard].[Mobile Phone]
FROM Shipyards AS [Building Shipyard] INNER JOIN (Shipyards AS [Repairing Shipyard] INNER JOIN (Owners INNER JOIN Vessels ON Owners.[Owner ID] = Vessels.[Owner ID]) ON [Repairing Shipyard].[Shipyard ID] = Vessels.[Repairing Shipyard ID]) ON [Building Shipyard].[Shipyard ID] = Vessels.[Building Shipyard ID]
WHERE ((([Repairing Shipyard].[Shipyard Name]) = “Shipyard C”))
ORDER BY Vessels.[Vessel Name];
Query 6:
SELECT [Repairing Shipyard].[Shipyard Name], Vessels.[Vessel Name], Components.[Component Type], OEMs.[OEM Name], [Component Specs].[Model Name], [Component Specs].[Max Height (m)], [Component Specs].[Max Width (m)], [Component Specs].[Max Length (m)], [Component Specs].[Dry Weight (kg)], Components.[Serial Number], Components.[Acquired Date], Components.Condition, Components.[Approx EoL Value], Components.[Recycled Component], Components.Notes
FROM OEMs INNER JOIN ([Component Specs] INNER JOIN ((Shipyards AS [Repairing Shipyard] INNER JOIN Vessels ON [Repairing Shipyard].[Shipyard ID] = Vessels.[Repairing Shipyard ID]) INNER JOIN Components ON Vessels.[Vessel ID] = Components.[Ship ID]) ON [Component Specs].[Model ID] = Components.[Equipment Model ID]) ON OEMs.[OEM ID] = [Component Specs].[OEM ID]
WHERE ((([Repairing Shipyard].[Shipyard Name]) = “Shipyard C”))
ORDER BY Vessels.[Vessel Name], Components.[Component Type];
Query 7:
SELECT Recyclers.[Company Name], Vessels.[Vessel Name], Vessels.[IMO Number], Vessels.[Vessel Type], Vessels.GT, Vessels.DWT, Vessels.[Built Date], Owners.Company, Owners.[Contact Name], Owners.[E-mail address], Owners.[Mobile Phone], Vessels.Notes
FROM Owners INNER JOIN (Recyclers INNER JOIN Vessels ON Recyclers.[Recycling Facility ID] = Vessels.[Recycler ID]) ON Owners.[Owner ID] = Vessels.[Owner ID]
WHERE (((Recyclers.[Company Name]) = “Recycling Facility B”))
ORDER BY Vessels.[Vessel Name];
Query 8:
SELECT Recyclers.[Company Name], Vessels.[Vessel Name], Components.[Component Type], OEMs.[OEM Name], [Component Specs].[Model Name], [Component Specs].[Max Height (m)], [Component Specs].[Max Width (m)], [Component Specs].[Max Length (m)], [Component Specs].[Dry Weight (kg)], Components.[Serial Number], Components.[Acquired Date], Components.Condition, [Component Specs].[Engine Power (kW)], [Component Specs].[Engine Displacement (L)], [Component Specs].[Engine Speed (rpm)], [Component Specs].[Engine Emission Level], [Component Specs].Notes
FROM OEMs INNER JOIN ([Component Specs] INNER JOIN ((Recyclers INNER JOIN Vessels ON Recyclers.[Recycling Facility ID] = Vessels.[Recycler ID]) INNER JOIN Components ON Vessels.[Vessel ID] = Components.[Ship ID]) ON [Component Specs].[Model ID] = Components.[Equipment Model ID]) ON OEMs.[OEM ID] = [Component Specs].[OEM ID]
WHERE (((Recyclers.[Company Name]) = “Recycling Facility B”) AND ((Components.[Component Type])<>“PUMP”))
ORDER BY Vessels.[Vessel Name];
Query 9:
SELECT Recyclers.[Company Name], Vessels.[Vessel Name], Components.[Component Type], OEMs.[OEM Name], [Component Specs].[Model Name], [Component Specs].[Max Height (m)], [Component Specs].[Max Width (m)], [Component Specs].[Max Length (m)], [Component Specs].[Dry Weight (kg)], Components.[Serial Number], Components.[Acquired Date], Components.Condition, [Component Specs].[Pump Type], [Component Specs].[Pump Capacity (m3/h)], [Component Specs].[Pump Installed Power (kW)], [Component Specs].Notes
FROM OEMs INNER JOIN ([Component Specs] INNER JOIN ((Recyclers INNER JOIN Vessels ON Recyclers.[Recycling Facility ID] = Vessels.[Recycler ID]) INNER JOIN Components ON Vessels.[Vessel ID] = Components.[Ship ID]) ON [Component Specs].[Model ID] = Components.[Equipment Model ID]) ON OEMs.[OEM ID] = [Component Specs].[OEM ID]
WHERE (((Recyclers.[Company Name]) = “ Recycling Facility B “) AND ((Components.[Component Type]) = “PUMP”))
ORDER BY Vessels.[Vessel Name];
Query 10:
SELECT OEMs.[OEM Name], [Component Specs].[Model Name], Components.[Serial Number], Vessels.[Vessel Name], Vessels.[Vessel Type], Components.[Component Type], Vessels.[Estimated EoL Date], Owners.Company, Owners.[Contact Name], Owners.[E-mail address], Owners.[Mobile Phone], Recyclers.[Company Name], Recyclers.[Contact Name], Recyclers.[E-mail address], Recyclers.[Mobile Phone]
FROM OEMs INNER JOIN ([Component Specs] INNER JOIN (Recyclers INNER JOIN (Owners INNER JOIN (Vessels INNER JOIN Components ON Vessels.[Vessel ID] = Components.[Ship ID]) ON Owners.[Owner ID] = Vessels.[Owner ID]) ON Recyclers.[Recycling Facility ID] = Vessels.[Recycler ID]) ON [Component Specs].[Model ID] = Components.[Equipment Model ID]) ON OEMs.[OEM ID] = [Component Specs].[OEM ID]
WHERE (((OEMs.[OEM Name]) = “Caterpillar Inc”))
ORDER BY [Component Specs].[Model Name], Vessels.[Vessel Name];
Query 11:
SELECT Recyclers.[Company Name], Vessels.[Vessel Name], Components.[Component Type], OEMs.[OEM Name], [Component Specs].[Model Name], [Component Specs].[Dry Weight (kg)], [Component Material Breakdown].[Ferrous metals (kg)], [Component Material Breakdown].[Nonferrous metals (kg)], [Component Material Breakdown].[Alloys (kg)], [Component Material Breakdown].[Hazardous Materials (kg)], [Component Material Breakdown].[Others (kg)]
FROM ((OEMs INNER JOIN [Component Specs] ON OEMs.[OEM ID] = [Component Specs].[OEM ID]) LEFT JOIN [Component Material Breakdown] ON [Component Specs].[Model ID] = [Component Material Breakdown].[Equipment Model ID]) INNER JOIN ((Recyclers INNER JOIN Vessels ON Recyclers.[Recycling Facility ID] = Vessels.[Recycler ID]) INNER JOIN Components ON Vessels.[Vessel ID] = Components.[Ship ID]) ON [Component Specs].[Model ID] = Components.[Equipment Model ID]
WHERE (((Recyclers.[Company Name]) = “Recycling Facility B”) AND ((Components.[Component Type])<>“PUMP”))
ORDER BY Vessels.[Vessel Name];
Appendix B
Table A1.
Expert details in the validation workshop.
Table A1.
Expert details in the validation workshop.
| Maritime Industry Experience | Background | Current Stakeholder Group | |
|---|---|---|---|
| Expert 1 | 16 years | Naval architect, senior design engineer. Experienced in cargo vessel design. Has worked at shipyards, and ship design offices during their career. | Shipyard (new building) |
| Expert 2 | 9 years | Naval architect, has worked at shipyards as structural engineer and quality assurance engineer. | Shipyard (new building and repair) |
| Expert 3 | 17 years | Senior mechanical engineer specialised in outfitting and production. Has intensive shipyard experience. | Shipyard (new building and repair) |
| Expert 4 | 23 years | Captain by training. Currently working for a ship owner/operator company as their fleet manager. First 10 years of their experience is sailing onboard. | Ship Owner/Operator |
| Expert 5 | 32 years | Ship owner. Has a fleet of 7 vessels including general cargo and dry bulk carriers. | Ship Owner/Operator |
| Expert 6 | 14 years | Marine operations manager. Marine engineer by training. Currently oversees day-to-day operations of a shipping company with 22 vessels. | Ship Owner/Operator |
| Expert 7 | 9 years | Mechanical engineer by training, has significant experience in two different maritime OEMs. First, the manufacturer of fluid separation and treatment products. Second, an engine manufacturer. | OEM |
| Expert 8 | 13 years | Naval architect by training, has worked for one of the biggest engine manufacturers in the industry. An expert on marine engines. | OEM |
| Expert 9 | 21 years | Naval architect by training, has worked at an OEMs engine manufacturing plant for years. Currently works as a product manager and is responsible for certain types of engines in EAME region. | OEM |
| Expert 10 | 12 years | Mechanical engineering technician by training, currently works as a shipbreaking manager. | Recycling Facility |
| Expert 11 | 7 years | Mechanical engineer by training. Has worked as a health and safety engineer in shipyards and ship recycling facilities. | Recycling Facility |
| Expert 12 | 13 years | Marine engineer by training. Has been working as a shipbreaking engineer for 8 years. Had sailed during the first five years of their career. | Recycling Facility |
References
- UNCTAD. Review of Maritime Transport 2022; United Nations Conference on Trade and Development: Geneva, Switzerland, 2022; Available online: https://unctad.org/system/files/official-document/rmt2022_en.pdf (accessed on 6 April 2023).
- Lindstad, E.; Polic, D.; Rialland, A.; Sandaas, I.; Stokke, T. Reaching IMO 2050 GHG Targets Exclusively Through Energy Efficiency Measures. J. Ship Prod. Des. 2023, 39, 194–204. [Google Scholar] [CrossRef]
- Li, Q.; Han, Y.; Liu, X.; Ansari, U.; Cheng, Y.; Yan, C. Hydrate as a by-product in CO2 leakage during the long-term sub-seabed sequestration and its role in preventing further leakage. Environ. Sci. Pollut. Res. 2022, 29, 77737–77754. [Google Scholar] [CrossRef] [PubMed]
- Gössling, S.; Meyer-Habighorst, C.; Humpe, A. A global review of marine air pollution policies, their scope and effectiveness. Ocean Coast. Manag. 2021, 212, 105824. [Google Scholar] [CrossRef]
- OECD. Ocean Shipping and Shipbuilding. Available online: https://www.oecd.org/ocean/topics/ocean-shipping/ (accessed on 7 October 2023).
- Lehmann, C.; Cruz-Jesus, F.; Oliveira, T.; Damásio, B. Leveraging the circular economy: Investment and innovation as drivers. J. Clean. Prod. 2022, 360, 132146. [Google Scholar] [CrossRef]
- Geissdoerfer, M.; Pieroni, M.P.P.; Pigosso, D.C.A.; Soufani, K. Circular business models: A review. J. Clean. Prod. 2020, 277, 123741. [Google Scholar] [CrossRef]
- Pearce, D.W.; Turner, R.K. Economics of Natural Resources and the Environment; JHU Press: Baltimore, MD, USA, 1990. [Google Scholar]
- Michelini, G.; Moraes, R.N.; Cunha, R.N.; Costa, J.M.H.; Ometto, A.R. From Linear to Circular Economy: PSS Conducting the Transition. Procedia CIRP 2017, 64, 2–6. [Google Scholar] [CrossRef]
- Mitchell, P.; James, K. Economic Growth Potential of More Circular Economies; Waste and Resources Action Programme (WRAP): Banbury, UK, 2015. [Google Scholar]
- Preston, F. A Global Redesign? Shaping the Circular Economy; The Royal Institute of International Affairs: London, UK, 2012. Available online: https://www.proquest.com/reports/global-redesign-shaping-circular-economy/docview/1820711483/se-2 (accessed on 6 April 2023).
- MacArthur, E. Towards the circular economy. J. Ind. Ecol. 2013, 2, 23–44. [Google Scholar]
- Neves, S.A.; Marques, A.C. Drivers and barriers in the transition from a linear economy to a circular economy. J. Clean. Prod. 2022, 341, 130865. [Google Scholar] [CrossRef]
- Okumus, D.; Gunbeyaz, S.A.; Kurt, R.E.; Turan, O. Towards a circular maritime industry: Identifying strategy and technology solutions. J. Clean. Prod. 2023, 382, 134935. [Google Scholar] [CrossRef]
- Koehler, D.C.F. APRA Europe News—August 2021. Unpublished work. 2021. [Google Scholar]
- Okumus, D.; Gunbeyaz, S.A.; Kurt, R.E.; Turan, O. Circular economy approach in the maritime industry: Barriers and the path to sustainability. Transp. Res. Procedia 2023, 72, 2157–2164. [Google Scholar] [CrossRef]
- Kalmykova, Y.; Sadagopan, M.; Rosado, L. Circular economy—From review of theories and practices to development of implementation tools. Resour. Conserv. Recycl. 2018, 135, 190–201. [Google Scholar] [CrossRef]
- Mishra, R.; Singh, R.K.; Govindan, K. Barriers to the adoption of circular economy practices in Micro, Small and Medium Enterprises: Instrument development, measurement and validation. J. Clean. Prod. 2022, 351, 131389. [Google Scholar] [CrossRef]
- Bjerkan, K.Y.; Seter, H. Reviewing tools and technologies for sustainable ports: Does research enable decision making in ports? Transp. Res. Part D Transp. Environ. 2019, 72, 243–260. [Google Scholar] [CrossRef]
- UNCTAD. Merchant Fleet. Available online: https://hbs.unctad.org/merchant-fleet/ (accessed on 20 February 2023).
- Okumus, D.; Gunbeyaz, S.A.; Karamperidis, S. Potential Impact of the Circular Economy Concept in Maritime Transport; University of Warwick: Coventry, UK, 2023. [Google Scholar]
- Milios, L.; Beqiri, B.; Whalen, K.A.; Jelonek, S.H. Sailing towards a circular economy: Conditions for increased reuse and remanufacturing in the Scandinavian maritime sector. J. Clean. Prod. 2019, 225, 227–235. [Google Scholar] [CrossRef]
- Wahab, D.A.; Blanco-Davis, E.; Ariffin, A.K.; Wang, J. A review on the applicability of remanufacturing in extending the life cycle of marine or offshore components and structures. Ocean Eng. 2018, 169, 125–133. [Google Scholar] [CrossRef]
- Jensen, J.P.; Remmen, A. Enabling Circular Economy Through Product Stewardship. Procedia Manuf. 2017, 8, 377–384. [Google Scholar] [CrossRef]
- Silva, D.; Garrido, J.; Lekube, B.; Arrillaga, A. On-board and port 3D printing to promote a maritime plastic circular economy. J. Clean. Prod. 2023, 407, 137151. [Google Scholar] [CrossRef]
- UNCTAD. Review of Maritime Transport 2023; United Nations Conference on Trade and Development: Geneva, Switzerland, 2023; Available online: https://unctad.org/system/files/official-document/rmt2023_en.pdf (accessed on 6 April 2023).
- Geissdoerfer, M.; Savaget, P.; Bocken, N.M.P.; Hultink, E.J. The Circular Economy—A new sustainability paradigm? J. Clean. Prod. 2017, 143, 757–768. [Google Scholar] [CrossRef]
- Boukhatmi, Ä.; Nyffenegger, R.; Grösser, S.N. Designing a digital platform to foster data-enhanced circular practices in the European solar industry. J. Clean. Prod. 2023, 418, 137992. [Google Scholar] [CrossRef]
- Mulhall, D.; Ayed, A.-C.; Schroeder, J.; Hansen, K.; Wautelet, T. The product circularity data sheet—A standardized digital fingerprint for circular economy data about products. Energies 2022, 15, 3397. [Google Scholar] [CrossRef]
- Hoosain, M.S.; Paul, B.S.; Ramakrishna, S. The impact of 4IR digital technologies and circular thinking on the United Nations sustainable development goals. Sustainability 2020, 12, 10143. [Google Scholar] [CrossRef]
- Serna-Guerrero, R.; Ikonen, S.; Kallela, O.; Hakanen, E. Overcoming data gaps for an efficient circular economy: A case study on the battery materials ecosystem. J. Clean. Prod. 2022, 374, 133984. [Google Scholar] [CrossRef]
- Walden, J.; Steinbrecher, A.; Marinkovic, M. Digital product passports as enabler of the circular economy. Chem. Ing. Technol. 2021, 93, 1717–1727. [Google Scholar] [CrossRef]
- Luoma, P.; Toppinen, A.; Penttinen, E. The Role and Value of Data in Circular Business Models—A Systematic Literature Review. J. Bus. Models 2021, 9, 44–71. [Google Scholar] [CrossRef]
- Köhler, J.; Sönnichsen, S.D.; Beske-Jansen, P. Towards a collaboration framework for circular economy: The role of dynamic capabilities and open innovation. Bus. Strategy Environ. 2022, 31, 2700–2713. [Google Scholar] [CrossRef]
- Herrero-Luna, S.; Ferrer-Serrano, M.; Pilar Latorre-Martinez, M. Circular Economy and Innovation: A Systematic Literature Review. Cent. Eur. Bus. Rev. 2022, 11, 65–84. [Google Scholar] [CrossRef]
- Chesbrough, H.; Lettl, C.; Ritter, T. Value Creation and Value Capture in Open Innovation. J. Prod. Innov. Manag. 2018, 35, 930–938. [Google Scholar] [CrossRef]
- Chen, D.Q.; Preston, D.S.; Swink, M. How the Use of Big Data Analytics Affects Value Creation in Supply Chain Management. J. Manag. Inf. Syst. 2015, 32, 4–39. [Google Scholar] [CrossRef]
- Gao, S.; Hakanen, E.; Rajala, R. Digital Transformation: The Interplay of Explorative and Exploitative Capability Development. 2020. Available online: https://scholarspace.manoa.hawaii.edu/items/33a3aead-eeb6-43be-9621-fb7c351f9b12 (accessed on 6 April 2023).
- Kristoffersen, E.; Mikalef, P.; Blomsma, F.; Li, J. Towards a business analytics capability for the circular economy. Technol. Forecast. Soc. Chang. 2021, 171, 120957. [Google Scholar] [CrossRef]
- Rajala, R.; Hakanen, E.; Mattila, J.; Seppälä, T.; Westerlund, M. How Do Intelligent Goods Shape Closed-Loop Systems? Calif. Manag. Rev. 2018, 60, 20–44. [Google Scholar] [CrossRef]
- Gupta, S.; Chen, H.; Hazen, B.T.; Kaur, S.; Santibañez Gonzalez, E.D.R. Circular economy and big data analytics: A stakeholder perspective. Technol. Forecast. Soc. Chang. 2019, 144, 466–474. [Google Scholar] [CrossRef]
- Acerbi, F.; Taisch, M. A literature review on circular economy adoption in the manufacturing sector. J. Clean. Prod. 2020, 273, 123086. [Google Scholar] [CrossRef]
- Jäger-Roschko, M.; Petersen, M. Advancing the circular economy through information sharing: A systematic literature review. J. Clean. Prod. 2022, 369, 133210. [Google Scholar] [CrossRef]
- Ciulli, F.; Kolk, A.; Boe-Lillegraven, S. Circularity Brokers: Digital Platform Organizations and Waste Recovery in Food Supply Chains. J. Bus. Ethics 2020, 167, 299–331. [Google Scholar] [CrossRef]
- Konietzko, J.; Bocken, N.; Hultink, E.J. Online Platforms and the Circular Economy. In Innovation for Sustainability: Business Transformations Towards a Better World; Bocken, N., Ritala, P., Albareda, L., Verburg, R., Eds.; Springer International Publishing: Cham, Switzerland, 2019; pp. 435–450. [Google Scholar]
- Schaubroeck, S.; Dewil, R.; Allacker, K. Circularity and LCA-material pathways: The cascade potential and cascade database of an in-use building product. Proc. IOP Conf. Ser. Earth Environ. Sci. 2022, 1122, 012040. [Google Scholar] [CrossRef]
- Honic, M.; Kovacic, I.; Aschenbrenner, P.; Ragossnig, A. Material Passports for the end-of-life stage of buildings: Challenges and potentials. J. Clean. Prod. 2021, 319, 128702. [Google Scholar] [CrossRef]
- Çetin, S.; De Wolf, C.; Bocken, N. Circular Digital Built Environment: An Emerging Framework. Sustainability 2021, 13, 6348. [Google Scholar] [CrossRef]
- Göswein, V.; Carvalho, S.; Cerqueira, C.; Lorena, A. Circular material passports for buildings–Providing a robust methodology for promoting circular buildings. Proc. IOP Conf. Ser. Earth Environ. Sci. 2022, 1122, 012049. [Google Scholar] [CrossRef]
- Wilde, A.S.; Wanielik, F.; Rolinck, M.; Mennenga, M.; Abraham, T.; Cerdas, F.; Herrmann, C. Ontology-based approach to support life cycle engineering: Development of a data and knowledge structure. Procedia CIRP 2022, 105, 398–403. [Google Scholar] [CrossRef]
- Eppinger, E.; Jain, A.; Vimalnath, P.; Gurtoo, A.; Tietze, F.; Hernandez Chea, R. Sustainability transitions in manufacturing: The role of intellectual property. Curr. Opin. Environ. Sustain. 2021, 49, 118–126. [Google Scholar] [CrossRef]
- Zygiaris, S. Database Management Systems: A Business-Oriented Approach Using ORACLE, MySQL, and MS Access; Emerald Publishing Limited: Bingley, UK, 2018. [Google Scholar]
- GCF Global. Access 2013—Getting Started with Access. Available online: https://edu.gcfglobal.org/en/access2013/getting-started-with-access/1/ (accessed on 5 October 2023).
- IMO. The Hong Kong International Convention for the Safe and Environmentally Sound Recycling of Ships. Available online: https://www.imo.org/en/about/Conventions/pages/the-hong-kong-international-convention-for-the-safe-and-environmentally-sound-recycling-of-ships.aspx (accessed on 13 December 2023).
- DNV. IHM Part I Certification. Available online: https://www.dnv.com/maritime/insights/topics/ihm-ship-recycling/ihm-part-1-certification.html (accessed on 13 December 2023).
- ClassNK. Ship Recycling Convention (the Hong Kong Convention). Available online: https://www.classnk.or.jp/hp/en/activities/statutory/shiprecycle/index.html (accessed on 14 December 2023).
- UNCTADstat. Data Centre, Maritime Transport. Available online: https://unctadstat.unctad.org (accessed on 15 December 2023).
- Mathew, E. Ship recycling, market imperfections and the relevance of a consortium of ship recycling nations in the Indian subcontinent. J. Int. Marit. Saf. Environ. Aff. Shipp. 2021, 5, 23–31. [Google Scholar] [CrossRef]
- Koppelaar, R.H.; Pamidi, S.; Hajósi, E.; Herreras, L.; Leroy, P.; Jung, H.-Y.; Concheso, A.; Daniel, R.; Francisco, F.B.; Parrado, C. A Digital Product Passport for Critical Raw Materials Reuse and Recycling. Sustainability 2023, 15, 1405. [Google Scholar] [CrossRef]
- Ortiz-de-Montellano, C.G.-S.; Samani, P.; van der Meer, Y. How can the circular economy support the advancement of the Sustainable Development Goals (SDGs)? A comprehensive analysis. Sustain. Prod. Consum. 2023, 40, 352–362. [Google Scholar] [CrossRef]
Disclaimer/Publisher’s Note: The statements, opinions and data contained in all publications are solely those of the individual author(s) and contributor(s) and not of MDPI and/or the editor(s). MDPI and/or the editor(s) disclaim responsibility for any injury to people or property resulting from any ideas, methods, instructions or products referred to in the content. |
© 2024 by the authors. Licensee MDPI, Basel, Switzerland. This article is an open access article distributed under the terms and conditions of the Creative Commons Attribution (CC BY) license (https://creativecommons.org/licenses/by/4.0/).