Article

Impact of Heterogeneous Environmental Regulations on Green Innovation Efficiency in China’s Industry

1
The Research Center of Energy Economy, School of Business Administration, Henan Polytechnic University, Jiaozuo 454003, China
2
College of Public Administration, Huazhong University of Science and Technology, Wuhan 430074, China
*
Author to whom correspondence should be addressed.
Sustainability 2024, 16(1), 415; https://doi.org/10.3390/su16010415
Submission received: 11 December 2023 / Revised: 29 December 2023 / Accepted: 31 December 2023 / Published: 3 January 2024
(This article belongs to the Section Environmental Sustainability and Applications)

Abstract

:
Innovation is the primary driving force for development, and green innovation efficiency (GIE) plays a key role in regional sustainable development. Moreover, environmental regulations (ERs) are also crucial for innovation and green transformation. Considering the heterogeneity of ERs, we assess the dynamic GIE in the industrial sectors of China. We detect their spatial clustering characteristics, and distinguish the impacts of ERs. Results suggest that there exist significant differences in GIE. Provinces such as Hainan, Guangdong and Zhejiang are ranked high, while Gansu, Inner Mongolia and Ningxia are ranked at the bottom, which shows some spatial dependence. The relationship between the administrative regulation and GIE demonstrates a U-shape, and has not reached a critical point, whereas the relationship between the market-based regulation and GIE possesses an inverted U-shape, which is highly significant. Furthermore, a positive linear relationship exists between the lagged public participation regulation and GIE. This paper also proposes that the economic development level and industrial structure are vital factors in accelerating industrial GIE. These conclusions provide scientific support for formulating regional transformation strategies.

1. Introduction

The United Nations Development Program firstly proposed “green development” in 2002, and the concept has been widely accepted as an indispensable way to realize environmental protection and economic development [1]. In addition, the report of the 20th Party Congress proposed to accelerate green development, promoting the formation of green low-carbon production and lifestyle. At present, the world is undergoing unseen changes, and innovation has become the first driving force to lead development. Notably, the 14th Five-Year Plan and other longer-term developments have put forward more urgent requirements for green innovation. However, most enterprises may lack incentives for innovation due to high cost, risk and strong externality.
In 2021, China’s total energy consumption was 5.240 billion tons of standard coal, and the total carbon dioxide emissions reached to 10.523 billion tons, which ranked the first in the world. About 70% of China’s total energy consumption is generated by the industrial sectors [2], which hinders social sustainable development with extensive increases in high investment, high energy consumption, and high emission. Thus, energy saving and emission mitigation is the top priority for the industry. The State Council released the “Action Plan for Carbon Peak by 2030” in October 2021, which highlighted that industrial sectors should focus on implementing green, low-carbon and sustainable science and technology innovation actions, accelerating the transformation and high-quality development and striving to take the lead in achieving a carbon peak. Therefore, the 14th Five-Year Plan period is not only a window period to address climate change and achieve the dual carbon goals, but it is also a critical phase for the industrial sectors to achieve green and low-carbon transformation.
Environmental regulation (ER), which is considered to be a powerful and sustainable tool for solving environmental problems, can facilitate the sustainable development of eco-innovation in the industrial sectors. Therefore, formulating appropriate ER is essential to balance the uneven development between the economy and the environment. Scholars have conducted numerous studies on ER and green innovation [3,4,5,6,7]; however, there is no consensus on the impact of ERs on green innovation. To maximize the policy effects of various regulations, we must thoroughly clarify their differentiated roles. In this paper, we divide ERs into three categories: administrative, market-based and public participation types [8,9,10,11].
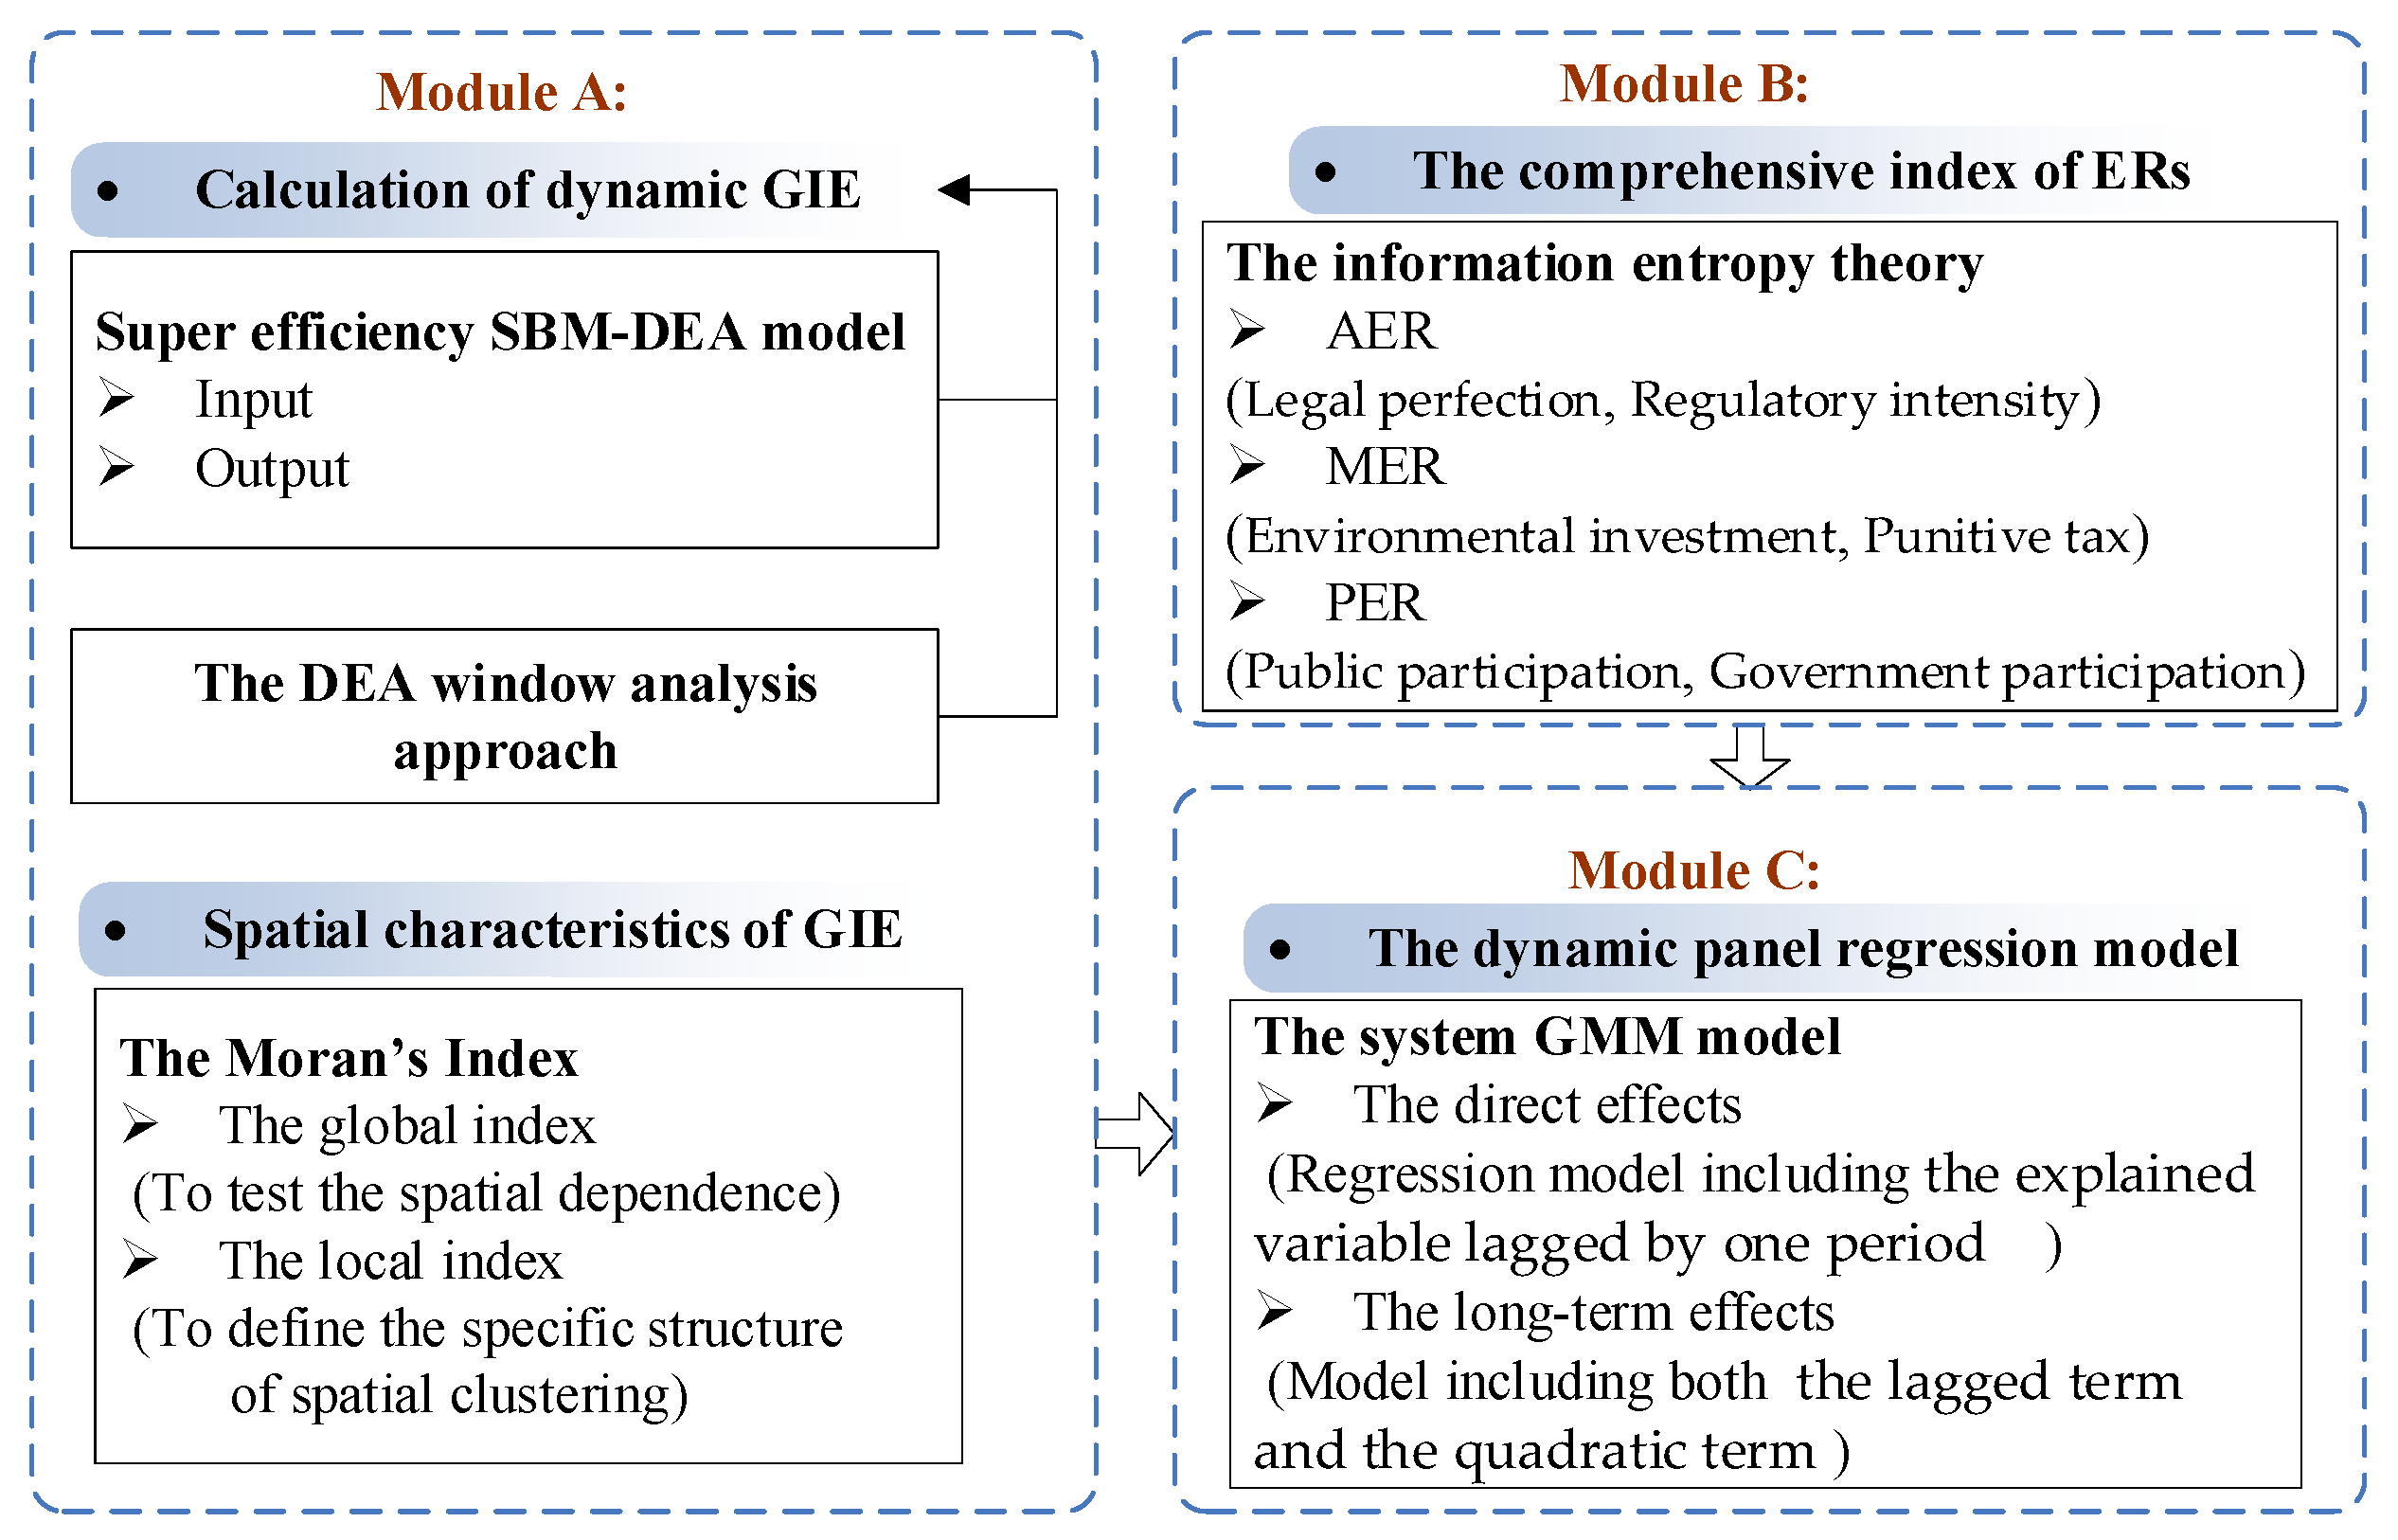
We mainly conducted this work in three parts. First, we combined the super-efficiency slacks-based model of data envelopment analysis (SBM-DEA) model with the window analysis method to calculate the industry’s dynamic green innovation efficiency (GIE) and detect its spatial characteristics. Second, we constructed a heterogeneous index system to quantify different environmental regulations. Third, we introduce the dynamic panel regression model, for instance, the system generalized method of moments (GMM) estimation, to investigate the direct and long-term effects of heterogeneous ERs on the industrial GIE. Figure 1 shows the research framework and the remaining part is organized as follows. Section 2 provides a literature review of related research on ERs and GIE. Section 3 illustrates the data source and models. Section 4 reports the empirical results, and some conclusions, and appropriate policy implications are given in Section 5.

2. Literature Review

China has implemented a series of regulations and policies to manage the negative externalities caused by industrial enterprises. In essence, these policies regulate industrial enterprises’ behaviors and inhibit the enthusiasm for green innovation. Many scholars have conducted studies on the impact of ERs on green innovation, and previous research can be grouped into three main viewpoints.
Firstly, the ERs can contribute to the increase in GIE. For instance, Xu et al. [12] calculated the GIE of 79 cities in the Yellow River Basin using the SBM-DEA method. They proposed that ER significantly influences GIE only when the intensity is in the range from 0.595 to 0.899. Cai et al. [13] explored the impact of direct ER on green technology innovation of heavily polluting industries in China by utilizing the Panel Poisson fixed effect model, finding that direct ER produces a substantial and significant incentive effect on promoting green technology innovation. In addition, Sun et al. [14] suggest that market-incentive ER and voluntary ER have a more considerable incentive effect than command-controlled ER during green innovation.
Secondly, many scholars postulate that ER hinders GIE. Peng et al. [15] report that controlling ER substantially influences the intention of green innovation more than incentivizing ER. Moreover, Testa et al. [16] reveal that ER intensifies the operating costs and weakens the profitability of corporations, thus hindering the implementation of green technology in the end. Similarly, Hu and Liu [17] suggest that ER can generate a regionally heterogeneous effect on the GIE and restrains green innovation in eastern China.
Thirdly, the effect of ER on GIE is uncertain. For example, Luo et al. [18] employed environmental investments to measure the intensity of command-and-control regulation (CER), using pollutant discharge fees to represent the market-based regulation (MER) and selecting the number of ecological proposals to express the severity of informal regulation (IER). They conclude that both CER and IER can make a positive difference in green innovation, whereas MER produces negative impacts. Moreover, Zhang et al. [10] suggest that a nonlinear inverted U-shape relationship exists between ER and GIE. In another paper, Zhang et al. [11] find that CER shows a U-shaped relationship with GIE, while ER negatively affects the green innovation process.
It should be noted that most of the existing studies ignored the spatial interaction effects, but ER can boost domestic innovation, and the practical impacts may cross national boundaries [19,20]. Its neighbors can influence a local region’s characteristics; therefore, it is vital to consider regional relevance and variation [21]. For example, Fan et al. [22] constructed a spatial measurement model to explore how ER influences regional GIE, illustrating that the GIE shows a significant positive autocorrelation and crucial spatial spillover effect. Shao et al. [23] also put forward that the ERs have a positive neighborhood spillover effect on local green innovation.
A comparison of related literature is shown in Table 1, and this paper mainly makes three contributions. Firstly, we calculate the dynamic GIE in industry and explore the spatial characteristics, a critical perspective often overlooked by relevant studies. Secondly, we build a multidimensional ER index to evaluate the intensity of heterogeneous ERs. Finally, we evaluate the direct and long-term effects of ERs.

3. Data Sources and Methods

3.1. Data Definitions

3.1.1. Green Innovation Efficiency

GIE refers to the ratio of outputs to inputs achieved by implementing green technology innovation, which considers both innovation and environmental efficiency [24]. An evaluation system from the input–output perspective may help enterprises mitigate input redundancy and enhance resource allocation efficiency, as shown in Table 2 [12,25].

3.1.2. Environmental Regulations

Administrative environmental regulation (AER) refers to mandatory policies implemented by the government. Some scholars choose newly implemented regulations to denote AER [26], and many studies also use annual environmental administrative penalty cases to assess it from the perspective of strength. Market-based environmental regulation (MER) implies using market tools to control pollution emissions. For example, the higher the sewage charge fee is, the stricter is the formal ER. Accordingly, pollutant discharge fees also are employed to present MER [11]. Additionally, we also take industrial enterprises’ autonomy into consideration, including environmental investment. Meanwhile, public-participation environmental regulation (PER) refers to the spontaneous participation of the public in environmental protection. In this regard, petition letters and complaint letters related to pollution and environmental issues are also used to measure PER [8,9]. It is worth noting that government participation is an essential form of PER. Therefore, the index system of ERs is shown in Table 3.

3.1.3. Description of Regression Variables

The factors affecting GIE include the core explaining variable of ERs and some control variables, namely economic development level (EDL), industrial structure (IS), foreign direct investment (FDI) and technology market activity (TMA).
There exists a close relationship between EDL and green technology innovation. On the one hand, sound economic foundations can provide conditions for sound infrastructure and scientific and technological research [27]. On the other hand, a high income level gives consumers extraordinary initiative, and people tend to choose green and environmentally friendly products within their purchasing power. Accordingly, the authorities will gradually increase the enforcement of environmental regulations. Here, the EDL is represented by regional GDP per capita [28]. IS is a microcosm of the economic development mode and has a direct impact on the regional ecology. A highly rationalized IS signifies that factor resources are shifting from low productivity, internal labor and capital-intensive industries to technology and knowledge-intensive enterprises. We utilize the percentage of the secondary industry-added value to the regional GDP to represent the IS [29]. FDI not only introduces advanced technology, experience and management models, and improves the innovation capabilities, but also forces local governments to step up efforts to increase supervision and eliminate inferior enterprises. In this paper, the amount of FDI converted to billion refers to the yearly exchange rate [30]. TMA embodies the enthusiasm for green innovation, expressing intangible innovation capabilities through the commercial value. Especially there is a positive effect between the market environment and technology transactions, and strengthening the transformation of market environment is beneficial for improving the GIE. In addition, we employ the regional technology market turnover to measure market activity [31].

3.2. Methods

3.2.1. The Dynamic Super-Efficiency SBM-DEA Model

The DEA model has been widely used to measure efficiency in economic and environmental fields. Typically, the traditional DEA model assumes that the outputs are desirable. In practical activities, undesirable outputs do exist and significantly impact Decision Making Units (DMU) efficiency [32]. Therefore, Tone [33] proposed the super-efficiency SBM-DEA model to solve traditional models’ defects. Following Fried et al. [34], Tone [33,35] and Li et al. [36], we use the super-efficiency SBM-DEA model with undesirable outputs to make the results more realistic. Specifically, the model can be written as in Equation (1):
ρ = m i n 1 + 1 m i = 1 m s i / x i k 1 1 q 1 + q 2 r = 1 q 1 s r g / y r k g + t = 1 q 2 s t b / y t k b s . t .         j 1 , j k n x i j λ j s i x i k                         j 1 , j k n y r j g λ j + s r g y r k g                       j 1 , j k n y t j b λ j s t b y t k b 1 1 q 1 + q 2 r = 1 q 1 s r g / y r k g + t = 1 q 2 s t b / y t k b > 0                     λ j 0 , s i 0 , s r g 0 , s t b 0 , j = 1 , 0   n λ j = 1 i = 1 m ; j = 1 n j k ; r = 1 q 1 ; t = 1 q 2
where ρ represents the GIE; λ j stands for weight vector; m , q 1 and q 2 denote the numbers of input, desirable output and undesirable output, respectively; k is the DMU under estimation; s i , s r g and s t b are slack variables; x i j indicates the i th input of the j th DMU; y r j g is the r th desirable output; and y t j b represents the t th undesirable output; j = 1 , 0 n λ j = 1 is utilized for modeling the variable returns to scale (VRS) assumption.
The DEA window analysis approach can measure the dynamic effect of time-varying data [37]. Therefore, we calculate the industrial GIE of China’s 30 provinces from 2007 to 2020 as a dynamic process, and the detailed steps refer to the paper of Zhang and Hao [38].

3.2.2. Moran’s Index

Moran’s Index test proposed by Moran [39], which is the most commonly used method to test spatial dependence, and the global index is specified as follows:
I = k = 1 30 j k 30 w j k ( X k X ¯ ) ( X j X ¯ ) S 2 k = 1 30 j = 1 30 w j k
where w j k is the spatial weight, which we define based on contiguity. X k and X j are the GIE of k and j , respectively; X ¯ denotes the mean value; and S 2 represents the variance.
The local Moran’s Index can define the specific structure of spatial clustering [40]:
I k = ( X k X ¯ ) S 2 j k 30 w j k ( X j k X ¯ )

3.2.3. Information Entropy Theory

Information entropy mainly describes the uncertainty of information and quantifies the importance of different indicators. That is, the more helpful information a specific indicator provides, the higher the weight it will get [41]. Furthermore, Shannon’s information theory forms the basis of the sensitivity analysis frame, which defines the contribution of each indicator to the uncertainty of a specified output [42]. We use this method to calculate the comprehensive intensity index of ERs [43].

3.2.4. System GMM Model

The regression model incorporating lagged terms of explained variables in panel data is called the dynamic panel regression model. The most commonly used measure is GMM, i.e., the Generalized Method of Moments. This estimator overcomes problems such as fixed effects and endogeneity of control variables, the correlation of independent variables and past and possibly current realizations of the error, the possible bias of omitted variables that are persistent over time, and heteroskedasticity and autocorrelation within individuals [44]. Moreover, this paper uses strongly balanced short panel data, which are suitable for regression through the system GMM method. Therefore, to investigate the direct effect of ERs on GIE in industry, first, a dynamic regression model including the explained variable lagged by one period is constructed below:
G I E j , p = α 0 + α 1 G I E j , p 1 + α 2 A E R j , p + α 3 E D L j , p + α 4 I S j , p + α 5 F D I j , p + α 6 T M A j , p + u j + ε j , p
G I E j , p = α 0 + α 1 G I E j , p 1 + α 2 M E R j , p + α 3 E D L j , p + α 4 I S j , p + α 5 F D I j , p + α 6 T M A j , p + u j + ε j , p  
G I E j , p = α 0 + α 1 G I E j , p 1 + α 2 P E R j , p + α 3 E D L j , p + α 4 I S j , p + α 5 F D I j , p + α 6 T M A j , p + u j + ε j , p
To verify the long-run effects, we developed a model including both the lagged term and the quadratic term:
G I E j , p = α 0 + α 1 G I E j , p 1 + α 2 A E R j , p + α 3 A E R j , p 1 + α 4 E D L j , p + α 5 I S j , p + α 6 F D I j , p + α 7 T M A j , p + u j + ε j , p
G I E j , p = α 0 + α 1 G I E j , p 1 + α 2 M E R j , p + α 3 M E R j , p 1 + α 4 E D L j , p + α 5 I S j , p + α 6 F D I j , p + α 7 T M A j , p + u j + ε j , p
G I E j , p = α 0 + α 1 G I E j , p 1 + α 2 P E R j , p + α 3 P E R j , p 1 + α 4 E D L j , p + α 5 I S j , p + α 6 F D I j , p + α 7 T M A j , p + u j + ε j , p
G I E j , p = α 0 + α 1 G I E j , p 1 + α 2 A E R j , p + α 3 A E R j , p 1 + α 4 A E R j , p 2 + α 5 E D L j , p + α 6 I S j , p + α 7 F D I j , p + α 8 T M A j , p + u j + ε j , p
G I E j , p = α 0 + α 1 G I E j , p 1 + α 2 M E R j , p + α 3 M E R j , p 1 + α 4 M E R j , p 2 + α 5 E D L j , p + α 6 I S j , p + α 7 F D I j , p + α 8 T M A j , p + u j + ε j , p        
G I E j , p = α 0 + α 1 G I E j , p 1 + α 2 P E R j , p + α 3 P E R j , p 1 + α 4 P E R j , p 2 + α 5 E D L j , p + α 6 I S j , p + α 7 F D I j , p + α 8 T M A j , p + u j + ε j , p
where u j represents the unpredictable individual characteristics, and ε j , p is the random perturbation term.
The proposed method comprises three modules, as shown in Figure 2, and can give us a clearer picture of the whole calculation process.

3.3. Data Sources

Regarding the applicability of data, we take China’s 30 provinces except for Tibet into account, and divide these provinces into eight regions. All data were obtained from the China Statistical Yearbook, China Statistical Yearbook on Environment, China Energy Statistical Yearbook, China Environment Yearbook, each province’s Environment Yearbook and the Statistical Yearbook. In particular, we set the GDP index of 2007 as the base period, and deflate the variables affected by price fluctuations.
To ensure the reliability of selected variables, we compute the descriptive statistics and variance inflation factor (VIF) (see Table 4). All VIF values are much less than 10, so there is no multicollinearity between any two variables.

4. Empirical Results and Discussion

4.1. Analysis of GIE in China’s Industry

Based on the DEA window analysis approach mentioned above, we can obtain the dynamic GIE, as shown in Table 5.
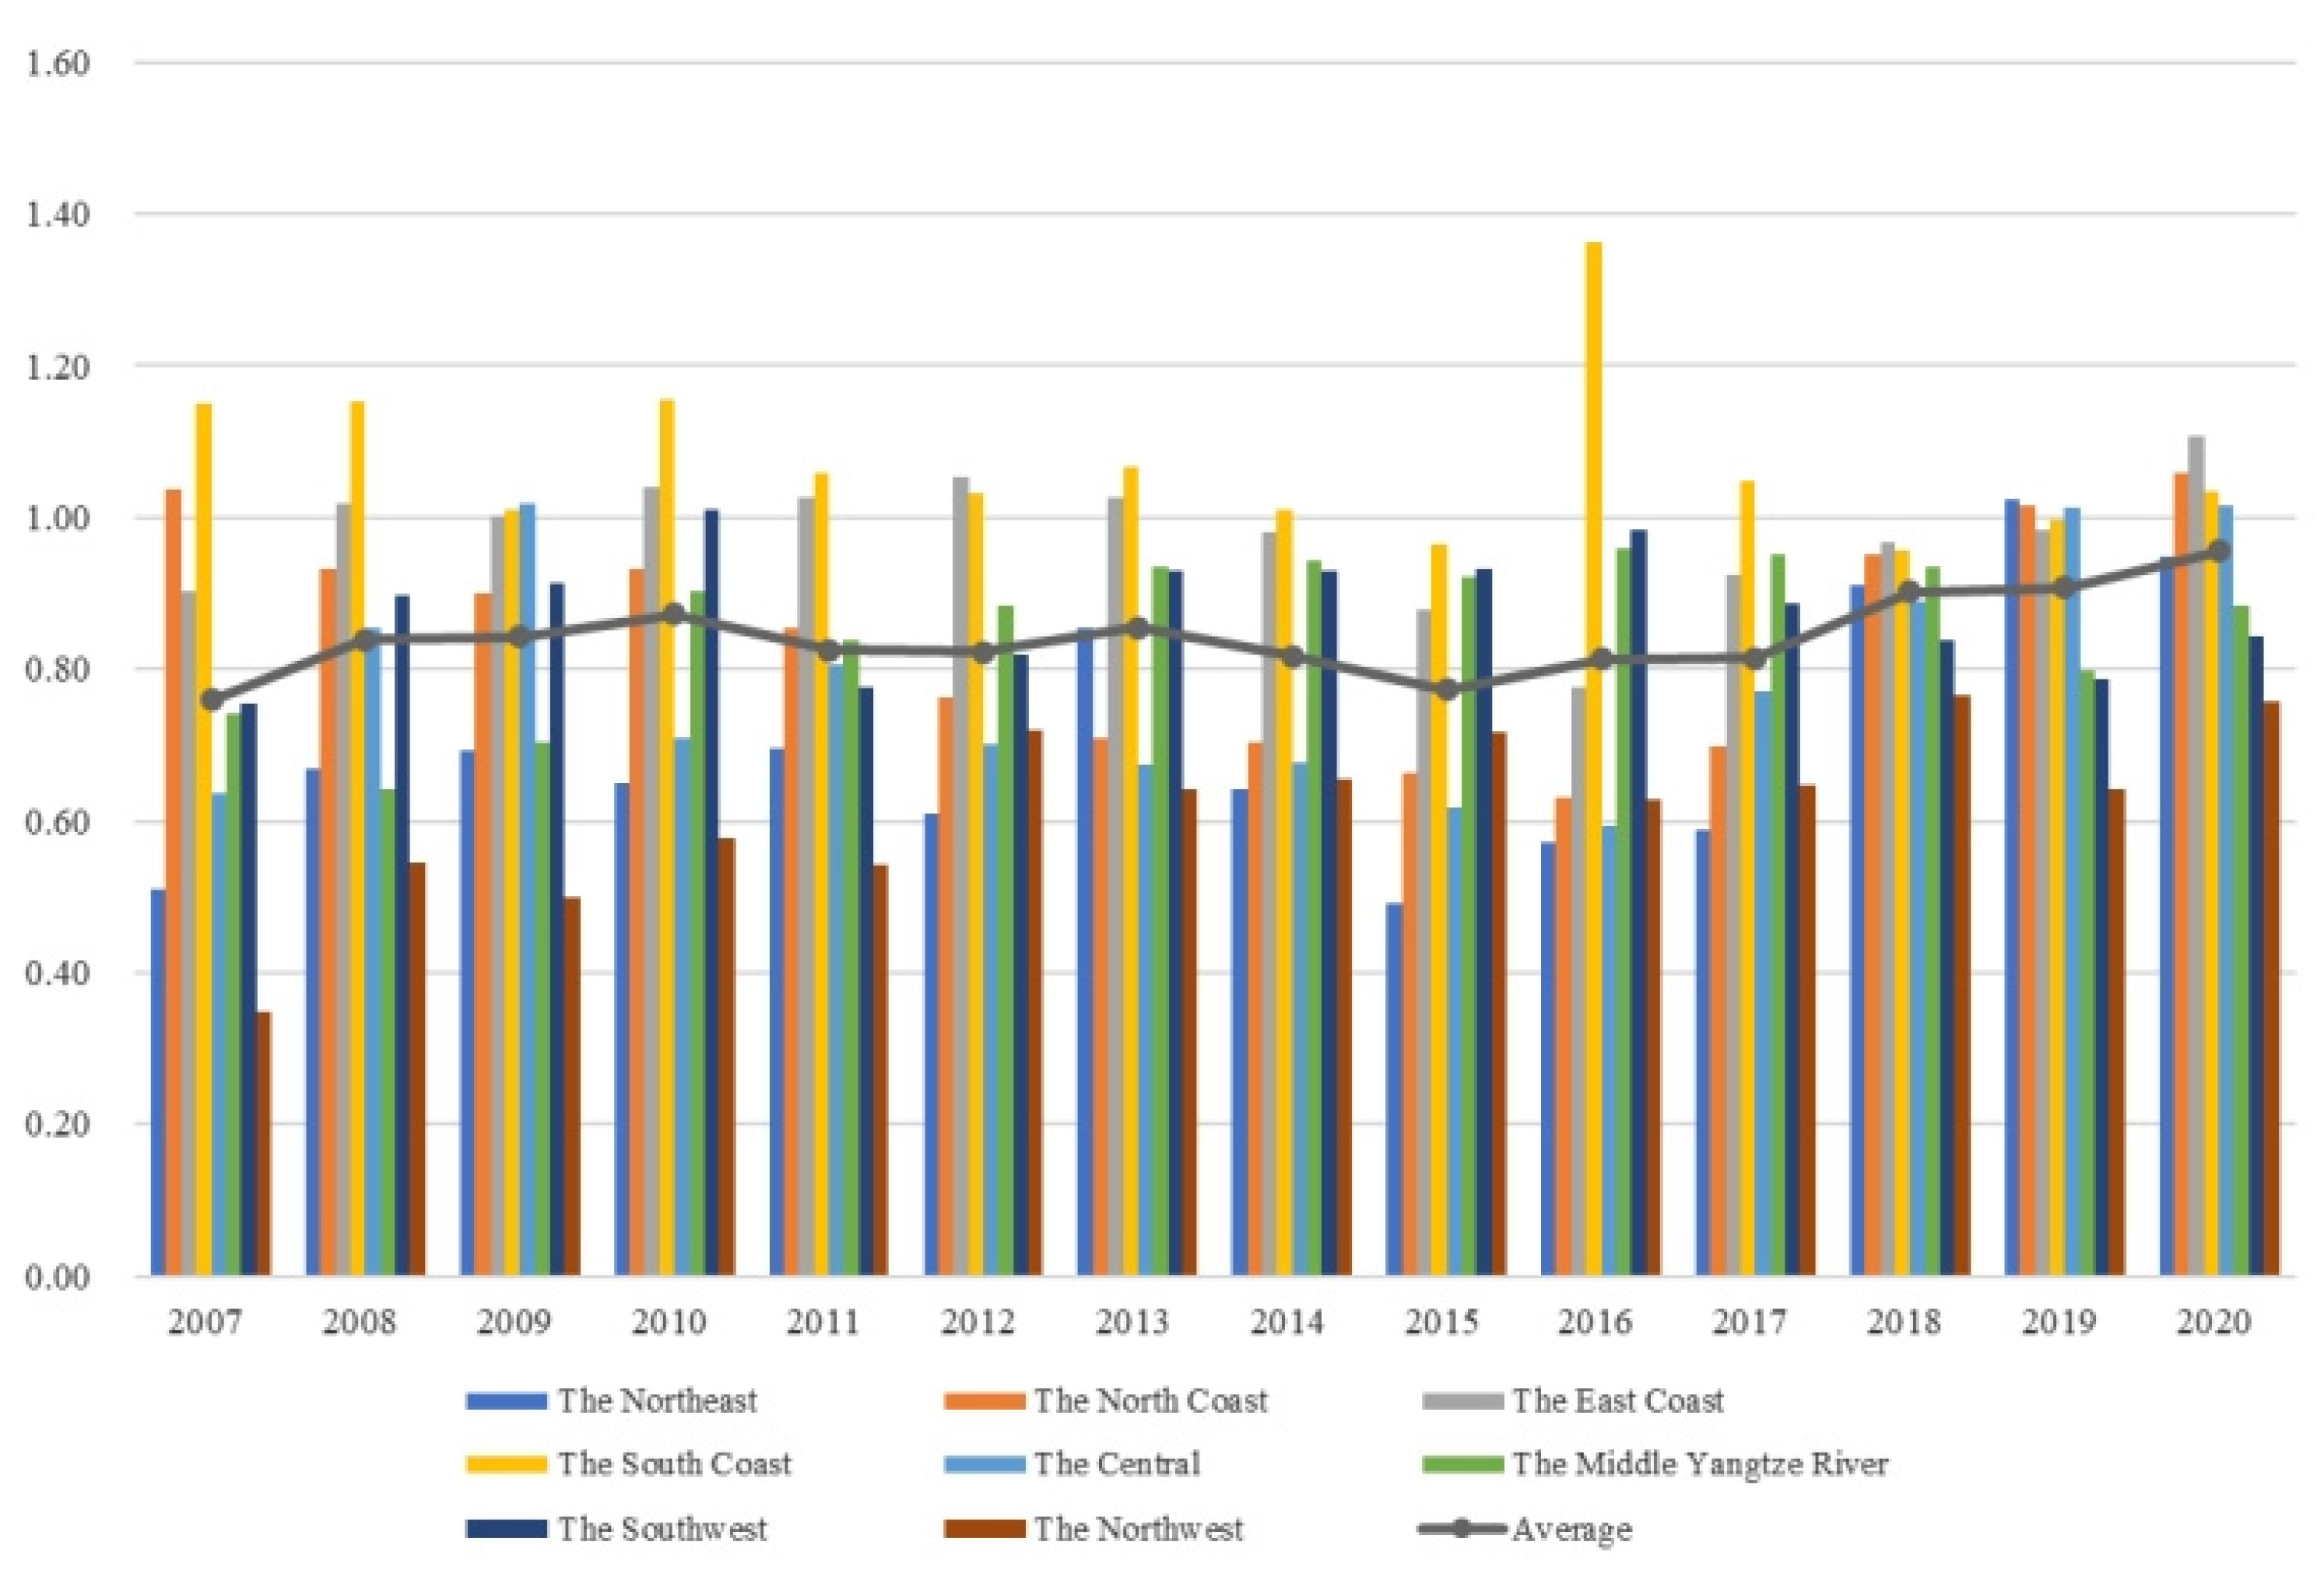
In Figure 3, we can get a comprehensive view of the industrial GIE. Firstly, from 2007 to 2020, China’s industrial GIE shows a relatively stable and slow rise with slight fluctuation. Secondly, there is a significant discrepancy in GIE across different regions. Specifically, the GIE of industrial sectors in the coastal areas, including the north, east and south coasts, is higher than the national average, followed by the middle Yangtze River and the southwest. In contrast, there is a significant gap between the GIE in the northeast, the central area and the northwest and the national average, which needs to be strengthened. Interestingly, given the differences in economic levels and resource endowments in various regions of China, GIE shows distinct geographical characteristics. These findings are highly consistent with Chinese characteristics, i.e., the asynchronous development. Economic and technological development occurred earlier in the eastern region, followed by the central and western regions, which have a relatively weak capacity for sustainable development. Consequently, a firm economic basis affords funding sources and guarantees for innovation, which also proves the decisive role of the economy. On the other hand, the coastal areas have been reformed and opened up earlier and received particular policy support from the central government, and have sustained and rapid economic development. More importantly, these regions have unique geographical location advantages that are conducive to introducing advanced technology and absorbing green transformation experience.
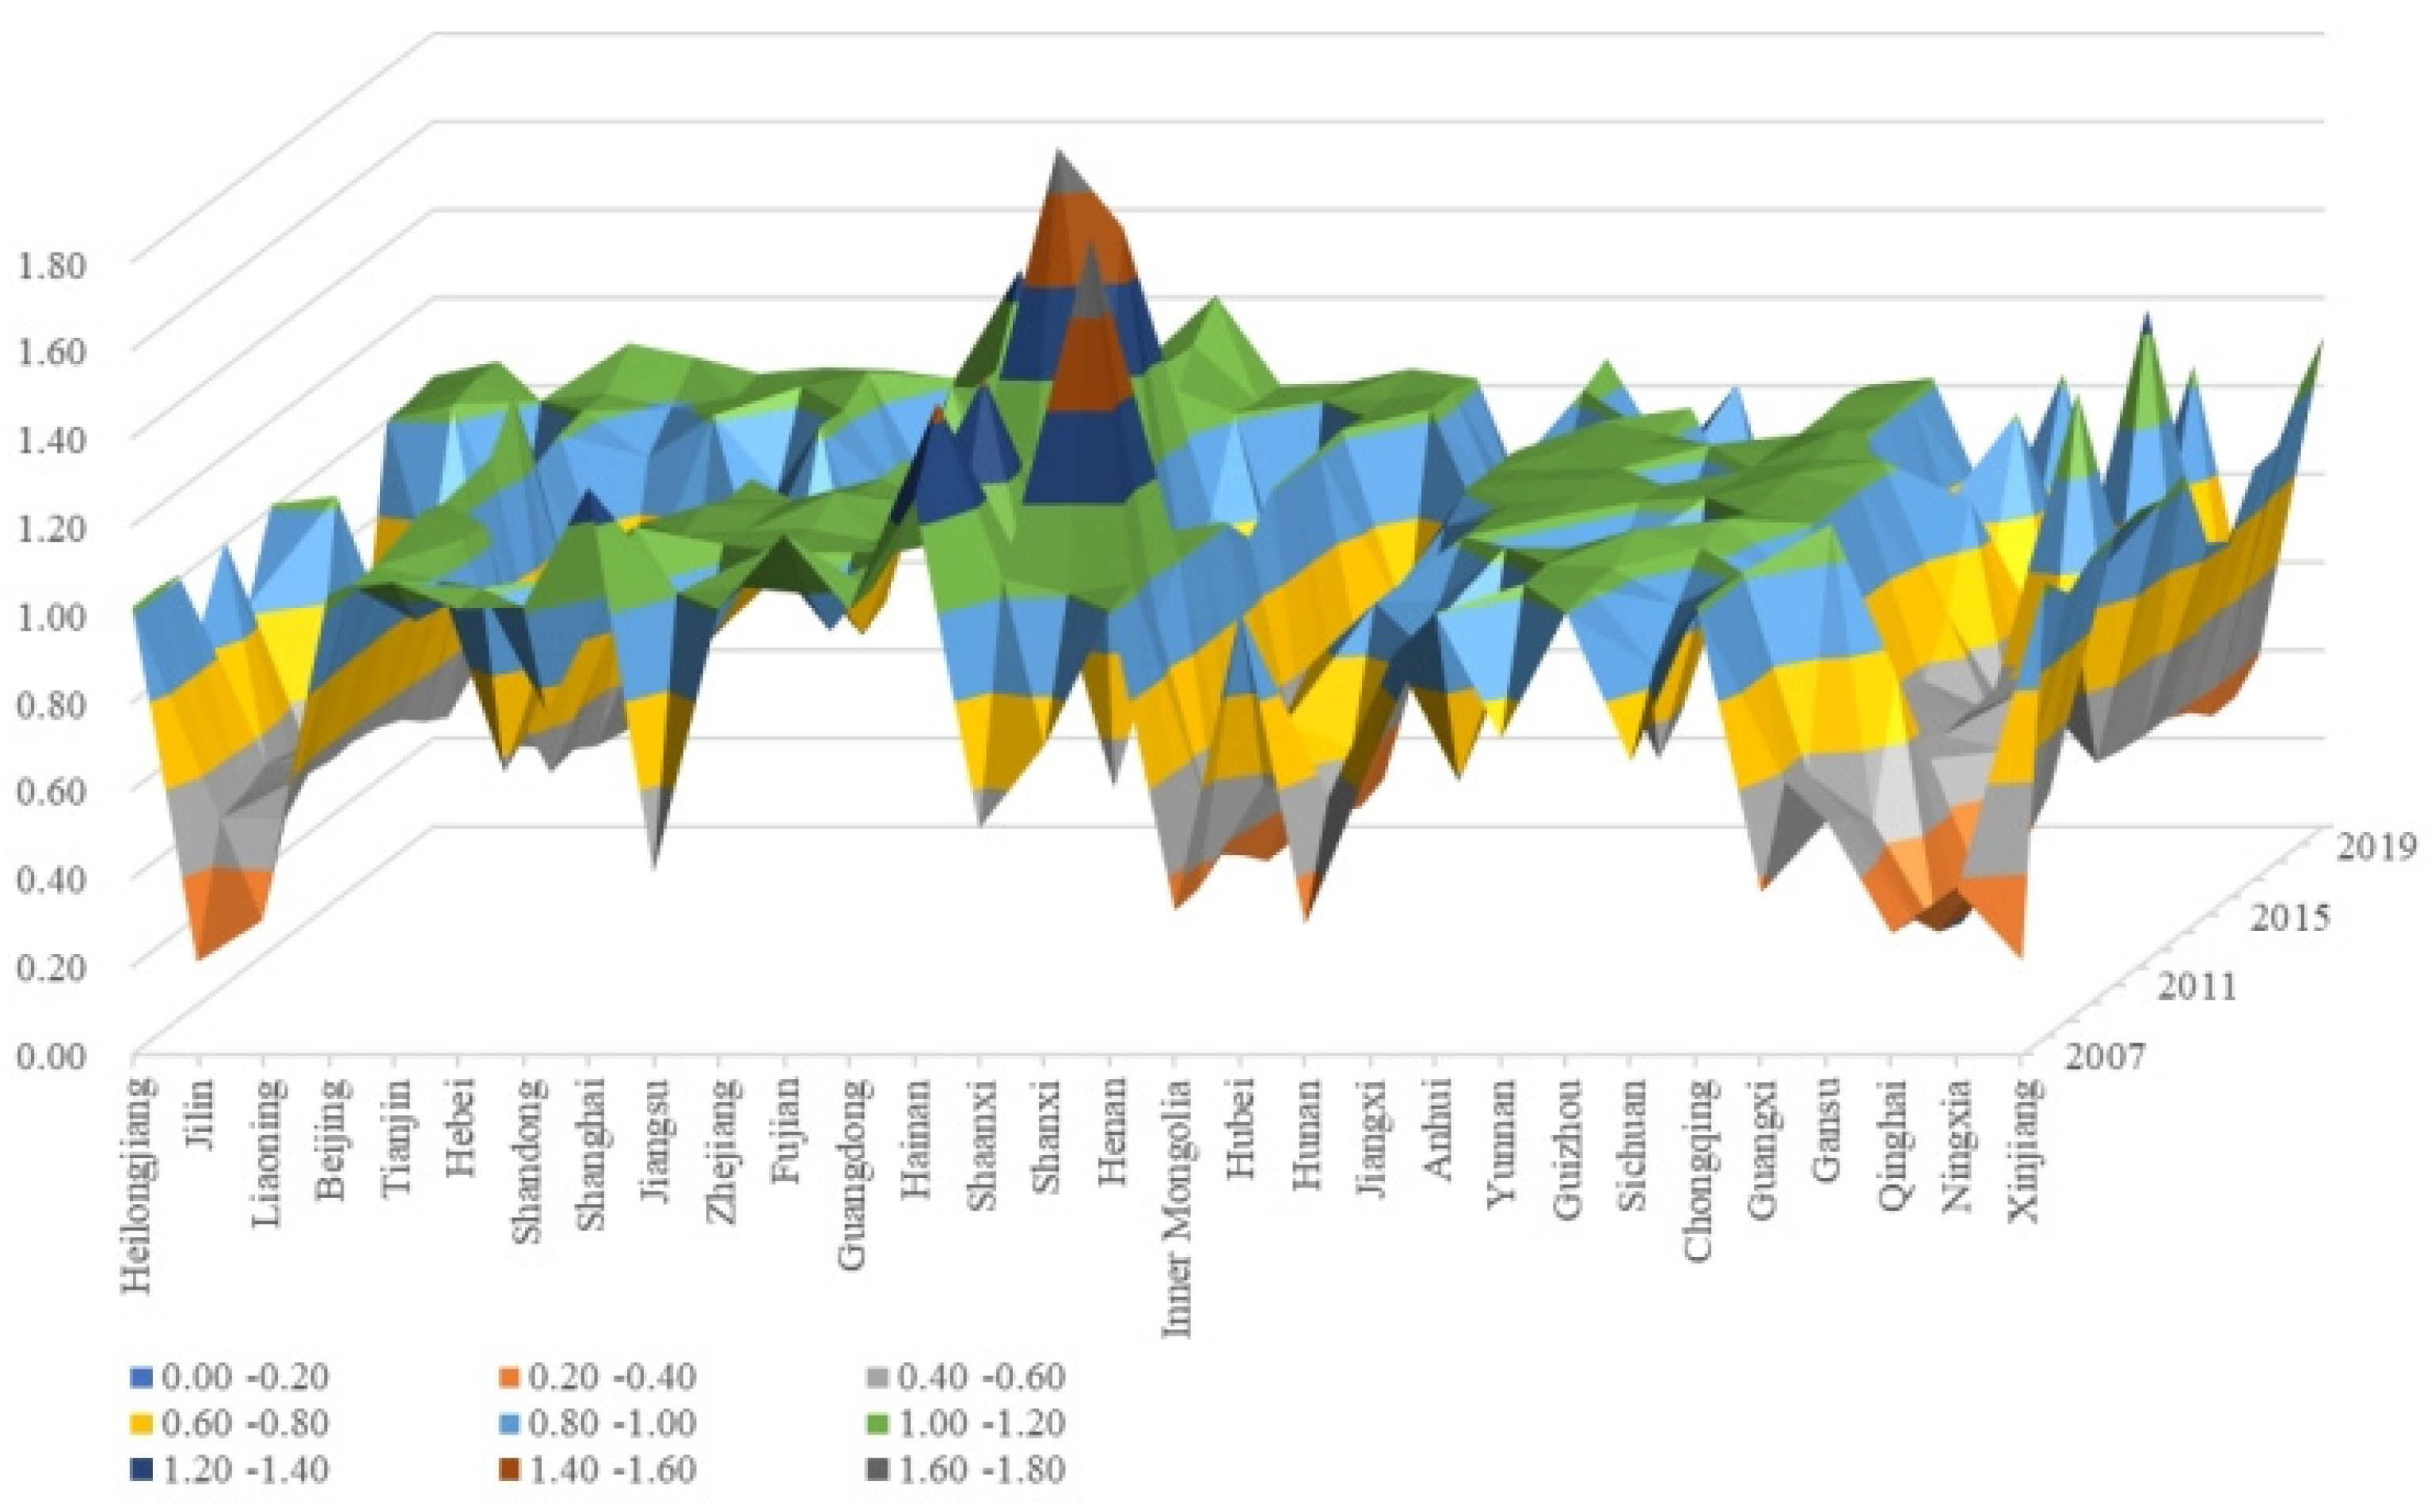
Through the horizontal comparison of GIE, we find that there is a considerable spatial imbalance and severe polarization among 30 provinces. Moreover, some provinces have even experienced intermittent stagnation in development (see Figure 4). Notably, results in Table 5 indicate that the GIE is relatively high in most coastal provinces, such as Hainan, Guangdong and Zhejiang. Inefficient provinces, including Gansu, Inner Mongolia and Ningxia, are primarily located in the East. Hainan ranks first, possibly due to its rich resources and environmental carrying capacity. Moreover, Hainan is pursuing a path of green, sustainable and high-quality development, has a unique industrial structure, dominated by agriculture and tourism services. As a result, Hainan’s GIE is relatively high. With government policy support, investment in innovation funds and human resources, the construction of innovation carriers has been improved and industrial innovation capabilities have been enhanced. Zhejiang, which attaches great importance to the use of clean energy, possesses a relatively complete strategic layout of emerging industries and a high degree of industrial mechanization. This phenomenon can explain why Zhejiang’s GIE ranks top among economically developed regions. The GIE in Ningxia is relatively low, characterized by heavy industrial sectors and a coal-dominated energy structure, with severe supply-side structural problems and weak development foundation. Since 2017, Ningxia has established a cooperation mechanism between the East and West, tending to create a new engine of innovation. However, innovation is a dynamic, ongoing process that requires long-term accumulation to get results.

4.2. The Results of Moran’s Index

From 2007 to 2017 (excluding 2008, 2009 and 2011), there is significant spatial clustering and the null hypothesis is rejected at the 5% level (see Table 6). In 2017, the global Moran’s index is 0.360. In addition, the statistic value is 3.161, which is significantly positive, indicating a strong positive spatial autocorrelation between geographically adjacent provinces. From 2018 to 2020, China’s green innovation and technological achievements are remarkable, with relatively small differences across regions. Perhaps it is because the 13th Five Year Plan has formulated strict policies for all regions, especially a series of ERs that foster the innovation and productivity, which to some extent is also a positive response to the strategic deployment of the United Nations Sustainable Development Goals (SDGs). Overall, this conclusion is consistent with the results in Figure 4.
Figure 5 displays the scatter plot for GIE in 2017, consisting of four quadrants. The first, second, third and fourth quadrants refer to the high–high, low–high, low–low and high–low clustering types, and different symbols denote provinces of different regions (see Table 5). For instance, the second quadrant means that those with high efficiency surround the provinces with low efficiency.

4.3. The Comprehensive Index of ERs

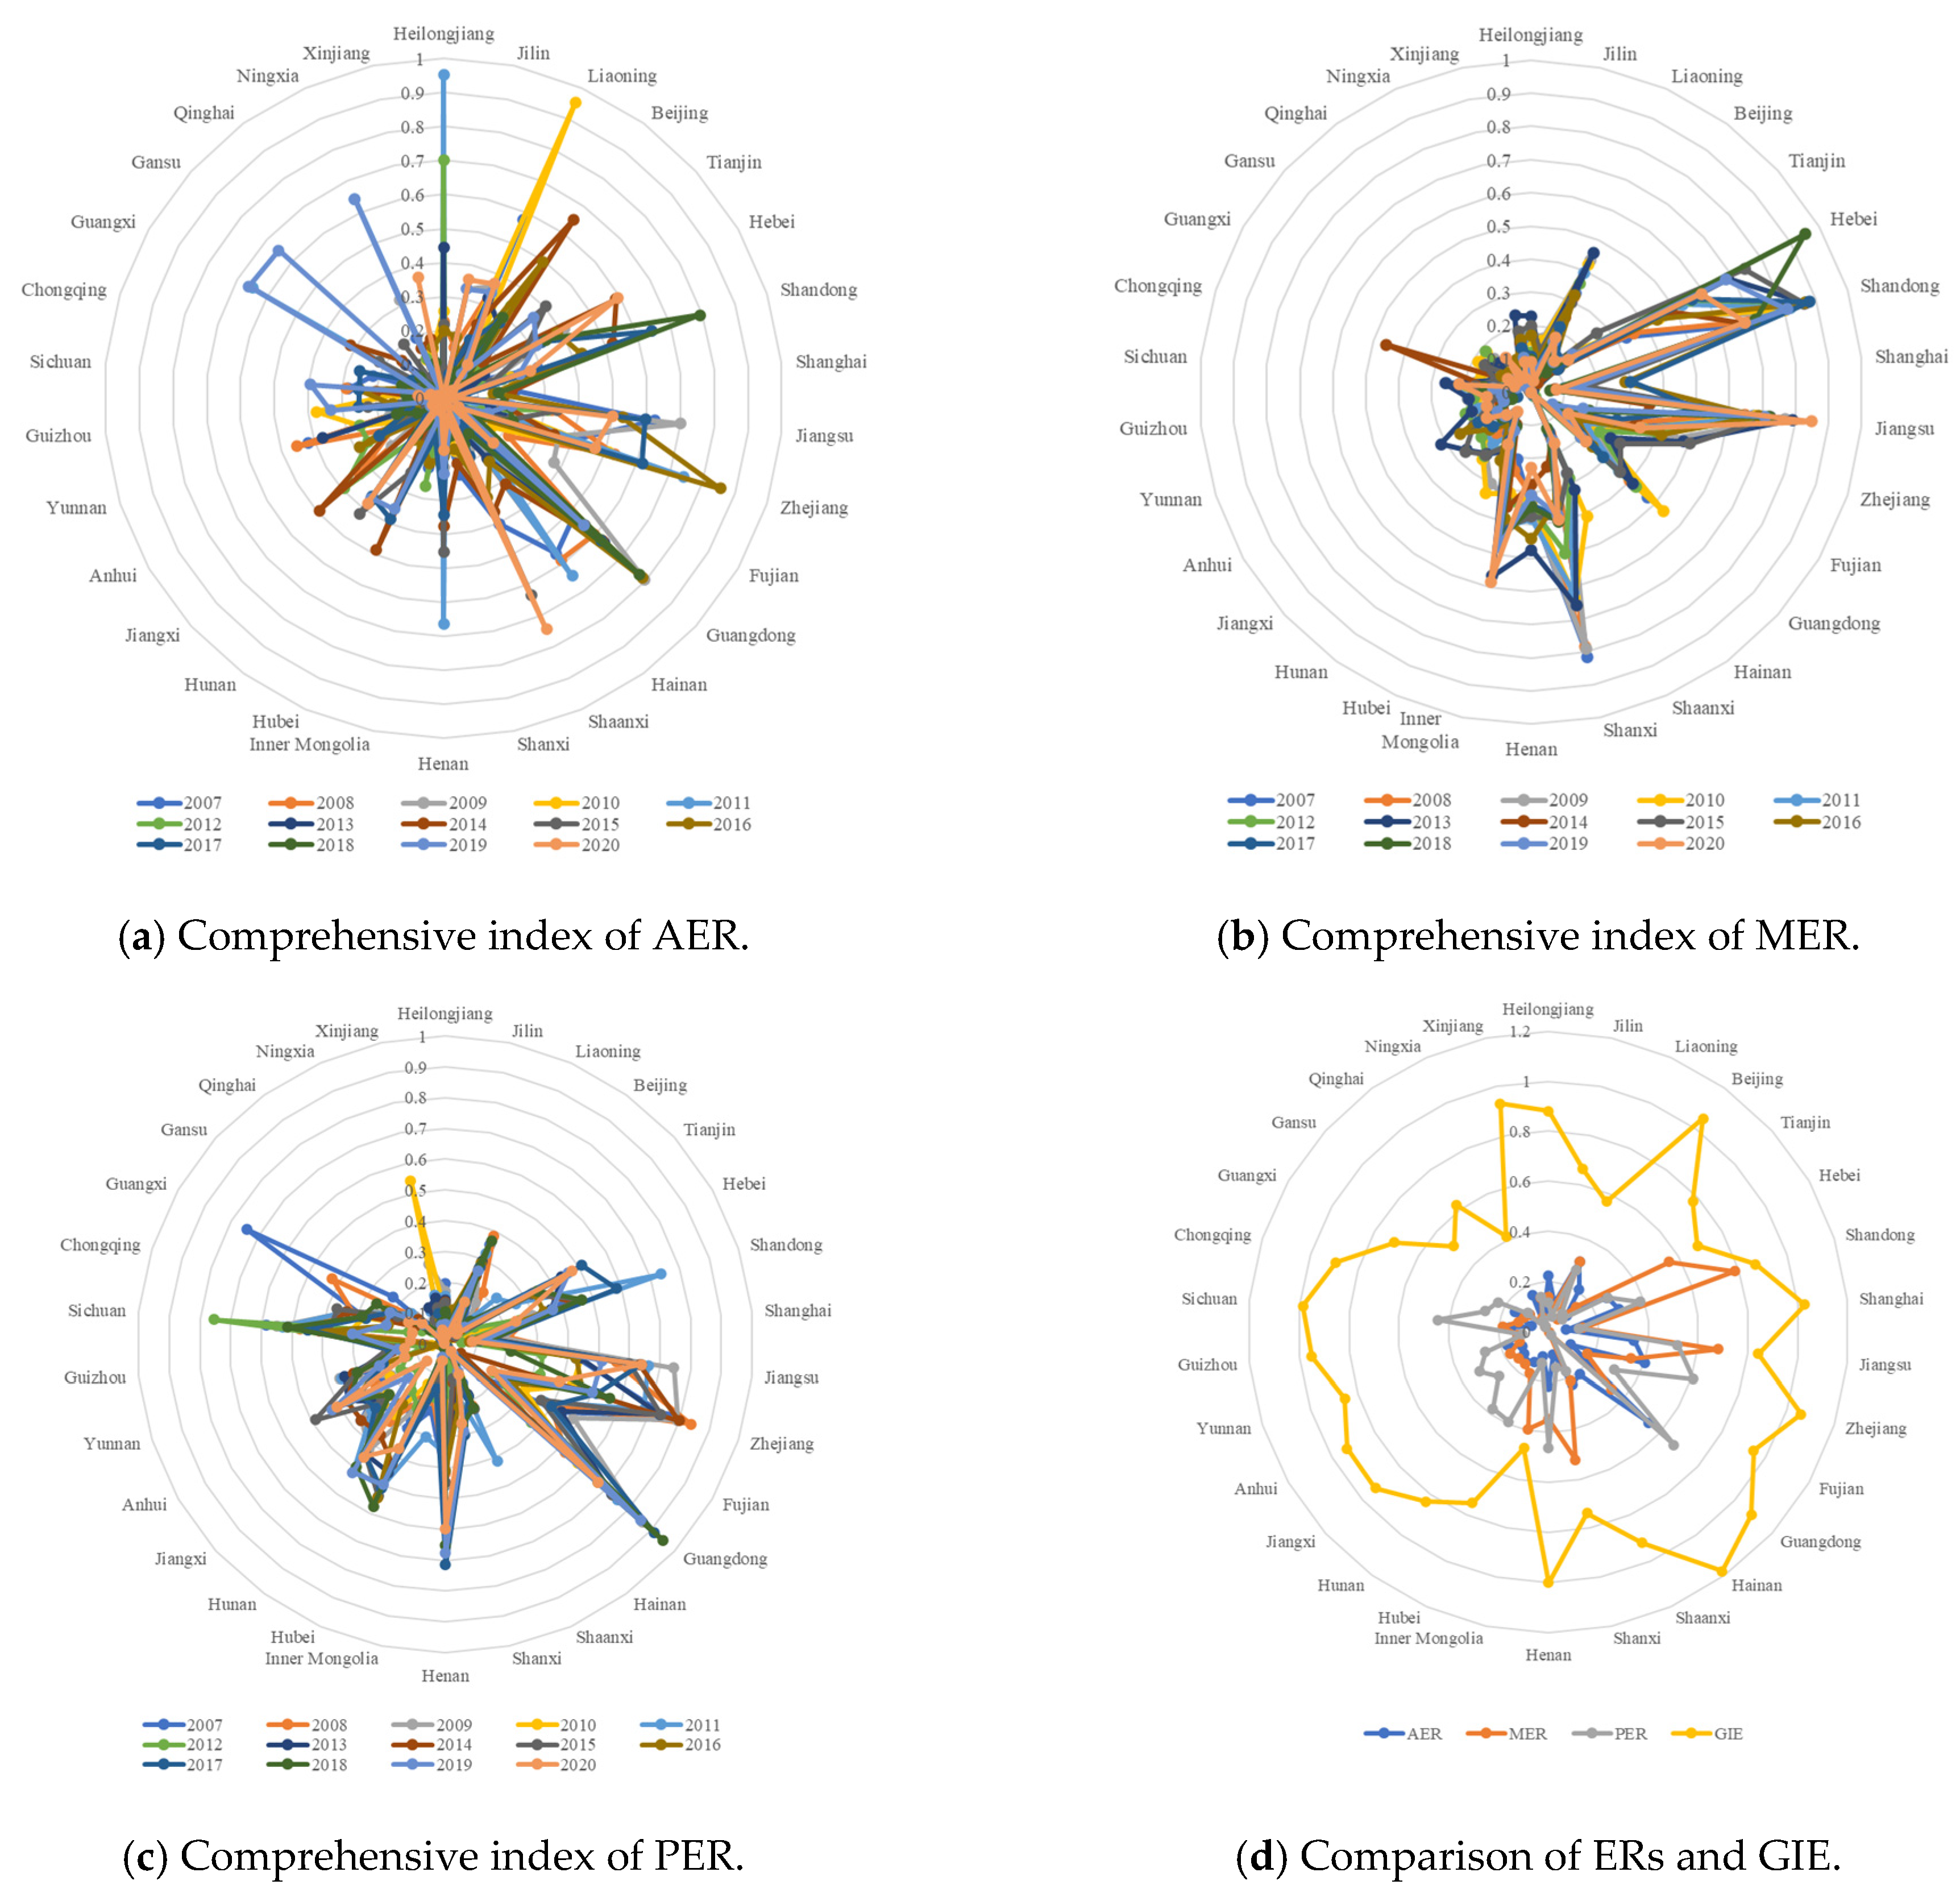
As shown in Figure 6, the intensity of AER improves slowly and even diminishes to a certain extent. The AER is relatively high in the south coast region, while it is generally low in the southwest and northwest areas. Some provinces have relatively high MER intensity, such as Hebei, Shandong and Jiangsu, while the differences between other provinces are not significant. Moreover, the PER of Guangdong, Zhejiang and Jiangsu is strict, and the overall intensity of each province has increased from 2007–2020. Specifically, by comparing these ERs with industrial GIE, it can be found that the evolutionary trend of PER is similar to the development of industrial GIE.
In addition, we tested Moran’s index of the ERs in 2017 (see Table 7) and found that there is no spatial aggregation effect in AER, while the other two regulations show significant spatial dependence. AER is mainly a mandatory policy targeting the development stage and geographical characteristics of the local region, and may not be suitable for different areas. However, driven by regional economic integration and industrial agglomeration, coupled with learning and cascading effects, MER exhibits a solid spatial dependence, i.e., high–high clustering. As a management tool, PER heavily relies on the self-consciousness of firms and individuals, allowing people to communicate with each other nationwide. If the intensity of PER is low, some provinces will exert a negative spillover effect on adjacent areas, which is a characteristic of “Pollution transfer”.

4.4. Heterogeneous Impacts of ERs on Industrial GIE

The validity of instrumental variables affects the heterogeneity of the system’s GMM estimation, so Hansen test and AR test are employed for judgment. The detailed regression estimation results are shown in Table 8. The p values of AR (2) are more significant than 0.100, indicating that sequence autocorrelation of these models does not exist above the second-order residual. Moreover, the p values of the Hansen test are between 0.100 and 0.250, which expresses that the instrumental variables are relatively reasonable, the model identification is sufficient, and the estimation results are credible.
The GIE of the lag period passes the significance levels of 1% and 5%, illustrating that industrial innovation is a sustained long-term process. In regression (4), the main coefficient of AER is negative and passes the 5% significance level. Therefore, it may also indicate that such regulation has a significant inverse inhibitory effect on industrial GIE. This phenomenon is mainly attributed to income uncertainty. On the one hand, the industry usually bears the major cost in the innovation process, but in many cases, it may not necessarily generate corresponding benefits. Next, we add a lag term in regression (5), which has a significantly positive coefficient, implying that AER will stimulate GIE in the long run. Still, the coefficient of 0.284 is smaller than 0.294, representing that the positive impact may slightly weaken over time. Furthermore, the quadratic term in model (6) is significantly positive, i.e., the long-term impact is initially hostile and later positive, suggesting a U-shaped relationship. In other words, there is a critical point. Before this point, the tighter the ER is, the lower the GIE is, and then as regulatory intensity increases, GIE will increase. Specifically, China’s industrial sector has not yet reached to the critical point, so the government should continue to implement stringent AER and realize the sustainable development of industry. On the other hand, industrial sectors need to steadily raise their GIE and maximize benefits to mitigate the innovation cost. This discovery is consistent with some related studies [11,45].
For the direct impact of MER, the coefficient is negative, i.e., −0.613, and passes the significance level of 10%. In this stage, the economic benefits cannot offset the increased costs, thus, stringent regulation may inhibit the development of green innovation. The coefficient of the primary and quadratic terms in regression (9) are 1.273 and −0.016, which are significant at the 10% level. The results show a meaningful nonlinear relationship, with an inverted U-shape. Initially, stringent but appropriate MER can facilitate innovation to some extent, as the benefits generated are sufficient to compensate or offset the costs caused by regulation. However, once the critical point is exceeded, the effect of innovation compensation will gradually diminish, and MER may play a negative role.
Through the regression results of Equations (10)–(12), we find that PER has no significant direct effect on GIE, and there is no nonlinear relationship, whereas the coefficient of the lag term is positive and has passed a significance level of 5%, indicating that GIE in the current period is influenced by PER in the previous period, and high-intensity PER can promote GIE. Existing studies have also reached similar conclusions, proposing that ERs are the main driving force for green innovation. Especially, ERs can effectively solve the pollution issues arising from the industrial sectors [46].
The EDL and IS significantly and positively impact industrial GIE. The development of the regional economy can provide sufficient funds for technological innovation, and the efficiency will be further improved. Meanwhile, the industrial layout also plays a positive role in enhancing GIE. However, FDI has no significant effect on GIE, as the introduction of FDI not only brings advanced technology and experience but also produces a crowding-out effect on local industrial enterprises, increasing the pressure on local environmental management. Consequently, the impact of FDI should be explicitly analyzed in relation to the development characteristics of each region, and should not be simply identified as a promoting or inhibiting factor. Currently, China remains in the historical stage of industrialization and urbanization. Especially the proportion of traditional industries is still high, and strategic emerging and high-tech industries have not yet become the leading sections for sustainable economic growth. Thus, the TMA has no significant impact on GIE. Moreover, the situation of coal-dominated energy structure and low energy efficiency has not been fundamentally changed, pollution problems in critical regions and industries have not been solved, resource and environmental constraints have intensified, and the time window for carbon peak and carbon neutrality is tight. In general, the more dynamic the technology market is, the more conducive it is to the commercial value transformation of technology products, and the more capable it is to stimulate enterprises to increase the introduction, absorption and R&D of green innovative technologies. To promote green, low-carbon and sustainable development in the industry, it is necessary to optimize the market environment, which supports sustainable technological innovation, promotes the diffusion of green technologies and strengthens the cultivation of green innovation capabilities.

4.5. Robustness Result

To ensure the robustness of the estimation results, we tested the empirical results by varying the data volume and excluding extreme values. The data are firstly processed by 1% tail reduction, and then the sample data is regressed through the system GMM method. Except for slight fluctuations in the data size, the sign and significance level of the coefficients of the core explanatory variables are consistent in Table 8, indicating that the above empirical analyses are significant and robust.

5. Conclusions and Policy Implications

Based on the results of the above discussion, we can safely draw the following conclusions.
First, from the perspective of regional development, the industrial GIE of the coastal region is relatively high. In contrast, the efficiency of the northeast, central and northwest regions is low, and there is much room for improvement. At the provincial level, Hainan, Guangdong and Zhejiang rank high in GIE, while Gansu, Inner Mongolia and Ningxia rank at the bottom. The GIE shows a specific spatial dependency during its evolution.
Second, there are significant differences in ERs, and the regulation intensity has increased. Furthermore, the MER and PER exhibit spatial aggregation to a certain extent, and the development trend of PER is similar to the evolution of GIE.
Finally, the development of industrial GIE is a long-term and dynamic process. The impact of AER on GIE is first negative and then positive, i.e., a U-shaped relationship. Moreover, the positive incentive effect of MER will increase over time until reaching a critical point. Thus, the relationship is inverted U-shaped. However, the intensity of PER will be influenced by the previous development of GIE. Meanwhile, regional EDL and IS can significantly affect GIE, whereas FDI and TMA have no significant impact on industrial GIE.
We can derive a number of policy implications. First, the classification of ERs enriches the research on management methods, which is beneficial for the government to quantify and formulate reasonable sustainability policies.
Second, to encourage industrial enterprises to practice the concept of green and sustainable development, and promote the transformation and upgrading of economic structure, the government should strengthen cooperation and break imbalance among various regions. The green development of industrial sectors in underdeveloped regions such as Gansu, Inner Mongolia and Ningxia must rely on investment and technological guidance from advanced areas. Therefore, we should fully leverage the role of efficient provinces as growth poles, such as coastal provinces, to crush the spatial limitations of advanced technology and experience.
Third, China should tighten the intensity of AER to fully unleash the long-term positive incentive effect. When formulating MER policies, we must determine whether the critical point has been reached, after which a relaxed regulatory approach can make more room for innovation. Moreover, the impact of ER is time-delayed and should not be rushed. The government should develop long-term plans with dynamic adjustment. Blindly strengthening the ER without assessing the effect of the following year’s policy may discourage innovation. More importantly, to stimulate the vitality of PER, we can ultimately mobilize the initiative of participants in environmental protection and enhance the enthusiasm of enterprises in environmental governance.
Finally, the extrusion effect on enterprise innovation funds should be fully considered when formulating policies to provide sufficient fund security for sustainable technological innovation and to compensate for the vast pollution control cost caused by strict ERs. Moreover, we should formulate the FDI policy suitable for local characteristics, focusing on alleviating local capital by FDI, paying attention to the impact and harm to local enterprises, and optimizing the market environment as soon as possible to provide a fundamental guarantee for innovation improvement.
As for future work, a lot of research can be done. For example, on the one hand, we can continue to study the impacts of heterogeneous ERs on the development of industrial innovation within each economic region or province from a more microscopic perspective; on the other hand, we can also try to study the evolution of technological innovation in industrial sectors from the perspective of technology diffusion. In addition, if we can combine ER and technology diffusion with GIE, we may have more exciting findings. Also, it would be useful to focus on the critical point of MER policies in future studies.

Author Contributions

Conceptualization, J.H. and W.X.; methodology, J.H. and Y.W.; software, J.H.; validation, J.H. and B.Y.; formal analysis, J.H.; investigation, B.Y..; resources, J.H. and Y.W.; data curation, J.H.; writing—original draft preparation, J.H.; writing—review and editing, Z.C.; visualization, Z.C.; supervision, W.X; funding acquisition, J.H. and B.Y. All authors have read and agreed to the published version of the manuscript.

Funding

This research was funded by the Program of Philosophy and Social Science in Henan Province (Funding number: 2023CJJ147); the General Project of Humanities and Social Sciences Research in Universities of Henan Province (Funding number: 2024-ZDJH-039); the Fundamental Research Funds for the Universities of Henan Province (Funding number: SKJYB2023-18); and the funder of the above three fundings is Junfang Hao. This research was funded by Social Science in Henan Provincial Higher Education Institutions (Funding number: 2022-YYZD-07) and the funder is Baiyun Yuan.

Institutional Review Board Statement

Not applicable.

Informed Consent Statement

Not applicable.

Data Availability Statement

All the data and tools/models used for this work are publicly available.

Conflicts of Interest

The authors declare no conflicts of interest.

References

  1. Adam, Z. Green Development-Environment and Sustainability in a Developing World; Routledge: London, UK, 2009. [Google Scholar]
  2. Wang, J.; Hu, M.; Rodrigues, J.F.D. The evolution and driving forces of industrial aggregate energy intensity in China: An extended decomposition analysis. Appl. Energy 2018, 228, 2195–2206. [Google Scholar] [CrossRef]
  3. Liu, L.J.; Jiang, J.Y.; Bian, J.C.; Liu, Y.Z.; Lin, G.H.; Yin, Y.K. Are environmental regulations holding back industrial growth? Evidence from China. J. Clean. Prod. 2021, 306, 127007. [Google Scholar] [CrossRef]
  4. Hille, E.; Möbius, P. Environmental Policy, Innovation, and Productivity Growth: Controlling the Effects of Regulation and Endogeneity. Environ. Resour. Econ. 2019, 73, 1315–1355. [Google Scholar] [CrossRef]
  5. Sheng, Q.; Pan, Y.X.; Feng, Y.C. Identifying and assessing the multiple effects of informal environmental regulation on carbon emissions in China. Environ. Res. 2023, 237, 116931. [Google Scholar] [CrossRef] [PubMed]
  6. Shen, W.F.; Shi, J.N.; Meng, Q.G.; Chen, X.L.; Liu, Y.F.; Cheng, K.; Liu, W.B. Influences of Environmental Regulations on Industrial Green in China. Sustainability 2022, 14, 4717. [Google Scholar] [CrossRef]
  7. Zhao, T.; Zhou, H.H.; Jiang, J.D.; Yan, W.Y. Impact of Green Finance and Environmental Regulations on the Green Innovation Efficiency in China. Sustainability 2022, 14, 3206. [Google Scholar] [CrossRef]
  8. Huang, J.H.; Yang, X.G.; Cheng, G.; Wang, S.Y. A comprehensive eco-efficiency model and dynamics of regional eco-efficiency in China. J. Clean. Prod. 2014, 67, 228–238. [Google Scholar] [CrossRef]
  9. Korhonen, J.; Pätäri, S.; Toppinen, A.; Tuppura, A. The role of environmental regulation in the future competitiveness of the pulp and paper industry: The case of the sulfur emissions directive in northern Europe. J. Clean. Prod. 2015, 108, 864–872. [Google Scholar] [CrossRef]
  10. Zhang, J.X.; Kang, L.; Li, H.; Ballesteros-Pérez, P.; Skitmore, M.; Zuo, J. The impact of environmental regulations on urban Green innovation efficiency: The case of Xi’an. Sustain. Cities Soc. 2020, 57, 102123. [Google Scholar] [CrossRef]
  11. Zhang, J.X.; Ouyang, Y.; Ballesteros-Pérez, P.; Li, H.P.; Philbin, S.; Li, Z.L.; Skitmore, M. Understanding the impact of environmental regulations on green technology innovation efficiency in the construction industry. Sustain. Cities Soc. 2021, 65, 102647. [Google Scholar] [CrossRef]
  12. Xu, Y.J.; Liu, S.G.; Wang, J.Y. Impact of environmental regulation intensity on green innovation efficiency in the Yellow River Basin, China. J. Clean. Prod. 2022, 373, 133789. [Google Scholar] [CrossRef]
  13. Cai, X.; Zhu, B.Z.; Zhang, H.J.; Li, L.; Xie, M.Y. Can direct environmental regulation promote green technology innovation in heavily polluting industries? Evidence from Chinese listed companies. Sci. Total Environ. 2020, 746, 140810. [Google Scholar] [CrossRef] [PubMed]
  14. Sun, Z.Y.; Wang, X.P.; Liang, C.; Cao, F.; Wang, L. The impact of heterogeneous environmental regulation on innovation of high-tech enterprises in China: Mediating and interaction effect. Environ. Sci. Pollut. Res. 2021, 28, 8323–8336. [Google Scholar] [CrossRef]
  15. Peng, H.; Shen, N.; Ying, H.Q.; Wang, Q.W. Can environmental regulation directly promote green innovation behavior? based on situation of industrial agglomeration. J. Clean. Prod. 2021, 312, 128044. [Google Scholar] [CrossRef]
  16. Testa, F.; Iraldo, F.; Frey, M. The effect of environmental regulation on firms’ competitive performance: The case of the building & construction sector in some EU regions. J. Environ. Manag. 2011, 92, 2136–2144. [Google Scholar] [CrossRef]
  17. Hu, S.; Liu, S. Do the coupling effects of environmental regulation and R&D subsidies work in the development of green innovation? Empirical evidence from China. Clean Technol. Environ. Policy 2019, 21, 1739–1749. [Google Scholar]
  18. Luo, Y.S.; Salman, M.; Lu, Z.N. Heterogeneous impacts of environmental regulations and foreign direct investment on green innovation across different regions in China. Sci. Total Environ. 2021, 759, 143744. [Google Scholar] [CrossRef]
  19. Dong, Z.Q.; Wang, H. Local-neighborhood effect of green technology of environmental regulation. China Ind. Econ. 2019, 370, 104–122. [Google Scholar]
  20. Herman, K.S.; Xiang, J. Environmental regulatory spillovers, institutions, and clean technology innovation: A panel of 32 countries over 16 years. Energy Res. Soc. Sci. 2020, 62, 101363. [Google Scholar] [CrossRef]
  21. Anselin, L. Spatial Econometrics: Methods and Models; Springer Science & Business Media: Berlin/Heidelberg, Germany, 2013. [Google Scholar]
  22. Fan, F.; Lian, H.; Liu, X.Y.; Wang, X.L. Can environmental regulation promote urban green innovation Efficiency? An empirical study based on Chinese cities. J. Clean. Prod. 2021, 287, 125060. [Google Scholar] [CrossRef]
  23. Shao, X.Y.; Liu, S.; Ran, R.P.; Liu, Y.Q. Environmental regulation, market demand, and green innovation: Spatial perspective evidence from China. Environ. Sci. Pollut. Res. 2022, 29, 63859–63885. [Google Scholar] [CrossRef] [PubMed]
  24. Fang, Z.; Bai, H.; Bilan, Y. Evaluation research of green innovation efficiency in China’s heavy polluting industries. Sustainability 2020, 12, 146. [Google Scholar] [CrossRef]
  25. Xie, P.X.; Zhuo, L.; Yang, X.; Huang, H.R.; Gao, X.R.; Wu, P.T. Spatial-temporal variations in blue and green water resources, water footprints and water scarcities in a large river basin: A case for the Yellow River basin. J. Hydrol. 2020, 590, 125222. [Google Scholar] [CrossRef]
  26. Zheng, D.; Shi, M. Multiple environmental policies and pollution haven hypothesis: Evidence from China’s polluting industries. J. Clean. Prod. 2017, 141, 295–304. [Google Scholar] [CrossRef]
  27. Abualigah, L.; Elaziz, M.A.; Sumari, P.; Geem, Z.W.; Gandomi, A.H. Reptile Search Algorithm (RSA): A nature-inspired meta-heuristic optimizer. Expert Syst. Appl. 2022, 191, 116158. [Google Scholar] [CrossRef]
  28. Gyedu, S.; Heng, T.; Ntarmah, A.H.; He, Y.Q.; Frimppong, E. The impact of innovation on economic growth among G7 and BRICS countries: A GMM style panel vector autoregressive approach. Technol. Forecast. Soc. Chang. 2021, 173, 121169. [Google Scholar] [CrossRef]
  29. Zhang, Z.Y.; Li, R.F.; Song, Y.; Sahut, J.M. The impact of environmental regulation on the optimization of industrial structure in energy-based cities. Res. Int. Bus. Financ. 2024, 68, 102154. [Google Scholar] [CrossRef]
  30. Liu, Y.Q.; Zhu, J.L.; Li, Y.E.; Meng, Z.Y.; Song, Y. Environmental regulation, green technological innovation, and ecoefficiency: The case of Yangtze river economic belt in China. Technol. Forecast. Soc. Chang. 2020, 155, 119993. [Google Scholar] [CrossRef]
  31. Gao, P.; Wang, H. Fiscal Input, Environmental Regulation and Efficiency of Green Technological Innovation: Based on the Data of Large Industrial Enterprises from 2008 to 2015. Ecol. Econ. 2018, 34, 93–99. (In Chinese) [Google Scholar]
  32. Zhang, Y.; Wang, J.; Xue, Y.; Yang, J. Impact of environmental regulations on green technological innovative behavior: An empirical study in China. J. Clean. Prod. 2018, 188, 763–773. [Google Scholar] [CrossRef]
  33. Tone, K. A slacks-based measure of super-efficiency in data envelopment analysis. Eur. J. Oper. Res. 2002, 143, 32–41. [Google Scholar] [CrossRef]
  34. Fried, H.O.; Lovell, C.A.K.; Schmidt, S.S.; Yaisawarng, S. Accounting for Environmental Effects and Statistical Noise in Data Envelopment Analysis. J. Prod. Anal. 2002, 17, 157–174. [Google Scholar] [CrossRef]
  35. Tone, K. A slacks-based measure of efficiency in data envelopment analysis. Eur. J. Oper. Res. 2001, 130, 498–509. [Google Scholar] [CrossRef]
  36. Li, G.; Wang, P.; Pal, R. Measuring sustainable technology R&D innovation in China: A unified approach using DEA-SBM and projection analysis. Expert Syst. Appl. 2022, 209, 118393. [Google Scholar] [CrossRef]
  37. Charnes, A.; Cooper, W.W. Preface to topics in data envelopment analysis. Ann. Oper. Res. 1984, 2, 59–94. [Google Scholar] [CrossRef]
  38. Zhang, Y.J.; Hao, J.F. The evaluation of environmental capacity: Evidence in Hunan province of China. Ecol. Indic. 2016, 60, 514–523. [Google Scholar] [CrossRef]
  39. Moran, P.A.P. The interpretation of statistical maps. J. R. Stat. Soc. Ser. B (Methodol.) 1948, 10, 243–251. [Google Scholar] [CrossRef]
  40. Anselin, L. Local Indicators of Spatial Association-LISA. Geogr. Anal. 1995, 27, 93–115. [Google Scholar] [CrossRef]
  41. Yuan, J.H.; Li, X.Y.; Xu, C.B.; Zhao, C.H.; Liu, Y.X. Investment risk assessment of coal-fired powerplants in countries along the belt and road initiative based on ANP-entropy-TODIM method. Energy 2019, 176, 623–640. [Google Scholar] [CrossRef]
  42. Lüdtke, N.; Panzeri, S.; Brown, M.; Broomhead, D.S.; Knowles, J.; Montemurro, M.A.; Kell, D.b. Information-theoretic Sensitivity Analysis: A general method for credit assignment in complex networks. J. R. Soc. Interface 2008, 5, 223–235. [Google Scholar] [CrossRef]
  43. Zhang, Y.J.; Hao, J.F.; Song, J. The CO2 emission efficiency, reduction potential and spatial clustering in China’s industry: Evidence from the regional level. Appl. Energy 2016, 174, 213–223. [Google Scholar] [CrossRef]
  44. Roodman, D. How to do xtabond an introduction to difference and system GMM in Stata. Stata J. 2009, 9, 86–136. [Google Scholar] [CrossRef]
  45. Li, R.; Ramanathan, R. Exploring the relationships between different types of environmental regulations and environmental performance: Evidence from China. J. Clean. Prod. 2018, 196, 1329–1340. [Google Scholar] [CrossRef]
  46. Wang, Y.; Sun, X.; Guo, X. Environmental regulation and green productivity growth: Empirical evidence on the Porter Hypothesis from OECD industrial sectors. Energy Policy 2019, 132, 611–619. [Google Scholar] [CrossRef]
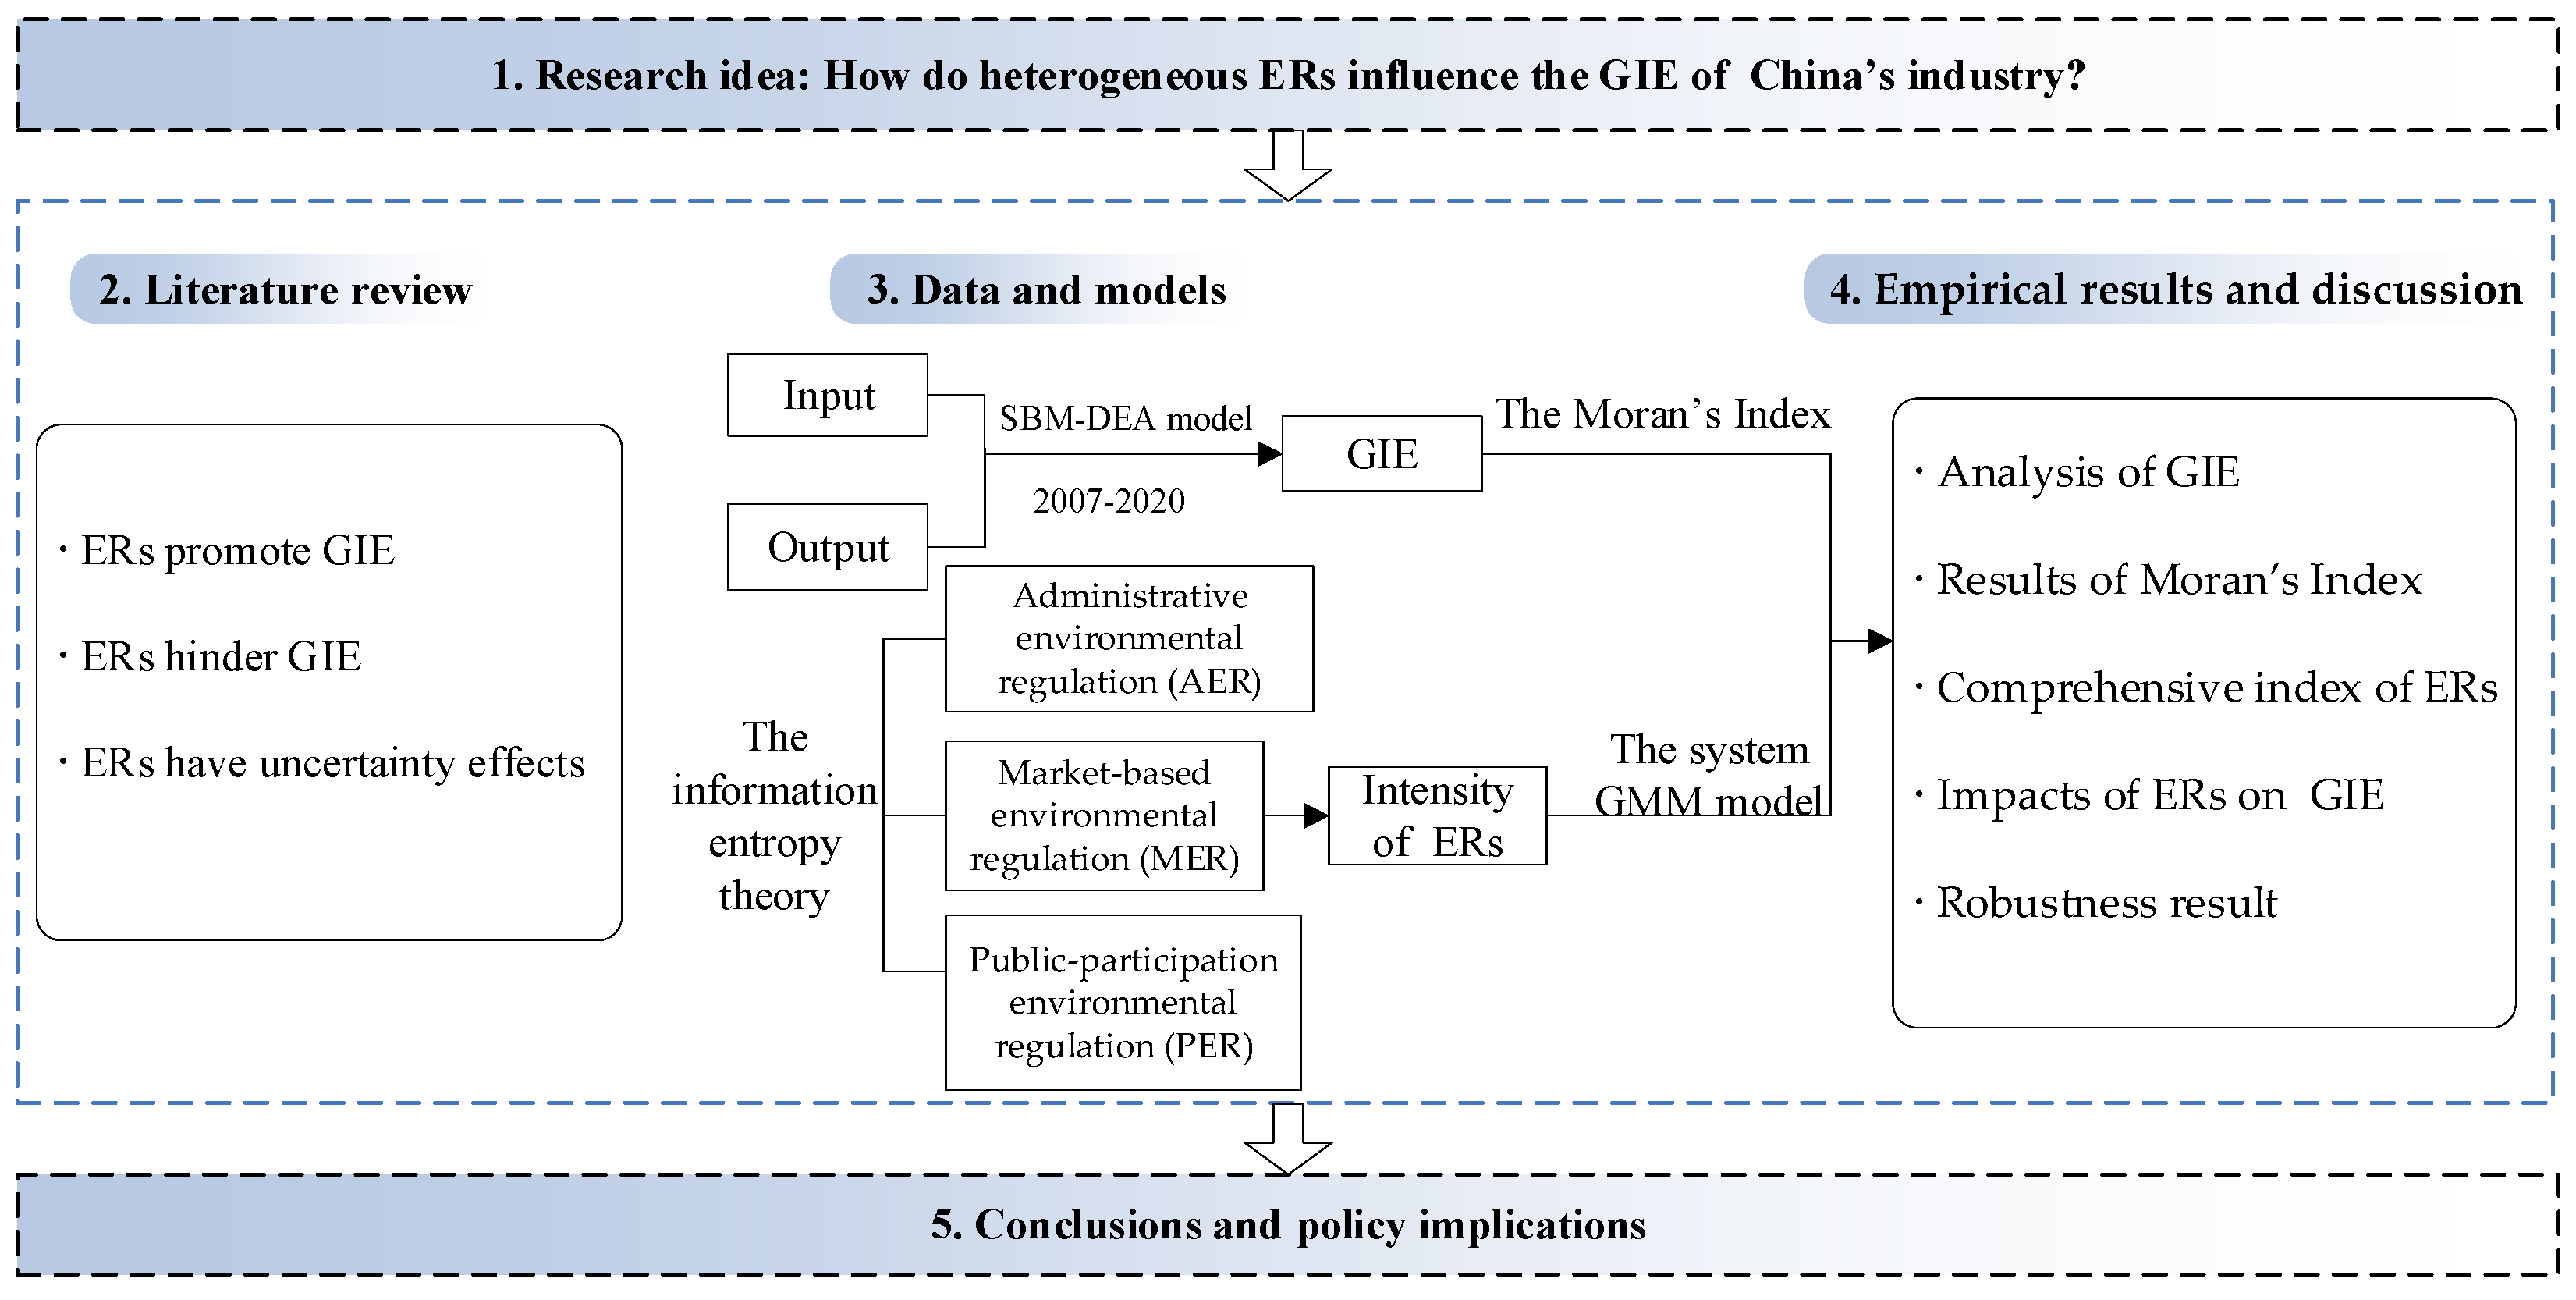
Figure 1. The research framework.
Sustainability 16 00415 g001
Figure 2. The general scheme of the proposed method.
Sustainability 16 00415 g002
Figure 3. The comparison of industrial GIE in eight regions.
Sustainability 16 00415 g003
Figure 4. The industrial GIE in China’s 30 provinces.
Sustainability 16 00415 g004
Figure 5. The Moran’s Index scatter diagram for industrial GIE. Symbols correspond to the regions listed in Table 5.
Sustainability 16 00415 g005
Figure 6. The dynamic change in ERs and GIE.
Sustainability 16 00415 g006
Table 1. Comparison of the related literature.
ReferenceImpact of ERs on GIESpatial CharacteristicsER IndexMethod
Zhang et al. [10]Uncertain×SingleSBM-DDF model
Zhang et al. [11]Uncertain×SingleNetwork DEA model;
Tobit regression model
Xu et al. [12]Positive×MultidimensionalSBM-DEA model; Threshold model
Cai et al. [13]Positive×MultidimensionalPanel counting model
Sun et al. [14]Positive×SingleMediating effect; Interaction effect
Peng et al. [15]Negative×SingleMediation and moderation analysis
Testa et al. [16]Negative×MultidimensionalRegression analysis
Hu and Liu [17]Negative×SingleSBM-DEA model
Luo et al. [18]Uncertain×SingleSystem-GMM model
Fan et al. [22]PositiveMultidimensionalSBM model; Moran’s Index
Shao et al. [23]HeterogeneousMultidimensionalMechanism analysis;
Heterogeneity analysis
This paperHeterogeneousMultidimensionalDynamic super-efficiency SBM-DEA model;
Moran’s Index;
Information entropy theory; System GMM model
Note: √ represents that the paper considers spatial characteristics, while × means not.
Table 2. The input–output index system of GIE.
CategoryIndicatorSpecific IndicatorUnit
InputCapital input R&D expenditure 10,000 CNY
R&D personnelThe full-time equivalent of R&DPerson-years
Power/Resource inputTotal electricity consumption 100 million kWh
Energy consumption 10,000 tons standard coal
OutputInnovation outputNumber of patent applications Piece
Number of new product development projects Piece
Economic outputIndustrial added value10,000 CNY
Undesirable outputIndustrial wastewater discharge10,000
tons
Industrial SO2 emissions 10,000
tons
Industrial smoke/powder dust
emissions
10,000
tons
Table 3. The comprehensive index system of ERs.
CategoryIndicatorSpecific IndicatorUnit
Administrative environmental regulation (AER)Legal perfectionNewly issued local laws and regulationsPiece
Regulatory intensityEnvironment-related administrative penalty casesPiece
Market-based environmental regulation (MER)Environmental investmentIndustrial pollution control completed investment10,000 CNY
Punitive taxAmount of sewage charges released to the treasury10,000 CNY
Public-participation environmental regulation (PER)Public participationWritten letters related to environmental problemsPiece
Government participationNumber of People’s Congress recommendations undertaken by the governmentPiece
Number of People’s Congress proposals undertaken by the governmentPiece
Table 4. Descriptive statistics of primary variables.
VariableMean Std.dev.MinMaxObsVIF
GIE0.8370.2680.1781.776420
AER0.1800.2000.000030.9524201.299
MER0.2350.2020.00050.9524202.118
PER0.2470.2020.0010.9514202.539
EDL39,563.17223,291.9557778133,781.6304201.947
IS0.4230.0830.1600.6204201.866
FDI35.81135.2820.026149.5114201.951
TMA772.614712.46927.5303458.8934204.514
Note: The VIF value between 0 and 10 indicates no multicollinearity; otherwise, multicollinearity exists. Larger values of VIF indicate more severe multicollinearity.
Table 5. The dynamic industrial green innovation efficiency in China’s 30 provinces.
RegionProvince20072008200920102011201220132014201520162017201820192020Average
Northeast ☐Heilongjiang1.0141.0171.0090.8601.0070.8201.0100.9600.5590.5170.5311.0011.0071.0220.881
Jilin0.2100.4950.5100.5410.5270.4631.0280.4890.4670.7030.7051.0371.0541.0560.663
Liaoning0.3040.4970.5590.5490.5560.5430.5210.4760.4460.5000.5310.6951.0060.7680.568
North Coast ×Beijing1.0441.0251.0281.0491.0691.0531.0651.0741.1790.9811.0111.0231.0231.0961.051
Tianjin1.0720.9450.9971.0501.0430.5020.4760.4560.3940.4240.5460.9170.9901.0660.777
Hebei1.0111.0190.5610.6160.4800.4940.4620.4490.4410.4840.5371.0131.0161.0280.686
Shandong1.0170.7371.0091.0120.8241.0070.8370.8370.6340.6320.7020.8471.0391.0420.870
East Coast +Shanghai1.2881.0251.1191.0431.0181.0481.0221.0290.8940.7691.0291.0241.0721.0361.030
Jiangsu0.4121.0090.8231.0391.0301.0321.0190.8860.7130.5920.6280.8050.7991.0180.843
Zhejiang1.0111.0211.0631.0371.0321.0771.0421.0291.0310.9711.1181.0751.0781.2651.061
South Coast ✭Fujian1.1811.0060.8811.0211.0061.0051.0090.9510.9520.8650.9050.8140.7970.8390.945
Guangdong1.0091.0151.0611.0311.0611.0361.0371.0261.0231.7001.1021.0451.0591.0571.090
Hainan1.2601.4401.0911.4181.1101.0561.1581.0510.9201.5181.1381.0111.1311.2051.179
Central ◎Shaanxi0.5141.0411.0151.0100.9221.0111.0111.0080.8230.6980.8291.0181.0041.0010.922
Shanxi0.7021.0061.7760.4841.0170.4960.4770.4180.3970.3960.6510.5051.0061.0080.739
Henan1.0071.0290.9111.0071.0051.0100.9351.0041.0081.0131.0201.0101.0101.0391.001
Inner Mongolia0.3270.3350.3750.3320.2790.2830.2710.2730.2430.2660.5821.0271.0291.0170.474
Middle Yangtze River ※Hubei1.0080.5730.6770.7640.6830.7400.7510.7050.6610.7710.8540.8410.7700.6500.746
Hunan0.2960.5440.6110.9070.7280.7620.9591.0081.0081.0110.9070.8561.0311.0630.835
Jiangxi0.6600.8700.8560.9111.0171.0161.0111.0261.0081.0261.0401.0070.7490.8230.930
Anhui1.0020.5790.6671.0320.9231.0211.0241.0301.0131.0291.0081.0300.6391.0040.929
Southwest *Yunnan0.7181.0291.0341.0310.8260.9181.0171.0140.9121.0250.8870.5360.5300.4970.855
Guizhou1.0021.0181.0251.0730.5110.5821.0271.0131.0101.0151.0091.0091.0181.0010.951
Sichuan0.6660.8420.9421.0331.0561.0311.0331.0401.0331.0601.0151.0051.0171.0180.985
Chongqing1.0161.0181.0150.8280.9351.0081.0121.0081.0300.9200.7980.6280.6060.6790.893
Guangxi0.3680.5800.5571.0860.5470.5530.5640.5700.6820.8990.7251.0170.7691.0280.711
Northwest ⊙Gansu0.5300.5020.4480.7430.5090.5260.5330.5030.4380.4370.4890.5370.4550.4810.509
Qinghai0.2750.2670.1980.1800.2040.4910.5950.6741.1860.8660.7881.2540.7351.0470.626
Ningxia0.3730.3770.3810.3690.4360.8260.4240.4100.4030.4030.3770.3300.3330.3860.416
Xinjiang0.2141.0320.9681.0131.0201.0361.0201.0380.8420.8070.9310.9421.0421.1120.930
Note: the symbols in the first column indicate different regions shown in Figure 5.
Table 6. The global Moran’s Index for 30 provinces regarding industrial GIE.
YearGlobal Moran’s IndexZ-Stat Valuep-Value
20070.2712.4310.015
20080.1531.5140.130
20090.0460.6760.499
20100.3112.8390.005
20110.1581.5550.120
20120.2792.5060.012
20130.2382.1950.028
20140.2892.5850.010
20150.3763.2800.001
20160.5965.2310.000
20170.3603.1610.002
2018−0.128−0.7730.440
20190.0350.5690.570
20200.0340.5720.567
Table 7. Global Moran’s Index for the environmental regulation intensity of 2017.
RegulationsGlobal Moran’s IndexZ-Stat Valuep-Value
AER0.0311.8320.067
MER0.1074.2240.000
PER0.0672.8370.005
Table 8. Estimation results of ERs on GIE.
Variables(4)(5)(6)(7)(8)(9)(10)(11)(12)
GIEGIEGIEGIEGIEGIEGIEGIEGIE
L.GIE0.469 ***0.660 ***−0.556 ***0.622 ***0.749 ***0.473 **0.329 ***0.826 ***0.851 ***
(0.000)(0.000)(0.000)(0.002)(0.000)(0.048)(0.004)(0.000)(0.000)
AER−0.314 **−0.294 **−2.037 ***
(0.012)(0.012)(0.001)
L.AER 0.284 *−0.182 *
(0.058)(0.086)
AER2 0.030 ***
(0.001)
MER −0.613 *−0.446 *1.273 *
(0.087)(0.070)(0.064)
L.MER −0.624−0.744 **
(0.111)(0.015)
MER2 −0.016 *
(0.052)
PER −0.0080.1090.483
(0.959)(0.517)(0.561)
L.PER 0.200 **0.213 **
(0.029)(0.044)
PER2 −0.005
(0.636)
EDL0.6122.761 ***1.1202.726 *5.292 ***4.625 **2.875 *3.722 ***3.709 ***
(0.528)(0.009)(0.715)(0.098)(0.008)(0.037)(0.063)(0.000)(0.000)
IS−0.0600.628−0.4641.412 **2.147 **1.660 **0.782 *0.664 **0.573 *
(0.863)(0.108)(0.686)(0.035)(0.030)(0.027)(0.082)(0.037)(0.061)
FDI0.0670.119 *0.0770.0980.1340.0610.0300.003−0.026
(0.435)(0.067)(0.705)(0.274)(0.562)(0.553)(0.754)(0.972)(0.756)
TMA0.007−0.0050.016 *0.0050.0010.0070.002−0.009 **−0.009 **
(0.127)(0.116)(0.070)(0.413)(0.929)(0.397)(0.608)(0.014)(0.027)
_cons43.139 **−8.968153.314 **−31.281−73.248 **−51.097 *10.326−29.364−30.843
(0.049)(0.653)(0.013)(0.338)(0.047)(0.087)(0.701)(0.193)(0.184)
AR(2) test(0.288)(0.274)(0.250)(0.340)(0.326)(0.258)(0.308)(0.299)(0.291)
Hansen test(0.226)(0.246)(0.182)(0.132)(0.214)(0.209)(0.224)(0.245)(0.217)
Note: Figures in parentheses are p values, *, ** and *** denote statistical significance levels at 10%, 5% and 1%, respectively, that is, * p < 0.1, ** p < 0.05, *** p < 0.01.
Disclaimer/Publisher’s Note: The statements, opinions and data contained in all publications are solely those of the individual author(s) and contributor(s) and not of MDPI and/or the editor(s). MDPI and/or the editor(s) disclaim responsibility for any injury to people or property resulting from any ideas, methods, instructions or products referred to in the content.