Abstract
The Paldang Reservoir (PDR), the largest artificial lake in the Republic of Korea, has recently experienced increased chemical oxygen demand (COD), eutrophication, and algal blooms due to climate change. This study aimed to analyze the hydrological characteristics and water quality of the PDR and assess its spatial and seasonal eutrophication status changes using the Korean-type trophic quality index (TSIKO) and the seasonal Mann–Kendall Test (SMK). The PDR’s water was graded “good” in terms of biochemical oxygen demand (BOD) and “fair” for COD, total phosphorous (TP), and chlorophyll-a (Chl-a), according to Korean water quality standards. COD and Chl-a had a significant positive monotonic relationship. According to the TSIKO calculations, the trophic state of the PDR was mesotrophic, but eutrophic during the summer season. TSIKO (Chl-a) in summer tended to increase with a slope value of 0.22 mg/m3/year. The main causes of eutrophication in the PDR were proposed to be TP and phytoplankton overgrowth. Therefore, lake and reservoir functions need to be assessed, and solutions that can effectively protect them from excessive eutrophication to ensure sustainable clean water use and protect freshwater ecosystems need to be found.
1. Introduction
Climate change caused by global warming has led to frequent extreme weather and hydrological phenomena that adversely affect ecosystems, economies, and human activities [1]. The regional and global impacts of climate change on reservoirs have become highly important. Reservoirs are critical resources in freshwater ecosystems that perform various functions, such as providing drinking water, regulating climate, maintaining biodiversity, and nitrate cycling [2]. However, pressure and competition for sustainable water management in reservoirs are increasingly exacerbated by human-induced factors, such as agricultural practices, urbanization, and industrialization [3]. Freshwater quality is influenced by factors such as increased chemical oxygen demand (COD) due to algal overproduction, nutrients, and incoming stormwater runoff [4]. Efficient monitoring and systematic management strategies for reservoirs are required to ensure human health, the sustainability of freshwater ecosystems, and socioeconomic development [5].
Reservoir eutrophication (EOR) has recently emerged as a major environmental issue worldwide [6]. Eutrophication is a critical aspect of nutrient management and conservation in aquatic environments. EOR negatively affects freshwater ecosystems and human health, leading to issues such as the proliferation of microbial and phytoplankton species, oxygen depletion, toxic substance production, and the generation of H2S and CH4 gases [7]. The trophic state of reservoirs is determined by the outcome of chemical and biological reactions influenced by natural factors such as weather, hydrology, and topography, as well as by various human-induced environmental factors [8]. Among the lakes in Asia, 54% were in a state of eutrophication, followed by 53% in Europe, 48% in North America, 41% in South America, and 28% in Africa [9]. In the Republic of Korea, 63% of the current reservoirs fall under mesotrophic and eutrophic categories, while 31% are hypertrophic [10]. To prevent and address EOR, it is essential to adopt efficient agricultural and wastewater treatment plant (WWTP) management practices and sustainable water management strategies and enact policies and regulations to reduce nutrient discharge.
The trophic state index (TSI) is an indicator that helps to evaluate and classify the trophic state of wetlands, rivers, lakes, and reservoirs based on nutrient concentrations and phytoplankton [11]. Governments and research institutions are actively researching various indicators and control technologies to evaluate the trophic state of freshwater ecosystems. These studies have focused not only on biological and abiotic indicators but also on numerical trophic state indicators [12]. However, determining the trophic state of reservoirs is challenging because of the regional characteristics, seasonal conditions, and variations in data collection methods [7]. Carlson’s TSI assumes algal biomass as the basis for classifying trophic states and is calculated considering aquatic ecological characteristics such as chlorophyll-a (Chl-a) concentrations, total phosphorus (TP), and Secchi depth transparency (SDT) [13]. Aizaki modified Carlson’s TSI to better fit domestic conditions, proposing a modified TSI (TSIm) [14], while Yang and Dickman proposed the lake TSI (LTSI) [15]. These evaluation indicators were developed mainly for natural lakes and may not be suitable in regions such as the Republic of Korea, where most water bodies are artificial. This is because natural lakes have a relatively small contribution from external organic materials, whereas the contribution is significantly larger in artificial lakes. Therefore, it is necessary to develop eutrophication evaluation indicators that consider diversity to accurately evaluate and monitor the trophic state of specific regional reservoirs.
The variability in hydrometeorological and water quality parameters at seasonal, annual, and monthly scales has been extensively investigated in various studies using parametric and non-parametric tests [16]. Various methods such as the Mann–Kendall (MK) test, seasonal MK (SMK) test, innovative Sen methods, Sen’s slope, and Spearman’s rho test are used to assess changes in time-series data. Non-parametric trend tests mainly provide statistical significance and trend direction. Numerous studies have used non-parametric tests to understand trends in hydrological and water quality data and water quality indicators. The MK test has been used to investigate rainfall and temperature changes in the central–northern region of Ethiopia [17], conduct hydro-climatic variable trend analysis in northwestern Iran’s Urmia lake [18], and identify trends in Turkey’s Ankara indices across the standardized precipitation index (SPI) and standardized precipitation evapotranspiration index (SPEI) [19]. The MK test is highly useful for evaluating changes occurring in datasets and determining trends in hydrological, meteorological, and water quality data across various regions worldwide.
The Paldang Reservoir (PDR) is one of the largest regional water sources in the Republic of Korea and serves as a crucial resource, providing drinking water to 27 million citizens in the Seoul metropolitan area, accounting for 52% of the Korean population [20]. The PDR performs various functions, including flood control, hydroelectric power generation, fishing activities, and recreation, as it coexists with both humans and nature [21]. To protect the water quality of the PDR, in 1998, the government designated the surrounding area as a water source protection zone, enforcing strict water quality management and regulations [22]. These measures aim to protect the water and ecosystem of the PDR and provide safe drinking water for residents of the Seoul metropolitan area. As of 2023, the PDR maintains a water quality status of biochemical oxygen demand (BOD) Ia grade (≤1 mg/L, very good). However, despite various regulations and investments, an increase in COD concentration, eutrophication, and algal blooms remains an issue [23]. This is because various factors, such as rainfall, ongoing land use, climate change, human activities, and hydrological conditions, affect the water quality of the PDR [24]. Managing and conserving freshwater resources that encompass various aspects, such as the PDR, are important for a sustainable environment and society.
This study aimed to assess the hydrological changes and spatiotemporal water quality characteristics of the PDR, evaluate its spatiotemporal trophic state using a Korean-type eutrophication index, and determine the trends in TSIKO using the SMK test. This paper presents the spatiotemporal impact of eutrophication due to climate change on Korea’s largest artificial lake. Ultimately, this research will play a significant role in protecting important resources, lakes and reservoirs, in the Republic of Korea and in developing sustainable management strategies.
2. Materials and Methods
2.1. Study Area and Sites
PDR is an artificial lake located at 37°31′35.0″ N, 127°16′44.6″ E in the middle of Gyeonggi-do province and eastern part of Seoul, Republic of Korea. It was formed through Paldang Dam (PDD), completed in May 1974, and at the confluence of the South and North Han Rivers and Kyeongan Stream in Republic of Korea. PDD serves essential functions such as electricity supply, water control, flood prevention, and water resource provision [25]. The total catchment area of PDR is approximately 23,800 km2, with the South and North Han River and Kyeongan Stream basins contributing 60, 37, and 3%, respectively. PDR’s surface area is 36.5 km2, with a ratio of 652 relative to its catchment area and a mean depth of 6.7 m, making it highly susceptible to the influence of the catchment [23]. The maximum depth of the deepest part of the reservoir is approximately 25 m at the front of the dam [20]. The total storage capacity of PDR is 244 × 106 m3, and its effective storage capacity is 18 × 106 m3. The designed flood-, normal, and lowest water levels are EL. 27.00, 25.50, and 25.50 m, respectively [25]. The land use and cover distributions within the catchment are as follows: 61.2% forest, 18.6% agricultural, 8.5% meadow, 5.8% urban, 2.5% barren, 2.5% water, and 1.0% wetland [26].
Five sampling sites (PD1–PD5) within PDR were selected from the National Water Quality Monitoring Network (NWQMN) (Figure 1). The NWQMN plays a crucial role in establishing a real-time water quality monitoring system to protect and manage the water quality of major rivers and reservoirs in the country. Sites PD1 (37°30′27.72″ N, 127°25′46.62″ E) and PD3 (37°31′35.14″ N, 127°22′3.48″ E) were located at the confluence of PDR and the South Han River. Sites PD4 (37°32′28.44″ N, 127°18′38.91″ E) and PD5 (37°29′26.12″ N, 127°17′47.58″ E) were located at the confluence of the North Han River and Kyeongan Stream. Site PD2 was located 400 m upstream of PDD and represented the water quality of PDR.
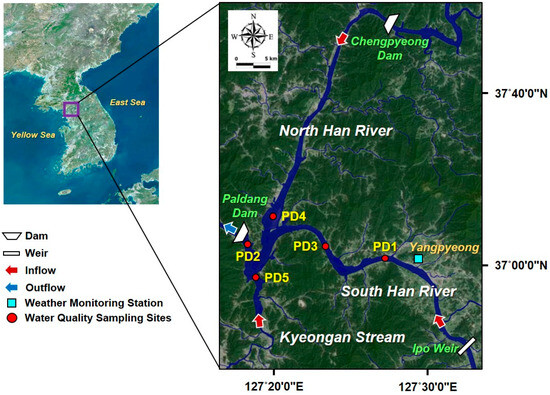
Figure 1.
Location map of the Paldang Reservoir, Republic of Korea, and the sampling sites.
2.2. Sampling and Analysis
Water samples were collected at each sampling point weekly over a 10-year period from January 2013 to December 2022. State sample size for hydrochemical analysis was 11 parameters × 559 matrix data. During the winter months, sampling was occasionally not possible because of the freezing of the reservoir. A multi-parameter water quality meter (EXO2; YSI Inc., Yellow Springs, OH, USA) and a 30 cm Secchi disk were used to measure the water temperature (WT), pH, dissolved oxygen (DO), electrical conductivity (EC), and Secchi depth transparency (SDT) in the field. At each sampling point, a water sampler (1010 Niskin Van Dorn sample bottle, 10 L; General Oceanics, Miami, FL, USA) was used to collect water samples at varying depths, including the surface layer (0–0.5 m), middle layer (middle of the maximum depth), and lower layer (0.5–1.0 m above the bottom of the maximum depth). These samples were mixed in polyethylene bottles (2 L, 3 EA) and rinsed with a 0.1 N HNO3 solution.
The mixed samples were stored in iceboxes at temperatures below 4 °C for transport to the laboratory, where the concentrations of various water quality parameters were determined. All samples were analyzed after pretreatment. BOD was determined using the dissolved oxygen consumed by aerobic microorganisms (5100 DO Instrument; YSI Inc.) after a 5-day incubation at 20 °C in an incubator (VS-3250Di; VISION Scientific, Daejeon, Republic of Korea). COD was measured using the potassium permanganate method (KMnO4, 100 °C Acid). Total suspended solids (TSS) were determined gravimetrically using a glass fiber filter (47 mm GF/C; Whatman, Maidstone, UK) after drying for 2 h at 105–110 °C. Total nitrogen (TN) and TP were measured using continuous flow analysis (AACS_VI; BLTEC Corp., Tokyo, Japan), and Chl-a was measured using a UV–visible spectrophotometer (AU/Carry 3500; Agilent Technologies, Santa Clara, CA, USA). Sample collection, preservation, and analysis followed the water pollution test standards provided by the Ministry of Environment of Republic of Korea [27]. The precision and accuracy of the water quality data were verified using a quality assurance and quality control (QA/QC) process.
2.3. Precipitation and Hydrological Data Collection
Rainfall data for the PDR basin were obtained from the Yangpyeong Weather Station of the Korean Meteorological Administration (KMA: http://www.weather.go.kr/, accessed on 17 April 2023). Hydrological data, including hydraulic residence time (HRT), inflow, and outflow, for the period from January 2013 to December 2022, were acquired from the Korean Water Resources Management Information System (WAMIS: http://www.wamis.go.kr/, accessed on 8 May 2023). HRT was defined as the reservoir-water volume divided by the inflow [28]. A total of 3652 sets of rainfall and hydrological data were collected during this period.
2.4. Data Treatment and Analysis
A Shapiro–Wilk normality test was performed to verify data normality, with the significance level set at 0.05. To investigate significant spatiotemporal differences of physicochemical and biological variables in PDR, a one-way analysis of variance (ANOVA) was conducted. The data were standardized by converting each variable’s values into Z-scores with a mean of 0 and a standard deviation of 1. These Z-scores were used in Pearson’s correlation analysis.
To assess the relationships between the physicochemical and biological variables, Pearson’s correlation coefficient (r) and probability value (p-value) were calculated using the open-source R software (ver. 4.1.0; R Foundation for Statistical Computing, Vienna, Austria). A statistical summary of the physicochemical and biological parameters was performed using SPSS software (ver. 22.0; SPSS Inc., Chicago, IL, USA). The data analysis results were visualized using Origin Pro software (ver. 2021b; OriginLab Corp., Northampton, MA, USA).
2.5. Korean-Type Trophic State Index Calculation
In this study, the trophic status of PDR was assessed using the Korean-type TSI (TSIKO) developed by the Ministry of Environment of Republic of Korea. TSIKO is a nutrient assessment tool that considers the water quality characteristics of major lakes and reservoirs in Republic of Korea and incorporates parameters such as COD as indicators of allochthonous organic matter and TP and Chl-a as indicators of autochthonous organic matter [29]. Equations (1)–(3) are empirical formulas for the water quality parameters measured in domestic lakes and reservoirs.
TSIKO (COD) = 5.8 + 64.4 log (COD mg/L)
TSIKO (TP) = 114.6 + 43.3 log (TP mg/L)
TSIKO (Chl-a) = 12.2 + 38.6 log (Chl-a mg/m3)
TSIKO was calculated using Equation (4), assigning 50% weight to COD and 25% weight to both Chl-a and TP. The computed TSIKO is categorized into four trophic states: oligotrophic (≤30), mesotrophic (31–50), eutrophic (51–70), and hypertrophic (>71).
TSIKO = 0.5 TSIKO (COD) + 0.25 TSIKO (TP) + 0.25 TSIKO (Chl-a)
2.6. Seasonal Mann–Kendall Test
In this study, the SMK test was employed to analyze long-term trends in the time-series data while accounting for seasonality. The SMK test is a non-parametric statistical method that computes Kendall’s tau rank correlation coefficient for monthly and seasonal data. This helps to statistically validate correlations among water quality data and identify tendencies, whether positive, zero, or negative [24]. The SMK test in this study was conducted using the “seasonal” package in R software. The following section outlines the procedure and calculations used in the SMK test.
- Data preparation: time-series data were grouped by month or season.
- Rank computation: the ranks of observations within each group were calculated.
- statistical computation: monthly or seasonal statistics were computed using Equation (5), where represents the monthly statistics, represents the number of years, represents the month, and represents the water quality data for that year. is an indicator representing the difference between the data of month for years and as either positive (+1), zero (0), or negative (−1).
- Statistical computation: using Equation (7), we summed all monthly statistics to compute the overall statistic.
- computation: the variance of the overall statistic, denoted as , was calculated. In this process, the grouped impact of data values was considered.
- Z-Statistic computation: the statistic and were used to calculate the Z-statistic. This was used to determine the significance of the trends.
- p-value computation: the p-value associated with the Z-statistic was calculated. The p-value indicates the significance of the trend in a seasonal context.
- Hypothesis testing: the calculated p-value was compared with the chosen significance level. If the p-value is ≥0.05 at a 95% confidence interval for both sides at the significance level (α = 0.05), accept the null hypothesis of no trend; if the p-value is <0.05, reject the null hypothesis and accept the alternative hypothesis of having a trend.
3. Results and Discussion
3.1. Precipitation and Hydrological Characteristics
We analyzed various parameters in the PDR basin, covering the period from January 2013 to December 2022, including the annual average precipitation, annual average temperature, annual average runoff, and annual average residence time (Figure 2). Over the past decade, the basin has experienced an annual average precipitation of 1243 mm. Notably, in 2022, precipitation spiked to 2143 mm, marking an approximately 1.7-fold increase over the annual average. Conversely, in 2014, the annual average precipitation was 790 mm, constituting 64% of the annual average and highlighting significant annual variations in precipitation in the PDR basin. A substantial portion (58%) of the annual average precipitation occurs during the summer months (June–September), showing characteristics of a tropical monsoon climate. The annual average temperature in the PDR basin stood at 12.5 °C, with the highest recorded yearly temperature of 13.0 °C in 2016. Seasonal temperatures ranked highest in summer (24.8 °C), followed by autumn (13.6 °C), spring (12.6 °C), and winter (−1.3 °C). Winter temperatures near the PDR typically drop below freezing, resulting in instances of reservoir freezing.
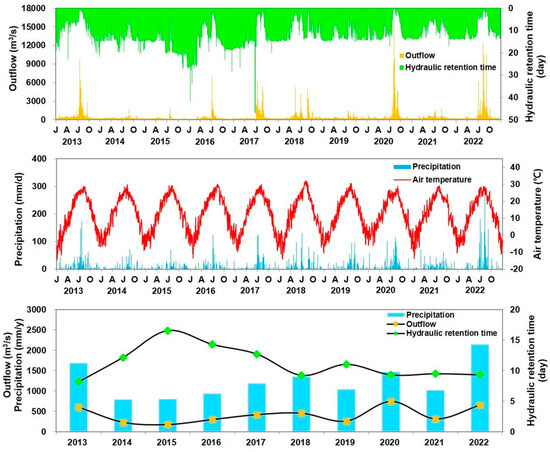
Figure 2.
Daily and yearly fluctuations of outflow, hydraulic residence time, precipitation, and air temperature in the Paldang Reservoir, Republic of Korea, from 2013 to 2022.
The annual average runoff in the PDR was 418 m3/s. In 2020, it surged to 747 m3/s, whereas in 2015, it decreased to 177 m3/s, indicating significant year-to-year variations. Additionally, the total inflow and outflow in the PDR nearly balanced, resulting in minimal annual water level variations [28]. Seasonal runoff peaked during summer (849 m3/s), followed by autumn (348 m3/s), spring (287 m3/s), and winter (189 m3/s). The annual average HRT was notably short at 11.2 days (ranging from 8.2 to 16.5 days), positioning the PDR as being occasionally classified as a river-type lake, owing to its hydrological characteristics [30]. The seasonal HRT was shortest in summer (8.3 days), followed by spring (10.6 days), autumn (11.7 days), and winter (14.5 days). The annual average runoff and HRT in the PDR are significantly influenced by precipitation and the water management practices of the upstream dams (PDD and CPD) and Ipo Weir [31]. Inflow, outflow, and HRT play pivotal roles in shaping the distribution of nutrients, suspended solids, and Chl-a in aquatic environments [32]. Globally, studies across various reservoirs have consistently demonstrated that the external loading of TP and TSS is correlated with the basin inflow, outflow, and HRT. Our study aligns with these findings, revealing a correlation between TP and HRT. However, the Chl-a concentration did not correlate with HRT (Figure 3). These outcomes suggest that HRT may not be a determining factor in algal proliferation within the PDR basin and that the release of indigenous nutrients likely governs algal growth [33].
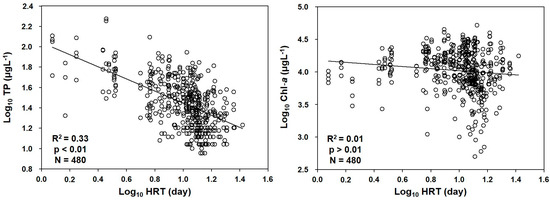
Figure 3.
Empirical relations among HRT, TP, and Chl-a. HRT, hydraulic residence time; TP, total phosphorus; Chl-a, chlorophyll-a.
3.2. Water Quality Characteristics of the Paldang Reservoir
Table S1 provides the descriptive statistics of the physicochemical and biological parameters obtained for the PDR between January 2013 and December 2022. The analysis included calculations for minima (Min), medians, maxima (Max), means, standard deviations (SD), and coefficients of variation (CV). A high SD in water quality parameters reflects spatial and seasonal variations, with a CV ranging between 0.1 and 0.8. Table 1 presents the site-specific and seasonal average water quality values and grades according to the Ministry of Environment standards. All variables, except pH and TP, exhibited significant spatial and seasonal differences (p < 0.05, one-way ANOVA), indicating the substantial influence of both natural and anthropogenic factors within the reservoir [28].

Table 1.
Water quality classes and mean values at different sites and seasons in the Paldang Reservoir, Republic of Korea, according to the water quality standards of the Ministry of Environment. All units are in mg/L, except pH and Chl-a (mg/m3).
The WT range in the PDR was 0.2–30.2 °C, with a mean and standard deviation of 15.3 ± 7.8 °C. The average WT in the PDR was 2.8 °C higher than the basin’s annual average temperature. The pH range in the PDR was 6.7–10.9, with an average pH of 8.0. As most surface waters are buffered by bicarbonate–carbonate systems, pH values typically range between five and nine [34]. Therefore, the water in the PDR exhibits mildly alkaline characteristics and is buffered by bicarbonate–carbonate systems. The range of EC values measured in the PDR was 86–389 µS/cm, with an average of 227 µS/cm, reflecting the low mineral characteristics of the reservoir water and suggesting that the water in the PDR is fresh. The DO concentration in the PDR ranged from 4.3 to 14.8 mg/L, with an average and standard deviation of 10.7 ± 2.0 mg/L. According to the Korean Ministry of Environment Water Quality Standards (EWQS) for Reservoirs and Lakes (Table S2), the DO concentration in unpolluted water ranges from 5.0 to 7.5 mg/L, and the DO levels in the PDR are classified as Grade Ia, indicating an abundance of DO and a lack of pollutants, signifying pristine conditions. The SDT values in the PDR ranged from 0.4 to 6.1 m, with an average of 1.7 m. According to the Environmental Protection Agency (EPA) [35], SDT values > 3.7 m are oligotrophic, values between 2 and 3.7 m are mesotrophic, and values < 2 are eutrophic. SDT is not only an indicator of water transparency but is also one of the simplest and most effective tools for estimating the productivity of lakes and reservoirs [36]. According to the EPA guidelines [35], SDT was classified as eutrophic at all sites except Site PD4, suggesting that the water in the North Han River has not been exposed to pollutants and is richer in oxygen than that in the South Han River and Kyeongan Stream [37]. The SDT values decreased as the concentrations of BOD, COD, TSS, TN, TP, and Chl-a increased. These results imply that reservoir water may be influenced by algal blooms and reduce reservoir productivity because of the relatively high presence of soil particles and other suspended solids.
The BOD in the PDR ranged from 0.4 to 3.9 mg/L, with an average of 1.5 mg/L. According to the Korean Ministry EWQS, BOD levels in the PDR are classified as Grade Ib, indicating that water can be used for domestic purposes after standard treatment processes, such as filtration, sedimentation, and disinfection. Unlike BOD, COD serves as an indicator of the extent of organic pollution, including both biodegradable and non-biodegradable organic matter. The COD levels in the PDR ranged from 2.3 to 7.2 mg/L, with an average of 4.1 mg/L. According to the Korean Ministry EWQS, the COD levels in the PDR are classified as Grade III, suggesting that water can be used for domestic purposes after advanced treatment. The BOD/COD ratio in the PDR was 0.4, implying that the proportion of biologically degradable organic matter was higher than that of chemically degradable matter [20]. The range of TSS concentration in the PDR was 1.0–43.4 mg/L, with an average and standard deviation of 6.0 ± 4.6 mg/L. Higher levels of particulate matter can affect the light penetration, productivity, and habitat quality of the reservoir [34].
TN and TP are important indicators in reservoirs that limit algal growth and induce eutrophication [38]. The TN concentration in the PDR ranged from 1.15 to 4.84 mg/L, with an average of 2.33 mg/L. According to the Korean Ministry EWQS, the TN levels in the PDR are classified as Grade VI. The TP concentration in the PDR ranged from 0.01 to 0.19 mg/L, with an average of 0.04 mg/L. According to the Korean Ministry EWQS, the TP levels in the PDR are classified as Grade III. The N:P ratio exceeded 17 at five sampling sites in PDR, suggesting that plankton growth may be limited by phosphorus [7]. High TP and TN concentrations can promote eutrophication, leading to the depletion of DO in reservoirs, thus necessitating rigorous water quality management [39].
Chl-a is an excellent indicator representing the total phytoplankton biomass. Additionally, the Chl-a concentration can be used to quantify the potential number of cyanobacteria in the reservoir and define its trophic state. The Chl-a concentration in the PDR ranged from 0.5 to 67.5 mg/m3, with an average value of 15.2 mg/m3. Site PD2 in the PDR operates an algal forecasting system; an alert is issued if the Chl-a concentration exceeds 15 mg/m3. Furthermore, a warning is issued when the Chl-a concentration exceeds 25 mg/m3. During the monitoring period, the algal forecasting system was activated 28 times; 27 alerts and one warning were issued. An increase in the Chl-a concentration indicates an increase in nutrient loading, which may indicate eutrophication in the aquatic ecosystem.
The water quality of the PDR varied spatiotemporally due to natural factors and anthropogenic activities. Eight variables in the PDR showed significant seasonal variations. Among these, COD, TSS, TP, and Chl-a exhibited significantly higher values during summer. Tropical monsoons have a substantial impact on hydrology, nutrients, and suspended solid concentrations in lakes and reservoirs [28]. The rainy season is associated with agricultural runoff and human activities, such as sewage and pesticide use [40]. Previous studies have reported that 73% of autochthonous organic matter loading is generated during spring, which could yield results that are somewhat divergent from those of the current study [37]. The PDR is at risk of water quality deterioration because of the influx of non-point pollution and inorganic solids as a result of heavy rainfall in summer. Additionally, if garbage is dumped underwater or not collected for an extended period, it can accumulate as sediment and generate odors. The present study suggests that autochthonous production driven by summer Chl-a plays a significant role in organic matter accumulation in the PDR. To control water quality in the PDR, it is necessary to maintain minimum levels of organic matter, phosphorus, and Chl-a during the summer.
3.3. Correlation Analysis
To assess and understand the water quality in the PDR, we evaluated the relationships among the 11 water quality parameters using a Pearson correlation matrix (p < 0.01, Figure 4). WT and DO were significantly negatively correlated (r = −0.83, p < 0.01), suggesting that DO tends to have higher solubility at lower water temperatures [41]. A significant positive correlation (r = 0.47, p < 0.01) was observed between EC and TN, attributable to the high correlation between the ionic activity and electrical properties of the substance. This reflects the impact of the WWTP wastewater inflow and the inflow of agricultural and industrial effluents [42]. A significant strong positive correlation (r = 0.86, p < 0.01) was observed between TSS and TP, suggesting that suspended particles tend to adsorb phosphorus in water and rainfall events and that periods of high discharge can contribute to high concentrations of TSS and TP in the lake [43]. Chl-a did not significantly correlate with DO, which is critical for microbial metabolism (p > 0.05). This indicates that as Chl-a concentrations increase, oxygen consumption increases because of excessive organic matter decomposition and oxygen consumption. In the lake, COD, which indicates organic pollution, significantly positively correlated with both Chl-a (r = 0.77, p < 0.01) and TP (r = 0.51, p < 0.01). This suggests that as phosphorus concentrations increase, the concentration of organic matter in the reservoir tends to increase because algae consume inorganic nutrients [44]. Such impacts can occur due to the inflow of domestic wastewater and industrial and agricultural effluents [45]. Nutrients entering the PDR along with organic matter can cause water quality issues such as algal blooms and eutrophication, necessitating appropriate measures for controlling and managing these pollution phenomena. These efforts play a critical role in maintaining the health and safety of reservoirs and aquatic ecosystems and will be helpful in identifying and addressing water quality pollution issues.
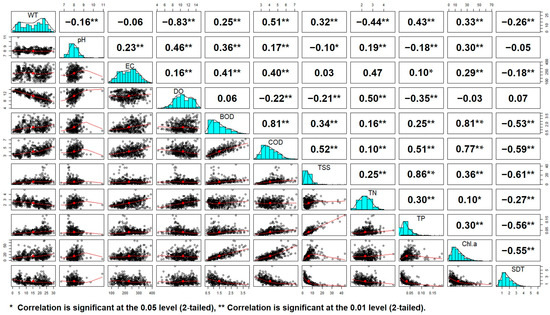
Figure 4.
Pearson correlation matrix and scatter plot between physicochemical and biological parameters in Paldang Reservoir, Republic of Korea.
3.4. Trophic State Index
Table 2 presents the descriptive statistics for the TSIKO collected from the five sites from January 2013 to December 2022. The CV was between 0.1 and 0.2, indicating that the monthly TSIKO was not significantly dispersed and did not limit the use of parameter tests for trend analysis. In other words, sufficient variability existed to perform a trend analysis, even if the data did not show significant fluctuations. This enhances the reliability of the data and aids in identifying trends and patterns.
Table 2.
Mean values of the Korean-type trophic state index of five sampling sites in Paldang Reservoir, Republic of Korea. Oligotrophic: ≤30; mesotrophic: 31–50; eutrophic: 51–70; hypertrophic: >71.
Based on the trophic state evaluation of the PDR, the calculated TSIKO revealed that the PDR was at the mesotrophic level. The TSIKO (Chl-a) value for the PDR was 54, indicating a eutrophic level, while the TSIKO (TP) and TSIKO (COD) values were 49 and 44, respectively, indicating a mesotrophic level (Figure 5). During the monitoring period, mesotrophic appeared to be the most abundant, at 62% overall, followed by eutrophic at 36%. Overall, oligotrophs were relatively low at 2%, and hypertrophy did not occur during the monitoring period (Figure 6).
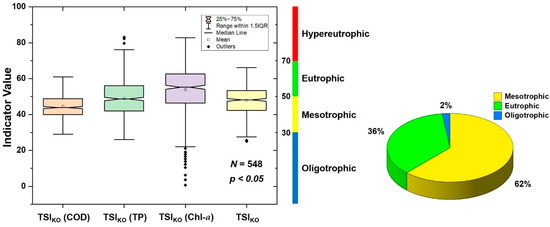
Figure 5.
Box plot of TSIKO (COD), TSIKO (TP), TSIKO (Chl-a), TSIKO, and distribution of nutritional status in Paldang Reservoir, Republic of Korea, from 2013 to 2022. TSI, trophic state index; COD, chemical oxygen demand; TP, total phosphorous; Chl-a, chlorophyll-a.
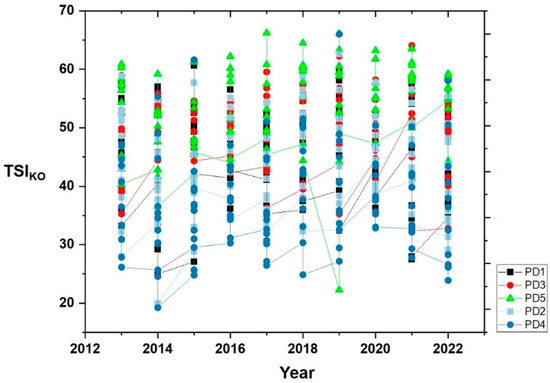
Figure 6.
Annual TSIKO distribution at the five sampling sites in Paldang Reservoir, Republic of Korea, from 2013 to 2022. TSI trophic state index.
According to the spatial TSIKO results, all sites except PD5 exhibited mesotrophic. Site PD5 had a TSIKO value of 53 and was classified as eutrophic, with the highest TSIKO value among the sites (Figure S2). This was followed by PD3 (50), PD1 (47), PD2 (46), and PD4 (42). Site PD2 should maintain a trophic state between oligotrophic and mesotrophic for drinking-water purposes, according to the guidelines of the EPA and the Korean Ministry of Environment. Site PD5 maintained a eutrophic state in all periods except in 2014 and 2015. Sites PD1, PD2, and PD4 maintained a mesotrophic state throughout all periods, whereas site PD3 showed a mesotrophic state in all periods except 2018, when it was eutrophic. The TSIKO (COD) of the PDR was classified as mesotrophic at all sites during the monitoring period. These findings suggest that the reduction in COD concentrations in the PDR basin could be attributed to a combination of various factors, including improvements in wastewater treatment plants, a reduction in industrial waste discharge, an enhancement of living environments, and environmental policies and regulations. However, TSIKO (TP) and TSIKO (Chl-a) showed spatial heterogeneity and were classified between mesotrophic and eutrophic levels. These results are consistent with those of previous studies on nutrient classification in the PDR [28]. Mamun et al. [37] reported that the main sources of nutrients in the PDR area were urban sewage and livestock manure. Therefore, to effectively control the eutrophication of the PDR, water quality management and measures for TP and Chl-a must be established.
In the current study, the data collected to determine the eutrophication index of the PDR were categorized into spring (March–May), summer (June–August), autumn (September–November), and winter (December–February) to account for seasonal effects. The trophic state of the PDR showed seasonal variations based on TSI (COD), TSI (TP), and TSI (Chl-a) (Figure 7).
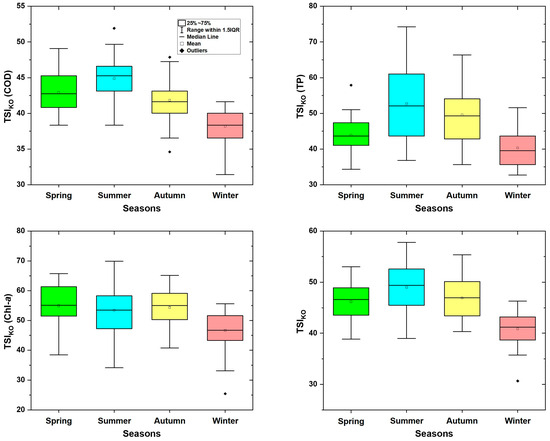
Figure 7.
Seasonal TSIKO (COD), TSIKO (TP), TSIKO (Chl-a), and TSIKO of Paldang Reservoir, Republic of Korea. TSI, trophic state index; COD, chemical oxygen demand; TP, total phosphorous; Chl-a, chlorophyll-a.
These findings were similar to those of previous studies on the trophic status of reservoirs in Republic of Korea [46]. The seasonal TSIKO of PDR was classified as eutrophic in summer and mesotrophic in other seasons. The TSIKO values were highest in summer (52), followed by spring (49), autumn (47), and winter (41). Given that Republic of Korea is characterized by a tropical monsoon climate with heavy summer rainfall, it is presumed that the nutrients that flow after concentrated rainfall not only persist for a long time within the PDR but also benefit from rising water temperatures and increased solar radiation, which create optimal conditions for algal growth.
TSIKO (COD) was classified as mesotrophic in all seasons, while TSI (TP) was classified as eutrophic in summer and mesotrophic in other seasons. TSI (Chl-a) was classified as eutrophic in all seasons except winter. The mesotrophic level of the PDR was dominant in winter (89%), with the lowest proportion occurring during summer (38%). The eutrophic level of the PDR was highest in summer (62%) and lowest in winter (6%). Summer eutrophication in the PDR can be attributed to multiple factors, such as the inflow of high-nutrient substances, agricultural activities, climatic conditions, and water circulation. These multiple factors can interact to induce summer eutrophication in the PDR, potentially leading to reservoir-water quality issues. To address these issues, management measures, such as agricultural and wastewater treatment, are necessary, and water quality monitoring and management are crucial.
Therefore, TSIKO can yield results that consider the diverse environmental conditions of various lakes and reservoirs in Republic of Korea, thus aiding in considering the unique environmental characteristics compared with the general eutrophication indices used globally. This index can also be utilized in various applications, such as water quality monitoring, fisheries’ management, and the development of environmental policies and regulations, thereby contributing to eutrophication management and sustainable environmental conservation. Thus, the present study provides an important tool for water quality and environmental management in the Republic of Korea.
3.5. The Seasonal Mann–Kendall Test of TSIKO
To conduct a quantitative trend analysis of TSIKO over the 10-year period from 2013 to 2022, a SMK test was performed at the five sampling sites in the PDR. Table 3 presents the results of the evaluation. Based on the results of the SMK test, trends were categorized as up-, down-, or no trend.
Table 3.
Seasonal Mann–Kendall test results for TSIKO at the five sampling sites in Paldang Reservoir, Republic of Korea, from 2013 to 2022.
Here, the term “slope” represents the seasonal Kendall slope statistic, which signifies the magnitude of the change. According to the SMK test results for TSIKO, no significant statistical trends (p > 0.10) were observed at any sampling sites in the PDR except PD5, indicating no increasing or decreasing trends. In contrast, TSIKO at site PD5 showed a significant trend with a p-value < 0.01 and a slope value of 0.22, indicating an increasing trend. The increasing trend of TSIKO at site PD5 can be attributed to various factors and is influenced by the natural environment and human activity. Recently, rapid urbanization has occurred around the Kyeongan Stream area, and wastewater discharge from agricultural and industrial activities may have contributed to an increase in the eutrophication index [20]. This suggests that site PD5 could have a significant impact on EOR, indicating the need for regular monitoring. The trends observed at individual reservoir sites may not always accurately reflect the characteristics of the entire reservoir [24]. Although no trends were observed in TSIKO at site PD1, TSIKO (Chl-a) showed a decreasing trend with a slope value of −0.11 mg/m3/year. In contrast, no trend was observed for TSIKO levels at PD4. However, TSIKO (Chl-a) showed an increasing trend with a slope value of 0.11 mg/m3/year. This is likely due to recent climate change, including rising temperatures and insufficient rainfall. Additionally, algal blooms in human-affected states are activated by nutrients. According to the SMK test, more than 60% of the 60 major reservoirs in the country showed significant trends. A trend analysis for assessing water quality in these target areas can be useful for understanding long-term water quality changes, thereby developing effective water management strategies and new plans.
Using the SMK test to analyze the seasonal trends of TSIKO in the PDR, no statistical significance (p > 0.10) was observed in any season, indicating no noticeable trends (Table S2). However, during summer in the PDR, TSIKO (Chl-a) showed an increasing trend, with a slope value of 0.22 mg/m3/year. These results suggest that if eutrophication progresses in the reservoir, plankton numbers may increase, potentially leading to elevated BOD and COD concentrations. Through this study, we confirmed that the SMK test can be a useful tool for evaluating trends, considering the seasonality and temporal variability of the data.
4. Conclusions
Excessive nutrient inputs have long been known to affect the eutrophication status of reservoirs and lead to frequent harmful algal blooms. Temperature, rainfall, and discharge in the PDR peaked in summer, whereas HRT recorded its lowest levels. These results were attributed to the increased inflow of summer rainfall and the hydrological conditions maintained for reservoir-water levels, owing to upstream dam and weir operations. The annual rainfall in the PDR showed significant variation, with 58% of the annual average rainfall occurring during the summer months (June–September), indicating a tropical monsoon climate. The water quality in the PDR, excluding TN, met the average grade (III) or higher, according to the Korean Ministry EWQS. COD showed significant positive correlations with both Chl-a (r = 0.77, p < 0.01) and TP (r = 0.51, p < 0.01). The N:P ratio in the PDR water exceeded 17, indicating that phosphorus was the limiting nutrient. The water quality status in the PDR, depending on the season, showed that autochthonous production due to Chl-a plays an important role in organic matter accumulation during the summer. The nutritional status of the PDR using TSIKO was at a mesotrophic level, and TSIKO (TP) and TSIKO (Chl-a) showed spatial heterogeneity (mesotrophic–eutrophic). Seasonal TSIKO was classified as eutrophic during the summer months (June–August) but remained at mesotrophic levels in other seasons. In the TSIKO trend analysis using the SMK test, no trends were observed at any site except for site PD5, which showed an increasing trend. Moreover, no TSIKO trends appeared in any season, although TSIKO (Chl-a) showed an increasing trend during the summer. To effectively control eutrophication in the PDR, appropriate measures are needed to manage the quality of organic matter, nutrients, and Chl-a and effectively control the amount of phytoplankton during the summer.
In this study, a number of advantages and disadvantages were identified. TSIKO, developed by the Ministry of Environment of Republic of Korea, proved to be effective in quantifying the extent of eutrophication in reservoirs and has provided valuable insights into the problem of eutrophication. We also confirmed that the SMK test can be a useful tool for evaluating trends, taking into account the seasonality and temporal variability of the data. Due to data restrictions caused by reservoir freezing, we were unable to evaluate winter season characteristics with any degree of accuracy. Therefore, in order to accurately quantify seasonal eutrophication in the PDR, future research should take into account the limitations of this study. This study shows how useful it is to evaluate and forecast spatiotemporal eutrophication characteristics for the PDR’s sustainable water quality management strategies.
Supplementary Materials
The following supporting information can be downloaded at: https://www.mdpi.com/article/10.3390/su16010373/s1, Figure S1: Yearly variation of COD, and Chl-a parameters in the Paldang Reservoir, Republic of Korea. (a): Site PD1; (b): Site PD2; (c): Site PD3; (d): Site PD4; (e): Site PD5. Figure S2: Trophic state index map of the Paldang Reservoir, Republic of Korea. Table S1: Statistical summary of physicochemical and biological parameters in the Paldang Reservoir, Republic of Korea. All units are in mg/L, except WT (°C), pH, EC (µS/cm), SDT (m), and Chl-a (mg/m3); Table S2: Seasonal TSIKO trends according to the seasonal Mann–Kendall test.
Author Contributions
Conceptualization, Y.-C.C. and J.-K.I.; methodology, Y.-C.C., H.-Y.K. and J.-Y.S.; software, Y.-C.C.; validation, Y.-C.C., H.-Y.K. and J.-Y.S.; formal analysis, Y.-C.C. and J.-K.I.; investigation, Y.-C.C., H.-Y.K. and J.-Y.S.; resources, T.K.; data curation, Y.-C.C. and J.-K.I.; writing—original draft preparation, Y.-C.C. and J.-K.I.; writing—review and editing, Y.-C.C., H.-Y.K., J.-Y.S., T.K. and J.-K.I.; visualization, Y.-C.C.; supervision, T.K.; project administration, T.K.; funding acquisition, T.K. All authors have read and agreed to the published version of the manuscript.
Funding
This research was supported by the National Institute of Environmental Research (NIER) [grant number NIER-2023-01-01-110], funded by the Ministry of Environment (MOE) and Environmental Fundamental Data Examination Project of Han River Basin Management Committee of the Republic of Korea.
Institutional Review Board Statement
Not applicable.
Informed Consent Statement
Not applicable.
Data Availability Statement
The data presented in this study are available on request from the corresponding author.
Conflicts of Interest
The authors declare no conflict of interest.
References
- Crosbie, R.S.; Scanlon, B.R.; Mpelasoka, F.S.; Reedy, R.C.; Gates, J.B.; Zhang, L. Potential climate change effects on groundwater recharge in the High Plains aquifer, USA. Water Resour. Res. 2013, 49, 3936–3951. [Google Scholar] [CrossRef]
- Ding, L.; Li, Q.; Tang, J.; Wang, J.; Chen, X. Linking Land Use Metrics Measured in Aquatic–Terrestrial Interfaces to Water Quality of Reservoir-Based Water Sources in Eastern China. Sustainability 2019, 11, 4860. [Google Scholar] [CrossRef]
- Li, P.; Tian, R.; Xue, C.; Wu, J. Progress, opportunities and key fields for groundwater quality research under the impacts of human activities in China with a special focus on western China. Environ. Sci. Pollut. Res. 2017, 24, 13224–13234. [Google Scholar] [CrossRef]
- Zhou, Z.; Huang, T.; Gong, W.; Li, Y.; Liu, Y.; Zhou, S.; Cao, M. Water Quality Responses during the Continuous Mixing Process and Informed Management of a Stratified Drinking Water Reservoir. Sustainability 2019, 11, 7106. [Google Scholar] [CrossRef]
- Duan, W.; He, B.; Nover, D.; Yang, G.; Chen, W.; Meng, H.; Zou, S.; Liu, C. Water Quality Assessment and Pollution Source Identification of the Eastern Poyang Lake Basin Using Multivariate Statistical Methods. Sustainability 2016, 8, 133. [Google Scholar] [CrossRef]
- Xia, R.; Zhang, Y.; Wang, G.; Zhang, Y.; Dou, M.; Hou, X.; Qiao, Y.; Wang, Q.; Yang, Z. Multi-factor identification and modelling analyses for managing large river algal blooms. Environ. Pollut. 2019, 254, 113056. [Google Scholar] [CrossRef]
- Domysheva, V.; Vorobyeva, S.; Golobokova, L.; Netsvetaeva, O.; Onischuk, N.; Sakirko, M.; Khuriganova, O.; Fedotov, A. Assessment of the Current Trophic Status of the Southern Baikal Littoral Zone. Water 2023, 15, 1139. [Google Scholar] [CrossRef]
- Selman, M.; Greenh, S. Eutrophication: Sources and drivers of nutrient pollution. Renew. Resour. J. 2010, 26, 19–26. [Google Scholar]
- Ansari, A.A.; Gill, S.S.; Khan, F.A. Eutrophication: Threat to Aquatic Ecosystems. In Eutrophication: Causes, Consequences and Control; Ansari, A.A., Singh Gill, S., Lanza, G.R., Rast, W., Eds.; Springer: Dordrecht, The Netherlands, 2010; pp. 143–170. ISBN 978-90-481-9624-1. [Google Scholar]
- Kwon, Y.S.; Bae, M.J.; Kim, J.S.; Kim, Y.J.; Kim, B.H.; Park, Y.S. Characterizing changes of water quality and relationships with environmental factors in the selected Korean reservoirs. Korean J. Ecol. Environ. 2014, 47, 146–159. [Google Scholar] [CrossRef]
- Bekteshi, A.; Cupi, A. Reserved area protection use of trophic state index (Carlson, 1977) for assessment of trophic status of the Shkodra Lake. J. Environ. Prot. Ecol. 2015, 15, 359–365. [Google Scholar]
- Zhang, Y.; Li, M.; Dong, J.; Yang, H.; Van Zwieten, L.; Lu, H.; Alshameri, A.; Zhan, Z.; Chen, X.; Jiang, X. A critical review of methods for analyzing freshwater eutrophication. Water 2021, 13, 225. [Google Scholar] [CrossRef]
- Jargal, N.; Lee, E.H.; An, K.G. Monsoon-induced response of algal chlorophyll to trophic state, light availability, and morphometry in 293 temperate reservoirs. J. Environ. Manag. 2023, 337, 117737. [Google Scholar] [CrossRef]
- Ge, Y.; Liu, X.; Chen, L.; Zhang, G.; Wu, Y.; Yang, X.; Yang, J. Attribution of lake eutrophication risk to anthropogenic forcing adjacent to the agriculture areas: A case study of Chagan Lake. Environ. Sci. Pollut. Res. 2023, 30, 112159–112172. [Google Scholar] [CrossRef]
- Park, S.C.; Kim, J.O.; Lee, W.B.; Park, S.H.; Lee, S.D. Characteristics of Eutrophication of Yeongsan River area using the Trophic State Index (TSIKO). J. Wat. Treat. 2017, 25, 3–15. [Google Scholar]
- Chen, P.C.; Wang, Y.H.; You, G.J.Y.; Wei, C.C. Comparison of methods for non-stationary hydrologic frequency analysis: Case study using annual maximum daily precipitation in Taiwan. J. Hydrol. 2017, 545, 197–211. [Google Scholar] [CrossRef]
- Asfaw, A.; Simane, B.; Hassen, A.; Bantider, A. Variability and time series trend analysis of rainfall and temperature in northcentral Ethiopia: A case study in Woleka sub-basin. Weather Clim. Extrem. 2018, 19, 29–41. [Google Scholar] [CrossRef]
- Nourani, V.; Danandeh, M.A.; Azad, N. Trend analysis of hydroclimatological variables in Urmia lake basin using hybrid wavelet Mann–Kendall and Şen tests. Environ. Earth Sci. 2018, 77, 207. [Google Scholar] [CrossRef]
- Mehr, A.D.; Vaheddoost, B. Identifcation of the trends associated with the SPI and SPEI indices across Ankara, Turkey. Theor. Appl. Clim. 2020, 139, 1531–1542. [Google Scholar] [CrossRef]
- Cho, Y.C.; Im, J.K.; Han, J.; Kim, S.H.; Kang, T.; Lee, S. Comprehensive Water Quality Assessment Using Korean Water Quality Indices and Multivariate Statistical Techniques for Sustainable Water Management of the Paldang Reservoir, South Korea. Water 2023, 15, 509. [Google Scholar] [CrossRef]
- Boopathi, T.; Wang, H.; Lee, M.D.; Ki, J.S. Seasonal Changes in Cyanobacterial Diversity of a Temperate Freshwater Paldang Reservoir (Korea) Explored by using Pyrosequencing. Environ. Biol. Res. 2018, 36, 424–437. [Google Scholar] [CrossRef]
- Song, C.M. Analysis of the Effects of Local Regulations on the Preservation of Water Resources Using the CA-Markov Model. Sustainability 2021, 13, 5652. [Google Scholar] [CrossRef]
- Sim, Y.; Byeon, M.S.; Kim, K.; Yu, S.J.; Im, J.K. Influence of Zooplankton and Environmental Factors on Clear-Water Phase in Lake Paldang, South Korea. Int. J. Environ. Res. Public Health 2021, 18, 7205. [Google Scholar] [CrossRef] [PubMed]
- Yu, S.J.; Son, J.Y.; Kang, H.Y.; Cho, Y.C.; Im, J.K. Effects of Long-Term Increases in Water Temperature and Stratification on Large Artificial Water-Source Lakes in South Korea. Water 2021, 13, 2341. [Google Scholar] [CrossRef]
- Ryu, I.; Yu, S.; Chung, S. Characterizing Density Flow Regimes of Three Rivers with Different Physicochemical Properties in a Run-Of-The-River Reservoir. Water 2020, 12, 717. [Google Scholar] [CrossRef]
- Kim, D.Y.; Park, S.H.; Song, C.M. Evaluation of Water Social Service and Comprehensive Water Management Linked with Integrated River Evaluation. Water 2021, 13, 706. [Google Scholar] [CrossRef]
- Ministry of Environment (MOE). Official Testing Method with Respect to Water Pollution Process; National Institute of Environmental Research (NIER): Incheon, Republic of Korea, 2018. [Google Scholar]
- Mamun, M.; Kim, J.Y.; An, K.G. Multivariate Statistical Analysis of Water Quality and Trophic State in an Artificial Dam Reservoir. Water 2021, 13, 186. [Google Scholar] [CrossRef]
- Lee, S.; Park, J.R.; Joo, J.C.; Ahn, C.H. Application of WQIEUT and TSIKO for comprehensive water quality assessment immediately after the construction of the Yeongju Multipurpose Dam in the Naeseong Stream Basin, Republic of Korea. Sci. Total Environ. 2022, 819, 152997. [Google Scholar] [CrossRef]
- Choi, H.; Ryu, I.; Park, M.; Song, Y.; Yu, S. Analysis of the Water Circulation Structure in the Paldang Reservoir, South Korea. Appl. Sci. 2020, 10, 6822. [Google Scholar] [CrossRef]
- Son, J.Y.; Park, J.R.; Noh, H.R.; Yu, S.J.; Im, J.K. Seasonal Characteristics of thermal and chemical stratification in Lake Paldang. J. Korean Soc. Water Environ. 2020, 36, 1–13. [Google Scholar]
- Nadarajah, S.; Wijenayake, W.M.H.K.; Amarasinghe, U.S. Influence of hydrology on water quality and trophic state of irrigation reservoirs in Sri Lanka. Lakes Reserv. Res. Manag. 2019, 24, 287–298. [Google Scholar] [CrossRef]
- Lee, Y.; Ha, S.Y.; Park, H.K.; Han, M.S.; Shin, K.H. Identification of key factors influencing primary productivity in two river-type reservoirs by using principal component regression analysis. Environ. Monit. Assess. 2015, 187, 1–12. [Google Scholar] [CrossRef] [PubMed]
- Collins, K.T. Integrating water quality indices and multivariate statistical techniques for water pollution assessment of the Volta Lake, Ghana. Sustain. Water Resour. Manag. 2021, 7, 71. [Google Scholar]
- Environmental Protection Agency (EPA). An Approach to a Relative Trophic Index System for Classifying Lakes and Reservoirs; Working paper No. 24. US Environmental Protection Agency, National Eutrophication Survey. Working Paper Series; National Service Centre for Environmental Publications (NSCEP): Cincinnati, OH, USA, 1974. [Google Scholar]
- Li, T.; Zhu, B.; Cao, F.; Sun, H.; He, X.; Liu, M.; Gong, F.; Bai, Y. Monitoring changes in the transparency of the largest reservoir in eastern China in the past decade, 2013–2020. Remote Sens. 2021, 13, 2570. [Google Scholar] [CrossRef]
- Mamun, M.; Ferdous, J.; An, K.G. Empirical Estimation of Nutrient, Organic Matter and Algal Chlorophyll in Drinking Water Reservoir Using Landsat 5 TM Data. Remote Sens. 2021, 13, 2256. [Google Scholar] [CrossRef]
- Sener, S.; Davraz, A.; Karaguzel, R. Evaluating the anthropogenic and geologic impacts on water quality of the Egirdir Lake, Turkey. Environ. Earth Sci. 2013, 70, 2527–2544. [Google Scholar] [CrossRef]
- Sener, S.; Sener, E.; Davraz, A. Evaluation of water quality using water quality index (WQI) method and GIS in Aksu River (SW-Turkey). Sci. Total Environ. 2017, 584–585, 131–144. [Google Scholar] [CrossRef]
- Park, H.K.; Cho, K.H.; Won, D.H.; Lee, J.; Kong, D.S.; Jung, D. Il Ecosystem responses to climate change in a large on-river reservoir, Lake Paldang, Korea. Clim. Chang. 2013, 120, 477–489. [Google Scholar] [CrossRef]
- Naveesullah, N.; Hashmi, M.Z.; Yu, C.; Shen, C.; Muhammas, N.; Shen, H.; Chen, Y. Water quality characterization of the Siling Reservoir (Zhejiang, China) using water quality index. Clean. Soil. Air. Water 2016, 44, 553–562. [Google Scholar] [CrossRef]
- Ustaoglu, F.; Tas, B.; Tepe, Y.; Topaldemir, H. Comprehensive assessment of water quality and associated health risk by using physicochemical quality indices and multivariate analysis in Terme River, Turkey. Environ. Sci. Pollut. Res. 2021, 28, 62736–62754. [Google Scholar] [CrossRef]
- Fox, G.A.; Purvis, R.A.; Penn, C.J. Streambanks: A net source of sediment and phosphorus to streams and rivers. J. Environ. Manag. 2016, 181, 602–614. [Google Scholar] [CrossRef]
- Atique, U.; An, K.G. Landscape heterogeneity impacts water chemistry, nutrient regime, organic matter and chlorophyll dynamics in agricultural reservoirs. Ecol. Indic. 2020, 110, 105813. [Google Scholar] [CrossRef]
- Varol, M. Use of water quality index and multivariate statistical methods for the evaluation of water quality of a stream affected by multiple stressors: A case study. Environ. Pollut. 2020, 266, 115417. [Google Scholar] [CrossRef] [PubMed]
- Jung, S.; Shin, M.; Kim, J.; Eum, J.; Lee, Y.; Lee, J.; Choi, Y.; You, K.; Owen, J.; Kim, B. The effects of Asian summer monsoons on algal blooms in reservoirs. Inland Waters 2016, 6, 406–413. [Google Scholar] [CrossRef]
Disclaimer/Publisher’s Note: The statements, opinions and data contained in all publications are solely those of the individual author(s) and contributor(s) and not of MDPI and/or the editor(s). MDPI and/or the editor(s) disclaim responsibility for any injury to people or property resulting from any ideas, methods, instructions or products referred to in the content. |
© 2023 by the authors. Licensee MDPI, Basel, Switzerland. This article is an open access article distributed under the terms and conditions of the Creative Commons Attribution (CC BY) license (https://creativecommons.org/licenses/by/4.0/).