Abstract
Dockless Bike-Sharing (DBS) is an eco-friendly, convenient, and popular form of ride-sharing. Metro-oriented DBS systems have the potential to promote sustainable transportation. However, the availability of DBS near metro stations often suffers from either scarcity or overabundance. To investigate the factors contributing to this imbalance, this paper examines the nonlinear influences and interactions that impact the DBS system near metro stations, with Shenzhen, China serving as a case study. An ensemble learning approach is employed to predict the imbalance state. Then, the machine learning interpretation method (i.e., SHapley Additive exPlanations) is used to quantify the contribution of effects, discover the strength of interactions between factors and uncover their underlying interactive connections. The results indicate the influence of external factors and the relations between pairwise variables (e.g., road density and the day of the week) for each imbalanced state. Provide two quantized sets of factors that can result in the supply-demand imbalance and support future transport planning decisions to enhance the accessibility and sustainability of Metro-oriented DBS systems.
1. Introduction
Road traffic poses a significant obstacle to developing low-carbon cities worldwide due to its high carbon emissions [1]. In response, dockless Bike-Sharing (DBS) has been getting more focus in recent years due to its potential to promote greener travel habits, reduce carbon emissions, and lower energy use [2,3,4,5]. Even though issues like blocked sidewalks from parked bikes and infrequent use of helmets have been noted [6], people generally appreciate the flexibility that DBS systems offer. By the end of 2019, urban rail systems had been launched in forty cities in mainland China, with more cities planning to introduce such systems [7]. As these urban rail systems continue to grow, DBS programs can serve as a practical way for people to travel the first and last miles to and from metro stations [8], further promoting sustainability in urban transport.
However, DBS near metro stations is often scarce or overabundant, resulting in a phenomenon known as imbalance [9]. The underlying cause of this phenomenon is the imbalance between supply and demand, which predominantly occurs during peak hours. This imbalance, with its spatiotemporal characteristics, poses a challenge for the management of Metro-oriented DBS systems. Although there has been a growing interest in the combined use of DBS and metro [10], few articles have specifically investigated the factors influencing this imbalance. To fill this gap, this study aims to explore the relationship between external factors and the imbalance. This study considers three states: supply exceeding demand, demand exceeding supply, and balance. The influencing factors of each of these states are investigated.
Previous studies used linear regression models to examine the impact of the built environment on demand for DBS in metro stations [11]. According to [12], the term “built environment” includes urban design, land use, and transportation, and covers how we use physical spaces. Specifically, land use refers to the allocation and division of space for various activities such as housing, business, industry, and others. Nevertheless, these models cannot reflect the complex nonlinear influence. Machine Learning (ML) can reveal the nonlinear relationship between variables [13,14]. In addition, modern ML models due to their robustness, typically, there is no need to check for multicollinearity of variables, and boosted trees are naturally resistant to it. Although most MLs are black boxes, the eXplainable Artificial Intelligence methods can be used to interpret them technically. This paper utilized the SHapley Additive exPlanation (SHAP) method [15], which can not only effectively explain the nonlinear effects but also the interactions between variables. The SHAP values, which represent the individual contribution of features based on game theory, can be extended to interpret interaction effects using the Shapley interaction index [16].
Therefore, this study utilized the Gradient Boosting Decision Tree (GBDT) model [17,18] and SHAP method to investigate the interactive effects of factors contributing to imbalanced usage of DBS at Shenzhen metro stations. Understanding the nonlinear effects and interactions of DBS usage imbalance can provide a scientific basis for improving DBS system service, planning parking space around metro stations and increasing reallocation efficiency.
In general, the purpose of this study is to look into the nonlinear effects and interactions of the balanced/imbalanced state of DBS systems under the shuttle mode of metro stations and bike-sharing systems. The main contributions of the paper can be summarized as follows:
- Investigated the spatial distribution of balanced/imbalanced bike usage at metro stations during morning and evening peaks.
- Discovered the important factors and their interaction strengths for six scenarios by SHAP-based method.
- Quantified the nonlinear individual effects of important factors and their pairwise interaction effects.
The remainder of this paper is structured as follows. Section 2 contains a gap analysis of the relevant work. Section 3 describes the study area and data used in this study. Section 4 describes the methods. Section 5 examines the findings and analyzes them. Section 6 presents the conclusions and limitations.
2. Related Work
2.1. Metro-Oriented Dockless Bike-Sharing
In recent years, bike-sharing as a feeder mode of the metro has been getting more and more attention. Most studies in the field of factors affecting bike-sharing usage focused on trip volumes and trip distance (see Table 1). For instance, the effects of the built environment on access-integrated and egress-integrated usage during the morning and evening peak hours were investigated in [19]. The spatial variations of transfer distances between dockless bike-sharing systems and metros were explored in [20]. Another study explored the operating characteristics of dockless bike-sharing systems near metro stations using K-means clustering [21]. In the identification of transfer trips, most articles commonly employ the delineation of catchment areas around metro stations [21,22]. Some studies directly utilize data capable of identifying transfer behavior [23].

Table 1.
Relevant research on the integration of dockless bike-sharing and metros.
2.2. Imbalance of Bike-Sharing System
The imbalance of bike-sharing systems, both with docks and dockless, has been examined in previous research. For example, an investigation into the renting-returning imbalance in the bike-sharing system with docks was conducted in Nanjing [25]. Similarly, the demand-supply ratio in the bike-sharing system was analyzed in Washington DC [26]. Regarding DBS systems, the majority of studies have focused on pattern analysis [27,28], demand prediction [29], and rebalancing strategies [30]. Unbalanced usage of free-floating bike sharing in connection with metro stations was first explored in [31]. The system’s imbalance was revealed using the degree of imbalance in [32], but the underlying reasons behind this imbalance were not investigated. Therefore, this paper aims to analyze the imbalance of the bike-sharing system at metro stations, with the goal of uncovering the reasons for the DBS imbalance.
2.3. Interactive Effects of Factors on Bike-Sharing Usage
There are some papers that have studied the interactive effects of built environment factors on bike-sharing. Some used geographical detector models to find interactively pairwise built environment factors. The basic principle is to calculate the variance and covariance of variables within each geographic unit, and then analyze the spatial variability and correlation of different variables to identify interactions [33,34]. This method is restricted to geographic variables and cannot provide detailed explanations of non-linear interactions. Interpretable machine learning was utilized to investigate the nonlinear and interactive effects of correlated built environment factors on the usage of shared mobility [35]. To the best of our knowledge, this is the first comprehensive investigation of the factors influencing the imbalanced state of metro-oriented bike-sharing systems. Our method can not only provide specific interaction values for diverse variables but also explore interactions between variables by interpreting non-linear GBDT models.
In conclusion, some gaps in the field merit attention. First, the existing literature has not explored the factors that contribute to the imbalance in the usage of DBS at metro stations. Second, previous research has not investigated the interactions of variables in this mode. This paper aims to provide further evidence on the interaction of factors, addressing a gap in the existing research.
3. Study Area and Data
3.1. Study Area
Shenzhen, located on the southern coast of Guangdong Province, is one of the cities with good economic development in China. As of 2021, it has about 17.63 million permanent residents and a GDP of 3.909 trillion USD [36]. The Shenzhen Metro has likewise experienced recent significant growth. There are 237 metro stations and 11 subway lines operating in Shenzhen as of August 2021. Thus, the 237 Shenzhen metro stations are the subject of this study. The bike-sharing system, which debuted in early 2016, has developed into a crucial component of the public transportation system.
3.2. Data Sources
Eleven datasets are used in this study, including DBS data, metro passenger flow data, points of interest (POIs) data, area of interest (AOIs) data, street network data, bus transfer information data, public transportation service data, population density data, weather data, air condition data, and housing price data.
The DBS data obtained from the Shenzhen government open data platform [37] have a daily order volume of one million. Each trip record includes a unique ID, GPS position, and timestamps of the origin and destination (OD). Due to the need to connect all data sets to a one-time scale, 1 May to 30 June and 1 August to 29 August are finally selected during 2021.
The metro passenger flow data are provided by Shenzhen Metro Operation Company. The POIs data and AOIs data are obtained from BMap API in 2021 [38]. The street network data are downloaded from Open Street Map in 2021 [39]. In order to determine how many buses can transfer at each metro station, we count all the bus stations that are connected to the metro stations through the transfer information data of metro stations. The public transportation service data are derived from the Amap API interface [40]. Population density data are derived from The Seventh National Population Census. Housing price data are obtained from a platform for estate transactions in Shenzhen [41]. The Weather data and air quality data are also collected from the Shenzhen government open data platform [37].
4. Methodolgy
4.1. Methodological Framework
All datasets are cleaned and extracted to ensure uniformity in both time and space. Then, two study subjects are determined, namely, the catchment area (CA) of bike-sharing and the built environment area (BEA) around a metro station. DBS data and built environment data are filtered by the aforementioned area data. By inputting the mentioned data, we train the GBDT model, a powerful supervised ML method [18], to predict the imbalanced state of metro stations during the morning and evening peak periods. Furthermore, we apply SHAP [15], a specific ML interpretation method, to analyze and visualize the impacts of variables in different states. Specifically, feature importance (calculated by Shapley values) and SHAP interaction value are used to identify pairwise variables with strong interactive effects. Pairwise dependence plots are utilized to interpret the results. The entire procedure of this work is shown in Figure 1.
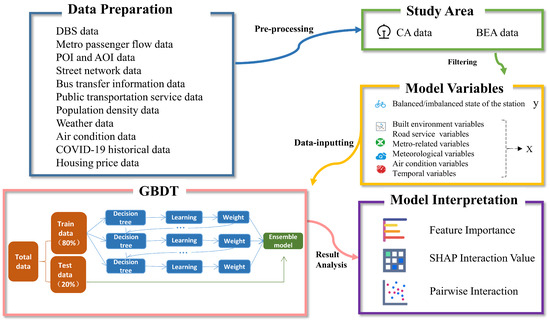
Figure 1.
Methodological framework.
4.2. Defining the Catchment of Metro Stations for Trips between Bike-Sharing System and Metros
Metros and bike-sharing programs frequently use a specific radius to define their CA. If the radius is too large, it will include many trips that are not suitable for the transfer trip. Each metro station’s 50 m buffer is used by [8] as the catchment to split transfer trips from all bike-sharing trips. However, according to our observation of the real world, many bike-sharing locations within the 50 m buffer zone overlap residential neighborhoods and other POIs. Moreover, residential POIs, entertainment POIs, and the distance to the Central Business District (CBD) significantly influence dockless bike-sharing [22]. To ensure the exclusion of trips based on other purposes, the utilization of area of interest (AOI) data, similar to POI data, is implemented. Hence, we propose a method that combines AOI data with metro station entries to accurately identify transfer trips between bike-sharing and metro systems. Figure 2 depicts the procedure for processing spatial data of the catchment problem. First, we create 50-m buffer zones for metro station entries and join the aforementioned buffer zones (see Figure 2a). Then, considering that some AOIs, including residential areas, working areas, entertainment and shopping areas, lie within the 50-m buffer zones (see Figure 2b), we remove the AOIs’ geometry data from the buffer’s geometry data (see Figure 2c).

Figure 2.
The schematic diagram of metro station’s catchment of biking-sharing systems (An example for Nanshan station).
4.3. Defining the Study Area of the Built Environment around Each Metro Station
Many articles construct a fixed buffer zone around metro stations with a certain radius to determine the study area of the built environment (BEA), but the rationality of buffer size setting has been rarely studied. A radius of 2000 m was chosen to measure the built environment attributes surrounding metro stations in [19]. Similarly, a 500 m buffer was used to capture the spatial characteristics of the trip for built environment and public transport service data in [22]. To define the buffer zones finer, a degree of overlap of the buffer zones is proposed to measure whether the study area is chosen with a certain degree of independence. The degree of overlap of the buffer zones can be defined as:
where represents the sum of the built environmental buffer area at each metro station, and is the total area of built environment buffer integration for all metro stations.
After calculation, if a 1500 m buffer zone is set, the overlap value is 2.525. We certainly expect this value to be close to 1, but if the buffer area of the built environment is too small, it cannot contain as many important features of the built environment as possible.
Therefore, we use Algorithm 1 to define the optimal buffer radius for each station. First, according to the metro line data, traverse all metro stations and find their neighbor stations. Second, calculate the length of each station and its neighboring stations and calculate the average of these lengths. The length of the buffer radius is the average distance divided by 2.
To keep the area of the study area within a certain range, the lower and upper thresholds of 400 m and 1500 m are specified. Ultimately, the degree of overlap of the buffer zones is 1.184, which greatly increases the independence of the buffer.
| Algorithm 1 Calculate the buffer radius for each station. |
|
4.4. Variables Description
4.4.1. Indicator of Dependent Variables: Access-Egress Ratio
Three-month DBS trips that start and end inside the chosen CA are selected. After the data processing procedure, we obtain a valid sample of 1,471,186 access trips and 1,480,011 egress trips in CA. In accordance with [42], due to the differences between morning and evening peaks, we select two separate models in our paper to account for these variations. We choose two representative periods of the day, the morning peak (7:00–10:00) and the evening peak (17:00–20:00).
To measure the degree of imbalance at different metro stations [32] used the absolute value of the difference between the number of bikes in and out of a predefined area to measure the imbalance degree. However, the absolute value can’t reveal the relationship between demand and supply. Furthermore, if the difference is used to measure the imbalance, the distinction of bike flow in each metro station cannot be shown. For example, the same difference between high-flow metro stations and low-flow metro stations often corresponds to two different situations. In line with [26], to capture the character of imbalanced usage of the system and show the relationship between supply and demand, we define the access-egress (A-E) ratio of metro station i during peak hours as follow:
where and are the number of bikes egress and access the metro station i during peak hours. By default, is a constant to stabilize the result.
According to , a metro station is classified as one in demand-supply balance if
where is a constant in the definition of the balance range.
4.4.2. Independent Variables
Independent variables consist of built environment variables (land use variables, road service variables, metro-related variables), meteorological variables, air condition variables, and temporal variables. In particular, land use variables include information for POIs, population density, and average housing prices. Even though many scholars have opted to use the number of POIs to measure land use, it is inappropriate for us due to the varied BEAs. The proportion of different types of POIs in each BEA is used to evaluate the land usage surrounding the metro station. Ref. [43] has reviewed mathematical formulas measuring urban land use mix widely. In this article, the Entropy Index (ENT) is used to measure the land use mix. ENT is calculated using the following formula:
where is the percentage of each POI type j in the BEA and is the number of POIs types in the BEA.
Then, the average housing price and population density for the BEA of each metro station are calculated. And, the number of shuttle buses at each metro station is described above. In order to measure the impact of road service within BEA, six variables are chosen: road density, the ratio of highway/primary, the ratio of secondary/tertiary, the ratio of footway, the ratio of cycleway, and the number of bus stops near the station.
Table 2 shows the independent variables statistics. The maximum, minimum, mean, and standard deviation of independent variables are calculated.
Table 2.
Descriptive statistics for independent variables.
4.4.3. Modeling and Experiment
In accordance with [42], due to the differences between morning and evening peaks, two separate models are selected in our paper to account for these variations. First, we randomly divide the dataset into two parts for our model test: 80% of the training set (14,280 rows) and 20% of the test set (3570 rows). To ensure the comparability of model prediction metrics, all models utilized the same training and test sets.
In this study, GBDT is used, which implements decision-tree-based ensemble learning using the gradient boosting method. Gradient boosting [17] strategy returns a more robust prediction model in the form of iterating multiple weak learners sequentially, steadily improving the model’s accuracy. We use the LightGBM [44] framework for putting into use the effective parallel training algorithm to implement GBDT. To expedite the calculation, LightGBM employs optimized feature parallel and data parallel techniques. To greatly improve the performance of models and avoid overfitting, we use a fast and lightweight auto-ML library FLAML [45] to search the appropriate hyperparameters of models. FLAML is optimized for high final performance on datasets with a large configuration search space.
Two sets of experiments are made in order to categorize the imbalance state in the morning and evening peaks. The same five models are used in each set of experiments to assess performance. We chose five evaluation metrics to evaluate the performance of multi-classification models: Accuracy (Accuracy: The ratio of correctly predicted observations to the total observations.), Precision (Precision: The ratio of correctly predicted positive observations to the total predicted positives), Recall (Recall: The ratio of correctly predicted positive observations to all observations in actual class), F1 Score (F1 Score: The weighted average of Precision and Recall), and Area under Curve (AUC) (AUC: The Area Under the Curve in a ROC chart, which plots true positive rate against false positive rate). Because about 70% of the dependent variables are in the balanced state categories as shown in Figure 3, we calculate the average value of these metrics across all classes. This macro-average method treats all classes equally, making it suitable for evaluating models in the context of multi-classification problems with imbalanced data distributions.

Figure 3.
Access-Egress (A-E) ratio.
In the same test dataset, the Multinomial Logit (MNL), K-Nearest Neighbor (KNN) classifier, Random Forest (RF) classifier, Decision Tree and GBDT models are compared. The performances of the five models are shown in Table 3. Our experiments show that the GBDT has a significantly better prediction performance in all two different peaks. It can be also found that the performance of the morning peak model is better than that of the evening peak because there is a more obvious tidal traffic phenomenon in the morning peak than in the evening peak.
Table 3.
Model performances in test dataset.
4.4.4. Model Interpretation Method
To quantify the effects of factors and their interaction on stations’ states during two periods, the Shapley-based explanation method, TreeExplainer, is employed [46] for our GBDT model. This method, based on cooperative game theory, measures additive feature importance by attributing changes in expected model predictions to each factor.
For the set F comprising all the factors, a subset S is selected, and two models are trained to extract the effect of factor i. The first explanation model is trained with factor i and the other one without it. The difference between them is calculated for each subset . The Shapley value is calculated by Equation (6).
To determine the global feature importance, we sort the average absolute Shapley values per feature across the data. This approach is preferred over traditional impurity-based importance, which is biased towards high cardinality features.
The SHAP interaction values represent the pairwise interaction attribution of features, which are used to capture the pairwise interaction effects. The SHAP interaction value can be calculated as the difference between the Shapley values of factor i with and without factor j, as shown in Equation (7). This procedure identifies the most informative relationships between input features and predicted outcomes, allowing us to better understand the model’s behavior.
5. Findings and Discussions
5.1. Description and Distributions of the Imbalance
Figure 3a shows the kernel density plot of A-E ratio. We add a smooth curve obtained using a kernel density estimate based on the histogram of morning and evening peaks. The kernel density plot can intuitively see that the distribution characteristics of the data samples themselves roughly conform to the normal distribution.
The range of the balanced state is determined by (see Equation (4)). As approaches 0 or 1, almost none or all values of the A-E ratio would be in the balance range. We could apply a chosen to for all to determine whether it is appropriate in practice and check the number of stations that are not in balance. Figure 3b gives for all in a sorted form during the morning peak and evening peak hours. Here the default is used during the morning peak and is used during the evening peak. It demonstrates that the A-E ratio of the major stations is in the demand-supply balance range. Therefore, during the morning peak, the access-egress ratio is in the range of [0.7, 1.43]. According to this range, we classify the dependent variables into three categories, i.e., , , and . During the evening peak, the access-egress ratio is in the range of [0.75, 1.33]. According to this range, we classify the dependent variables into three categories, i.e., , , and .
Next, we explore the distributions of the A-E ratio in each metro station. The following Figure 4 shows this both in the morning peak (7:00–10:00) and the evening peak (17:00–20:00). Before visualizing the access-egress ratio on the city map, we aggregate the peak hour volume in three months. In this way, based on a large amount of data, the distribution figure can show the overall characteristics of the balance/imbalance between supply and demand. Figure 4 shows the supply and demand relationship in the morning and evening peak hours. Additionally, TransBigData (A Python package) [5], a tool for processing and visualizing traffic data, is used to draw the figures.

Figure 4.
The distribution of average Access-Egress (A-E) ratio in peak hours from three months.
Three representative stations are selected to plot their average access/egress volume and the A-E ratio in three months, as shown in Figure 5. Just as [22] said, the imbalance of bike-sharing at metro stations can be more severe during peak hours. The surrounding area of a metro station, characterized by a single land-use pattern, to some extent, determines the station’s usage pattern. Specifically, residential land exhibits a higher access flow during the morning peak hours and a higher egress flow during the evening peak hours. On the other hand, commercial land shows a higher egress flow during the morning peak hours and a higher access flow during the evening peak hours. Taking Gangtou Metro Station as an example, as this area is primarily occupied by residential land, there is a high access flow in the morning peak, and the opposite is true in the evening peak, as shown in Figure 5a. The Huaqiang North Metro Station is dominated by commercial land, showing a trend of more egress flow in the morning peak and more access flow in the evening peak, as shown in Figure 5b. As for Shawei Station, the mixed land use, the passenger flow is irregular, as shown in Figure 5c. By integrating the three-month passenger flow of all stations, as shown in Figure 5d, it can be found that the flow is relatively balanced, and only serious imbalance occurs during the morning and evening peak periods. Furthermore, the imbalance during the morning peak is more severe than that during the evening peak. Therefore, the A-E ratio of the morning peak (7:00–10:00) and the evening peak (17:00–20:00) is chosen as the dependent variable. Through the balance range described above, a classification variable is determined that contains three situations of metro stations, namely, balance, more accession, and more regression.
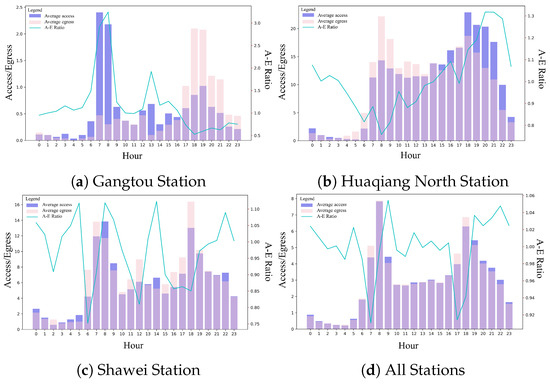
Figure 5.
Average access/egress volume and A-E ratio in a day. Light purple is the color that is formed when two colors overlap.
5.2. Independent Effects of Important Factors
The situation of no bike is removed from the data to avoid the scenario where some stations are in balance due to the absence of bike-sharing. Table 4 presents the feature importance in determining which class to choose under two different scenarios. Consistent with [42], the same conclusion is reached that the degrees of contribution of different variables are slightly different for different times of the day.
Table 4.
Summary of the key feature importance (class1/2/3, morning/evening peak).
In the model of morning peak, the top five important features are road density, footway ratio, education and culture POIs ratio, metro inbound ridership, and scenic spot POIs ratio. In the model of evening peak, the top five important features are financial service POIs ratio, road density, life service POIs ratio, education and culture POIs ratio, and Sports and leisure POIs ratio. It is generally believed that meteorological variables (e.g., rainfall, temperature) and other competitive transportation facilities (e.g., the number of buses) are the key factors affecting bike-sharing trip volume, but they have little impact on imbalance indicators.
Among them, road network density plays an important role, which has the first-highest contributions during morning peak hours and the second-highest contributions for the evening peak. Figure 6 shows a series of pie charts in the road network, each located at the centroid of a metro station. The pie charts depict the relationship between road density and imbalance state. The size of each pie chart represents the Mean (|SHAP value|), which is a variable used to quantify the importance of road density in predicting the imbalance state. The proportion of each color in the pie chart represents the state that is more likely to occur under this road network density. Specifically, we can draw the following conclusions:
- Road network density has a greater impact during the morning peak than during the evening peak.
- During the morning peak, road network density has a greater impact on suburban areas, while the city center is influenced to a great extent by other factors. As a result, all three types of states can occur.
- During the evening peak, lower road network density is more likely to lead to a balanced state.
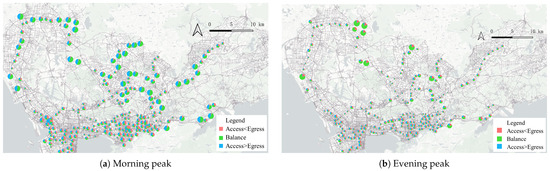
Figure 6.
Pie plot of SHAP value of road density (size of the pie charts represent Mean (|SHAP value|)).
5.3. The Strength of Interaction Effects for Important Factors
In each instance, SHAP interaction values for all feature combinations are generated using Equation (7). Then, the absolute mean values across instances are calculated to generate a 45 × 45 feature interaction matrix. The matrix reveals the contribution of each pair of factors to the model’s prediction. This interpretation method decomposes the SHAP values into main and interaction effects, with the diagonal elements representing the main effects and the off-diagonal elements indicating the interaction effects. For each category in the morning and evening peaks, the five most strongly interacting features are selected by sorting the interaction values. Figure 7 displays the interaction feature values of important features for each category in the morning and evening peak models.
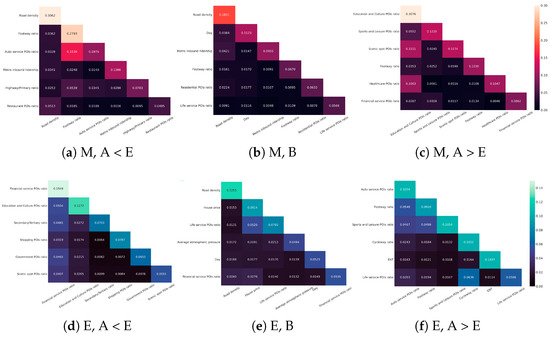
Figure 7.
Heatmap of SHAP interaction values for important features.
Based on further computation of SHAP interaction values, we found that balanced states are more likely to be influenced by the main effects of individual features, while unbalanced states are caused by the complex combination of factors. The average interaction effects of the evening peak account for 78.3% of all effects, while the morning peak accounts for 72.2%, indicating that the evening peak is more susceptible to interaction effects.
5.4. Interaction Effects of Important Combination
SHAP dependence plots consider both additional interaction effects and feature contributions, as shown in Figure 8. To emphasize potential interactions, another feature is colored according to its value, where the vertical dispersion of SHAP values is driven by interaction effects. Positive SHAP values indicate that the feature has a positive impact on the model’s classification of a certain category. Based on the result of the SHAP interaction value, eight strongly interacting bivariate variables are selected from them for further comparison. Figure 9 shows the interaction effects between two variables. The properties of the pairwise SHAP interaction values are the same as those of the single-feature SHAP values.

Figure 8.
SHAP dependence plots under six scenarios.
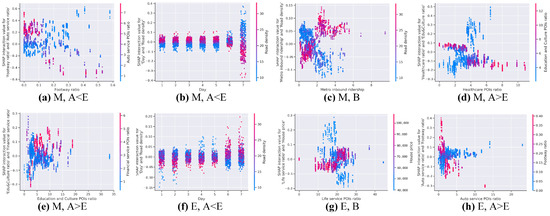
Figure 9.
SHAP interaction effects plots under six scenarios.
Figure 8a,b and Figure 9a show the scenario of Access < Egress during morning peak. When the road density exceeds 12 with a relatively high footway ratio, it leads to Access < Egress. A road density smaller than 12 seems to be associated with a low footway ratio. When the highway/primary ratio is greater than 0.42 with a low footway ratio, it is more likely to lead to Access < Egress. When the footway ratio is greater than 0.12, a low auto service POIs ratio will lead to Access < Egress, while a footway ratio smaller than 0.12 is associated with a high auto service POIs ratio leading to Access < Egress.
Figure 8d,e and Figure 9d show the scenario of Access > Egress during the morning peak. When the Sports and leisure POIs ratio above 1.9 leads to Access > Egress, and a higher Sports and leisure POIs ratio results in positive constant SHAP values. Education and culture POIs ratio below 4 leads to Access > Egress and its vertical spread is caused by other interactions. When healthcare POIs ratios exceed 3.5, Access > Egress occurs, and lower Education and culture POIs ratio promotes it.
Figure 8f and Figure 9e show the scenario of Access < Egress during the evening peak. A high shopping POIs ratio with a low financial service POIs ratio may result in Access < Egress. Education and culture POIs ratio below 4 leads to Access < Egress. Higher financial service POIs ratio can cause Access < Egress when the education and culture POIs ratio exceeds 4.
Figure 8g and Figure 9f,g show the scenario of balance during evening peak. When the house price exceeds 6000 with high road density, it causes imbalance, while when the house price is below 4000 with low road density, it results in balance. Compared with the results of Figure 9b, the interaction effect between road density and day of the week is opposite in the morning/evening peaks and on weekdays/weekends. A life service POIs ratio below 20 leads to balance, while above 20 leads to imbalance, with low house prices exacerbating this effect.
Figure 8h and Figure 9h show the scenario of Access > Egress during the evening peak. When the Sports and leisure POIs ratio is greater than 3.5, a higher footway ratio leads to Access < Egress. When the auto service POIs ratio is less than 3, a higher footway ratio leads to Access > Egress, while when the auto service POIs ratio is greater than 3, a lower footway ratio leads to Access > Egress.
6. Conclusions and Limitations
To explore the nonlinear effects and interactions on the imbalance of metro-oriented DBS, this paper employs a SHAP-based method to identify the key factors and quantify their effects on different states of metro stations. First, due to the uneven bike distribution in the city center and suburbs, most stations are balanced during the morning and evening peaks. Second, the three most important factors during the morning peak are road density, footway ratio, and education and culture POIs ratio, while during the evening peak, the three most important factors are financial service POIs ratio, road density, and life service POIs ratio. We also find that imbalanced states are more likely to be influenced by the complex combination of factors. Third, to further summarize the above results in six scenarios, we can say that the Access < Egress can occur when:
- 1.
- The road density exceeds 12 (km/km) with a relatively high footway ratio during morning peak;
- 2.
- The highway/primary ratio exceeds 0.42 with a low footway ratio during morning peak;
- 3.
- A high shopping POIs ratio with low financial service POIs ratio during evening peak;
- 4.
- Education and culture POIs ratio is below 4 and education and culture POIs ratio exceeds 4 with higher financial service POIs ratio during the evening peak.
The above situations require more attention to the timely supplement of DBS. The following situations require attention to excessive accumulation of DBS. Access > Egress can occur when:
- 1.
- The sports and leisure POIs ratio is above 1.9 and education and culture POIs ratio is below 4 with low scenic spot POIs ratio during morning peak;
- 2.
- Healthcare POIs ratios exceed 3.5 with a lower Education and culture POIs ratio during morning peak;
- 3.
- The sports and leisure POIs ratio is below 3.5 with a lower footway ratio and the sports and leisure POIs ratio is above 3.5 with a high footway ratio during evening peak;
- 4.
- The auto service POIs ratio is below 3 with a high footway ratio and the auto service POIs ratio is above 3 with a lower footway ratio during the evening peak.
The above findings can provide implications for the management of bike-sharing with metros. The city metro operation company can use land-use and road service information to make parking infrastructure planning. The shared mobility operators can better evaluate the areas and time periods that need to dispatch and manage their bike flow for the issues with dynamic and static rebalancing. Moreover, the distribution of bike sharing needs to be carefully planned if we want to increase the percentage of urban green travel. The Urban Land Planning Bureau can improve bike flow management and reduce traffic tide appearance by increasing land-use mixture.
There are some limitations to this study as well, which could lead to further investigation. First, individual private data are difficult to obtain, which may include potentially valuable information. Second, larger study areas could be included in the next research step. It is advised that future research on the imbalance of bike-sharing try to consider more private data and various factors on a more fine-grained scale. Third, the interactive analysis in this study is limited to two independent variables. Future research can explore the possibility of employing causal discovery methods to conduct interactive analysis involving multiple variables.
Author Contributions
Conceptualization, Y.S. (Yancun Song); Data curation, Y.S. (Yancun Song) and K.L.; Formal analysis, Y.S. (Yancun Song); Funding acquisition, Y.S. (Yonggang Shen); Investigation, Y.S. (Yancun Song); Methodology, Y.S. (Yancun Song) and K.L.; Resources, Y.S. (Yancun Song); Software, K.L.; Supervision, Y.S. (Yonggang Shen); Visualization, Y.S. (Yancun Song) and K.L.; Writing—original draft, Y.S. (Yancun Song); Writing—review and editing, K.L., Z.S. and L.Z. All authors have read and agreed to the published version of the manuscript.
Funding
This research was funded by ZJU-ZCCC Institute of Collaborative Innovation, grant number ZDJG2021009.
Institutional Review Board Statement
Not applicable.
Informed Consent Statement
Not applicable.
Data Availability Statement
Data available on request.
Conflicts of Interest
The authors declare that they have no known competing financial interest or personal relationship that could have appeared to influence the work reported in this paper.
References
- Kazancoglu, Y.; Ozbiltekin-Pala, M.; Ozkan-Ozen, Y. Prediction and evaluation of greenhouse gas emissions for sustainable road transport within Europe. Sustain. Cities Soc. 2021, 70, 102924. [Google Scholar] [CrossRef]
- Chen, L.; Zhang, D.; Wang, L.; Yang, D.; Ma, X.; Li, S.; Wu, Z.; Pan, G.; Nguyen, T.M.T.; Jakubowicz, J. Dynamic cluster-based over-demand prediction in bike sharing systems. In Proceedings of the UbiComp 2016, 2016 ACM International Joint Conference on Pervasive and Ubiquitous Computing, Heidelberg, Germany, 12–16 September 2016; Association for Computing Machinery: New York, NY, USA, 2016. [Google Scholar] [CrossRef]
- Yu, Q.; Zhang, H.; Li, W.; Sui, Y.; Song, X.; Yang, D.; Shibasaki, R.; Jiang, W. Mobile phone data in urban bicycle-sharing: Market-Oriented sub-area division and spatial analysis on emission reduction potentials. J. Clean. Prod. 2020, 254, 119974. [Google Scholar] [CrossRef]
- Zhang, Y.; Mi, Z. Environmental benefits of bike sharing: A big data-based analysis. Appl. Energy 2018, 220, 296–301. [Google Scholar] [CrossRef]
- Yu, Q.; Yuan, J. TransBigData: A Python package for transportation spatio-temporal big data processing, analysis and visualization. J. Open Source Softw. 2022, 7, 4021. [Google Scholar] [CrossRef]
- Kutela, B.; Langa, N.; Mwende, S.; Kidando, E.; Kitali, A.E.; Bansal, P. A text mining approach to elicit public perception of bike-sharing systems. Travel Behav. Soc. 2021, 24, 113–123. [Google Scholar] [CrossRef]
- Lin, D.; Nelson, J.D.; Beecroft, M.; Cui, J. An overview of recent developments in China’s metro systems. Tunn. Undergr. Space Technol. 2021, 111, 103783. [Google Scholar] [CrossRef]
- Li, W.; Chen, S.; Dong, J.; Wu, J. Exploring the spatial variations of transfer distances between dockless bike-sharing systems and metros. J. Transp. Geogr. 2021, 92, 103032. [Google Scholar] [CrossRef]
- Zhao, J.; Wang, J.; Deng, W. Exploring bikesharing travel time and trip chain by gender and day of the week. Transp. Res. Part C Emerg. Technol. 2015, 58, 251–264. [Google Scholar] [CrossRef]
- Hu, S.; Chen, M.; Jiang, Y.; Sun, W.; Xiong, C. Examining factors associated with bike-and-ride (BnR) activities around metro stations in large-scale dockless bikesharing systems. J. Transp. Geogr. 2022, 98, 103271. [Google Scholar] [CrossRef]
- Ni, Y.; Chen, J. Exploring the effects of the built environment on two transfer modes for metros: Dockless bike sharing and taxis. Sustainability 2020, 12, 2034. [Google Scholar] [CrossRef]
- Handy, S.L.; Boarnet, M.G.; Ewing, R.; Killingsworth, R.E. How the built environment affects physical activity: Views from urban planning. Am. J. Prev. Med. 2002, 23 (Suppl. S1), 64–73. [Google Scholar] [CrossRef] [PubMed]
- Ding, C.; Cao, X.; Næss, P. Applying gradient boosting decision trees to examine non-linear effects of the built environment on driving distance in Oslo. Transp. Res. Part A Policy Pract. 2018, 110, 107–117. [Google Scholar] [CrossRef]
- Zheng, Z.; Zhou, S.; Deng, X. Exploring both home-based and work-based jobs-housing balance by distance decay effect. J. Transp. Geogr. 2021, 93, 103043. [Google Scholar] [CrossRef]
- Lundberg, S.M.; Allen, P.G.; Lee, S.-I. A Unified Approach to Interpreting Model Predictions. Available online: https://github.com/slundberg/shap (accessed on 10 November 2023).
- Lundberg, S.M.; Erion, G.G.; Lee, S.-I. Consistent Individualized Feature Attribution for Tree Ensembles. Available online: https://arxiv.org/abs/1802.03888v3 (accessed on 10 November 2023).
- Friedman, J.H. Greedy function approximation: A gradient boosting machine. Ann. Stat. 2001, 29, 1189–1232. [Google Scholar] [CrossRef]
- Friedman, J.; Hastie, T.; Tibshirani, R. Additive Logistic Regression: A Statistical View of Boosting. Ann. Stat. 2000, 28, 337–407. [Google Scholar] [CrossRef]
- Guo, Y.; He, S.Y. Built environment effects on the integration of dockless bike-sharing and the metro. Transp. Res. Part D Transp. Environ. 2020, 83, 102335. [Google Scholar] [CrossRef]
- Li, Z.; Shang, Y.; Zhao, G.; Yang, M. Exploring the Multiscale Relationship between the Built Environment and the Metro-Oriented Dockless Bike-Sharing Usage. Int. J. Environ. Res. Public Health 2022, 19, 2323. [Google Scholar] [CrossRef]
- Li, Y.; Zhu, Z.; Guo, X. Operating characteristics of dockless bike-sharing systems near metro stations: Case study in Nanjing City, China. Sustainability 2019, 11, 2256. [Google Scholar] [CrossRef]
- Li, X.; Du, M.; Yang, J. Factors influencing the access duration of free-floating bike sharing as a feeder mode to the metro in Shenzhen. J. Clean. Prod. 2020, 277, 123273. [Google Scholar] [CrossRef]
- Kim, K. Investigation of modal integration of bike-sharing and public transit in Seoul for the holders of 365-day passes. J. Transp. Geogr. 2023, 106, 103518. [Google Scholar] [CrossRef]
- Dong, J.; Chen, S.; Li, W.; Zhou, Y.; Si, H. Evaluation of Dockless Bike-Sharing Transfer Services around Metro Stations considering Spatial Heterogeneity. J. Adv. Transp. 2022, 2022, 7732485. [Google Scholar] [CrossRef]
- He, M.; Ma, X.; Wang, J.; Zhu, M. Geographically Weighted Multinomial Logit Models for Modelling the Spatial Heterogeneity in the Bike-Sharing Renting-Returning Imbalance: A Case Study on Nanjing, China. Sustain. Cities Soc. 2022, 83, 103967. [Google Scholar] [CrossRef]
- Xie, X.F.; Wang, Z.J. Examining travel patterns and characteristics in a bikesharing network and implications for data-driven decision supports: Case study in the Washington DC area. J. Transp. Geogr. 2018, 71, 84–102. [Google Scholar] [CrossRef]
- Bi, H.; Li, A.; Hua, M.; Zhu, H.; Ye, Z. Examining the varying influences of built environment on bike-sharing commuting: Empirical evidence from Shanghai. Transp. Policy 2022, 129, 51–65. [Google Scholar] [CrossRef]
- Gao, F.; Li, S.; Tan, Z.; Liao, S. Visualizing the Spatiotemporal Characteristics of Dockless Bike Sharing Usage in Shenzhen, China. J. Geovis. Spat. Anal. 2022, 6, 12. [Google Scholar] [CrossRef]
- Chen, Z.; van Lierop, D.; Ettema, D. Travel satisfaction with dockless bike-sharing: Trip stages, attitudes and the built environment. Transp. Res. Part D Transp. Environ. 2022, 106, 103280. [Google Scholar] [CrossRef]
- Guo, R.; Jiang, Z.; Huang, J.; Tao, J.; Wang, C.; Li, J.; Chen, L. BikeNet: Accurate bike demand prediction using graph neural networks for station rebalancing. In Proceedings of the 2019 IEEE SmartWorld, Ubiquitous Intelligence and Computing, Advanced and Trusted Computing, Scalable Computing and Communications, Internet of People and Smart City Innovation, SmartWorld/UIC/ATC/SCALCOM/IOP/SCI 2019, Leicester, UK, 19–23 August 2019; pp. 686–693. [Google Scholar] [CrossRef]
- Li, L.; Li, X.; Yu, S.; Li, X.; Dai, J. Unbalanced usage of free-floating bike sharing connecting with metro stations. Phys. A Stat. Mech. Its Appl. 2022, 608, 128245. [Google Scholar] [CrossRef]
- Zheng, Z.; Chen, Y.; Zhu, D.; Sun, H.; Wu, J.; Pan, X.; Li, D. Extreme unbalanced mobility network in bike sharing system. Phys. A Stat. Mech. Its Appl. 2021, 563, 125444. [Google Scholar] [CrossRef]
- Wang, L.; Zhou, K.; Zhang, S.; Moudon, A.V.; Wang, J.; Zhu, Y.G.; Sun, W.; Lin, J.; Tian, C.; Liu, M. Designing bike-friendly cities: Interactive effects of built environment factors on bike-sharing. Transp. Res. Part D Transp. Environ. 2023, 117, 103670. [Google Scholar] [CrossRef]
- Gao, F.; Li, S.; Tan, Z.; Wu, Z.; Zhang, X.; Huang, G.; Huang, Z. Understanding the modifiable areal unit problem in dockless bike sharing usage and exploring the interactive effects of built environment factors. Int. J. Geogr. Inf. Sci. 2021, 35, 1863410. [Google Scholar] [CrossRef]
- Gao, K.; Yang, Y.; Gil, J.; Qu, X. Data-driven interpretation on interactive and nonlinear effects of the correlated built environment on shared mobility. J. Transp. Geogr. 2023, 110, 103604. [Google Scholar] [CrossRef]
- China City Statistical Yearbook; National Bureau of Statistics of China: Beijing, China, 2021.
- Shenzhen Government Open Data Platform. Available online: https://opendata.sz.gov.cn (accessed on 10 November 2023).
- BMap API. Available online: https://lbsyun.baidu.com (accessed on 10 November 2023).
- Open Street Map. Available online: https://www.openstreetmap.org (accessed on 10 November 2023).
- Amap API Interface. Available online: https://lbs.amap.com/api/webservice/summary (accessed on 10 November 2023).
- Platform for Estate Transactions in Shenzhen. Available online: https://sz.ke.com (accessed on 10 November 2023).
- Du, Y.; Deng, F.; Liao, F. A model framework for discovering the spatio-temporal usage patterns of public free-floating bike-sharing system. Transp. Res. Part C Emerg. Technol. 2019, 103, 39–55. [Google Scholar] [CrossRef]
- Song, Y.; Merlin, L.; Rodriguez, D. Comparing measures of urban land use mix. Comput. Environ. Urban Syst. 2013, 42, 1–13. [Google Scholar] [CrossRef]
- Ke, G.; Meng, Q.; Finley, T.; Wang, T.; Chen, W.; Ma, W.; Ye, Q.; Liu, T.-Y. LightGBM: A Highly Efficient Gradient Boosting Decision Tree. Available online: https://github.com/Microsoft/LightGBM (accessed on 10 November 2023).
- Wang, C.; Wu, Q.; Weimer, M.; Zhu, E. Flaml: A Fast and Lightweight Automl Library. Available online: https://github.com/microsoft/FLAML (accessed on 10 November 2023).
- Lundberg, S.M.; Lee, S.I. A unified approach to interpreting model predictions. In Proceedings of the NIPS’17: 31st International Conference on Neural Information Processing Systems, Long Beach, CA, USA, 4–9 December 2017. [Google Scholar]
Disclaimer/Publisher’s Note: The statements, opinions and data contained in all publications are solely those of the individual author(s) and contributor(s) and not of MDPI and/or the editor(s). MDPI and/or the editor(s) disclaim responsibility for any injury to people or property resulting from any ideas, methods, instructions or products referred to in the content. |
© 2023 by the authors. Licensee MDPI, Basel, Switzerland. This article is an open access article distributed under the terms and conditions of the Creative Commons Attribution (CC BY) license (https://creativecommons.org/licenses/by/4.0/).