Article

Sustainability Research of Building Systems Based on Neural Network Predictive Models and Life Cycle Assessment (LCA)–Emergy–Carbon Footprint Method

1
Zhejiang Engineering Research Center of Building’s Digital Carbon Neutral Technology, Zhejiang University City College, Hangzhou 310015, China
2
Department of Civil and Environmental Engineering, University of Delaware, Newark, DE 19716, USA
3
School of Architecture, Southeast University, Nanjing 210096, China
*
Author to whom correspondence should be addressed.
Sustainability 2024, 16(1), 329; https://doi.org/10.3390/su16010329
Submission received: 12 November 2023 / Revised: 26 December 2023 / Accepted: 27 December 2023 / Published: 29 December 2023
(This article belongs to the Special Issue Sustainable Buildings and Smart Cities)

Abstract

:
Facing the abnormal climate changes and the goal of carbon neutrality, the ecological sustainability research of building systems has become a focus of attention for experts in this field. However, the definition of sustainable buildings is broad. This article discusses the quantitative analysis of sustainable buildings from the perspectives of an ecological emergy and carbon footprint. It also establishes the long-term sustainability of buildings through predictive neural networks. The research findings indicate that the emergy and carbon emissions during the operational and materials phases dominate the entire system. The calculation and analysis of the emergy sustainability indicator (ESI) demonstrate a decreasing trend in the sustainability of the building system over three time periods (10 years, 20 years, and 30 years), with results of 0.58, 0.238, and 0.089, respectively. As the operational time increases, carbon emissions from the building system also increase, further exacerbating the pressure on the building and reducing its overall sustainability. To address this dilemma, sustainable retrofit measures have been proposed, such as rainwater harvesting and embedded applications of distributed energy sources, which reduce the burden of emergy and carbon emissions. The effectiveness of these measures has been validated in this article, demonstrating their potential to enhance building sustainability and providing references for architects and building managers.

1. Introduction

With the unprecedented changes in the climate, sustainable urban design has emerged as a favored strategy for addressing climate change [1,2]. The creation of a sustainable urban environment heavily depends on the adoption of sustainable design principles and the efficient operation of building systems. However, the concept of sustainability in ecosystems encompasses diverse definitions, and research approaches vary significantly. This study aims to investigate the sustainability of building systems by employing a dual methodology that combines ecological and carbon footprint assessments. Through this approach, valuable insights will be gained to inform sustainable practices in building and urban design [3,4,5,6].
The comprehensive research on the sustainability of building systems, which integrates ecological principles and carbon footprint methods, is still in its nascent stage due to the divergent methodologies employed. Ecological buildings prioritize the minimization of environmental impacts throughout the design, construction, and operation phases while promoting sustainable practices. They aim to protect and restore the overall ecosystem by utilizing renewable materials, enhancing energy efficiency, conserving water resources, and improving indoor environmental quality, thereby reducing their environmental footprints. The objective of ecological buildings is to create structures that are healthy, comfortable, and harmonious, coexisting with the natural environment [7,8,9]. Conversely, low-carbon buildings primarily focus on mitigating greenhouse gas emissions, particularly carbon dioxide (CO2). These buildings strive to reduce energy consumption by harnessing clean energy sources such as solar power, wind energy, or geothermal energy to fulfill the building’s energy requirements. Additionally, low-carbon buildings achieve energy efficiency and lower carbon emissions through optimized material selection and usage, as well as improved heating, ventilation, and air conditioning systems, among other measures [10,11,12].
While both ecological buildings and low-carbon buildings share the goal of reducing the environmental impact and promoting sustainability, they differ slightly in their specific focus. Ecological buildings prioritize the protection and restoration of the overall ecosystem, encompassing aspects such as resource utilization, indoor environment quality, and biodiversity preservation. On the other hand, low-carbon buildings primarily concentrate on reducing greenhouse gas emissions, with a particular emphasis on carbon dioxide. In practice, these two approaches can be effectively integrated to create a more holistic and comprehensive approach to sustainable building design and operation.
This text discusses the application of the emergy approach in assessing and studying building systems. Originally developed as a methodology for the ecological–economic assessment of natural systems at the College of Environmental Studies, University of Florida, this method has evolved over time and found applications in diverse fields, including agriculture, industry, urban planning, architecture, and landscape design [13,14,15,16,17]. The research on ecological architecture utilizing the concept of emergy emerged relatively later, with pioneers in this field being researchers from the School of Architecture at the University of Pennsylvania. Since then, it has expanded into areas such as ecological building assessment, ecological building design, regional ecological transformation of buildings, and ecological landscape design [18,19,20,21,22]. Currently, there is a growing trend of combining multiple methods, such as BIM, LCA, statistical analysis, and energy-efficient design methods, with the emergy approach to study building systems.
The theory of carbon footprint has garnered significant attention from researchers, particularly in light of the introduction of carbon neutrality strategies. Research on carbon emissions in building systems has been progressively deepening, encompassing various theories and methods. These include the exploration of architectural design theories and approaches for achieving carbon neutrality, investigations into the spatiotemporal characteristics of urban carbon emissions and reduction strategies, examinations of carbon reduction and utilization throughout the entire life cycle of building systems, theoretical studies on achieving healthy and comfortable low-carbon building environmental control, prototype construction research on low-carbon building technologies in high-density urban environments, and paradigm research on low-carbon buildings under extreme climate conditions [23,24,25,26,27,28,29,30]. Additionally, neural network models have been considered a means to predict the ecological footprint and carbon emissions of building systems, allowing for the identification of key influential stages within the building system. Through an analysis from multiple perspectives, potential contradictions can be identified and addressed. Currently, there is also a growing focus on utilizing neural network models to explore the sustainability of building systems, making it a prominent topic of research [31,32,33].
The comprehensive study of ecological emergy and the carbon footprint in sustainable building systems is currently limited, and achieving their coupling poses a significant challenge. The uniqueness and strengths of this paper lie in its integration of relevant data on ecological emergy and carbon footprint for a thorough analysis. This approach necessitates extensive data collection and organization, encompassing various aspects such as building materials, energy consumption, waste management, and more. By gathering and evaluating this information, a better understanding of the relationship between ecological emergy and the carbon footprint can be achieved.
This paper specifically discusses the following research questions and objectives: (1) A quantitative analysis of the ecological emergy status of building systems in terms of sustainability. (2) The carbon emission levels of building systems within the framework of the carbon footprint. (3) The long-term dynamic trends of and variations in the ecological emergy and carbon footprint in building systems. (4) The comprehensive research and analysis of sustainable aspects in target building systems.

2. Materials and Methods

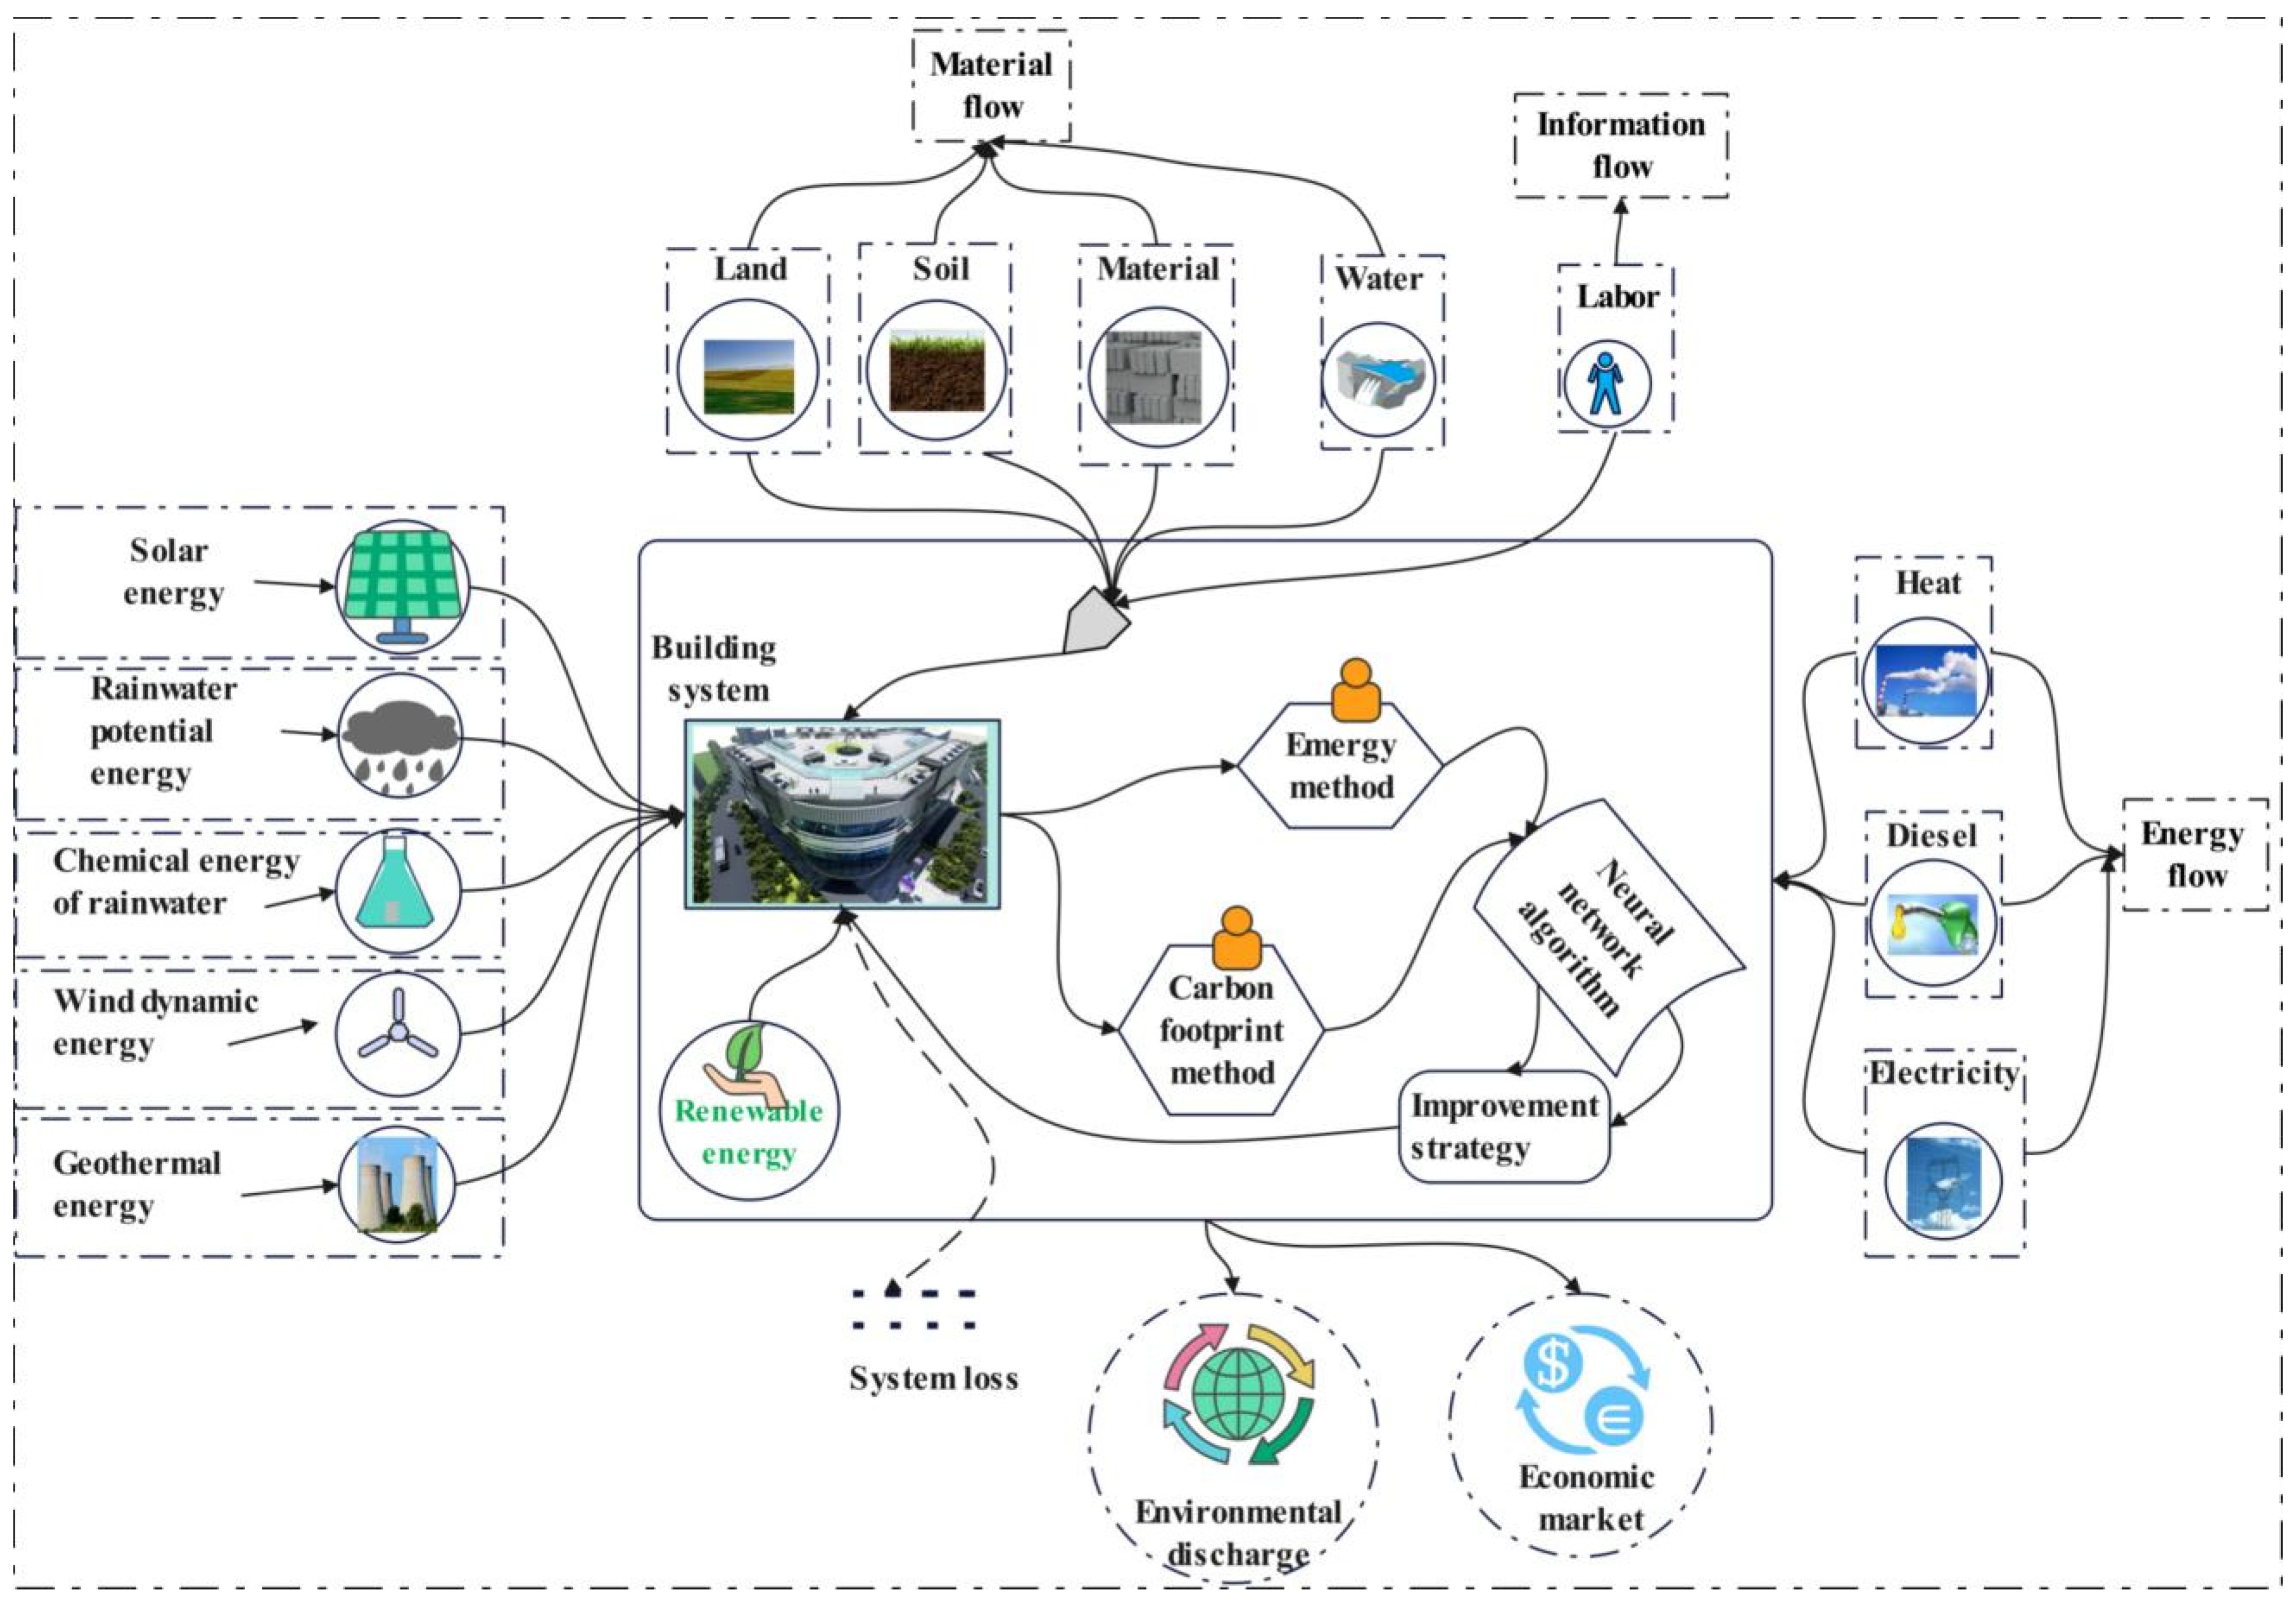
2.1. Research Framework

Figure 1 illustrates the research framework of this study, encompassing the entire building system with the inputs of the material flow, energy flow, and information flow. The energy flow comprises two categories: renewable and non-renewable energy. Through quantitative calculations and assessments using exergy and carbon footprint methodologies, along with a predictive analysis using neural network algorithms, the sustainability of the building system can be clearly positioned.
The emergy and carbon footprint methods provide quantitative data, allowing us to more accurately measure and assess the ecological sustainability level of building systems. This quantitative analysis is instrumental in making informed decisions and setting goals. Neural network predictive methods enable us to analyze future trends and possibilities, aiding architects and managers in better planning and adapting building systems for enhanced sustainability. The combined application of these methods furnishes architects and building managers with robust foundations on how to enhance the sustainability of building systems. This facilitates the formulation of greener and more sustainable decisions, reducing environmental impacts. By gaining a better understanding of the ecological sustainability of building systems, we can take steps to reduce the consumption of non-renewable resources, minimize waste generation, and promote the use of renewable energy sources, thereby contributing to climate change mitigation and environmental preservation. In summary, employing these methods for the ecological sustainability assessment of building systems helps drive greener and more sustainable building practices, benefiting both society and the environment.

2.2. Case Introduction

2.2.1. Commercial Mixed-Use Building Case Study

The building case in this article is a commercial complex that has been in operation for 20 years. It requires an ecological transformation of the entire building. The building is located in Nanjing City and has a total floor area of approximately 48,000 square meters. It has a triangular shape with two sides facing the streets and is situated on a major traffic artery. In order to adapt to the characteristics of current climate change, the building needs to undergo sustainable renovation from an ecological and low-carbon perspective. Various measures are shown in Figure 2.

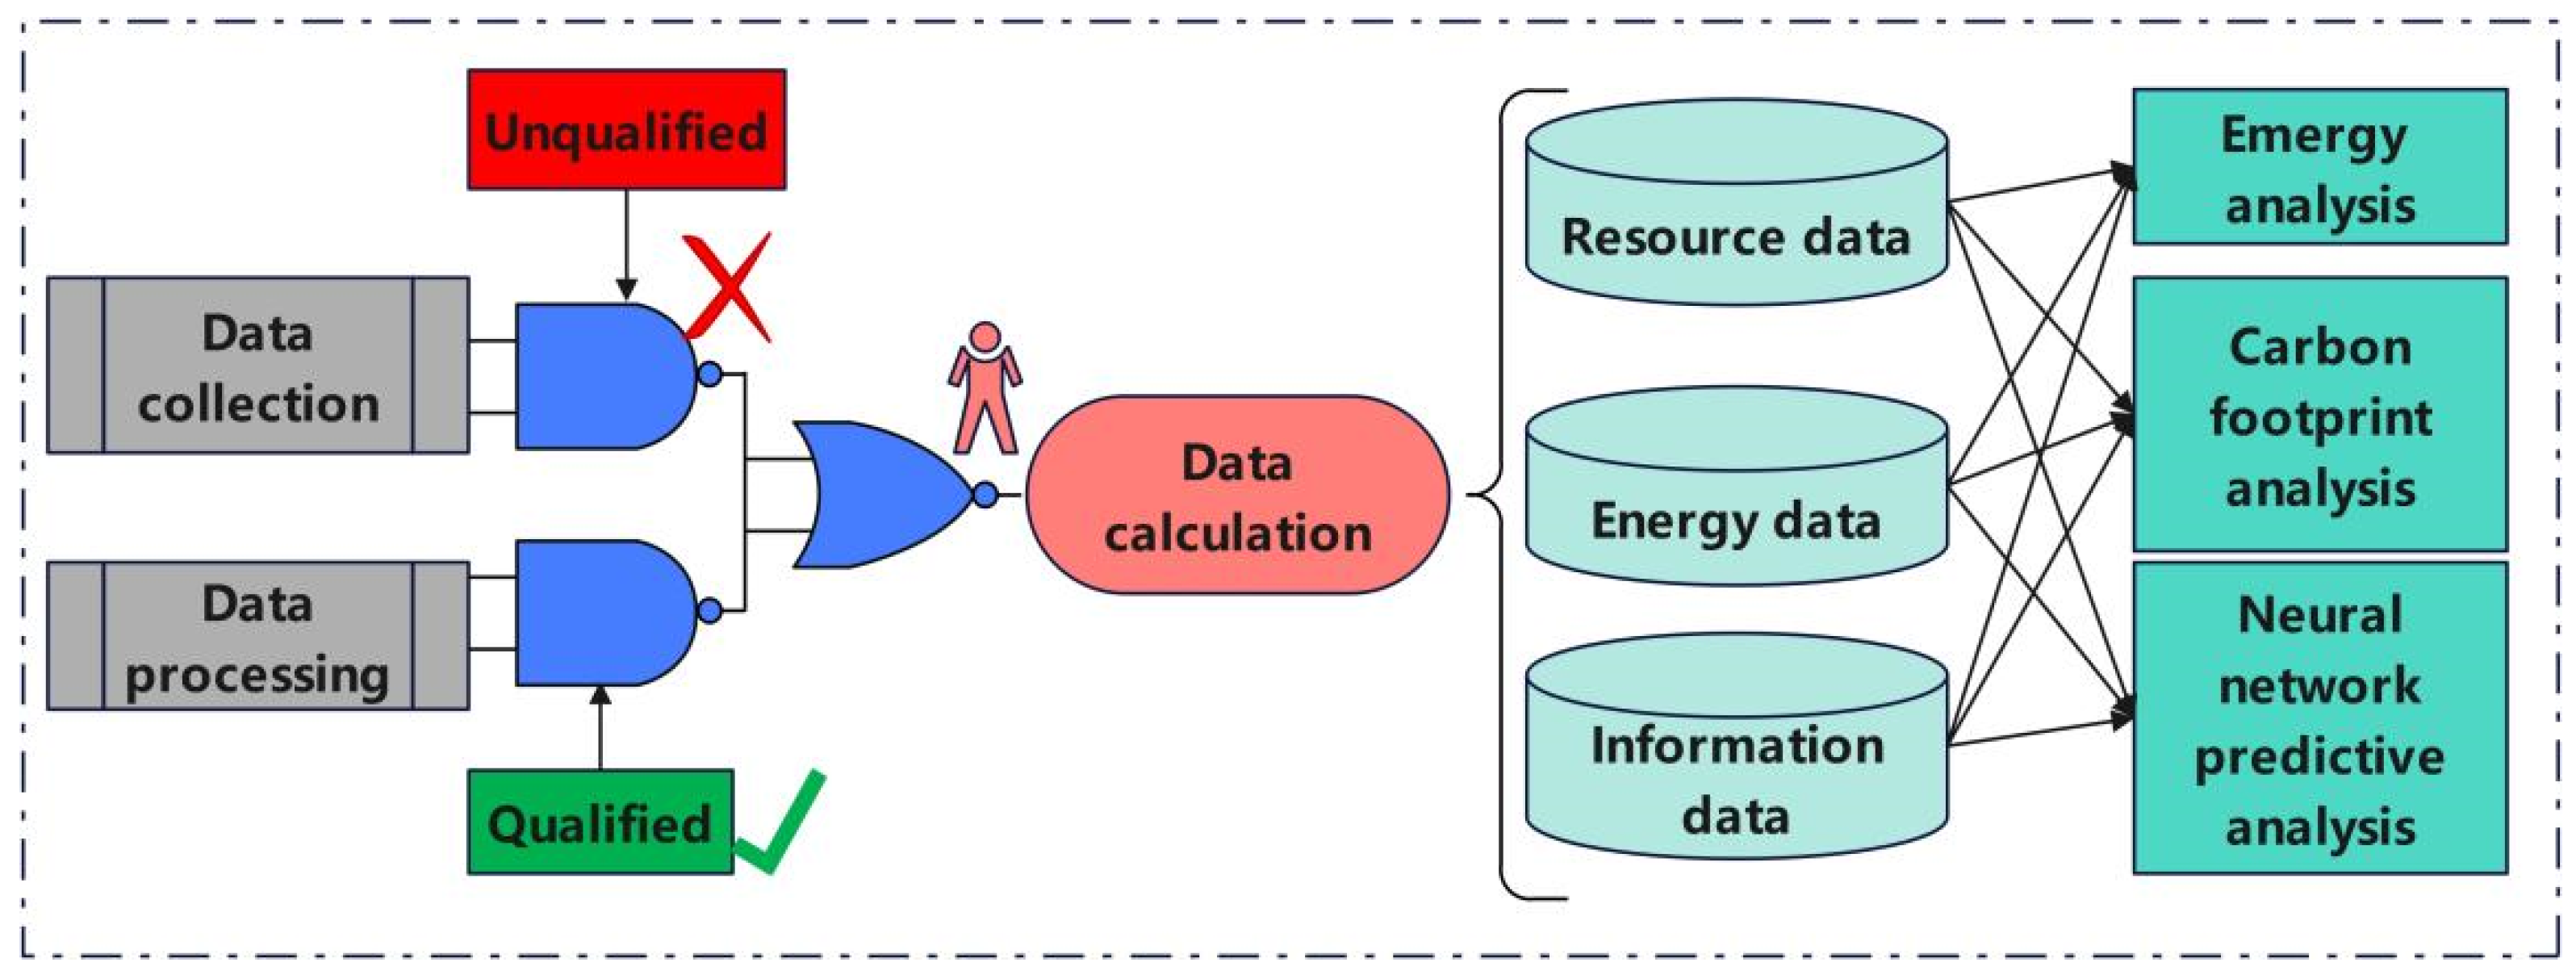
2.2.2. Data Collection

This study involves extensive data collection and processing. From the perspective of an emergy analysis, the data set is divided into basic data and the corresponding emergy conversion rates. From the perspective of the carbon footprint, the data set is divided into basic data and the corresponding carbon emission factors. The basic data are further categorized into three types: material flow data, energy flow data, and information flow data. The emergy conversion rates include material flow emergy conversion rates, energy flow emergy conversion rates, and information flow emergy conversion rates. The carbon emission factors are referenced from the Intergovernmental Panel on Climate Change (IPCC). The specific process is illustrated in Figure 3.
The steps for collecting data are as follows:
(1)
Determine the scope of data: First, determine the scope of the data you want to collect, such as for a specific product, service, organization, or region. Clearly define the boundaries of the data collection to better measure and compare.
(2)
Identify data types: Based on the definitions of emergy and carbon footprint, identify the various types of data that need to be collected. Emergy refers to the flow of energy in an ecosystem, requiring data related to energy sources, such as raw material usage and energy consumption. Carbon footprint requires data related to greenhouse gas emissions, such as fuel consumption and electricity usage.
(3)
Select appropriate measurement methods: Depending on the different data types, choose suitable measurement methods. For emergy data, methods like an emergy analysis or emergy assessment models can be used. For carbon footprint data, common methods include the life cycle assessment (LCA) and carbon footprint calculation tools.
(4)
Collect data: Start collecting data based on the chosen measurement methods. This may involve reviewing literature, interviewing relevant personnel, conducting surveys, and making field observations, among other approaches. Ensure the accuracy and comprehensiveness of the data by obtaining reliable primary data whenever possible.
(5)
Data processing and analysis: After collecting the data, organize, clean, and standardize it to ensure consistency and comparability. Then, use appropriate analysis methods and tools to calculate the emergy and carbon footprint indicators and generate the corresponding reports or visualizations.
(6)
Interpretation and application of results: Lastly, interpret and analyze the collected data to understand the significance and impact of the emergy and carbon footprint. Based on the results, propose improvement measures and recommendations for environmental management, policy making, product development, and other decision making and actions.
It is important to note that the collection of emergy and carbon footprint data may involve complex calculations and specialized knowledge. Seeking assistance and guidance from professionals is recommended to ensure the accuracy and credibility of the data.

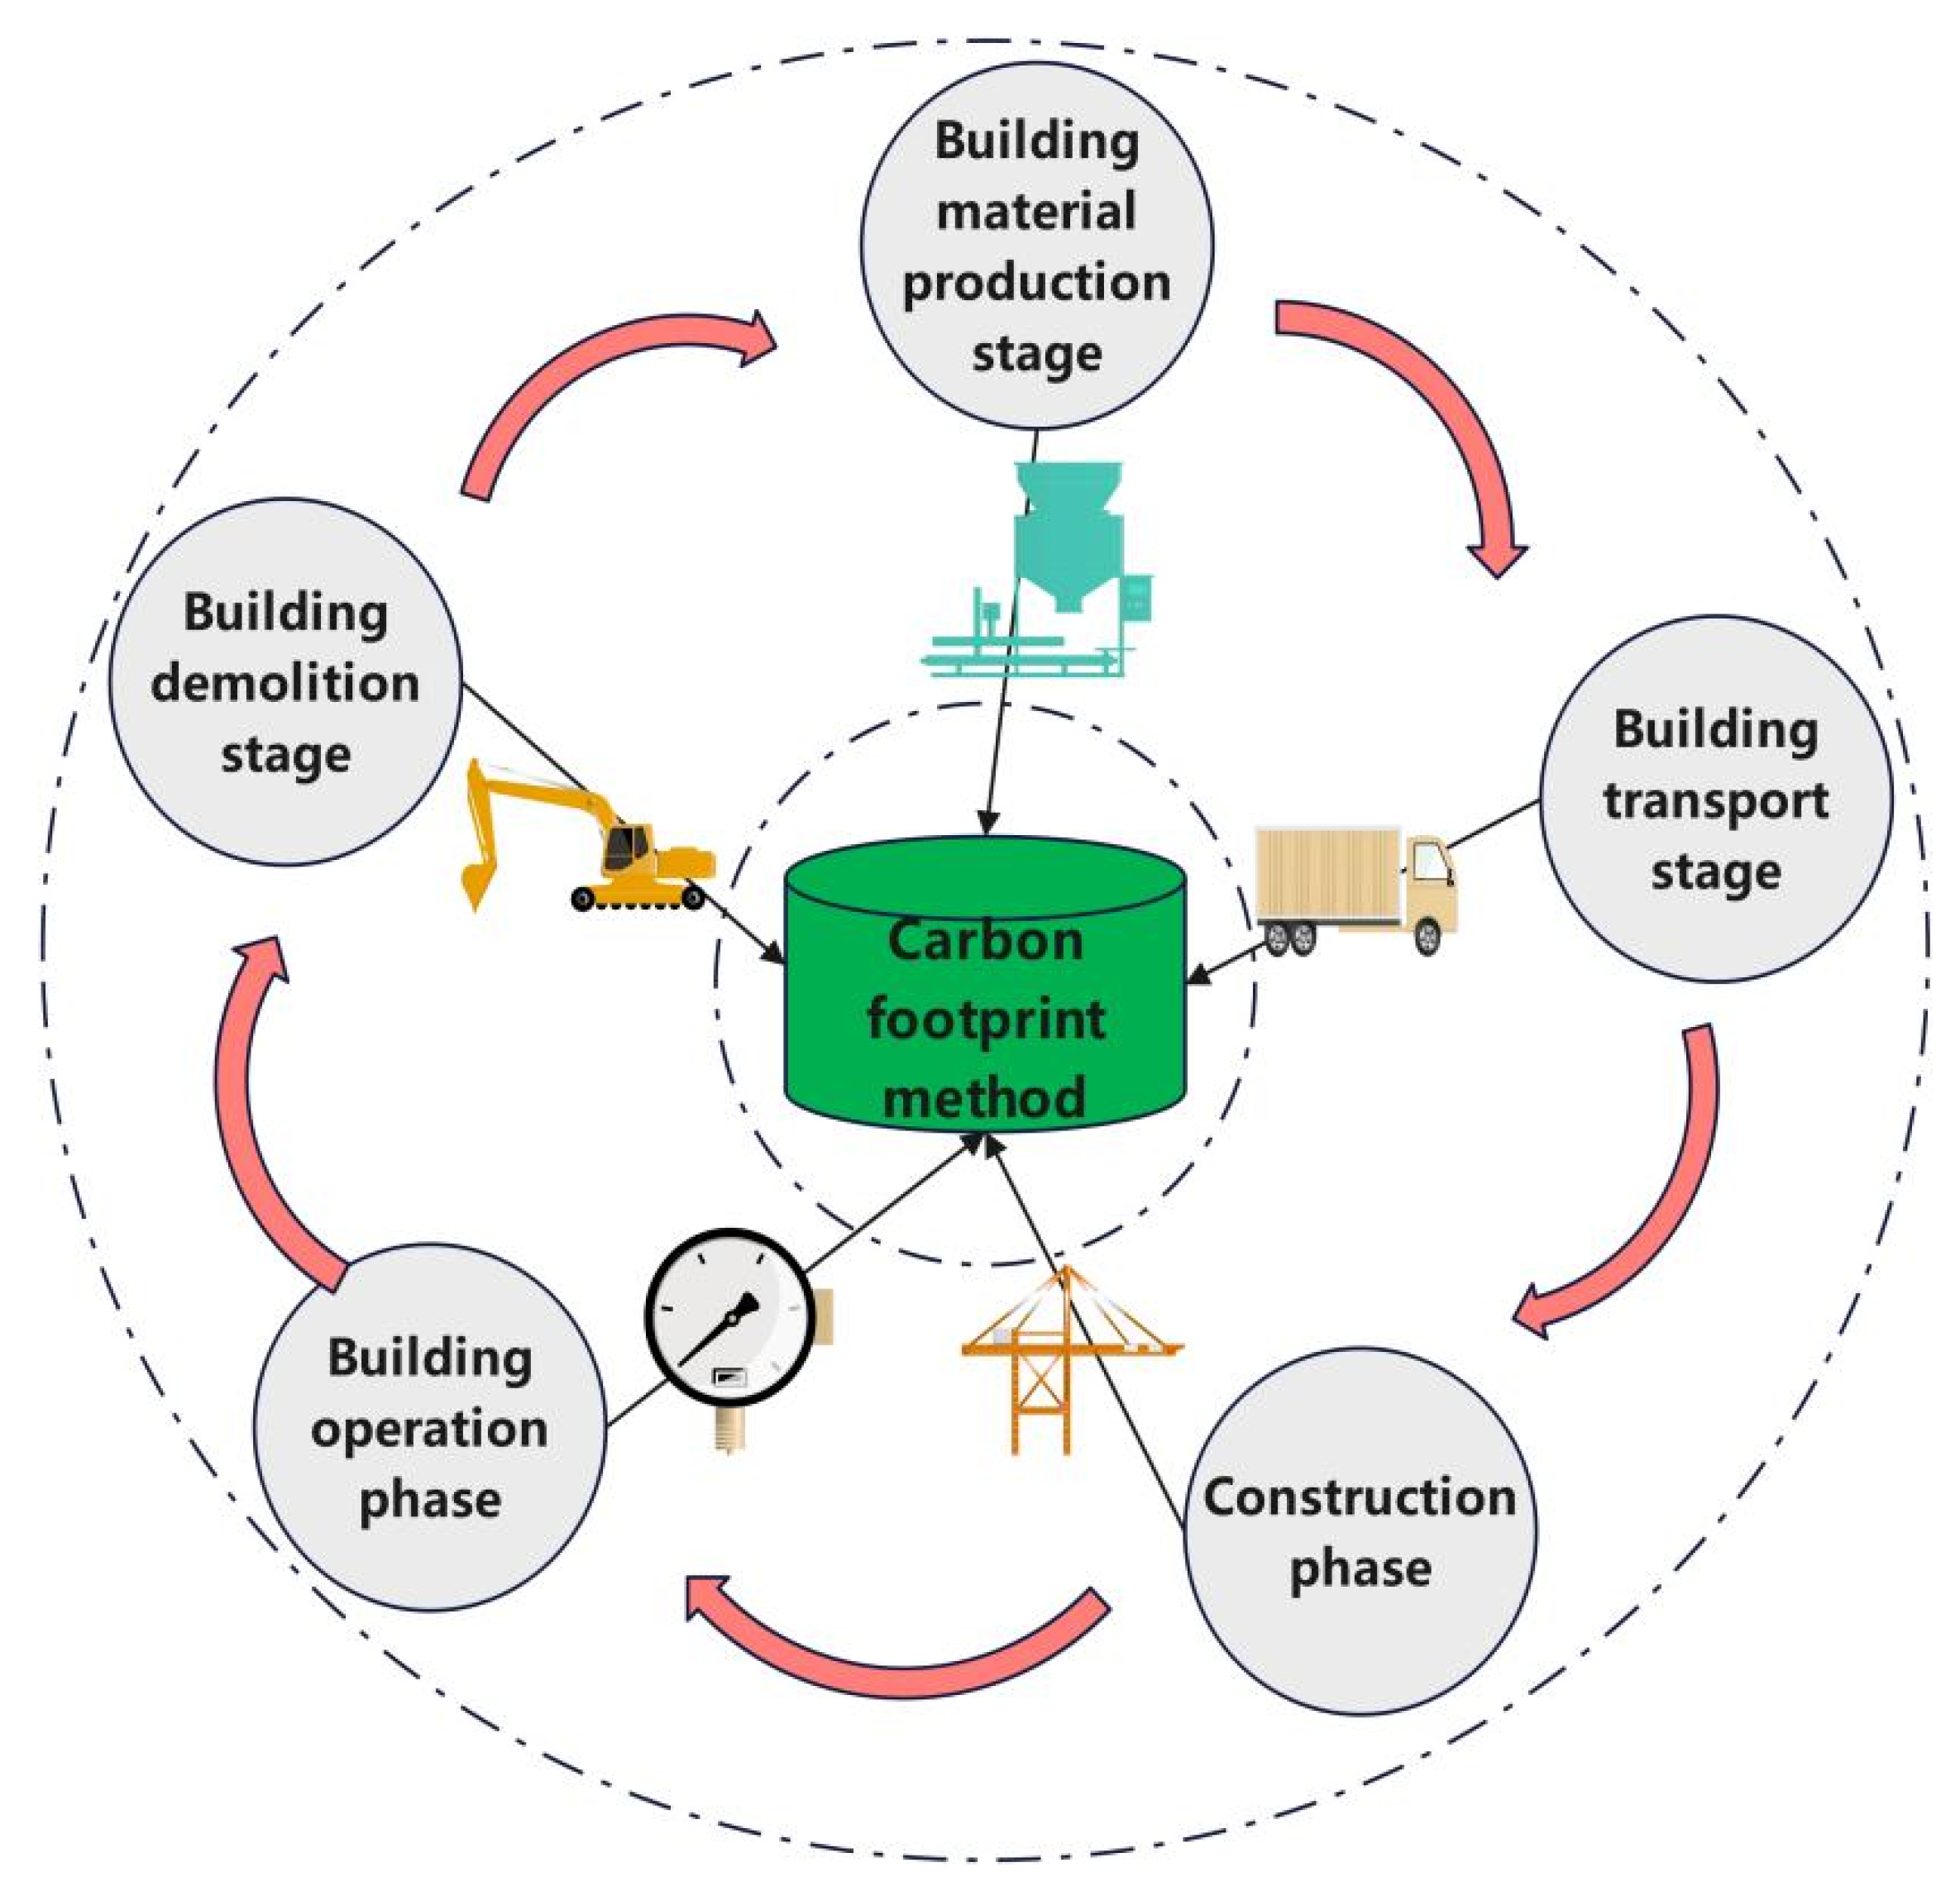
2.3. LCA-Carbon Footprint Method

The building carbon footprint method is a tool used to assess the impact of buildings on greenhouse gas emissions, with the aim of measuring the climate change impact of construction. First, the scope of the assessment is determined, including the entire life cycle of the building. This includes the stages of architectural design, construction, occupancy, and demolition or maintenance. Next, the data related to the building are collected, including energy consumption, material use, transportation, waste management, and other relevant information. Emission factors associated with building activities are determined, and these factors are used to convert the material and energy use from different activities into CO2-equivalent emissions. The total CO2 emissions of the building are then calculated. Finally, the calculated results are presented to architects, owners, and other stakeholders to explain the main sources of the building’s carbon footprint and potential areas for improvement. Based on the results of the carbon footprint assessment, measures are taken to reduce the building’s carbon footprint. This can include adopting more energy-efficient design, using renewable energy sources, improving energy efficiency, and reducing waste.
The building carbon footprint method is essential for assessing the climate impact of buildings and taking mitigation measures. It encourages the construction industry to adopt more environmentally friendly design and construction methods, promote sustainable building practices, and reduce adverse impacts on the climate. This method plays a crucial role in building planning, design, and management to achieve a more environmentally friendly and sustainable built environment.
Figure 4 illustrates the calculation pathway for the life cycle carbon footprint of a building system. The building system is divided into five stages: materials production, transportation, construction, operation, and demolition. The carbon footprint of each stage is calculated individually.
The carbon footprint method used in this article is the Indirect Emissions Method.
This method considers the indirect greenhouse gas emissions throughout the entire life cycle of a building, including raw material extraction, manufacturing processes, transportation, and waste management. This approach is known as “carbon footprint” or “global warming potential” as it encompasses the greenhouse gas emissions across the entire supply chain.
The model for calculating the carbon footprint of the building system is shown in Table 1. The emission calculation standards are based on GB/T 51366-2019.

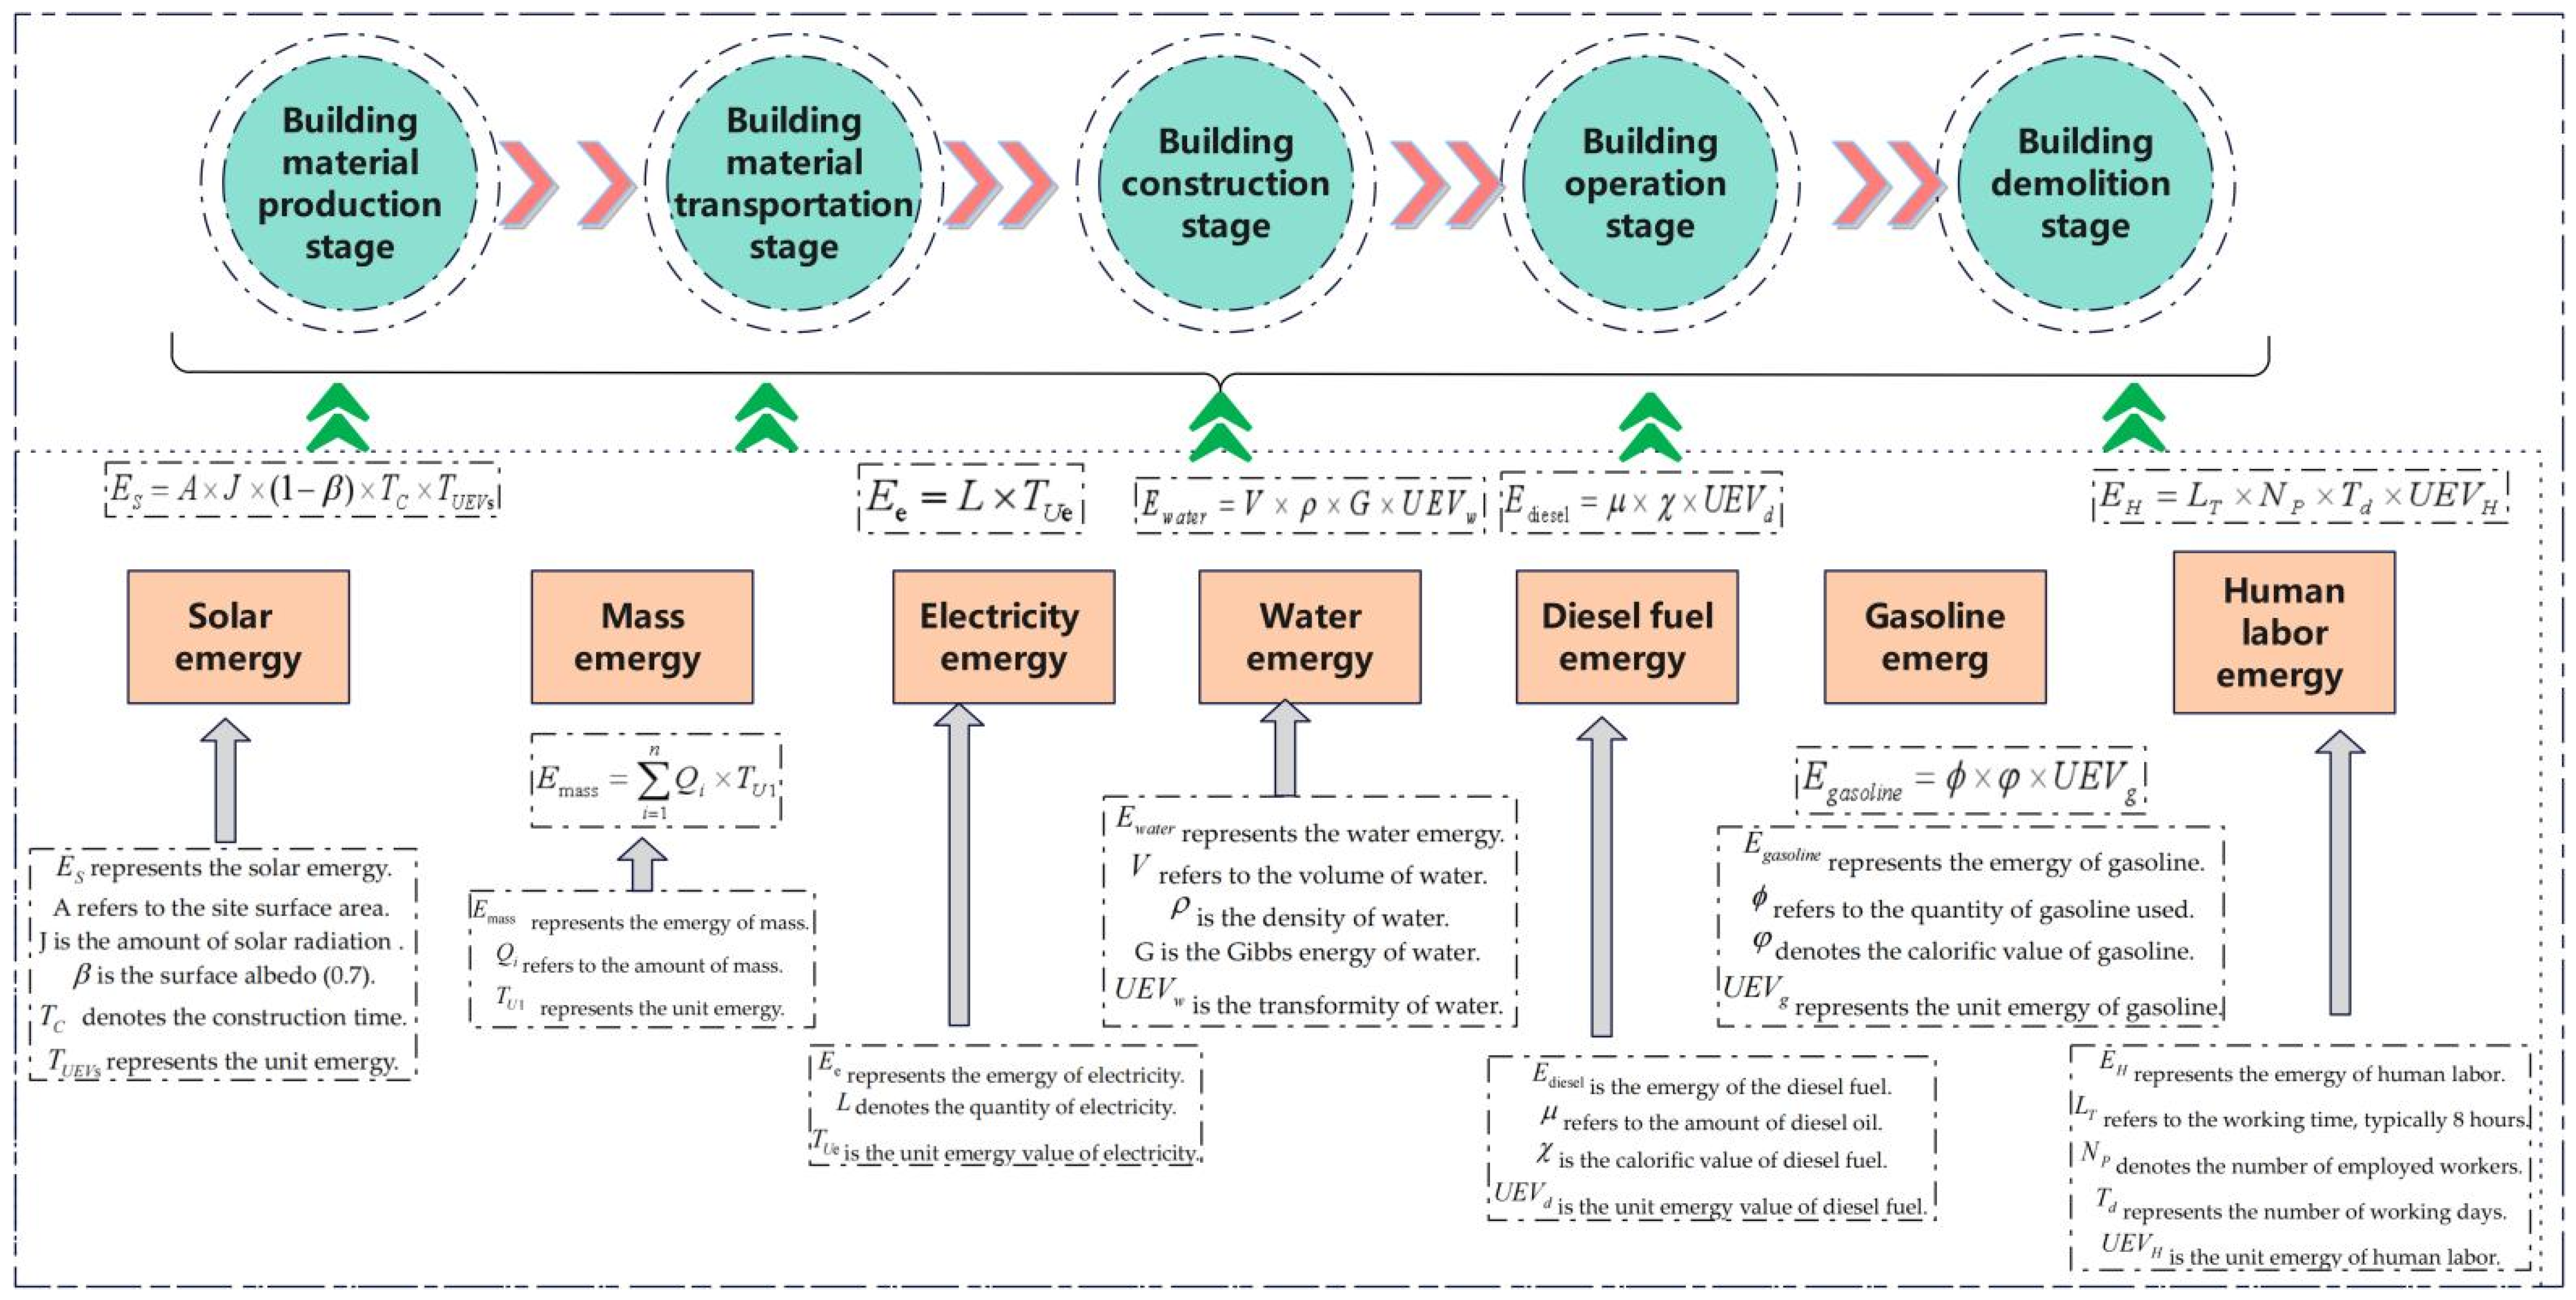
2.4. LCA-Emergy Approach

2.4.1. Emergy Concept

The ecological emergy footprint is an indicator used to measure and assess the impact and damage caused by human activities on ecosystems. It is primarily used to quantify the consumption of resources, energy use, and the pressure exerted on the environment through waste and pollutant emissions. The ecological emergy footprint approach is based on the principle of energy flow, converting various resources and environmental impacts into units of energy, usually expressed in joules or other equivalent units. By calculating the total amount of energy consumed by different activities, it becomes possible to compare their negative impacts on the environment [34].
The concept of the ecological emergy footprint emphasizes the interaction and dependence between human activities and ecosystems. It reminds us that economic development and resource utilization must consider the sustainability of ecosystems and the carrying capacity of the natural environment. By applying the concept of the ecological footprint, we can better identify and understand the extent of damage caused by human activities to ecosystems, providing a scientific basis for the development of environmental protection measures and sustainable development strategies.
The unit of emergy is Solar Emergy Joules (SEJ).

2.4.2. The Uniqueness of Ecological Emergy Footprint

The ecological emergy footprint calculation model is a method used to assess the energy consumption and environmental impact of building systems. While there may be similar studies in the literature regarding this calculation model, updating and improving the model can enhance the uniqueness and contribution of the research. The specific updates include the following:
(1)
Consideration of comprehensive factors: Include a wider range of energy and material flows in the calculation model to reflect the environmental impacts of building systems. For example, consider water resource utilization and emissions generation, among others. This will provide more accurate and comprehensive results for the ecological emergy footprint.
(2)
Incorporation of time factor: Account for changes throughout the entire life cycle of the building system, including the design, construction, use, and demolition phases. This will allow for a better assessment of the sustainability performance of the building system and identify potential improvement opportunities.
(3)
Integration with other assessment methods: Combine the ecological emergy footprint calculation model with other evaluation methods such as the life cycle assessment (LCA), carbon footprint, etc., to provide a more holistic analysis and evaluation. This will enable a better understanding of the building system’s sustainability performance from multiple perspectives.
By updating and improving the ecological emergy footprint calculation model in these ways, the research can enhance its uniqueness and innovation and provide valuable and practical contributions to the field of sustainable architecture.

2.4.3. LCA-Emergy Model

Figure 5 illustrates the emergy calculation pathway and model for the entire life cycle of building systems. This model enables a clear understanding of the emergy distribution in the entire building system, providing a reference for calculating the emergy performance indicators.

2.4.4. Emergy Indicators

Figure 6 illustrates the three categories of emergy sustainability indicators used in this article: emergy yield rate (EYR), environmental loading rate (ELR), and emergy sustainability indicator (ESI).
The emergy yield rate (EYR) refers to the quantity of emergy generated per unit of time. It is used to measure the efficiency and capacity of an emergy system, indicating the speed or level of emergy output.
The environmental loading rate (ELR) refers to the degree of environmental impact caused during emergy production and utilization. It includes factors such as emissions, resource consumption, and environmental damage, which help assess environmental sustainability.
The emergy sustainability index (ESI) is a comprehensive indicator used to evaluate the sustainability of a building system. It considers the relationship between the emergy yield rate and environmental load rate, as well as other relevant factors, such as resource renewability and socio-economic impacts. This parameter assesses the overall sustainability level by considering multiple indicators.
Note: Because the EYR, ELR, and ESI are ratios, they do not have units.

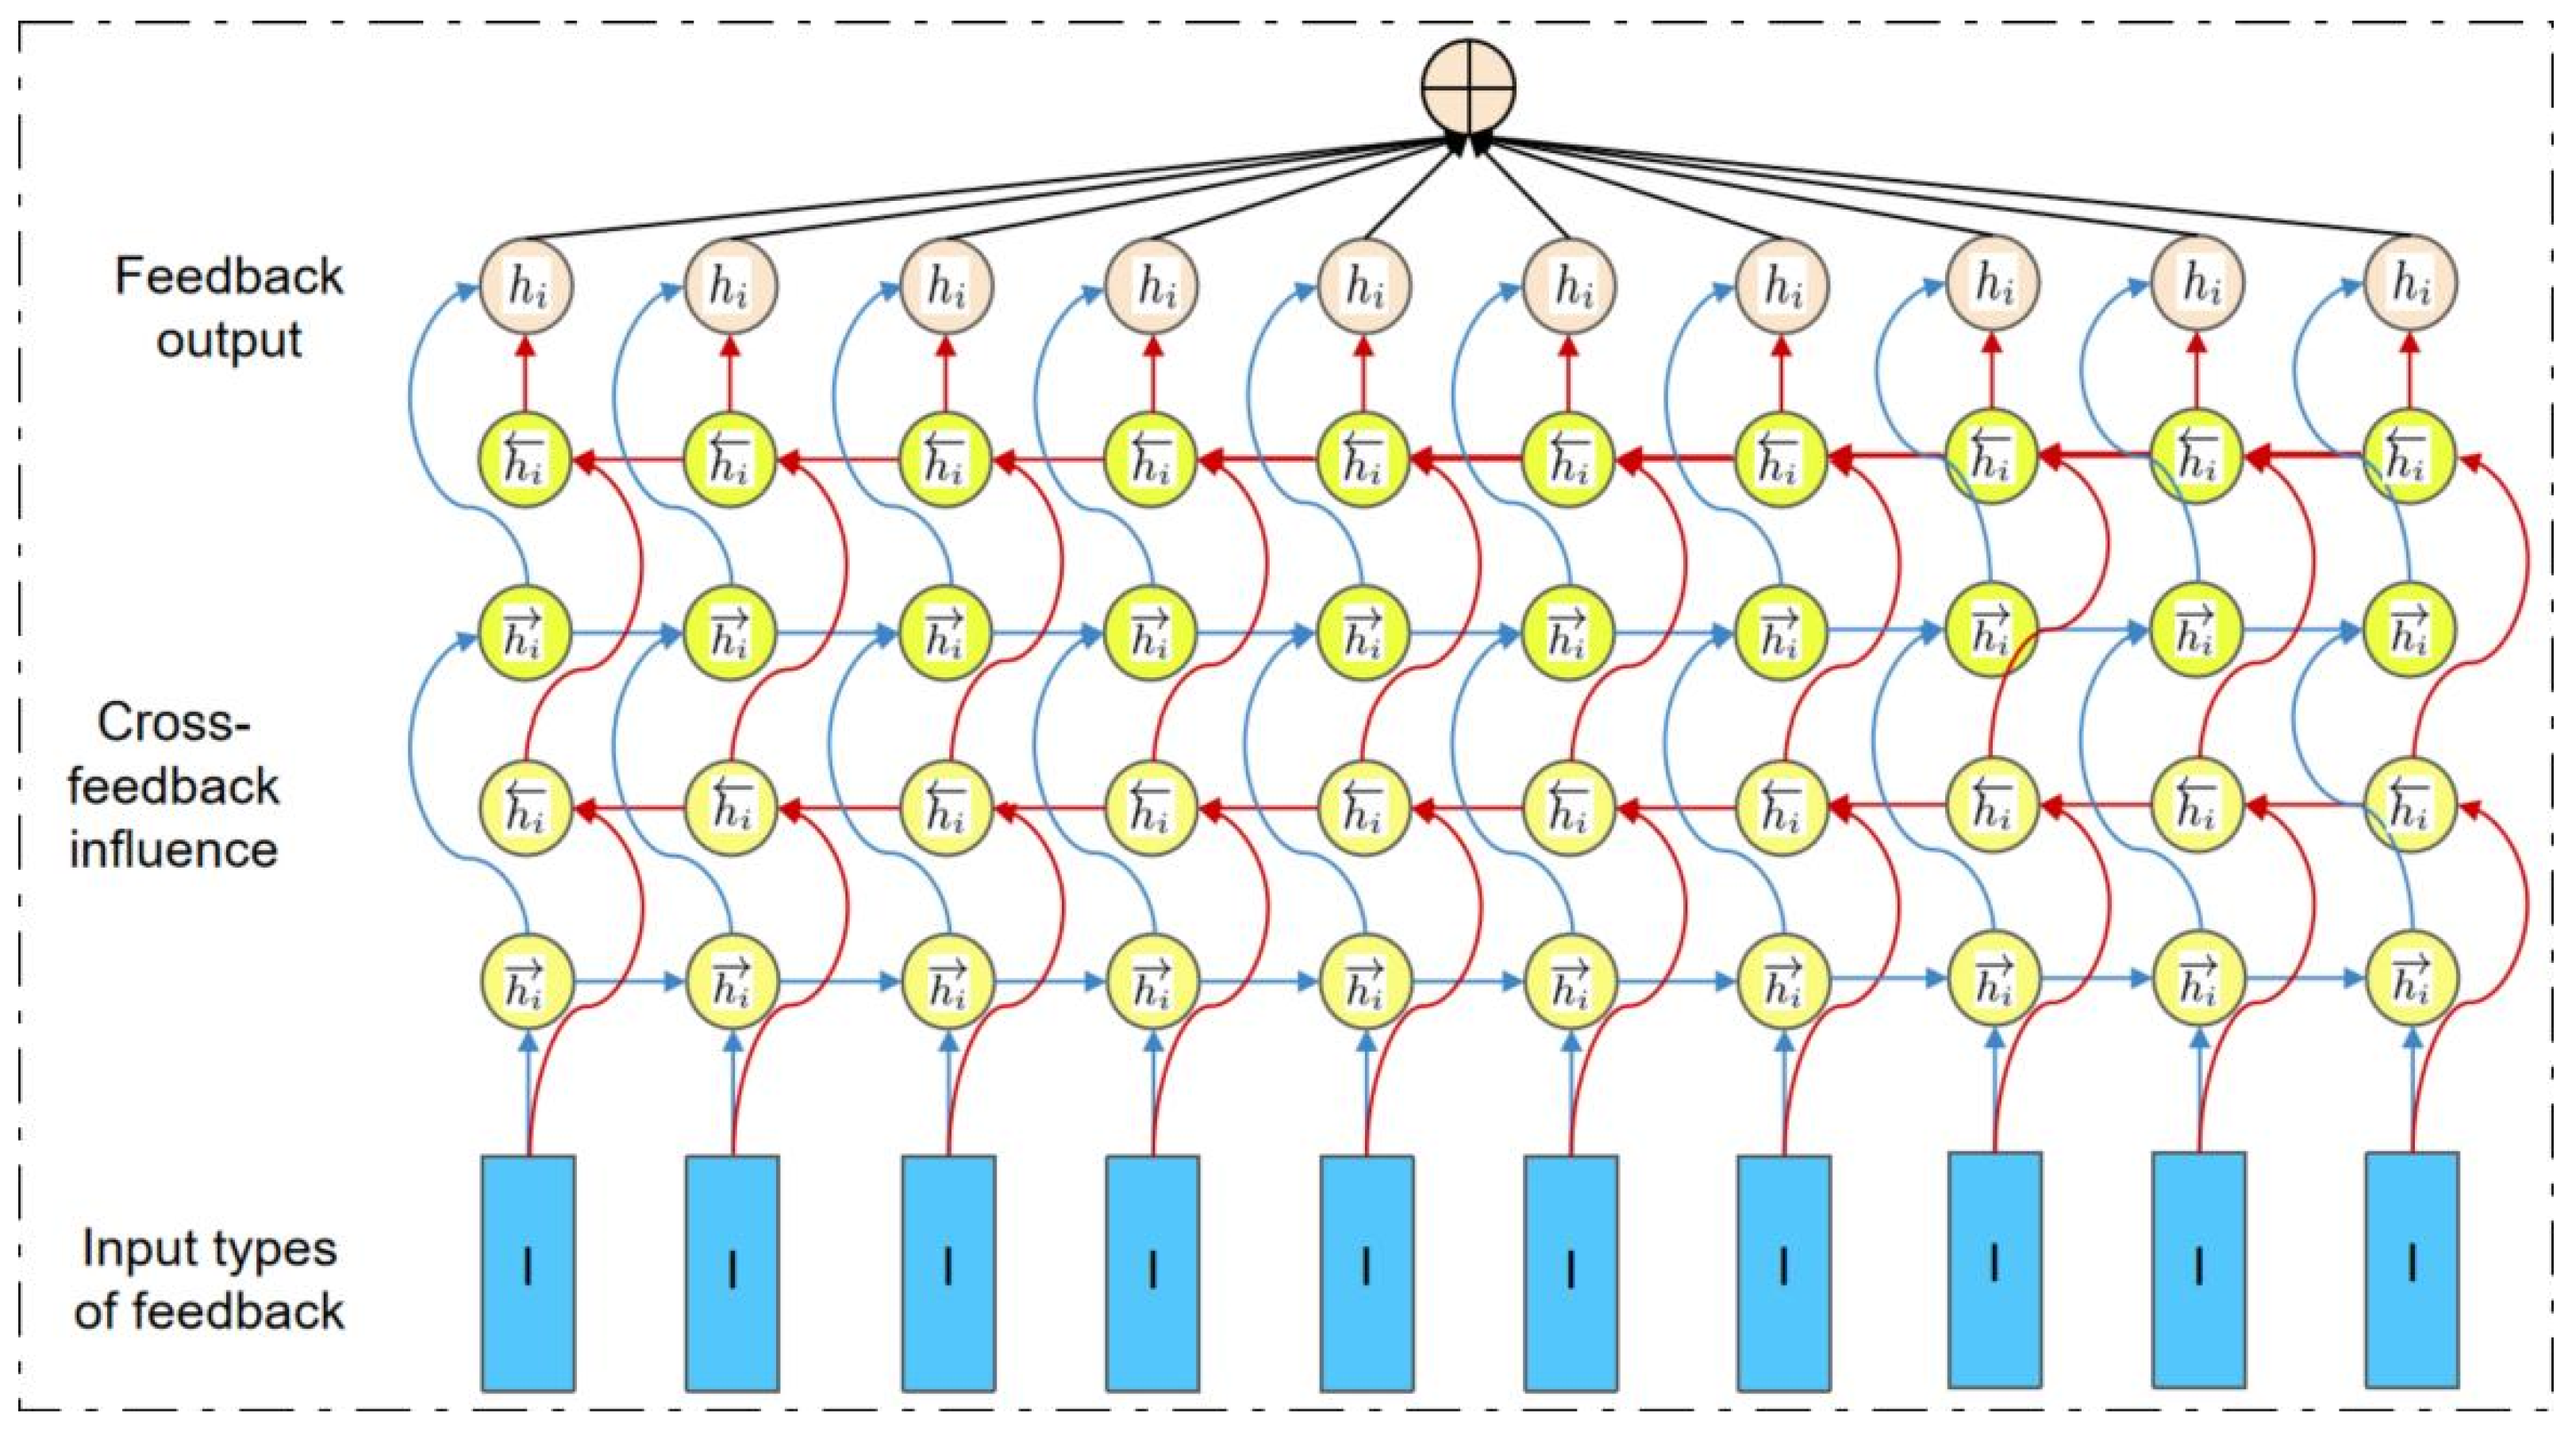
2.5. Feedback Structure Design

As an open system, the architectural system is inevitably influenced by various feedback structures. This article verifies the feedback effects of three types of inputs: material flow, energy flow, and information flow. Figure 7 shows the basic impact pathways of the feedback structure.
The material flow, energy flow, and information flow are crucial feedback inputs in the design, construction, operation, and performance of architectural systems. They play a vital role in making buildings more sustainable, efficient, and responsive.
(1)
Material flow feedback enables optimized resource utilization, waste reduction, and improved sustainability in building processes. It influences decisions on material selection, resource management, and recycling practices.
(2)
Energy flow feedback focuses on energy efficiency, renewable energy integration, and thermal comfort. By analyzing the energy flow, architects and engineers can identify opportunities for energy conservation, implement energy-efficient technologies, and enhance overall building performance.
(3)
Information flow feedback facilitates real-time analysis, decision making, and adjustments in building design, operation, and occupant comfort. It involves communication and data exchange through building automation systems, monitoring systems, and user feedback loops. This feedback helps optimize building performance, occupant comfort, and operational efficiency.
By incorporating and effectively utilizing these three feedback inputs, architectural systems can achieve sustainability goals, reduce the environmental impact, minimize energy consumption, and provide occupants with a comfortable and adaptable living or working environment.

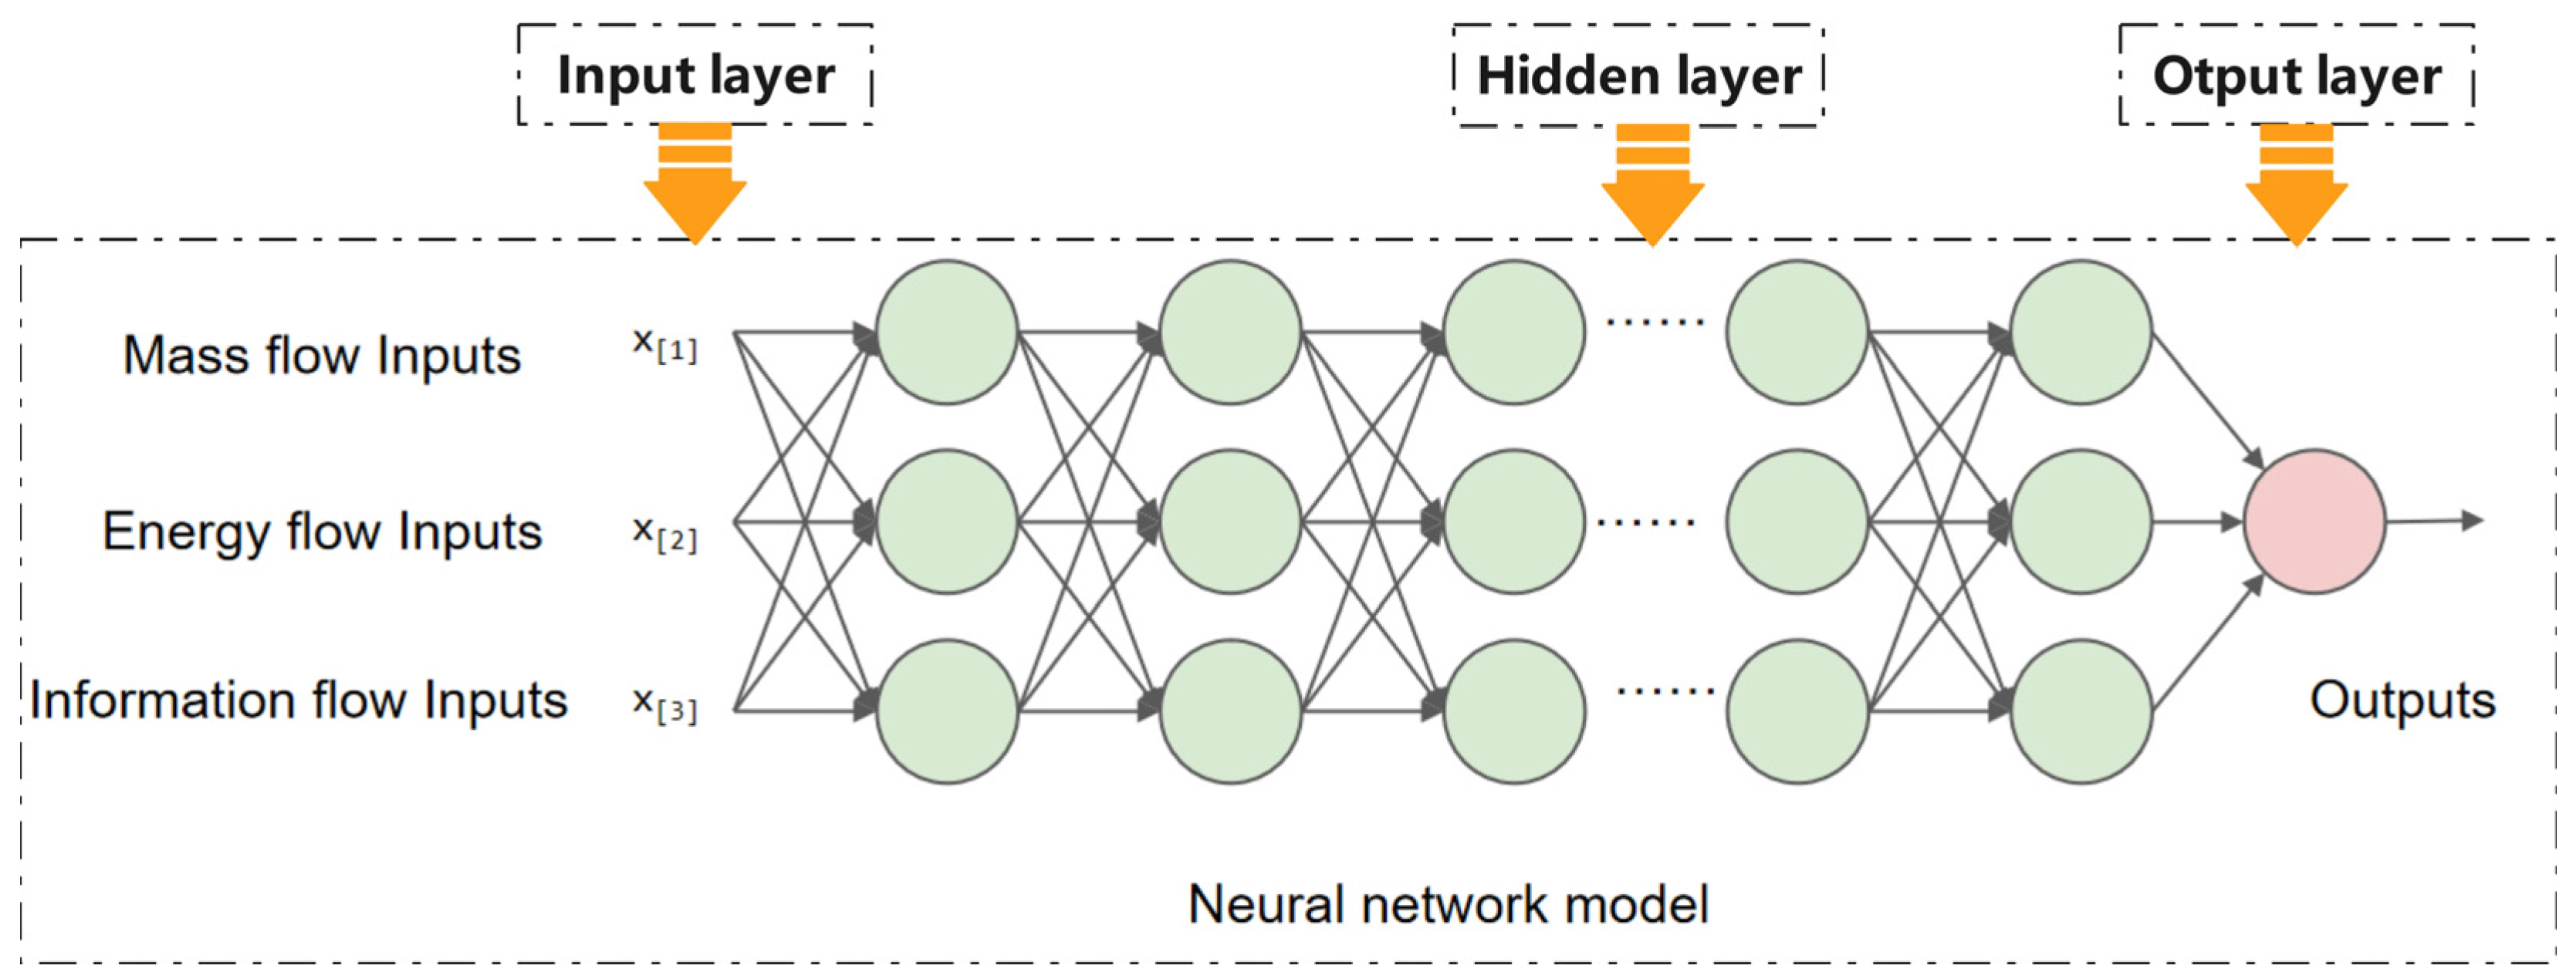
2.6. Neural Network Prediction Model Design

Artificial neural networks play a crucial role in predicting the emergy and carbon footprint trends of building systems. They can analyze historical data and patterns to make predictions and provide insights into future emergy and carbon footprints.
  • Emergy prediction: Artificial neural networks can analyze the emergy consumption data of building systems, including electricity usage, heating and cooling demands, etc., to predict future trends in emergy. This helps optimize energy management and plan emergy requirements, leading to improved energy efficiency in building systems.
  • Carbon footprint prediction: By training neural networks using energy consumption and emission data from building systems, it is possible to predict future trends in carbon footprints. This aids in evaluating the environmental sustainability of building systems and taking corresponding measures to reduce carbon emissions and environmental impacts.
  • Decision support: Based on the predictions from neural networks, decision-makers can formulate emergy management strategies and carbon reduction plans. These predictive insights assist building system operators in optimizing energy usage, selecting renewable energy sources, and implementing energy-efficient technologies, thereby achieving more sustainable operational practices.
Overall, artificial neural networks have a significant impact on predicting the emergy and carbon footprint trends of building systems by providing accurate predictions to guide decision making and actions toward achieving more sustainable and efficient building energy management.
Figure 8 depicts the neural network prediction model applied in this study.

3. Results and Discussion

3.1. LCA-Emergy Analysis

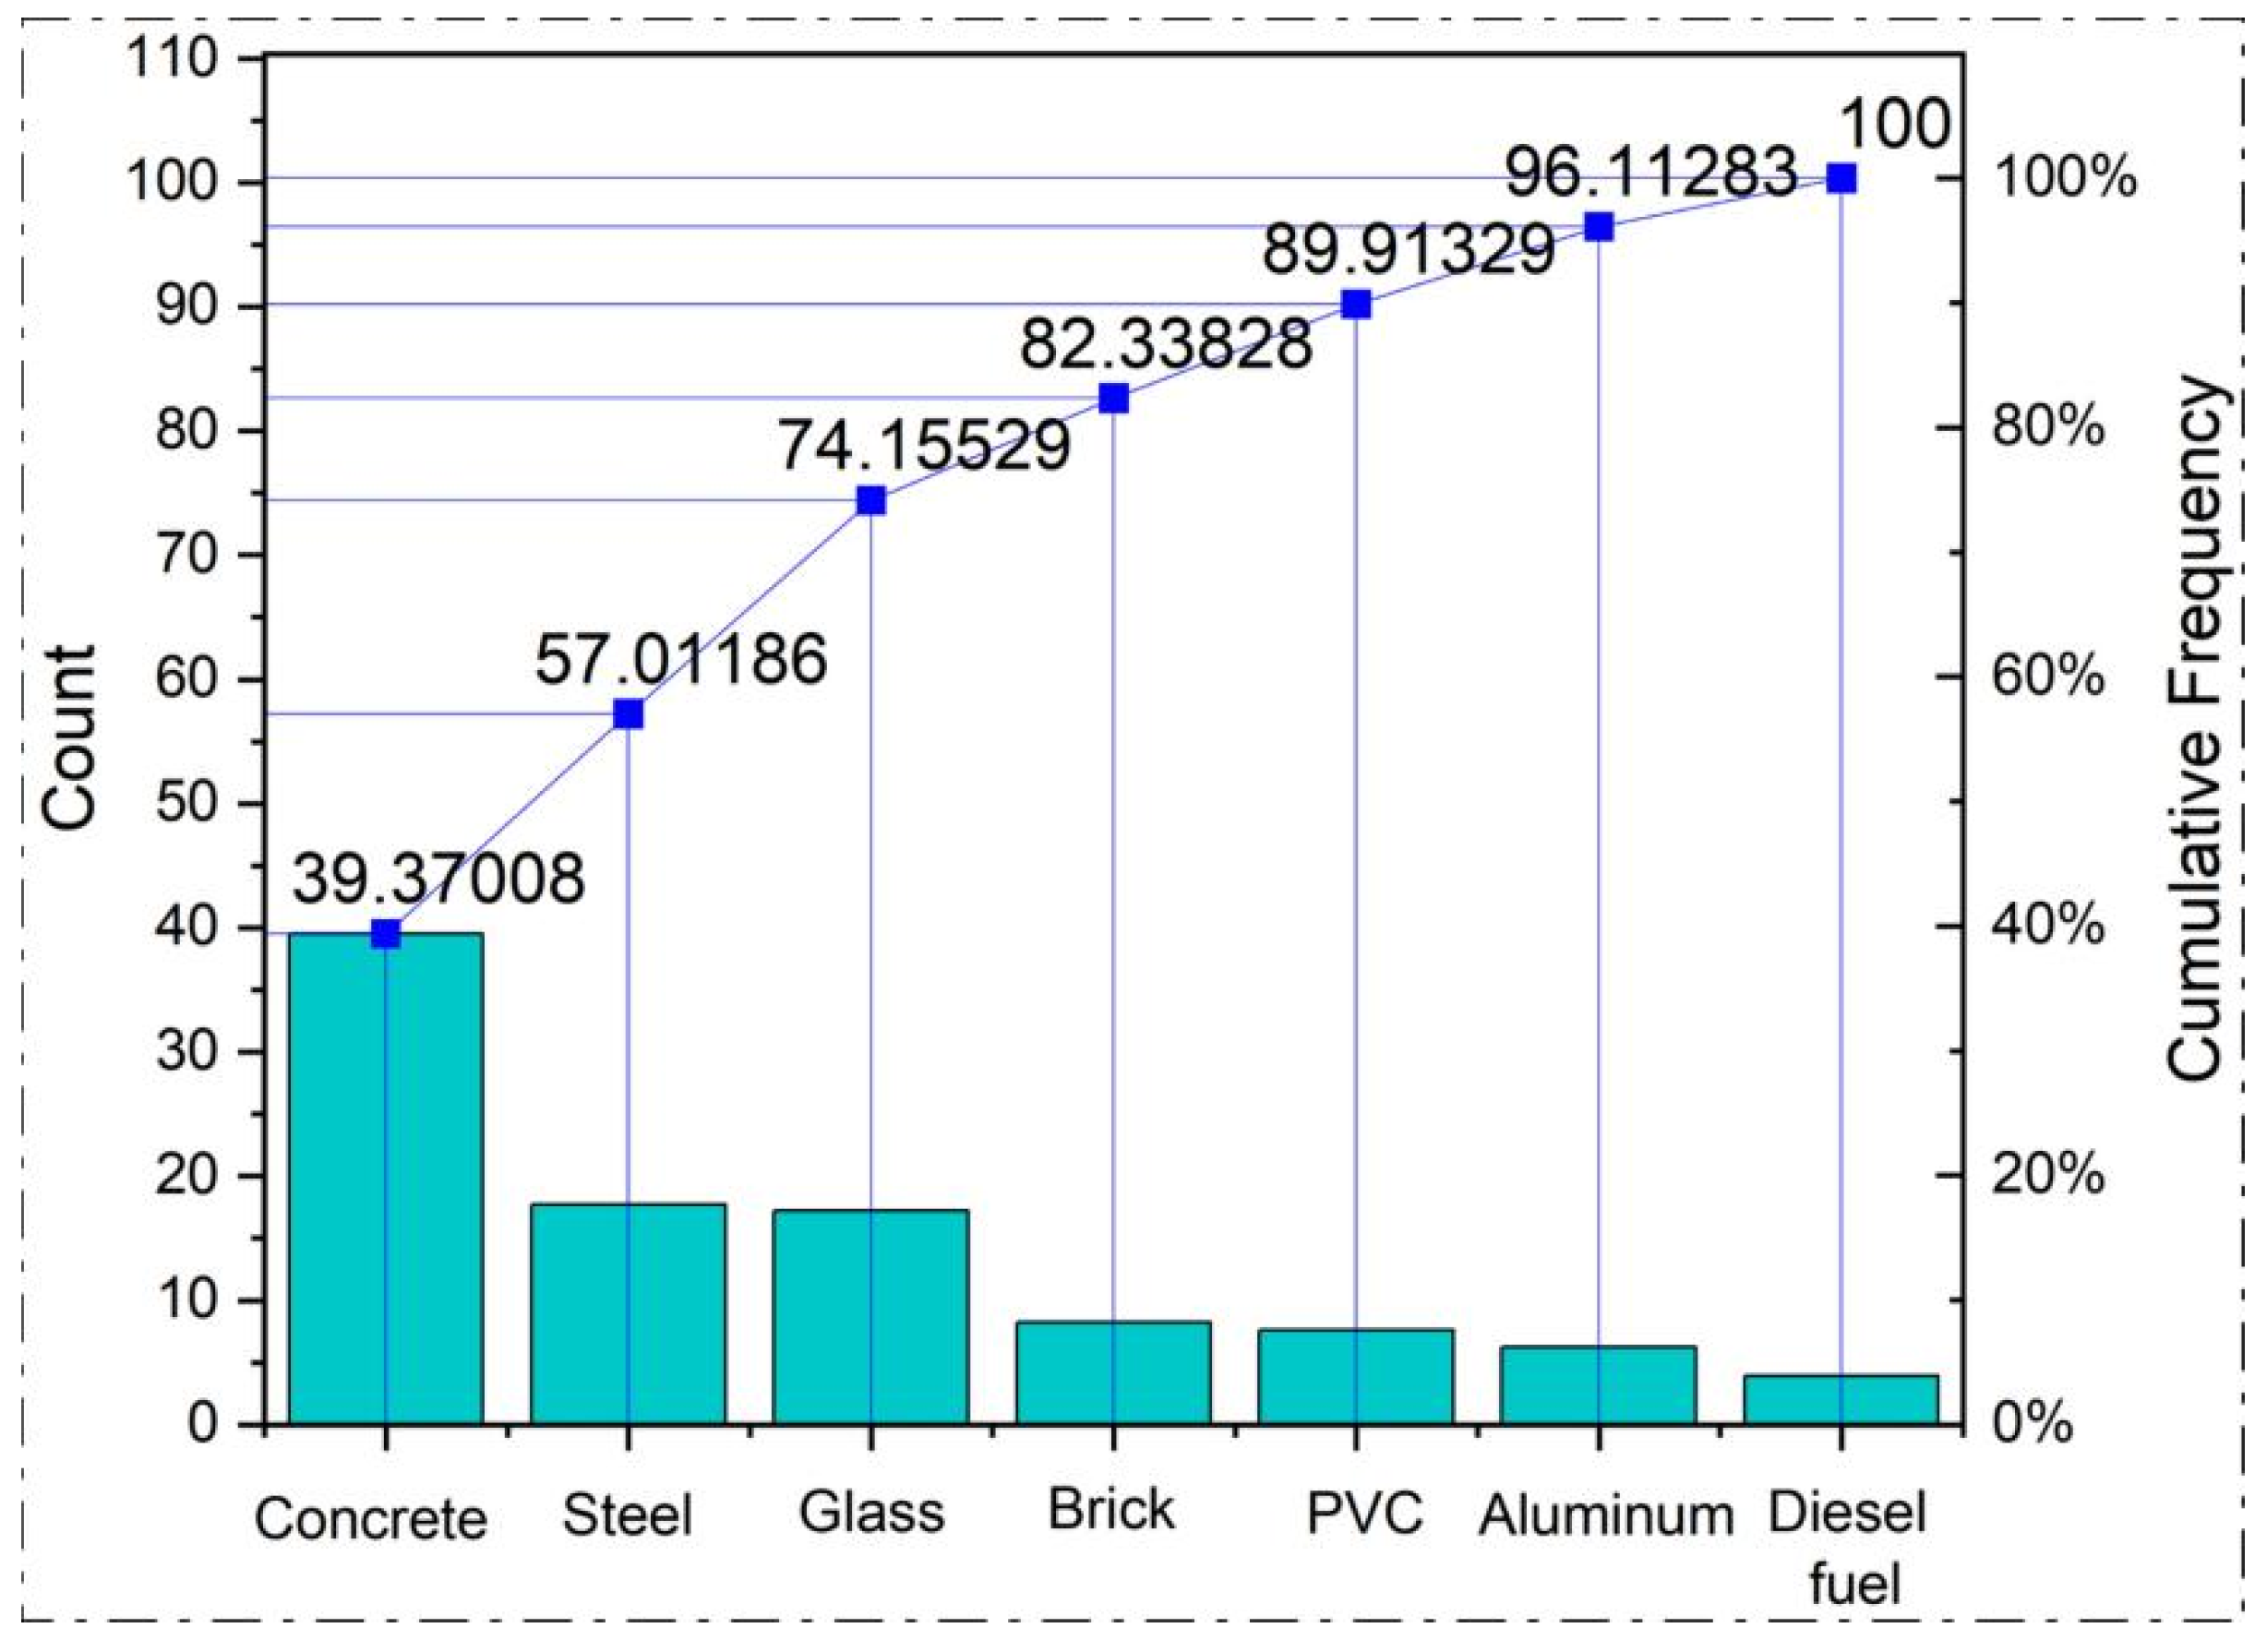
3.1.1. Dominated Contributor

Through a data analysis of emergy, the emergy of the five stages in the building system were calculated and analyzed. Figure 9 shows the trend of emergy in these five stages. This study selected three time points for the emergy calculation: 10 years of operation, 20 years of operation, and 30 years of operation. The emergy during the building operation stage and building demolition stage was simulated, while the rest were the actual calculation results.
After the ecological renovation design in this case, considering the entire building system, the production of the building materials and the building operation stage are the main influencing factors. Taking a 10-year cycle as an example, the emergy of these two stages accounts for more than 84.7% of the total emergy. The emergy of the other three stages has a relatively small proportion. The overall trend is that the emergy of the building materials stage decreases with time, while the emergy of the building operation stage increases. Taking the operation stage as an example, the proportion of emergy at the 10th year is 37.5%, at the 20th year it is 64.7%, and at the 30th year it is 83.4%. During the operation stage of the building, various facilities undergo accelerated aging, which contributes to the increase in the proportion of emergy during the operation stage.
The unit emergy value reference can be found in the literature [35].

3.1.2. Sustainable Indicators Analysis

A comparison demonstration of the emergy sustainability of building systems was conducted using three categories of emergy performance indicators, as shown in Figure 10A. The indicators used in this section are the EYR, ELR, and ESI, with calculation periods of 10 years, 20 years, and 30 years. Additionally, a comparative display of the impact results of the three feedback systems is presented in Figure 10B.
In Figure 10A, a clear comparison of the three sustainability indicators shows that the emergy yield ratio (EYR) decreases as the building’s operational period increases, indicating a decline in the overall efficiency of the building system (with a decrease exceeding 55%). The reasons for this result are diverse. Based on actual research, the building envelope structure requires repairs, the sealing performance of doors and windows deteriorates, building equipment needs replacing, and interior finishes such as the flooring, walls, ceilings, and fixed furniture require updates.
The environmental yield rate (EYR) increases with the prolonged use of buildings, exerting gradually escalating pressure on the environment, with fluctuations exceeding 67.4%. Aging building systems can lead to increased environmental pressures. Some possible issues include energy leaks, heat loss, and electricity waste, resulting in decreased energy efficiency. This increases the demand for traditional energy sources, leading to higher carbon emissions and energy consumption. Furthermore, aging building systems may require repairs, renovations, or demolition, generating a significant amount of construction waste. If these wastes are not properly managed and recycled, they can impose additional environmental burdens.
Based on the calculations using the parameters of environmental yield rate (EYR) and emergy load ratio (ELR), the resulting environmental sustainability index (ESI) values are 0.58 for 10 years, 0.238 for 20 years, and 0.089 for 30 years. According to the energy value calculation standard where 1 represents a qualified value, it can be observed that the ESI significantly decreases with the increasing building usage period, indicating a rapid decline in sustainability.
Figure 10B depicts the impact of the three feedback structures on the sustainability performance of buildings. Taking the ESI index at 10 years as an example, the open-loop feedback system exhibits a significantly higher error magnitude compared to the closed-loop feedback structure and cross-loop feedback structure, with evaluation error rates of approximately 16%, 10%, and 6%, respectively. This relationship is closely linked to the feedback structure, indicating that the cross-loop feedback structure considers more factors and can effectively rectify the calculation results of the building system emergy parameters.

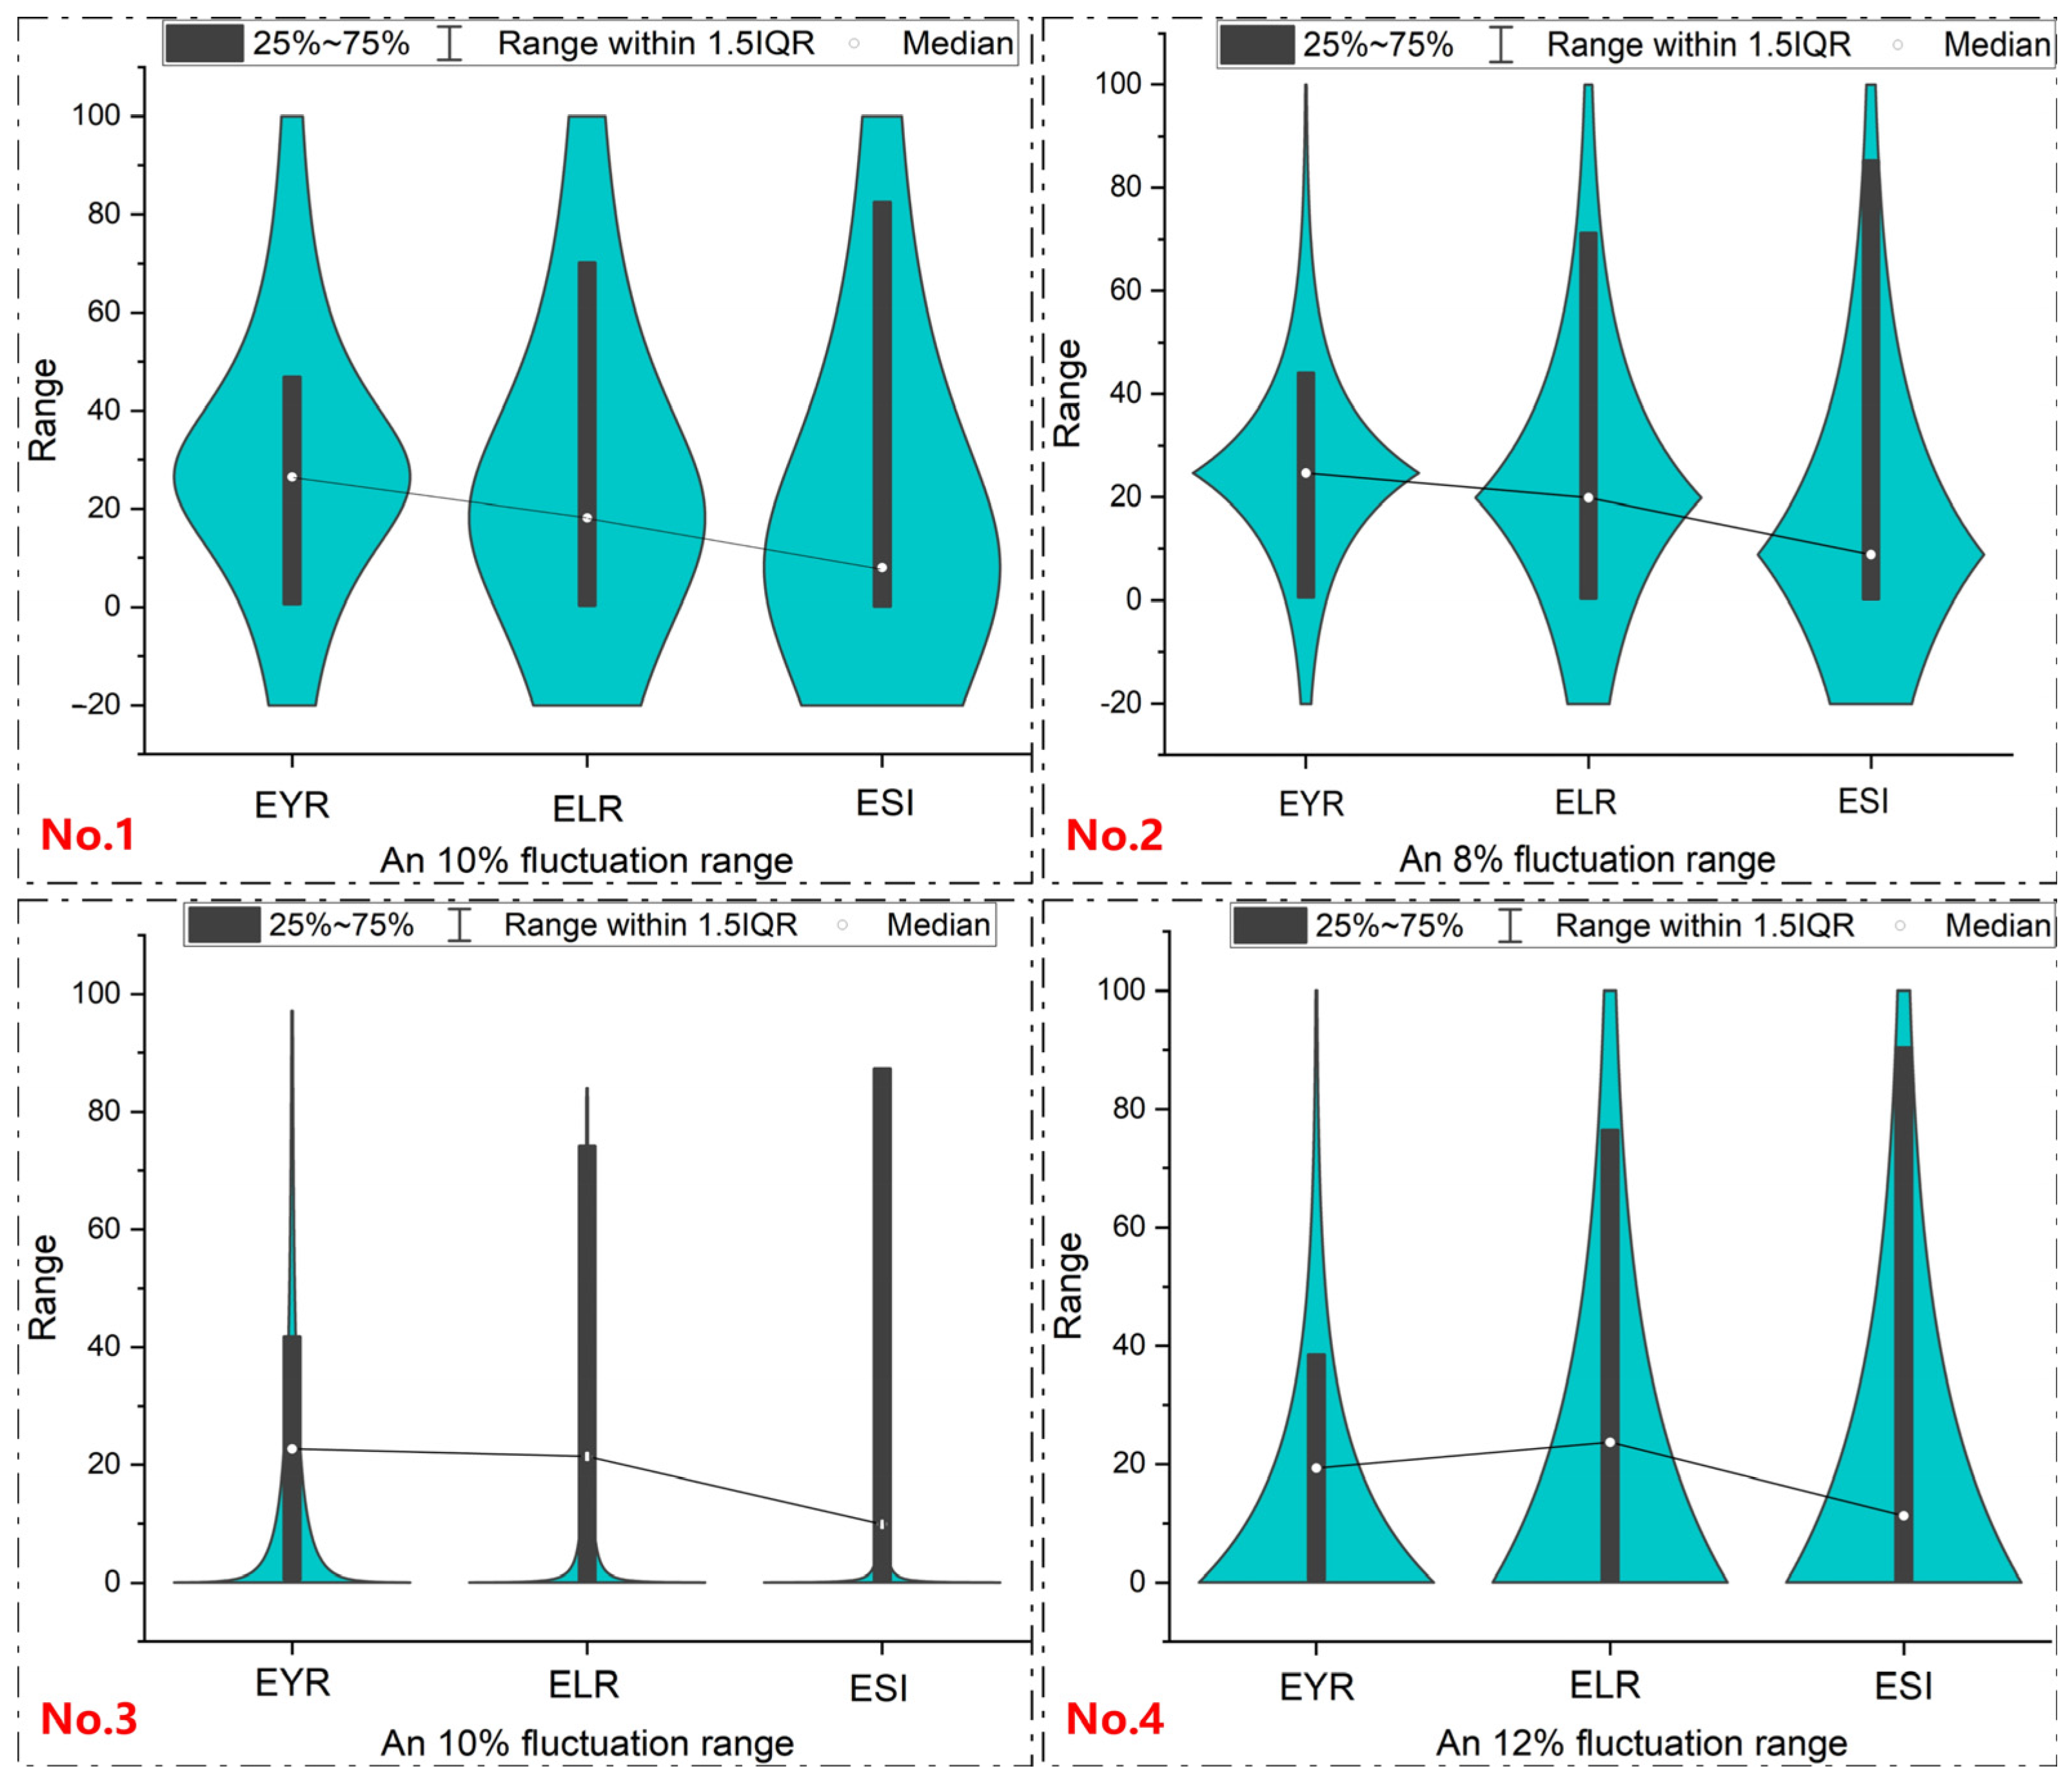
3.1.3. Sensitivity Analysis Based on Emergy View

Given the extensive data involved in this study, a sensitivity analysis is indispensable to ensure the validity of the data. A sensitivity analysis can reveal the range of uncertainty in data analysis results. By conducting sensitivity tests on different variables or parameters, we can observe how the results vary under different conditions, providing decision-makers with confidence levels and risk assessments of the results. A sensitivity analysis helps decision-makers understand the degree of influence that different variables have on the results, thereby guiding decision making and optimizing model design.
Therefore, this study conducts a sensitivity analysis on the three indicators, EYR, ELR, and ESI, for the tenth-year operation of the building. It examines the sensitivity changes in the three indicators in response to variations of 5%, 8%, 10%, and 12% in the basic data. Three categories of parameter result sensitivity changes are analyzed. Figure 11 presents the sensitivity results under four different hypotheses.
Figure 11 displays the trend of sustainability indicator changes under four hypotheses. Overall, it can be observed that as the data error varies, the fluctuations of the three indicators (EYR, ELR, and ESI) increase (from No. 1 to No. 4). This pattern can be observed from the connections between the median values.
The fact that the relative changes in the important ESI indicator for the 10th anniversary are 6.4%, 9.12%, 10.8%, and 14.9% demonstrates that the accuracy of the underlying data significantly affects the final evaluation results, making its analysis essential.

3.2. LCA-Carbon Footprint Analysis

Using a life cycle carbon footprint calculation method can effectively assess the sustainability of a building from the perspective of carbon emissions. Taking the example of a building system, this approach considers the contribution of various stages such as design, construction, operation, and demolition to carbon emissions, providing quantitative data for evaluating the overall environmental impact of the building. By assessing factors such as the production and transportation of building materials, energy consumption during construction, and the operational phase, it is possible to identify and quantify the main sources of carbon emissions. This information can then be used to provide strategies and guidance to architects and decision-makers for reducing the carbon footprint and improving the sustainability performance of the building. Figure 12, Figure 13, Figure 14, Figure 15 and Figure 16 depict the carbon emission status at different stages.
The carbon emission factors for this section can be referred to in reference [36].

3.2.1. The Carbon Footprint Calculation of Building Material Production Stage

From Figure 12A, it can be seen that steel has the highest carbon emissions (4185.92 tCO2), followed by cement (2060.31 tCO2). Other significant contributors to carbon emissions include iron (822.75 tCO2) and brick (571.91 tCO2). The carbon emissions of building materials, including the overall inputs of the material flow, energy flow, and information flow during the production process, are investigated in this study.

3.2.2. The Carbon Emission of Building Material Transportation Stage

The transportation in this section includes two components: one is the carbon emissions from transporting construction materials, and the other is the carbon emissions during the construction process. The transportation process consists of two types: one is from manufacturers to material processing sites, and the other is from processing sites to construction sites. According to the data statistics and calculations, the total carbon emissions from the construction transportation phase amount to 43tCO2.
The carbon emissions from the construction transportation phase are relatively small compared to the entire building life cycle, but they are still influenced by multiple factors, such as urban traffic congestion, material transportation time, types of material transportation, fuel consumption of transportation vehicles, and so on.

3.2.3. The Carbon Emission of Construction Stage

The biggest advantage of Figure A1 (Figure A1 is in Appendix A) is that it allows us to see the distribution levels of the materials’ carbon emissions for each subsystem. The value “1” represents the level of carbon emissions corresponding to the respective material, while “0” indicates that there are no carbon emissions at that level for the respective material.
The six construction subsystems mentioned in this section are labor and service, water supply and sewage system treatment facilities, heating and cooling systems, electricity installations, the telecommunications system, and the elevator system. Figure 12B illustrates the carbon emissions proportions for these six types, which are 38% (electricity installations), 25% (heating and cooling systems), 14% (water supply and sewage system treatment facilities), 14% (labor and service), 7% (telecommunications system), and 6% (elevator system).
Figure A1 shows the distribution of the carbon emission levels for the construction of the six subsystems. In the figure, it is clear to see the carbon emission consumption levels of the various materials for each system. In this example, taking the power installation system (D) as an example, steel corresponds to a carbon emission level of 1350tCO2, ceramic and cement fall into the 450tCO2 emission-level category, while the rest are at a 150tCO2 emission level. The main advantage of Figure 14 is its ability to provide a clear view of the primary influencing factors for each subsystem, which is beneficial for implementing the corresponding carbon reduction measures.

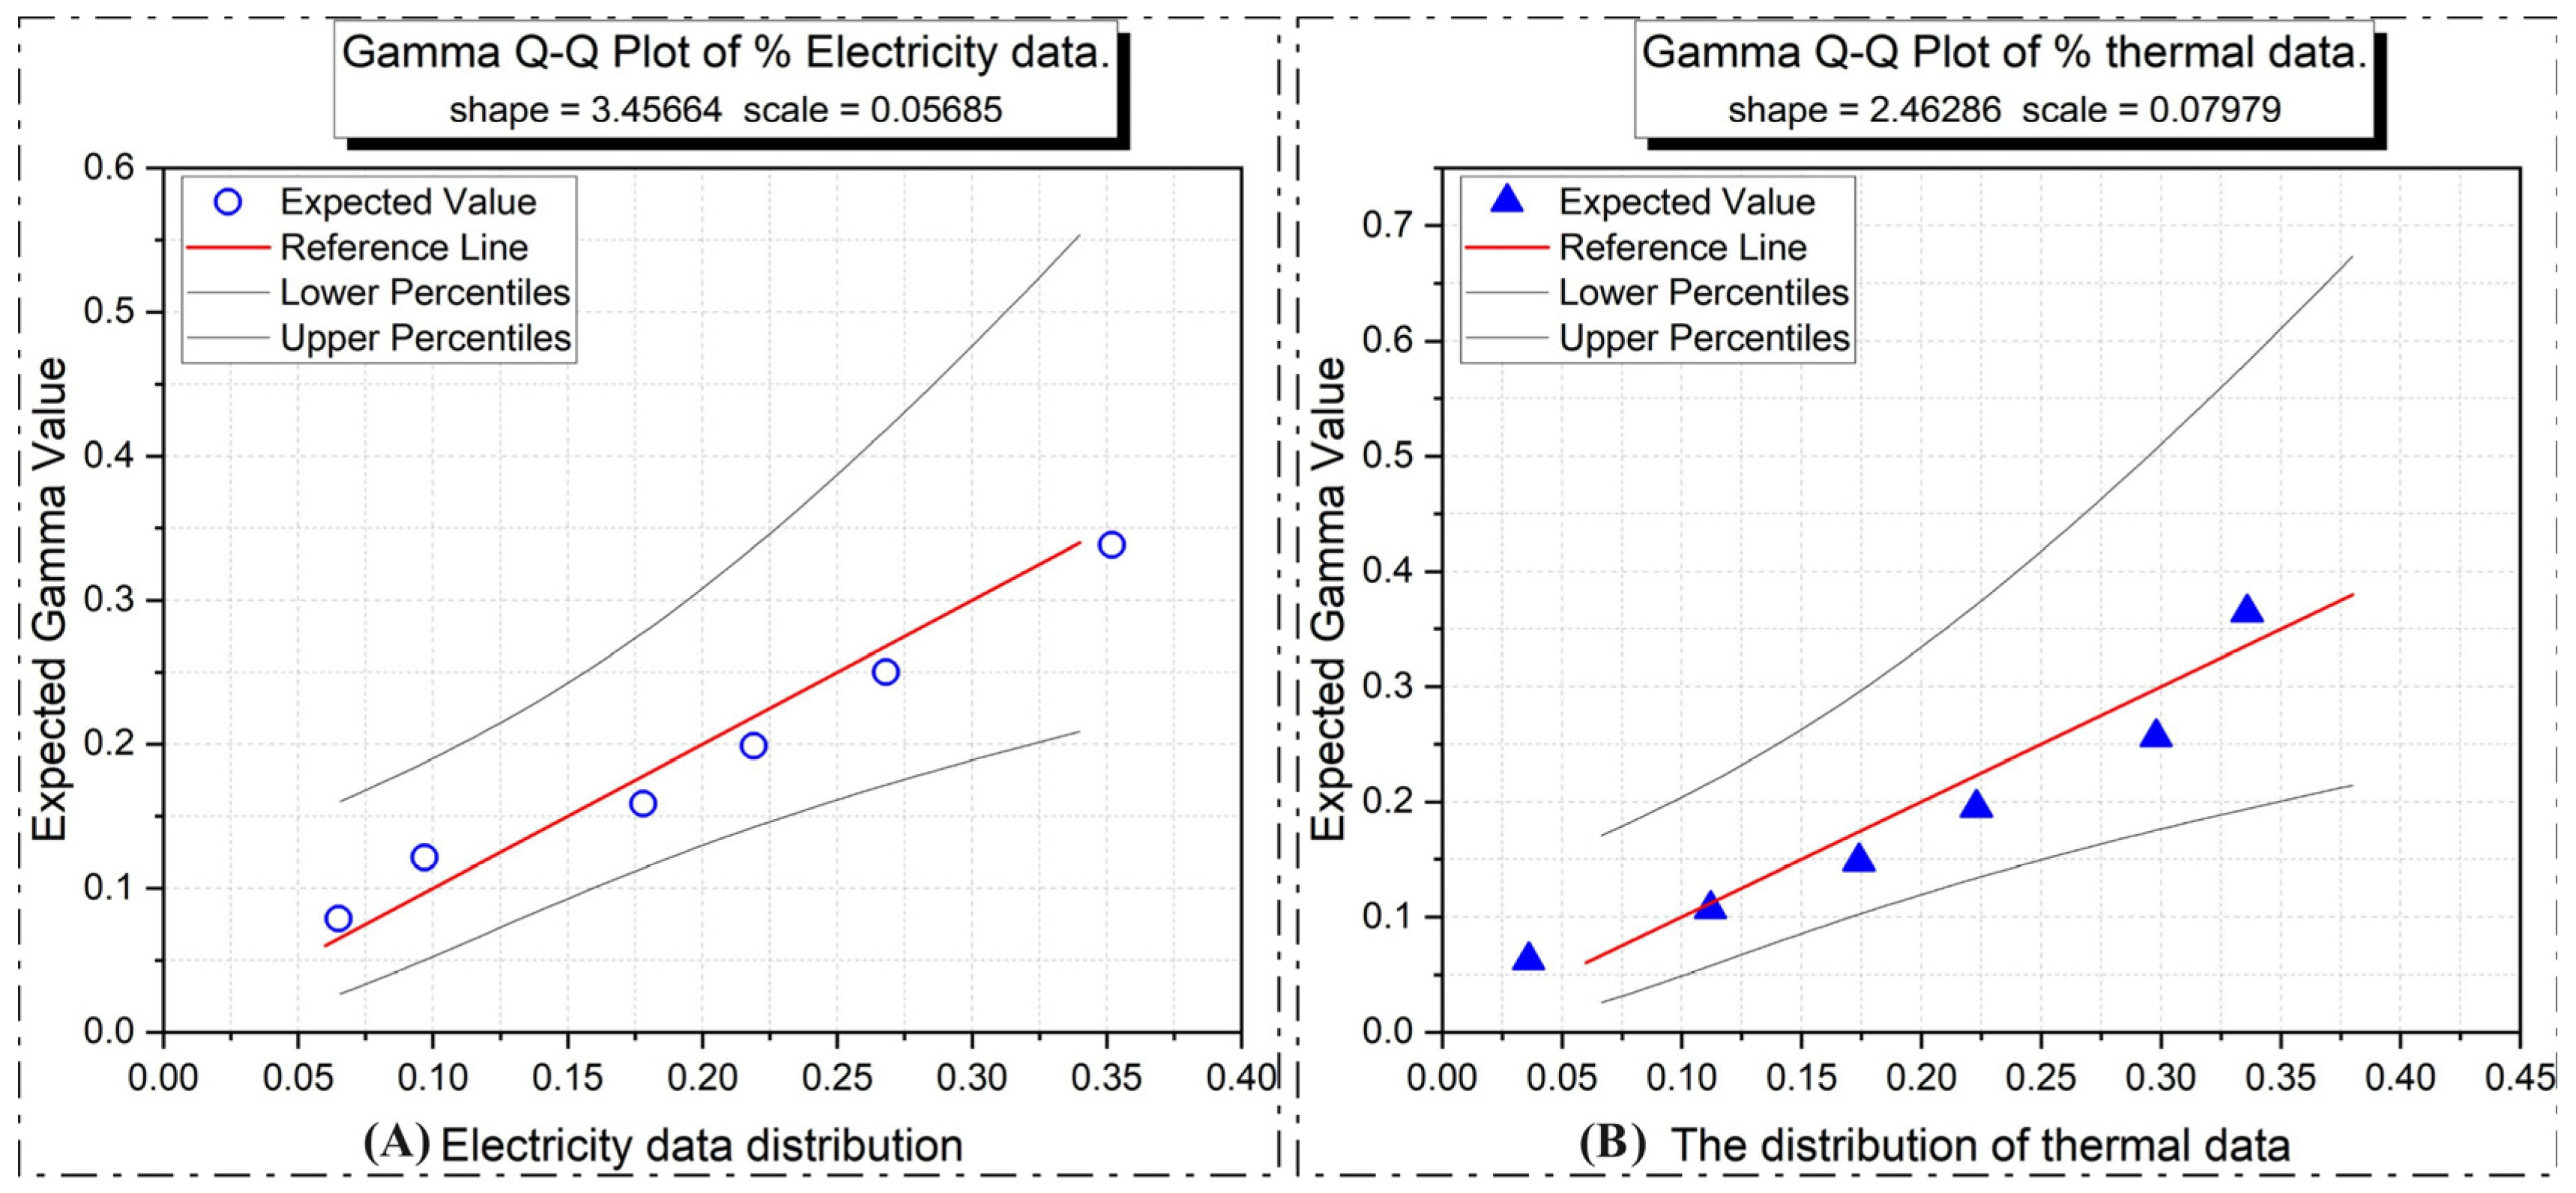
3.2.4. The Carbon Emission in the Building Operation Stage

Due to the long years of usage, the current approach for this building case is ecological and low-carbon transformation. Therefore, the total life cycle of the building system is calculated as 30 years, with estimated operational carbon emissions of 2.18 × 10⁴ tCO2. The data include the electricity consumption, heating and cooling systems, as well as the estimated carbon emissions from building retrofit materials and personnel. Among these, the primary source of the carbon emissions is the power system, which currently relies mainly on fossil fuel-based generation with a relatively small proportion of renewable energy sources.

3.2.5. The Carbon Emission of Building Demolition Stage

Building demolition is a necessary pathway to achieve the renewable utilization of buildings. After the demolition in this case study, seven main categories of materials were identified (Figure 13), including concrete, steel, glass, bricks, PVC panels, aluminum, and diesel, totaling three types. The data for all the materials are estimated based on the current usage. Concrete has the highest carbon emissions proportion, accounting for approximately 39.4%. The carbon emissions from the top four materials (concrete, steel, glass, and bricks) contribute to 82.3% of the total, making them the primary influencing factors.
The carbon emissions proportion during the building demolition stage also depends on the specific material handling methods. Therefore, it is necessary to collect data in a more detailed manner, which requires continuous data collection, statistical analysis, and calculations during the building demolition stage.

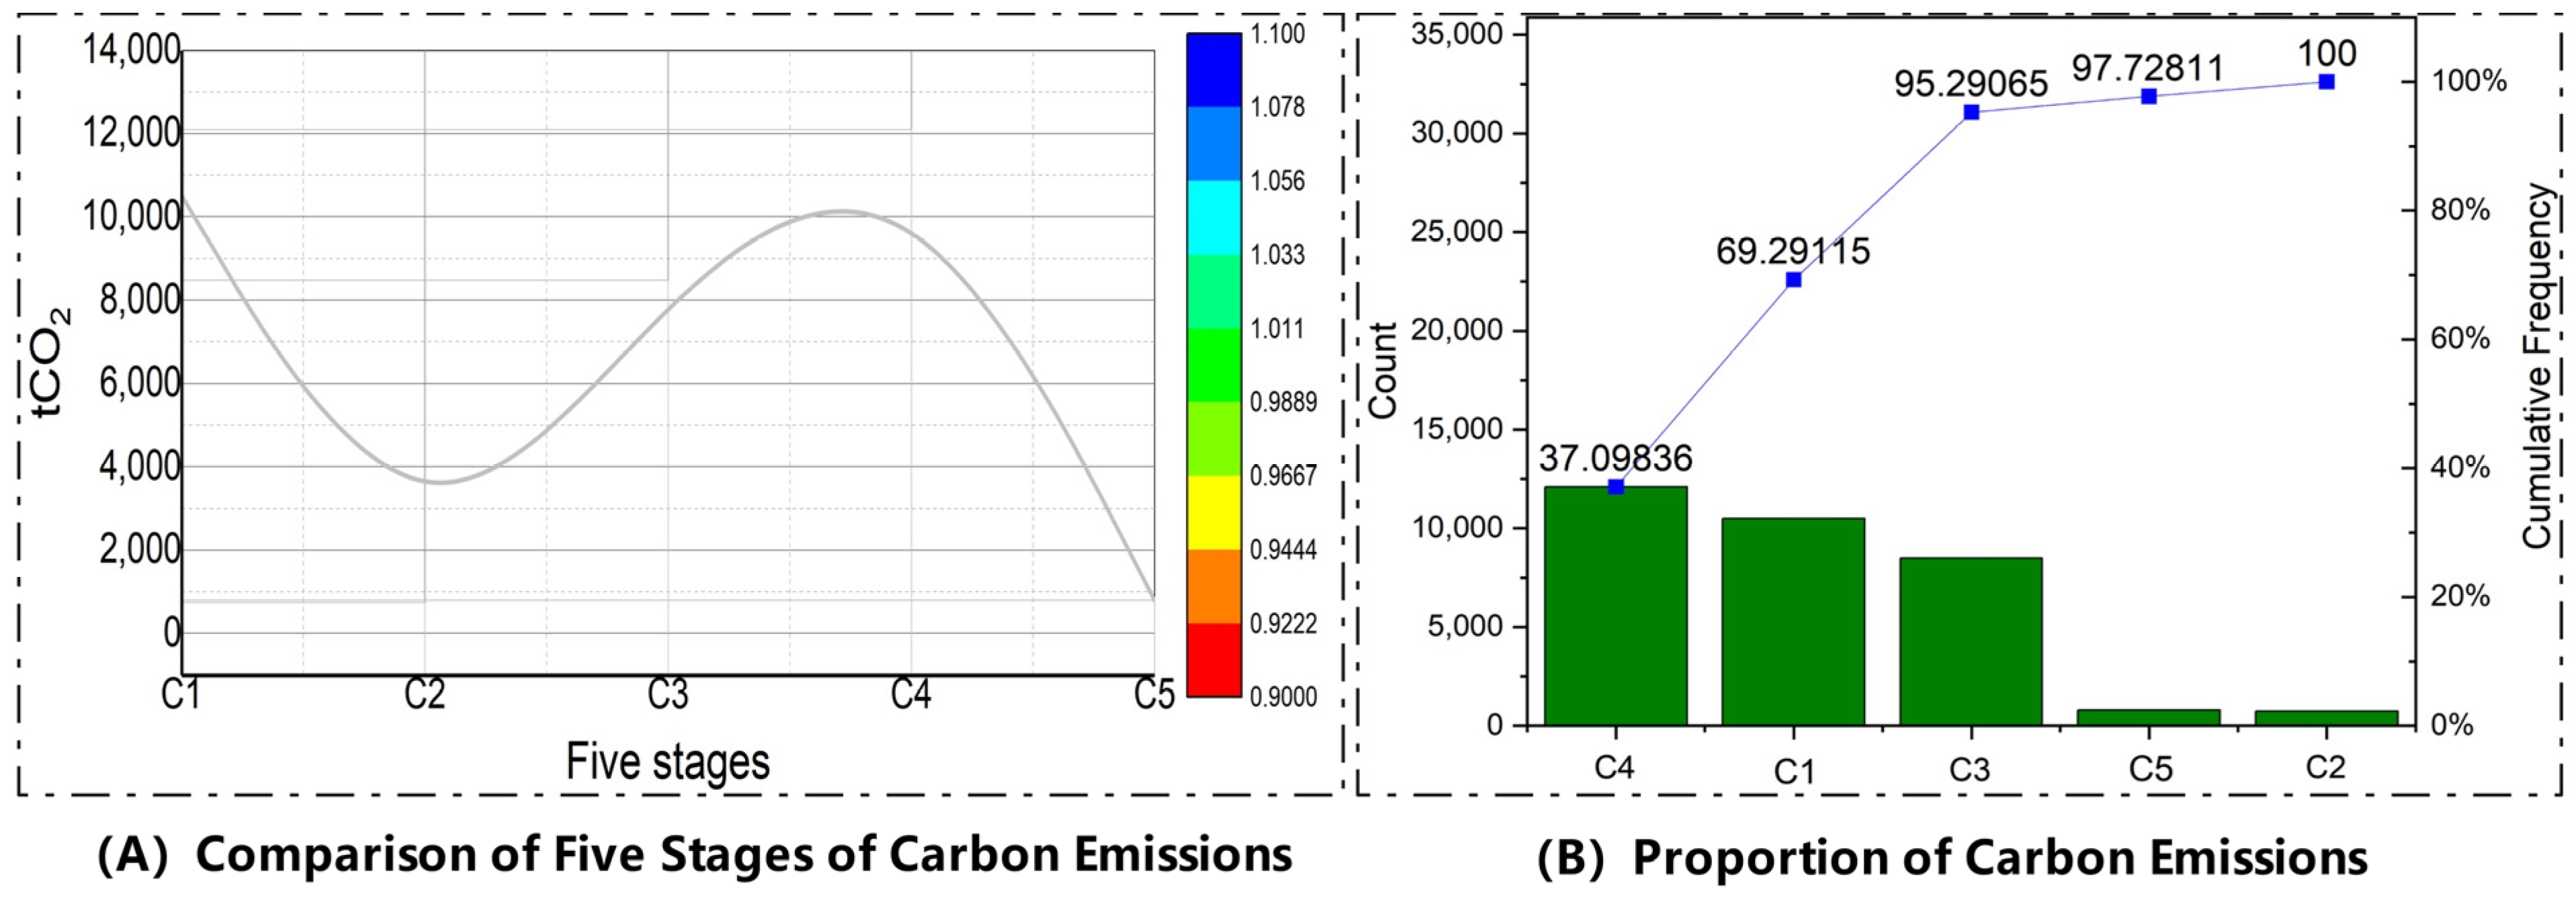
3.2.6. LCA-Carbon Emissions Analysis

Figure 14 shows the distribution of carbon emissions in the five stages of the building life cycle, based on a 10-year operational period. The operational phase of the building has the highest carbon emissions, accounting for 37.1% of the total carbon emissions of the building system. The materials phase follows with approximately 32.2%, and the construction phase accounts for 26%. These three stages together contribute to 95.3% of the total carbon emissions of the building system and are the primary influencing stages.
Reducing the carbon emissions of the building system throughout its life cycle can be achieved through the following methods: (1) Design Phase: Consider energy efficiency and environmental factors during the building design, employing sustainable design principles such as using high-performance insulation materials, energy-efficient equipment, and passive houses to minimize energy consumption and greenhouse gas emissions. (2) Material Selection: Choose low-carbon and renewable materials, such as recycled materials or certified wood, steel, etc. Additionally, reducing concrete usage can significantly lower carbon emissions. (3) Construction Process: Optimize construction plans to reduce energy consumption and waste generation. Using modular or prefabricated components can reduce construction time and waste and improve resource utilization efficiency. (4) Operational Phase: Introduce smart control systems to optimize energy management and usage efficiency. Regular inspections, maintenance, and improvement of building equipment ensure efficient operations. (5) Energy Supply: Use renewable energy sources to meet the building’s energy demands, such as solar power, wind energy, etc. Reducing reliance on traditional fuels further lowers carbon emissions. (6) Waste Management: Implement waste sorting and recycling measures to reduce the environmental impact of building waste. (7) Life Cycle Assessment: Conduct comprehensive life cycle assessments, including the building’s usage phase and post-demolition waste treatment. This helps identify and improve areas with high carbon emissions within the system. By effectively applying these methods, it is possible to significantly reduce the carbon emissions of the building system throughout its life cycle while promoting sustainable development and environmental protection.

3.2.7. Sensitivity Analysis Based on Carbon Emissions View

The operational stage of buildings is considered the primary phase for carbon emissions, with electricity being a major contributing factor. This section analyzes the sensitivity of electricity–thermal and data collection, using six categories of assumptions with data fluctuations of 5%, 10%, 15%, 20%, 25%, and 30%. Figure 15 illustrates the trend of sensitivity changes.
Figure 15 illustrates the sensitivity analysis of the key operational data (electricity and heat) in the building operation phase. When comparing Figure 15A,B, the consistency of the electricity data is relatively good, while the uncertainty of the heat data shows larger variations. This is because electricity data can be directly obtained through statistical information from the power authority, resulting in higher consistency and coherence. On the other hand, heat data exhibit greater fluctuations due to the inherent differences between these two energy types. Electricity supply operates on a long-term basis, while heat supply is intermittent, which is why heat data show larger uncertainties.

4. Analysis of Neural Network Prediction Models

A neural network model was used to analyze and predict the emergy performance indicator (ESI) and carbon emissions of a building system based on inputs related to the material flow, energy flow, and information flow. Figure 16 shows the trends in these predictions under two scenarios.
In this section, the neural network predictive analysis is based on 20 years of mature architectural model data. The data collection frequency is one set per month to analyze the dynamic trend of emergy in the entire building system. Furthermore, it conducts a level analysis of carbon emissions during the corresponding stages. From the Figure 16 analysis, it can be observed that although there is cyclical variation in the emergy throughout the entire period, there are still fluctuations in the actual data. Therefore, it is necessary to combine quantitative data for analysis.
In terms of sustainability indicators, as the lifespan of a building system extends, the overall efficiency of the system decreases (ESI decreases), requiring external inputs of materials, energy, and information to maintain the sustainability level of the building system. This can be observed from Figure 16, where the trend shows a decrease, exceeding a reduction of 15%. As the frequency of building system utilization increases, carbon emissions continue to rise, despite the implementation of low-carbon strategies during building maintenance. The overall magnitude of carbon emissions increases by nearly 20%.
In order to enhance the sustainability of the building system, Section 5 has been designed and quantitatively evaluated, encompassing the application of ecological measures and the utilization of distributed renewable energy.

5. Discussion

Currently, global scholars mainly focus their research on the ecological or low-carbon aspects of building systems. For example, in the intersection of ecological emergy and building systems, the research primarily concentrates on the ecological emergy assessment or quantitative analysis of specific stages in the life cycle [37,38]. This helps determine the relationships between different stages. Some researchers also conduct comparative analyses of the ecological emergy status of different cases as a reference indicator for selecting sustainable solutions [39].
In terms of a carbon footprint analysis, research on building systems primarily focuses on various stages in the life cycle. European researchers, for instance, emphasize the operation of building systems [40], the substitution of low-carbon construction materials [41], and the adoption of low-carbon lifestyles by users [42].
However, there is currently no existing research on the comprehensive analysis of building systems based on the coupling of both ecological emergy and the carbon footprint. Advancing this research would achieve two new objectives. Firstly, it would facilitate the integration of multiple sustainability indicators. Researchers would specifically emphasize integrating various sustainability indicators, such as an emergy analysis and a carbon footprint assessment, to comprehensively evaluate the environmental performance of building systems. Secondly, it would explore the integration of renewable energy to reduce emergy consumption and carbon emissions in building systems. This includes investigating high-efficiency energy-saving technologies, passive design strategies, and renewable energy generation systems.
The significance of this research lies in expanding the possibilities of sustainable architecture and providing architects, urban managers, and scholars with new directions for consideration.

6. Sustainability Improvement Measures

This study incorporates a rainwater harvesting and treatment system along with an efficient energy management system to investigate the sustainable impact on building systems.

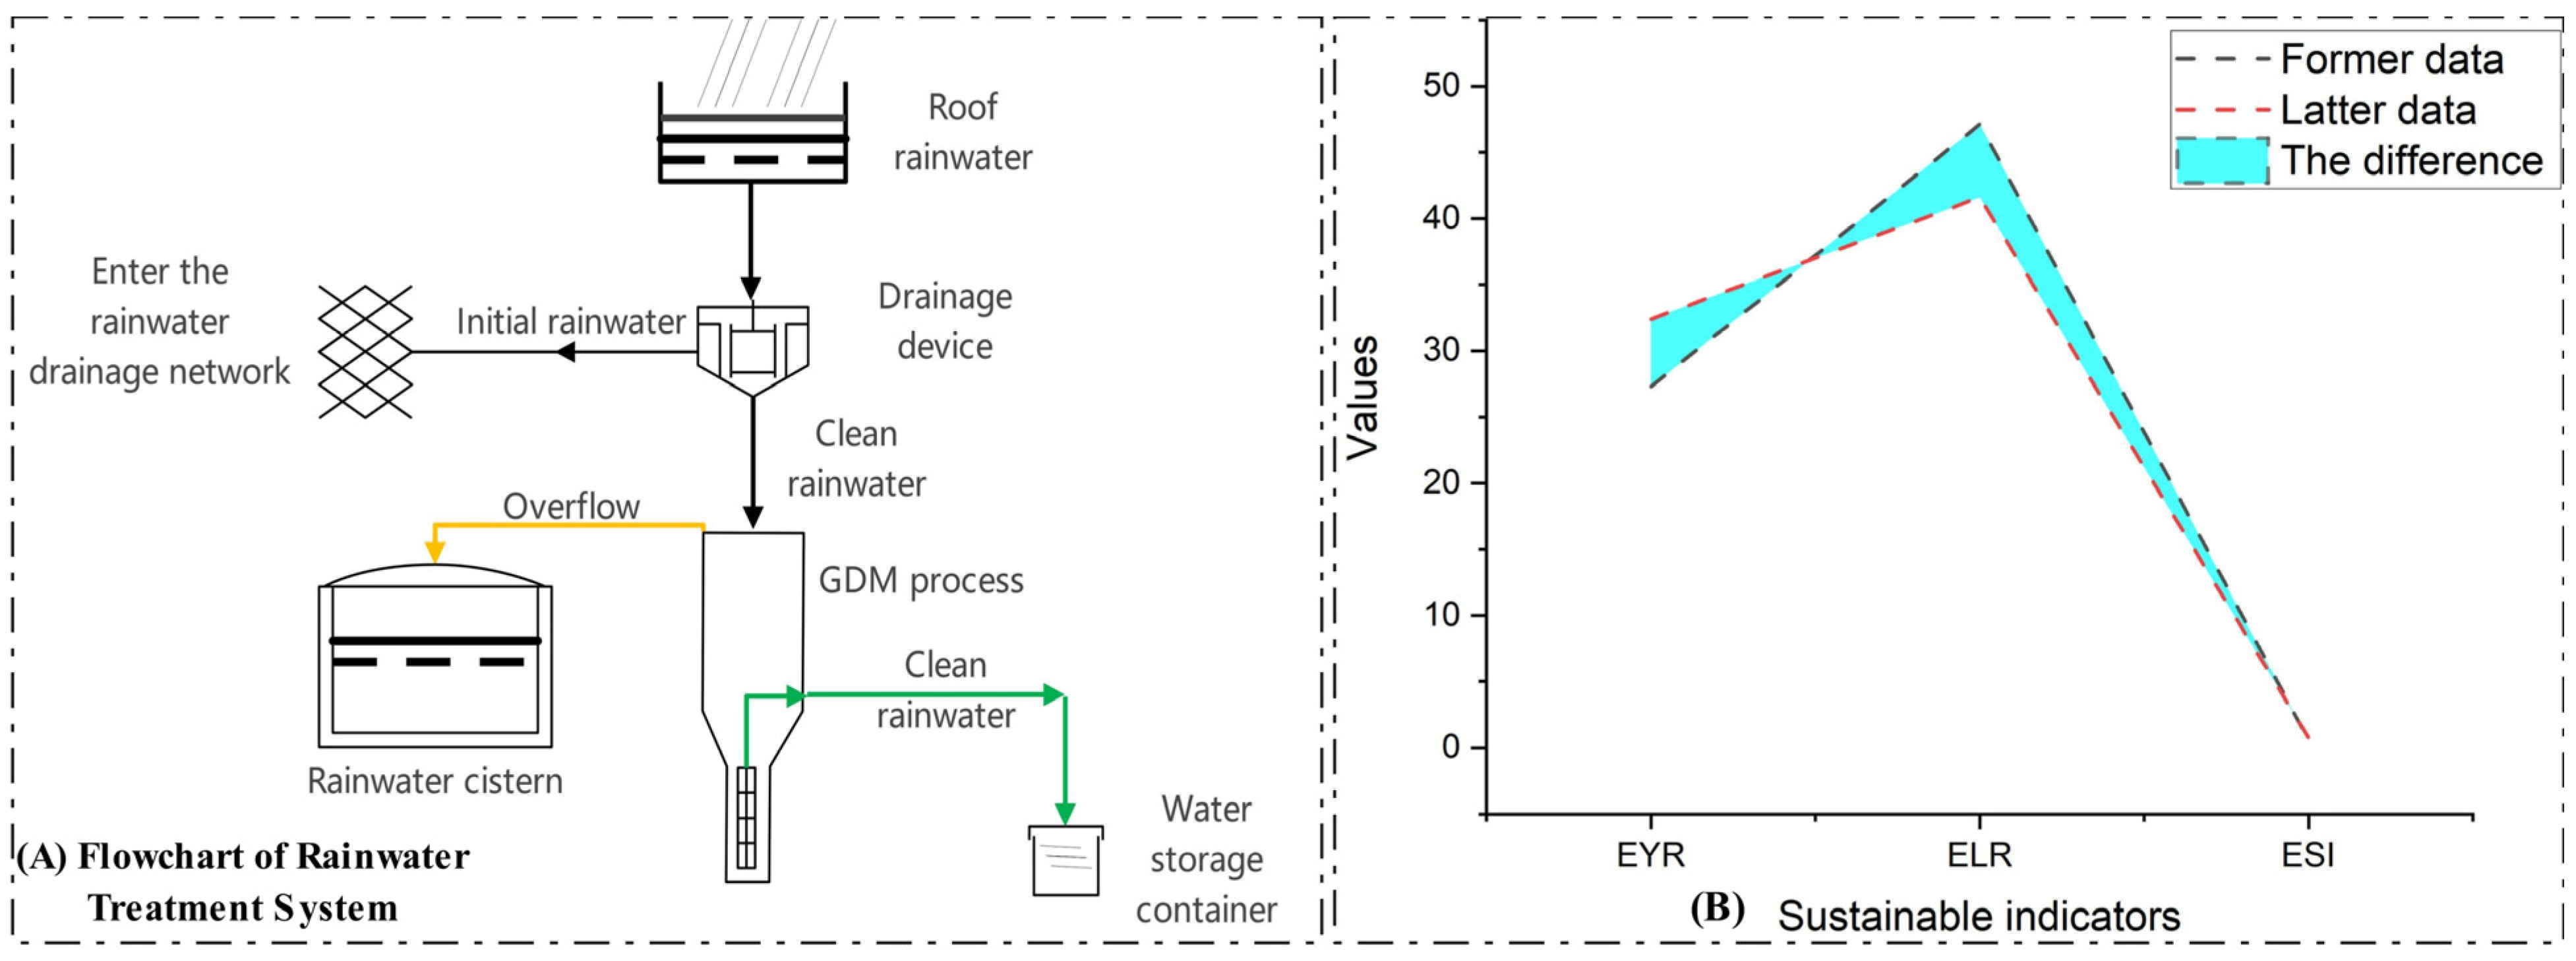
6.1. Rainwater harvesting System Measures

The use of rainwater harvesting systems reduces the ecological pressure on building systems, particularly the input demand for water resources, thereby decreasing the overall energy input of the entire building system and reducing environmental stress. In this section, we will examine the parameter changes before and after the utilization of rainwater harvesting systems using three energy-related indicators: EYR, ELR, and ESI.
Figure 17A illustrates the schematic diagram of a rainwater harvesting system, including the entire process of roof rainwater collection, drainage device, greywater treatment (GDM) process, and water storage container. In Figure 17B, the trend of the three indicators after implementing a rainwater harvesting system is observed. Firstly, the EYR increases, indicating an improvement in the overall system efficiency. Secondly, the ELR decreases, demonstrating a reduction in the environmental pressure on the building system. Finally, the ESI parameter increases, indicating an approximate 35% enhancement in the sustainability of the entire building system.

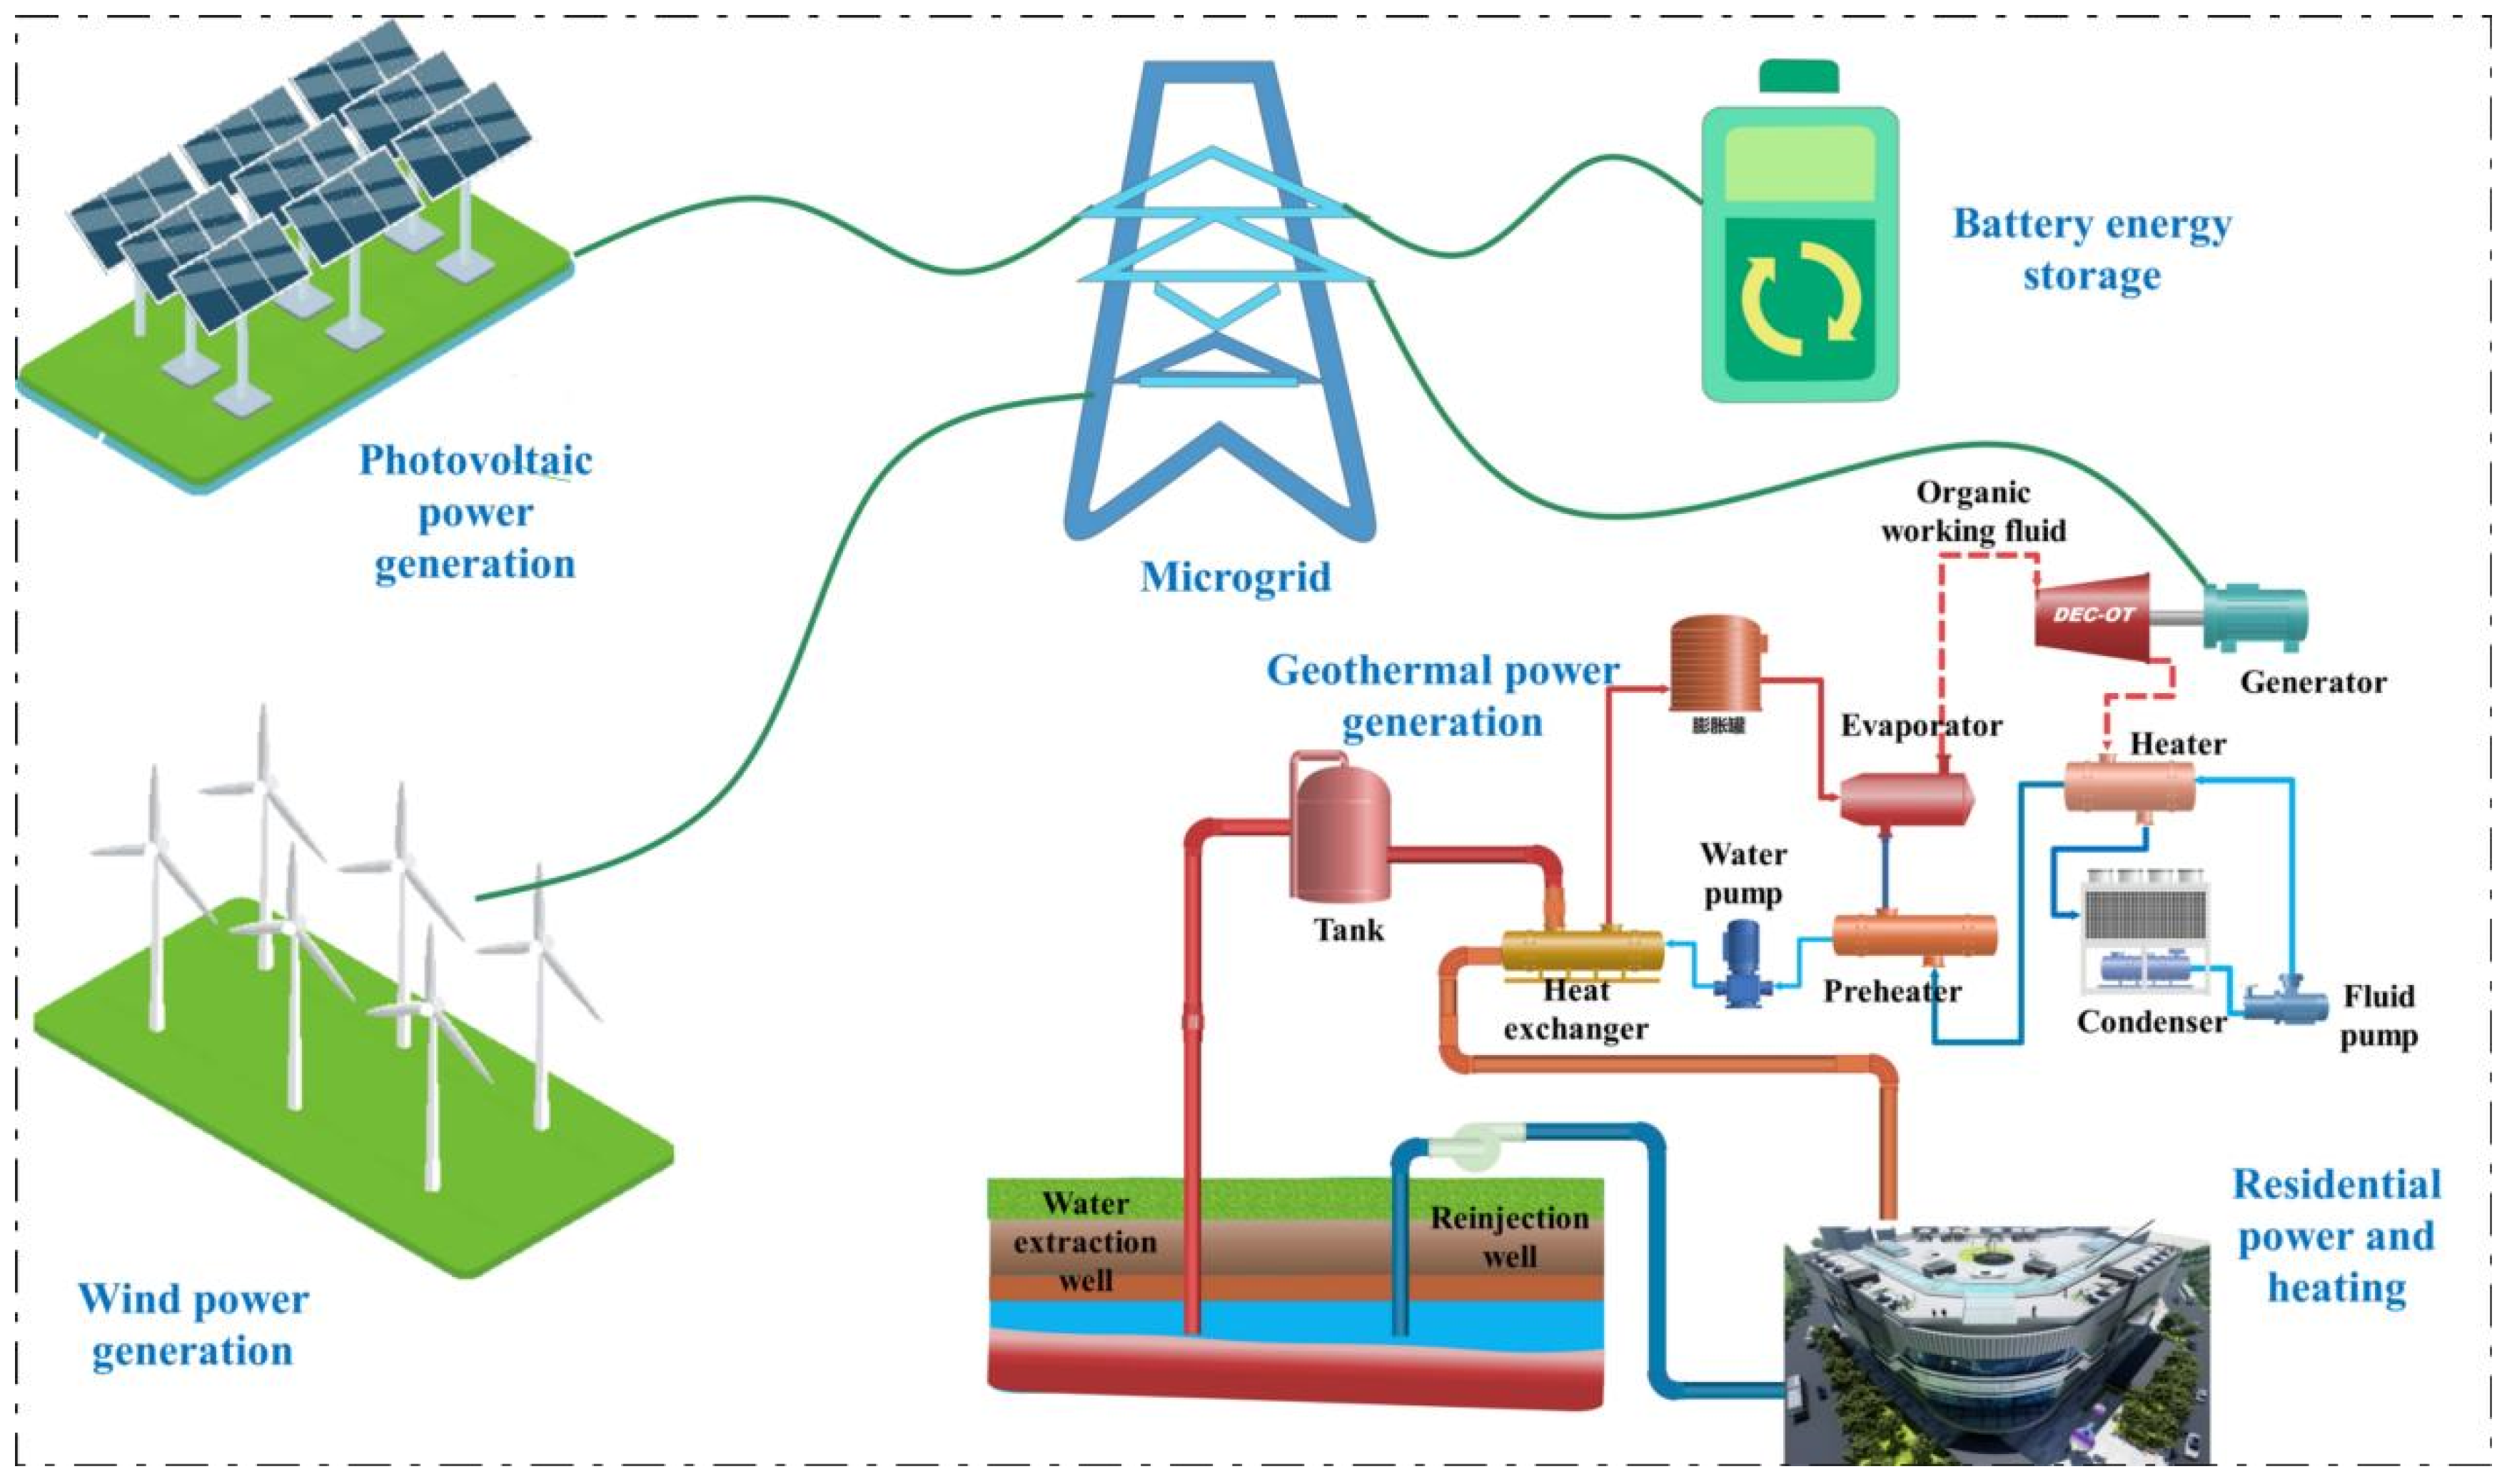
6.2. Comprehensive Energy System Utilization

The widespread adoption of renewable energy building systems can effectively reduce the carbon emissions of building systems. In this section, we attempt to integrate four types of energy systems, solar energy, wind energy, battery energy, and geothermal energy, to provide power and heating for building systems, completely replacing fossil energy (in Figure 18). After collecting the statistical data, a comparison is made between the carbon emissions of buildings before and after the implementation of the new energy system. Figure 18 illustrates the new comprehensive energy system.
Due to the replacement of traditional energy systems with renewable energy systems, carbon emissions are significantly reduced in building systems. It is estimated that over a period of 10 years, approximately 21,800 metric tons of CO2 can be reduced. However, the production processes of solar energy systems, wind energy systems, and battery storage systems do not involve carbon emissions.

7. Conclusions

Through the analysis of emergy consumption and carbon emissions throughout the entire life cycle of the building system, the main influencing stages have been identified. The operational phase and the materials phase of the building are the major contributors to emergy consumption and carbon emissions, accounting for the majority of the outputs of the entire building system. Among them, the operational phase of the building is complex, as different equipment, usage patterns, and usage times can lead to significant variations. Currently, this study involves six main types of equipment, with a commonly used usage pattern and data collected based on working hours and non-working hours, providing a reference of general relevance for commercial buildings.
This study also needs to be improved in certain aspects. For example, detailed data collection is required to accurately calculate the material flow, energy flow, and information flow inputs of each major operational equipment in the building system in order to achieve a more accurate assessment of the sustainability status of the building system. In addition to more detailed data collection, the next step involves incorporating sustainability measures more extensively into the design of this case study system, such as implementing a new energy management system, ecological design measures, and sustainable management strategies.
Future exploration in this field focuses on the following: (1) Development of integrated indicators: Developing integrated indicators that relate ecological emergy and carbon footprint with other sustainability metrics. This can be achieved by balancing the weights between different indicators to reflect the relationship between ecological emergy and the carbon footprint. (2) Multi-objective optimization: Using multi-objective optimization methods to minimize the ecological footprint while reducing carbon emissions. Such methods consider the coupling of ecological emergy and the carbon footprint and seek to find a balance point. (3) Model integration and collaborative optimization: Integrating different models and performing collaborative optimization to simultaneously consider ecological emergy and the carbon footprint. This approach may involve integrating different types of models, such as life cycle assessment models, emergy models, and carbon emission models. It should be noted that these methods are still in the research stage, and there are challenges in coupling ecological emergy and carbon footprint research. Further research and exploration will contribute to the advancement of this field and facilitate the comprehensive assessment and design of sustainable building systems.

Author Contributions

Conceptualization, J.Z.; investigation, Y.Z.; formal analysis, J.Z.; methodology, J.Z.; resources, Y.Z.; writing—review and editing, A.T.A. All authors have read and agreed to the published version of the manuscript.

Funding

This research was funded by the XJTLU Urban and Environmental Studies University Research Centre (UES) (UES-RSF-23030601) and the Zhejiang Engineering Research Center of Building’s Digital Carbon Neutral Technology (No. ZJ2022YB-04).

Institutional Review Board Statement

Not applicable.

Informed Consent Statement

Not applicable.

Data Availability Statement

No new data were created or analyzed in this study. Data sharing is not applicable to this article.

Conflicts of Interest

The authors declare no conflicts of interest.

Appendix A

Table A1. The emergy of the building construction stage.
ItemDataUnitUEVs
Land use1.04 × 1011J9.42 × 104 sej/J
Solar7.78 × 1012J1.00 sej/J
Steel9.42 × 106Kg3.53 × 1012 sej/kg
PVC1.52 × 104Kg7.49 × 1012 sej/kg
Brass1.34 × 104Kg1.33 × 1012 sej/kg
Glass fiber1.52 × 104Kg2.28 × 1012 sej/kg
Iron5.29 × 104Kg3.15 × 1012 sej/kg
Ceramic1.05 × 106Kg2.43 × 1012 sej/kg
Glass7.61 × 105Kg1.07 × 1012 sej/kg
Cement9.65 × 105Kg2.94 × 1012 sej/kg
Water8.71 × 103Kg2.67 × 1012 sej/kg
Gravel1.09 × 104Kg1.27 × 1012 sej/kg
Steel8.33 × 104Kg2.1 × 1012 sej/kg
Aluminum1.07 × 103Kg9.65 × 1011 sej/kg
Glass wool1.63 × 103Kg7.28 × 1012 sej/kg
Brass1.54 × 103Kg1.33 × 1013 sej/kg
Copper1.57 × 103Kg1.52 × 1012 sej/kg
Copper2.43 × 103Kg1.52 × 1012 sej/kg
Steel1.63 × 105Kg2.1 × 1012 sej/kg
Rubber1.26 × 104Kg5.48 × 1012 sej/kg
Polyester1.42 × 104Kg7.34 × 1012 sej/kg
Iron9.84 × 103Kg3.15 × 1012 sej/kg
Ceramics1.23 × 104Kg2.43 × 1012 sej/kg
Plastic1.80 × 104Kg4.37 × 1012 sej/kg
Glass6.91 × 103Kg1.07 × 1012 sej/kg
Copper1.02 × 104Kg1.52 × 1012 sej/kg
PVC1.21 × 104Kg7.49 × 1012 sej/kg
Glass1.61 × 104Kg1.07 × 1012 sej/kg
Steel1.23 × 104Kg2.1 × 1012 sej/kg
Steel3.81 × 104Kg2.1 × 1012 sej/kg
Rubber9.63 × 102Kg5.48 × 1012 sej/kg
Iron1.61 × 103Kg3.15 × 1012 sej/kg
Glass1.64 × 103Kg1.07 × 1012 sej/kg
Diesel fuel1.42 × 108J1.36 × 105 sej/J
Table A2. The emergy of building operation stage.
ItemDataUnitUEVs
Solar2.00 × 1012J1.00 sej/J
Electricity2.88 × 1015J6.39 × 104 sej/J
Heat1.48 × 1012J2.01 × 106 sej/J
Water1.02 × 108kg2.67 × 109 sej/kg
Table A3. The emergy of building renewal stage.
ItemDataUnitUEVs
PVC6.27 × 103Kg2.22 × 1011 sej/kg
Cement2.60 × 105Kg2.94 × 1012 sej/kg
Water5.23 × 106Kg2.67 × 109 sej/kg
Diesel fuel3.72 × 106Kg1.36 × 105 sej/kg
Table A4. The emergy of building demolition stage.
ItemDataUnitUEVs
Glass2.01 × 106Kg2.21 × 1011 sej/kg
Iron1.08 × 107Kg2.31 × 1011 sej/kg
PVC8.21 × 103Kg2.22 × 1011 sej/kg
Aluminum1.26 × 104Kg2.21 × 1011 sej/kg
Bricks2.11 × 104Kg2.03 × 1011 sej/kg
Concrete4.35 × 105Kg1.19 × 1012 sej/kg
Diesel fuel3.40 × 109J1.36 × 105 sej/J
Figure A1. The carbon emission distribution of six subsystems. (Note: Graphs (AF) represent the carbon emissions distribution of human services, water supply, HVAC (Heating, Ventilation, and Air Conditioning), electrical installations, telecommunication systems, and elevator installations).
Sustainability 16 00329 g0a1

References

  1. Goubran, S.; Walker, T.; Cucuzzella, C.; Schwartz, T. Green building standards and the United Nations’ Sustainable Development Goals. J. Environ. Manag. 2023, 326, 116552. [Google Scholar] [CrossRef] [PubMed]
  2. Guidetti, E.; Ferrara, M. Embodied energy in existing buildings as a tool for sustainable intervention on urban heritage. Sustain. Cities Soc. 2023, 88, 104284. [Google Scholar] [CrossRef]
  3. Noyce, G.L.; Smith, A.J.; Kirwan, M.L.; Rich, R.L.; Megonigal, J.P. Oxygen priming induced by elevated CO2 reduces carbon accumulation and methane emissions in coastal wetlands. Nat. Geosci. 2023, 16, 63–68. [Google Scholar] [CrossRef]
  4. Jiang, P.; Sonne, C.; You, S. Dynamic Carbon-Neutrality Assessment Needed to Tackle the Impacts of Global Crises. Environ. Sci. Technol. 2022, 56, 9851–9853. [Google Scholar] [CrossRef] [PubMed]
  5. Chen, R.; Tsay, Y.-S.; Zhang, T. A multi-objective optimization strategy for building carbon emission from the whole life cycle perspective. Energy 2023, 262, 125373. [Google Scholar] [CrossRef]
  6. Du, Q.; Wang, Y.; Pang, Q.; Hao, T.; Zhou, Y. The dynamic analysis on low-carbon building adoption under emission trading scheme. Energy 2023, 263, 125946. [Google Scholar] [CrossRef]
  7. Plieninger, T.; Dijks, S.; Oteros-Rozas, E.; Bieling, C. Assessing, mapping, and quantifying cultural ecosystem services at community level. Land Use Policy 2013, 33, 118–129. [Google Scholar] [CrossRef]
  8. Droz, A.G.; Cofman, R.R.; Fulton, T.G.; Blackwood, C.B. Moving beyond habitat analogs: Optimizing green roofs for a balance of ecosystem services. Ecol. Eng. 2021, 173, 106422. [Google Scholar] [CrossRef]
  9. Benyus, J.; Dwyer, J.; El-Sayed, S.; Hayes, S.; Baumeister, D.; Penick, C.A. Ecological performance standards for regenerative urban design. Sustain. Sci. 2022, 17, 2631–2641. [Google Scholar] [CrossRef]
  10. Hu, S.; Zhang, Y.; Yang, Z.; Yan, D.; Jiang, Y. Challenges and opportunities for carbon neutrality in China’s building sector—Modelling and data. Build. Simul. 2022, 15, 1899–1921. [Google Scholar] [CrossRef]
  11. Zhang, N.; Luo, Z.; Liu, Y.; Feng, W.; Zhou, N.; Yang, L. Towards low-carbon cities through building-stock-level carbon emission analysis: A calculating and mapping method. Sustain. Cities Soc. 2022, 78, 103633. [Google Scholar] [CrossRef]
  12. Gan, L.; Liu, Y.; Shi, Q.; Cai, W.; Ren, H. Regional inequality in the carbon emission intensity of public buildings in China. Build. Environ. 2022, 225, 109657. [Google Scholar] [CrossRef]
  13. Zhang, J.; Ma, L. Urban ecological security dynamic analysis based on an innovative emergy ecological footprint method. Environ. Dev. Sustain. 2021, 23, 16163–16191. [Google Scholar] [CrossRef]
  14. Zhang, J.; Ma, L. Environmental Sustainability Assessment of a New Sewage Treatment Plant in China Based on Infrastructure Construction and Operation Phases. Emergy Anal. Water 2020, 12, 484. [Google Scholar] [CrossRef]
  15. Oliveira, M.; Cocozza, A.; Zucaro, A.; Santagata, R.; Ulgiati, S. Circular economy in the agro-industry: Integrated environmental assessment of dairy products. Renew. Sustain. Energy Rev. 2021, 148, 111314. [Google Scholar] [CrossRef]
  16. Sadeghi, M.; Srebric, J.; Sasic Kalagasidis, A. Emergy-based assessment of sustainable building strategies: A case study for residential buildings in Iran. Energy Build. 2013, 57, 204–214. [Google Scholar]
  17. Huang, H.C.; Chou, C.W. Assessing the environmental performance of buildings through emergy synthesis: Case study of a university building in Taiwan. J. Clean. Prod. 2015, 87, 629–639. [Google Scholar]
  18. Alibaba, M.; Pourdarbani, R.; Manesh, M.H.K.; Ochoa, G.V.; Forero, J.D. Thermodynamic, exergo-economic and exergo-environmental analysis of hybrid geothermal-solar power plant based on ORC cycle using emergy concept. Heliyon 2020, 6, 03758. [Google Scholar] [CrossRef]
  19. Yadegaridehkordi, E.; Hourmand, M.; Nilashi, M.; Alsolami, E.; Samad, S.; Mahmoud, M.; Alarood, A.A.; Zainol, A.; Majeed, H.D.; Shuib, L. Assessment of sustainability indicators for green building manufacturing using fuzzy multi-criteria decision making approach. J. Clean. Prod. 2020, 277, 122905. [Google Scholar] [CrossRef]
  20. Paneru, S.; Jahromi, F.F.; Hatami, M.; Roudebush, W.; Jeelani, I. Integration of Emergy Analysis with Building Information Modeling. Sustainability 2021, 13, 7990. [Google Scholar] [CrossRef]
  21. Wang, J.; Xu, S.; Ma, G.; Gou, Q.; Zhao, P.; Jia, X. Emergy analysis and optimization for a solar-driven heating and cooling system integrated with air source heat pump in the ultra-low energy building. J. Build. Eng. 2023, 63, 105467. [Google Scholar] [CrossRef]
  22. Thomas, T.; Praveen, A. Emergy parameters for ensuring sustainable use of building materials. J. Clean. Prod. 2020, 276, 122382. [Google Scholar] [CrossRef]
  23. Wang, X.; Du, Q.; Lu, C.; Li, J. Exploration in carbon emission reduction effect of low-carbon practices in prefabricated building supply chain. J. Clean. Prod. 2022, 368, 133153. [Google Scholar] [CrossRef]
  24. Lou, Y.; Yang, Y.; Ye, Y.; He, C.; Zuo, W. The economic impacts of carbon emission trading scheme on building retrofits: A case study with U.S. medium office buildings. Build. Environ. 2022, 221, 109311. [Google Scholar] [CrossRef]
  25. Liu, W.; Zuo, B.; Qu, C.; Ge, L.; Shen, Q. A reasonable distribution of natural landscape: Utilizing green space and water bodies to reduce residential building carbon emissions. Energy Build. 2022, 267, 112150. [Google Scholar] [CrossRef]
  26. Gan, L.; Ren, H.; Cai, W.; Wu, K.; Liu, Y.; Liu, Y. Allocation of carbon emission quotas for China’s provincial public buildings based on principles of equity and efficiency. Build. Environ. 2022, 216, 108994. [Google Scholar] [CrossRef]
  27. Grinham, J.; Fjeldheim, H.; Yan, B.; Helge, T.D.; Edwards, K.; Hegli, T.; Malkawi, A. Zero-carbon balance: The case of HouseZero. Build. Environ. 2022, 207, 108511. [Google Scholar] [CrossRef]
  28. Zhang, Y.; Jiang, X.; Cui, C.; Skitmore, M. BIM-based approach for the integrated assessment of life cycle carbon emission intensity and life cycle costs. Build. Environ. 2022, 226, 109691. [Google Scholar] [CrossRef]
  29. Kang, Y.; Xu, W.; Wu, J.; Li, H.; Liu, R.; Lu, S.; Rong, X.; Xu, X.; Pang, F. Study on comprehensive whole life carbon emission reduction potential and economic feasibility impact based on progressive energy-saving targets: A typical renovated ultra-low energy office. J. Build. Eng. 2022, 58, 105029. [Google Scholar] [CrossRef]
  30. Röck, M.; Saade, M.R.M.; Balouktsi, M.; Rasmussen, F.N.; Birgisdottir, H.; Frischknecht, R.; Habert, G.; Lützkendorf, T.; Passer, A. Embodied GHG emissions of buildings—The hidden challenge for effffective climate change mitigation. Appl. Energy 2020, 258, 114107. [Google Scholar] [CrossRef]
  31. Rajapaksha, I.; Karunasena, G. Neural Network-based Models for Predicting Greenhouse Gas Emissions in Sustainable Buildings. Sustain. Cities Soc. 2020, 61, 102331. [Google Scholar]
  32. Gupta, A.; Jain, R.; Talukdar, S. Neural Network-based Model for Energy Demand Prediction in Sustainable Buildings. Sustain. Comput. Inform. Syst. 2020, 25, 100424. [Google Scholar]
  33. Garcia-Gonzalez, J.; Cid-Fuentes, S.; Cuellar-Franca, R.M. Sustainable Building Design Optimization Using Artificial Neural Networks and Genetic Algorithms. Energies 2020, 13, 1535. [Google Scholar]
  34. Odum, H.T. Environmental Accounting. In Emergy and Environmental Decision Making; John and Wiley and Sons: Hoboken, NJ, USA, 1996; pp. 32–34. [Google Scholar]
  35. Chen, X.; Wang, H.; Zhang, J.; Zhang, H.; Asutosh, A.T.; Wu, G.; Wei, G.; Shi, Y.; Yang, M. Sustainability Study of a Residential Building near Subway Based on LCA-Emergy Method. Buildings 2022, 12, 679. [Google Scholar] [CrossRef]
  36. CPCD, China Products Carbon Footprint Factors Database. Available online: www.caep.org.cn/sy/tdftzhyjzx/zxdt/202201/t20220105_966202.shtml (accessed on 1 November 2023).
  37. Raulin, J. Emergy assessment of a building life cycle: A review on methods and applications. Build. Environ. 2015, 91, 244–255. [Google Scholar] [CrossRef]
  38. Silva, V.C.; Sousa, V.; de Brito, J.; Pinheiro, M.D. Emergy-based assessment of the environmental performance of construction materials: A review. J. Clean. Prod. 2019, 237, 117774. [Google Scholar] [CrossRef]
  39. Wang, L.; Ding, G.; Hong, J.; Ji, X. Life cycle assessment and emergy evaluation for residential buildings in China: A comparative study. Sustain. Cities Soc. 2020, 54, 101976. [Google Scholar] [CrossRef]
  40. Mitterrutzner, B.; Callegher, C.Z.; Fraboni, R.; Wilczynski, E.; Pezzutto, S. Review of heating and cooling technologies for buildings: A techno-economic case study of eleven European countries. Energy 2023, 284, 129252. [Google Scholar] [CrossRef]
  41. Habert, G.; Armani, R.; Monteiro PJ, M. Life-cycle assessment of cladding products in the European context. Energy Build. 2015, 109, 334–348. [Google Scholar] [CrossRef]
  42. Pomponi, F.; Moncaster, A.; De Wolf, C. Embodied carbon mitigation and reduction in the built environment—What does the evidence say? Energy Build. 2013, 61, 74–96. [Google Scholar] [CrossRef]
Figure 1. Research framework.
Sustainability 16 00329 g001
Figure 2. Case introduction.
Sustainability 16 00329 g002
Figure 3. Data processing structure diagram.
Sustainability 16 00329 g003
Figure 4. Carbon footprint pathway of building system.
Sustainability 16 00329 g004
Figure 5. Emergy calculation model for the entire life cycle of building systems.
Sustainability 16 00329 g005
Figure 6. Emergy sustainability index.
Sustainability 16 00329 g006
Figure 7. Feedback paths.
Sustainability 16 00329 g007
Figure 8. Neural network prediction model diagram.
Sustainability 16 00329 g008
Figure 9. Emergy analysis of building system. (N1—building material production stage; N2—building material transport phase; N3—building construction stage; N4—building operation stage; and N5—building demolition stage).
Sustainability 16 00329 g009
Figure 10. Trends in sustainability indicators.
Sustainability 16 00329 g010
Figure 11. Sensitivity analysis based on emergy perspective.
Sustainability 16 00329 g011
Figure 12. Carbon emissions distribution and proportion of six subsystems.
Sustainability 16 00329 g012
Figure 13. The carbon emission proportion.
Sustainability 16 00329 g013
Figure 14. Distribution of carbon emissions throughout the building life cycle. (C1—building material production stage; C2—building material transportation stage; C3—construction stage; C4—building operation stage; and C5—building demolition stage).
Sustainability 16 00329 g014
Figure 15. The sensitivity varies electrical data.
Sustainability 16 00329 g015
Figure 16. Predicted trends in emergy and carbon emissions.
Sustainability 16 00329 g016
Figure 17. Rainwater treatment system.
Sustainability 16 00329 g017
Figure 18. Comprehensive energy system diagram.
Sustainability 16 00329 g018
Table 1. Carbon emission calculation model.
NameSymbolEquationExplanations
Raw material stageX1 X 1 = m = 1 n B m × F m B m : type of material/energy; F m : carbon emission factor for the material
Transportation stageX2 X 2 = k = 1 n T k × L k × F k T k : type of transportation; L k : distance traveled; F k : emission factor
Construction stageX3 X 3 = k = 1 n D k × C k D k : type of construction; C k : corresponding emission factor converted for the project category
Operation stageX4 X 4 = C 1 + C 2 + C 3 + C 4
C 1 = ( E 1 / α ) × δ
C 2 = ( E 2 / α ) × δ
C 3 = E 3 × ξ × δ
C 4 = E 4 × ξ × δ
C 1 : carbon emissions from heating energy consumption; C 2 : carbon emissions from cooling energy consumption; C 3 : carbon emissions from lighting; C 4 : carbon emissions from equipment energy consumption; E 1 : annual total heat load of the calculation unit; E 2 : annual total cooling load of the calculation unit; E 3 : annual total electricity consumption for lighting; E 4 : annual total electricity consumption for equipment; E 4 : annual total heat load of the calculation unit; α : electricity carbon emission factor; δ : energy-saving renovation coefficient
Dismantling stageX5 X 5 = k = 1 n U k × G k U k : the type of disassembly material or the amount of oil used; G k : emission factor
Disclaimer/Publisher’s Note: The statements, opinions and data contained in all publications are solely those of the individual author(s) and contributor(s) and not of MDPI and/or the editor(s). MDPI and/or the editor(s) disclaim responsibility for any injury to people or property resulting from any ideas, methods, instructions or products referred to in the content.

