
Modeling the Effect of Green Roofs for Building Energy Savings and Air Pollution Reduction in Shanghai

Abstract
:1. Introduction
2. Methodology
2.1. Study Area and Data Acquisition
2.2. Building Prototype
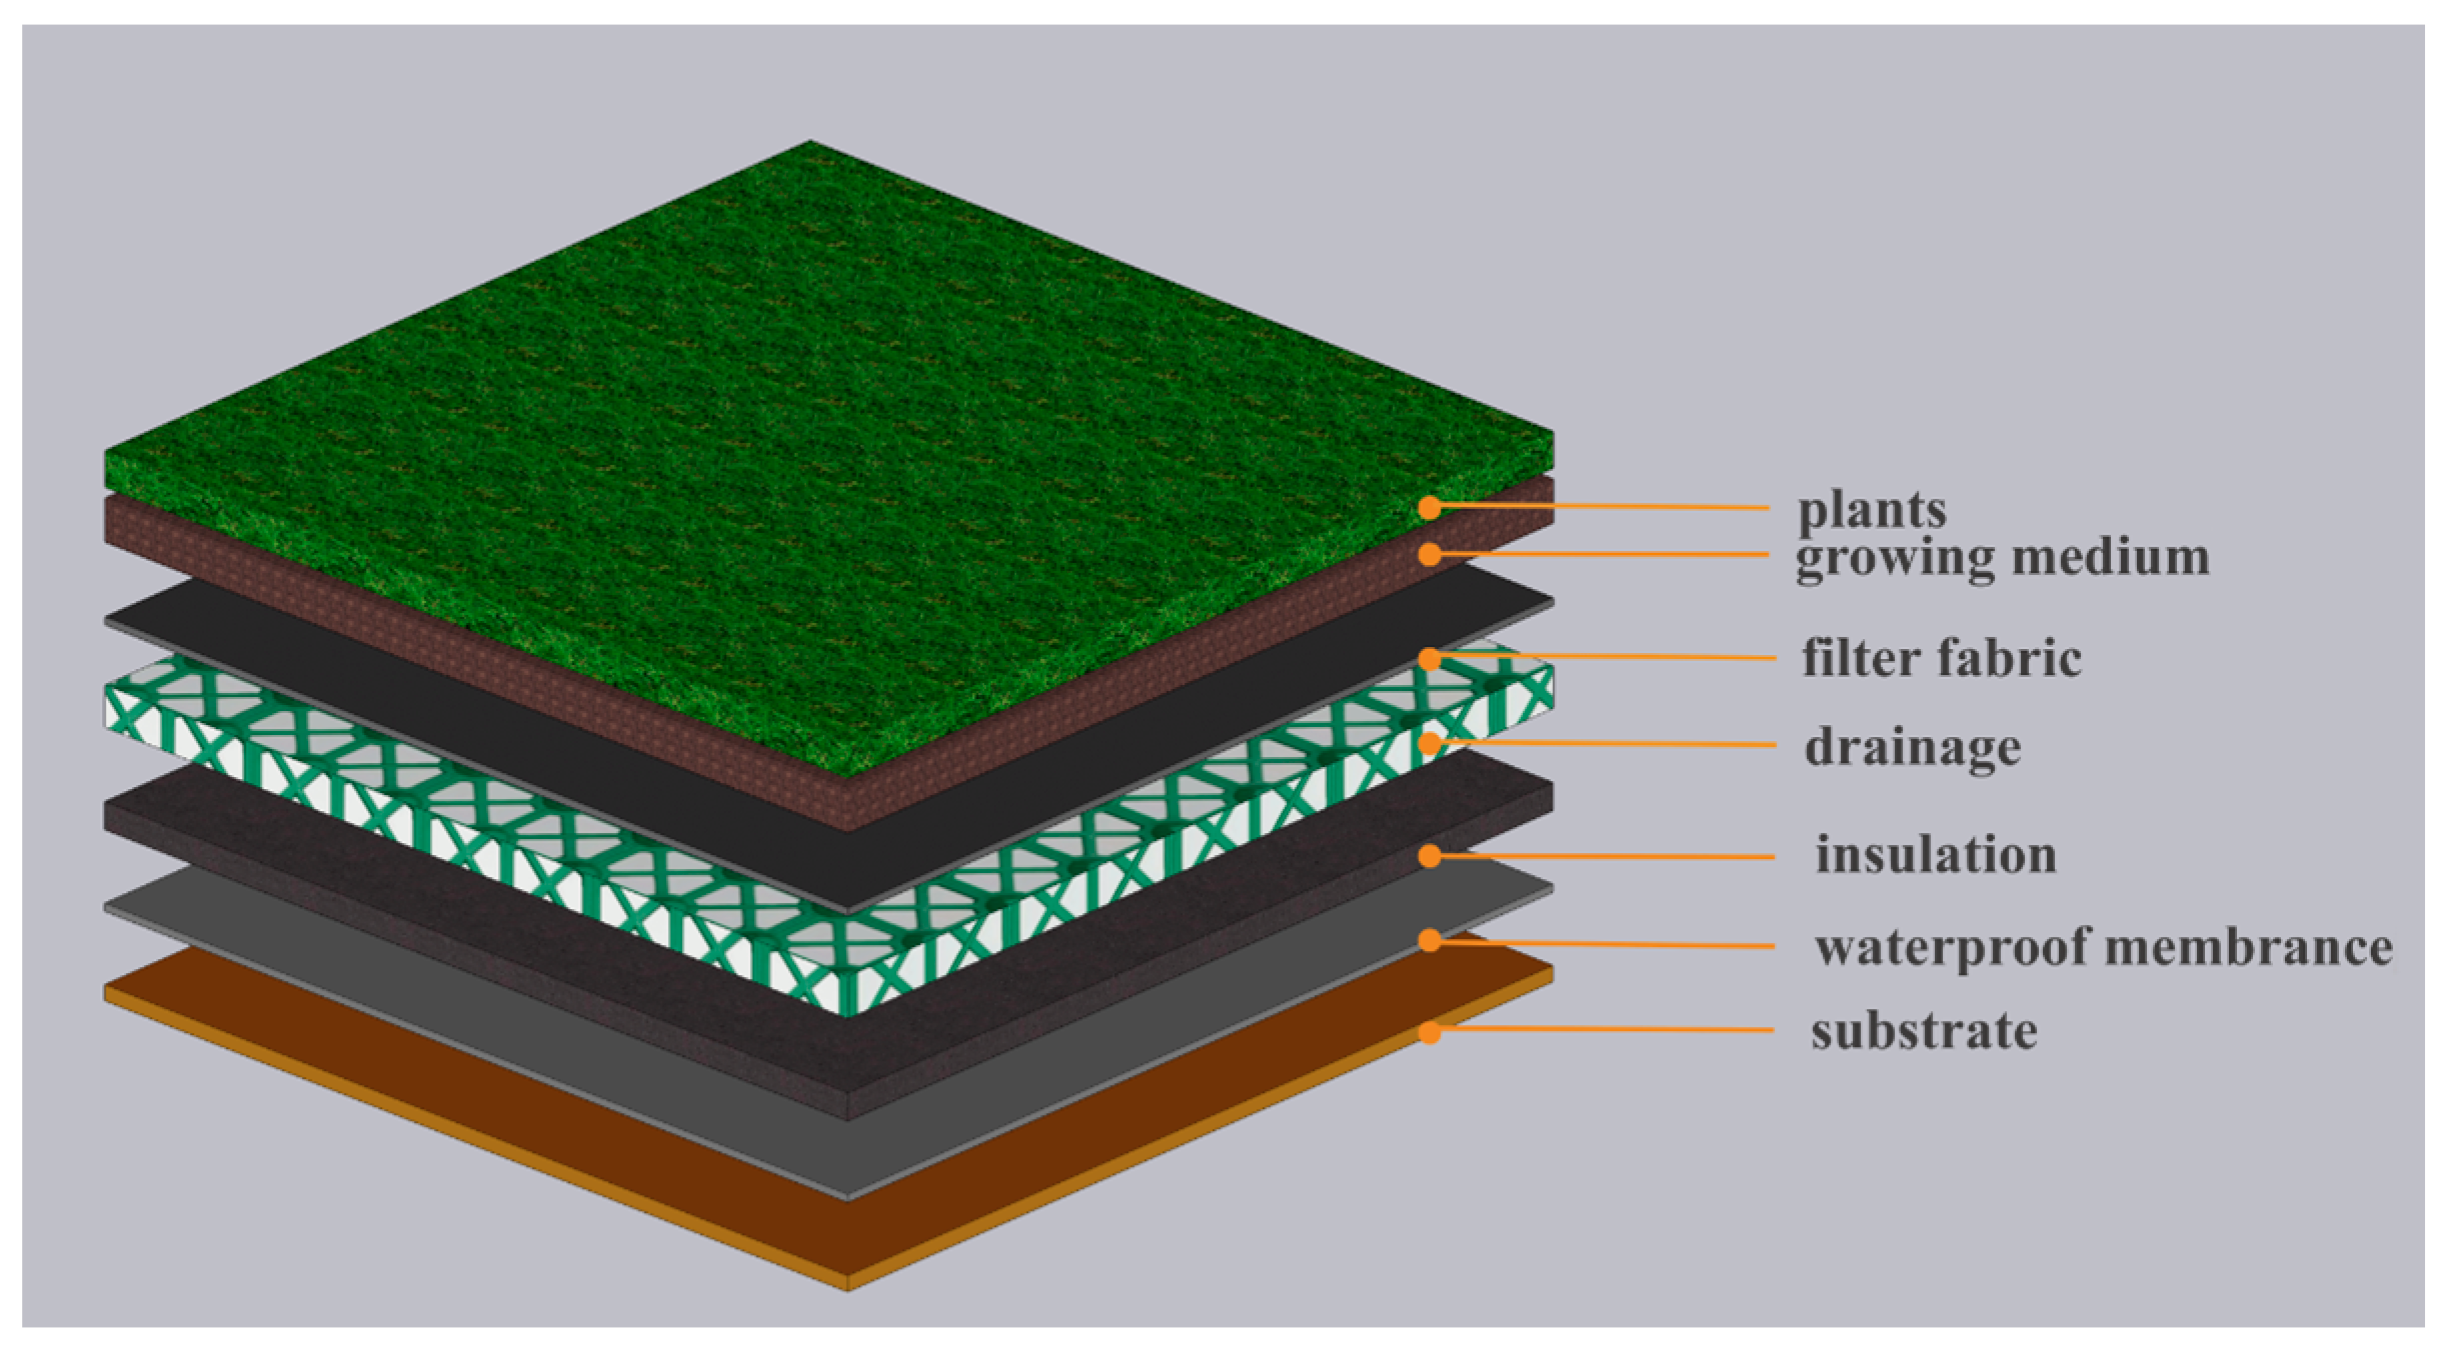
2.3. Green Roof Settings
2.4. The Simulation Model
2.5. Assessment of Carbon Emission and Air Pollution Reduction on Existing Buildings Using the GIS Modeling Technique
3. Results
3.1. Effect of Green Roofs on Savings of Building Operational Energy at the Annual Scale
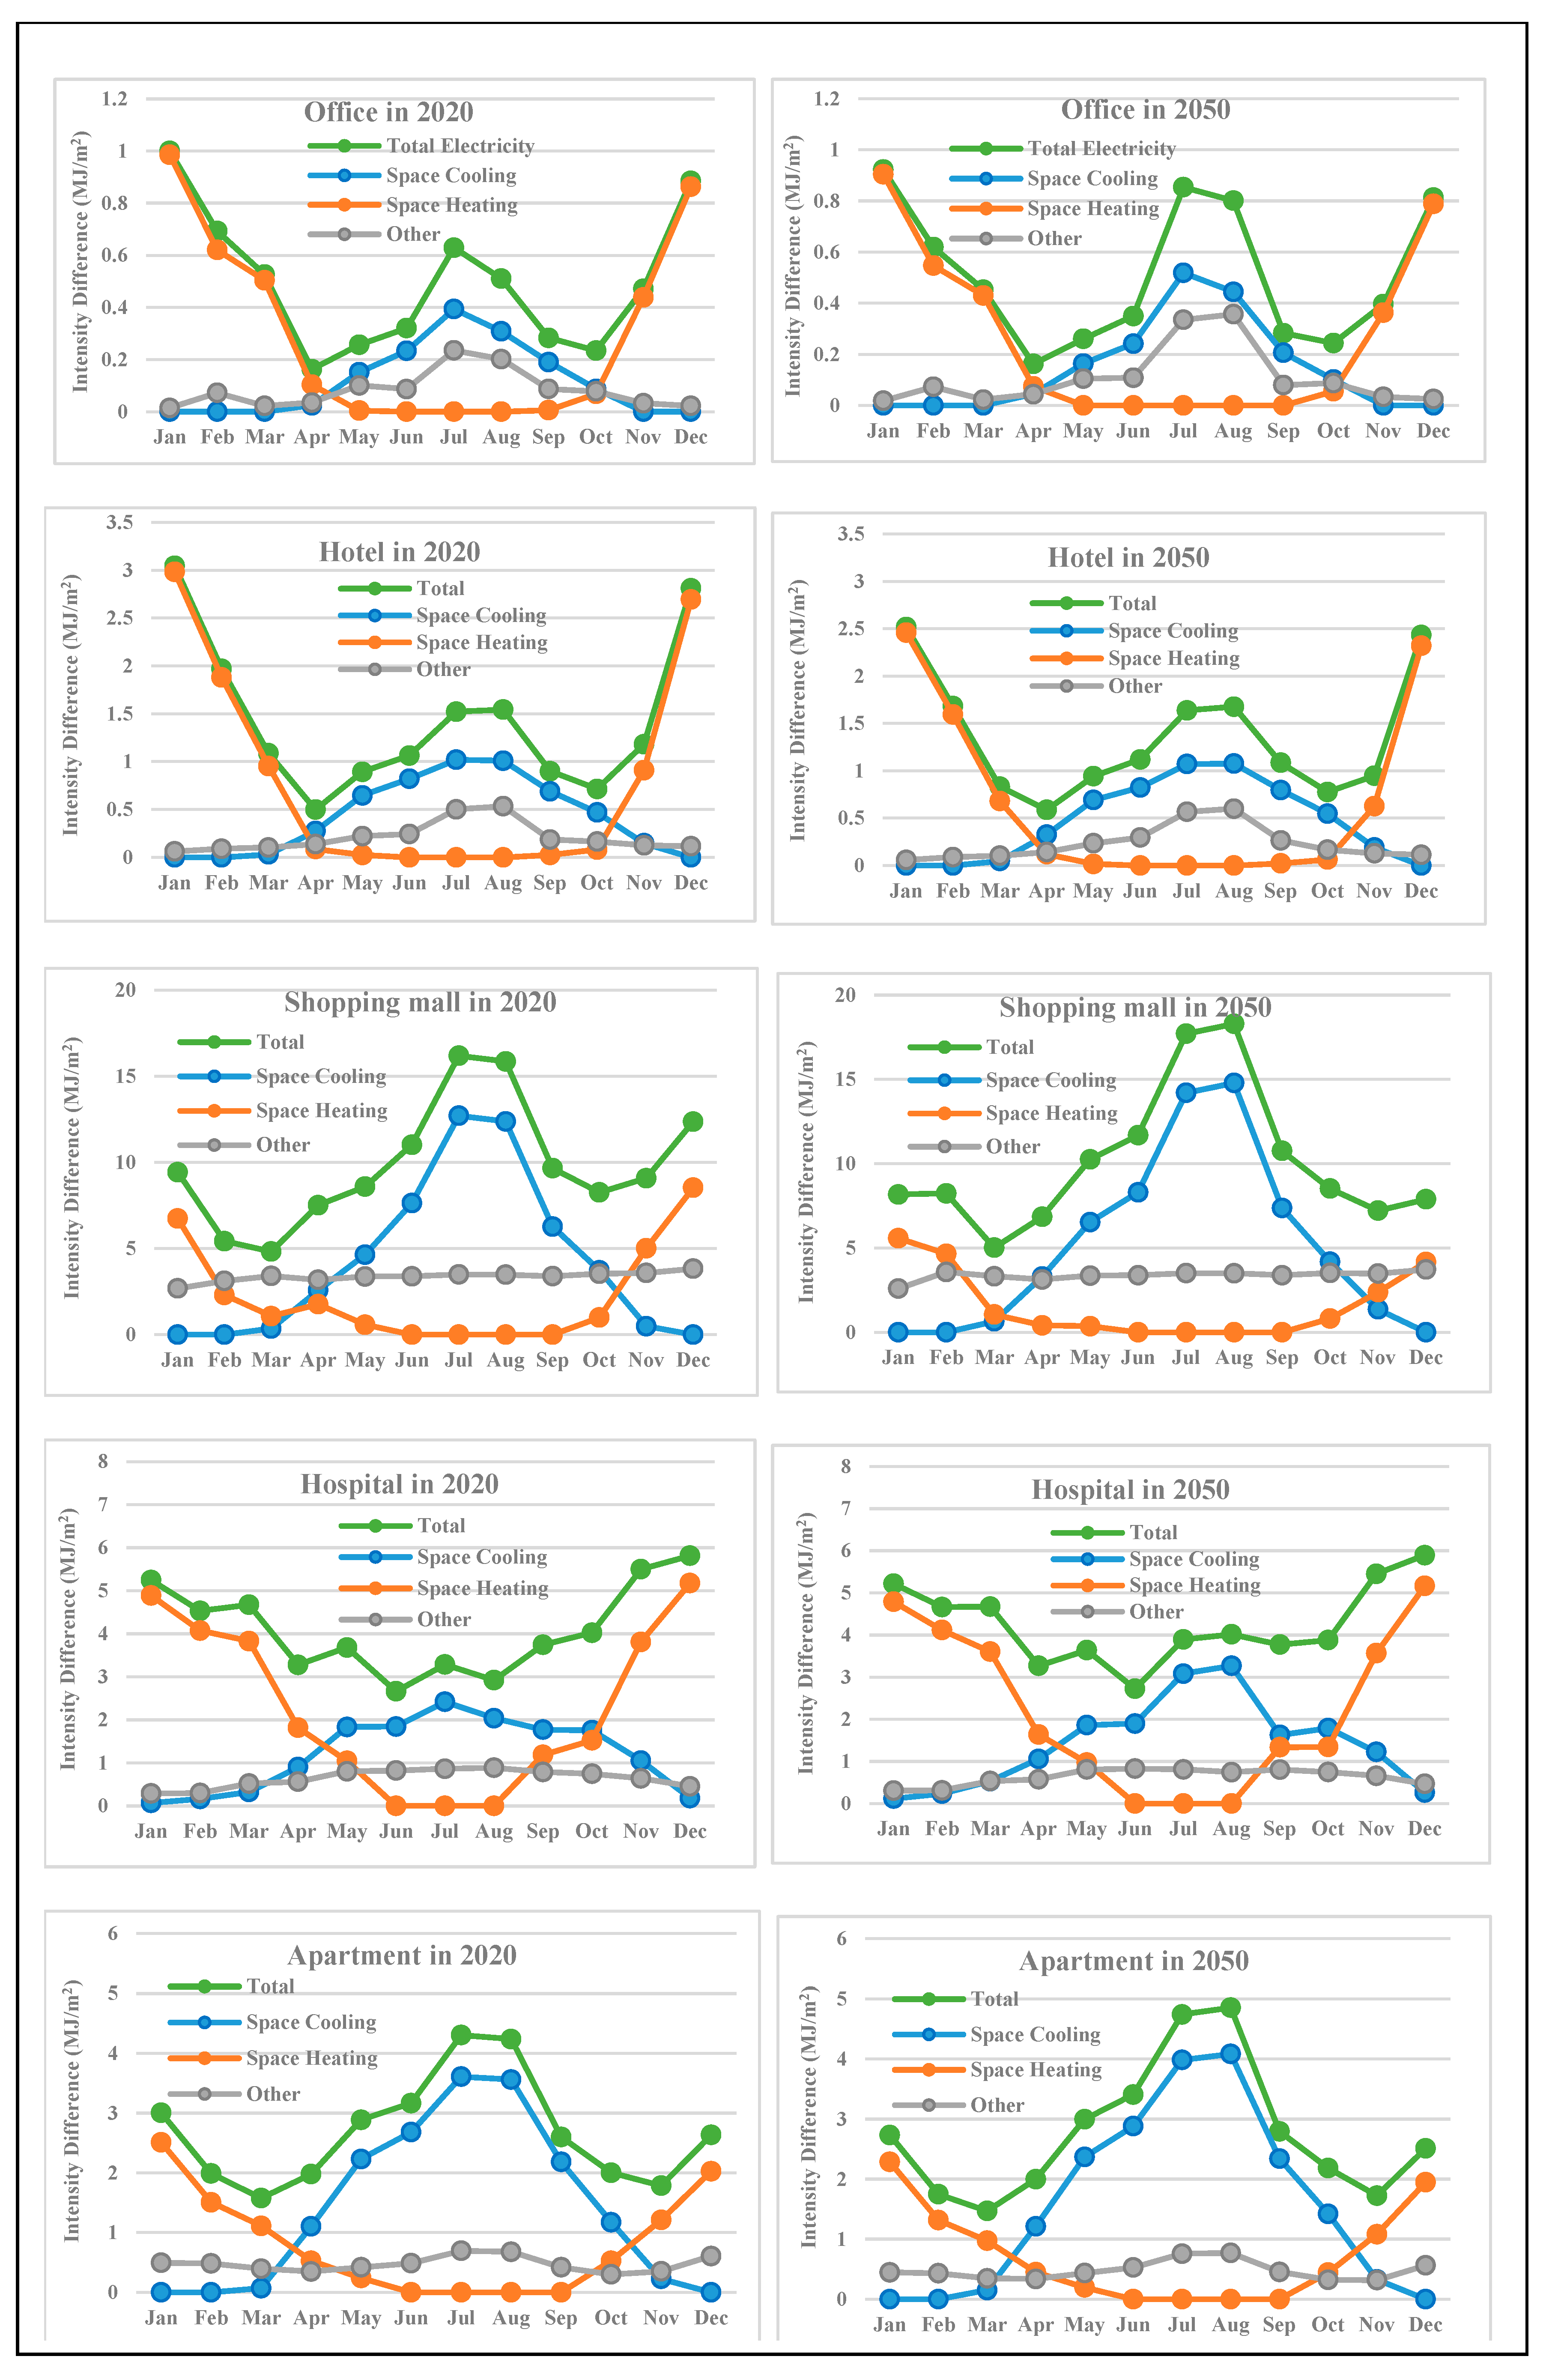
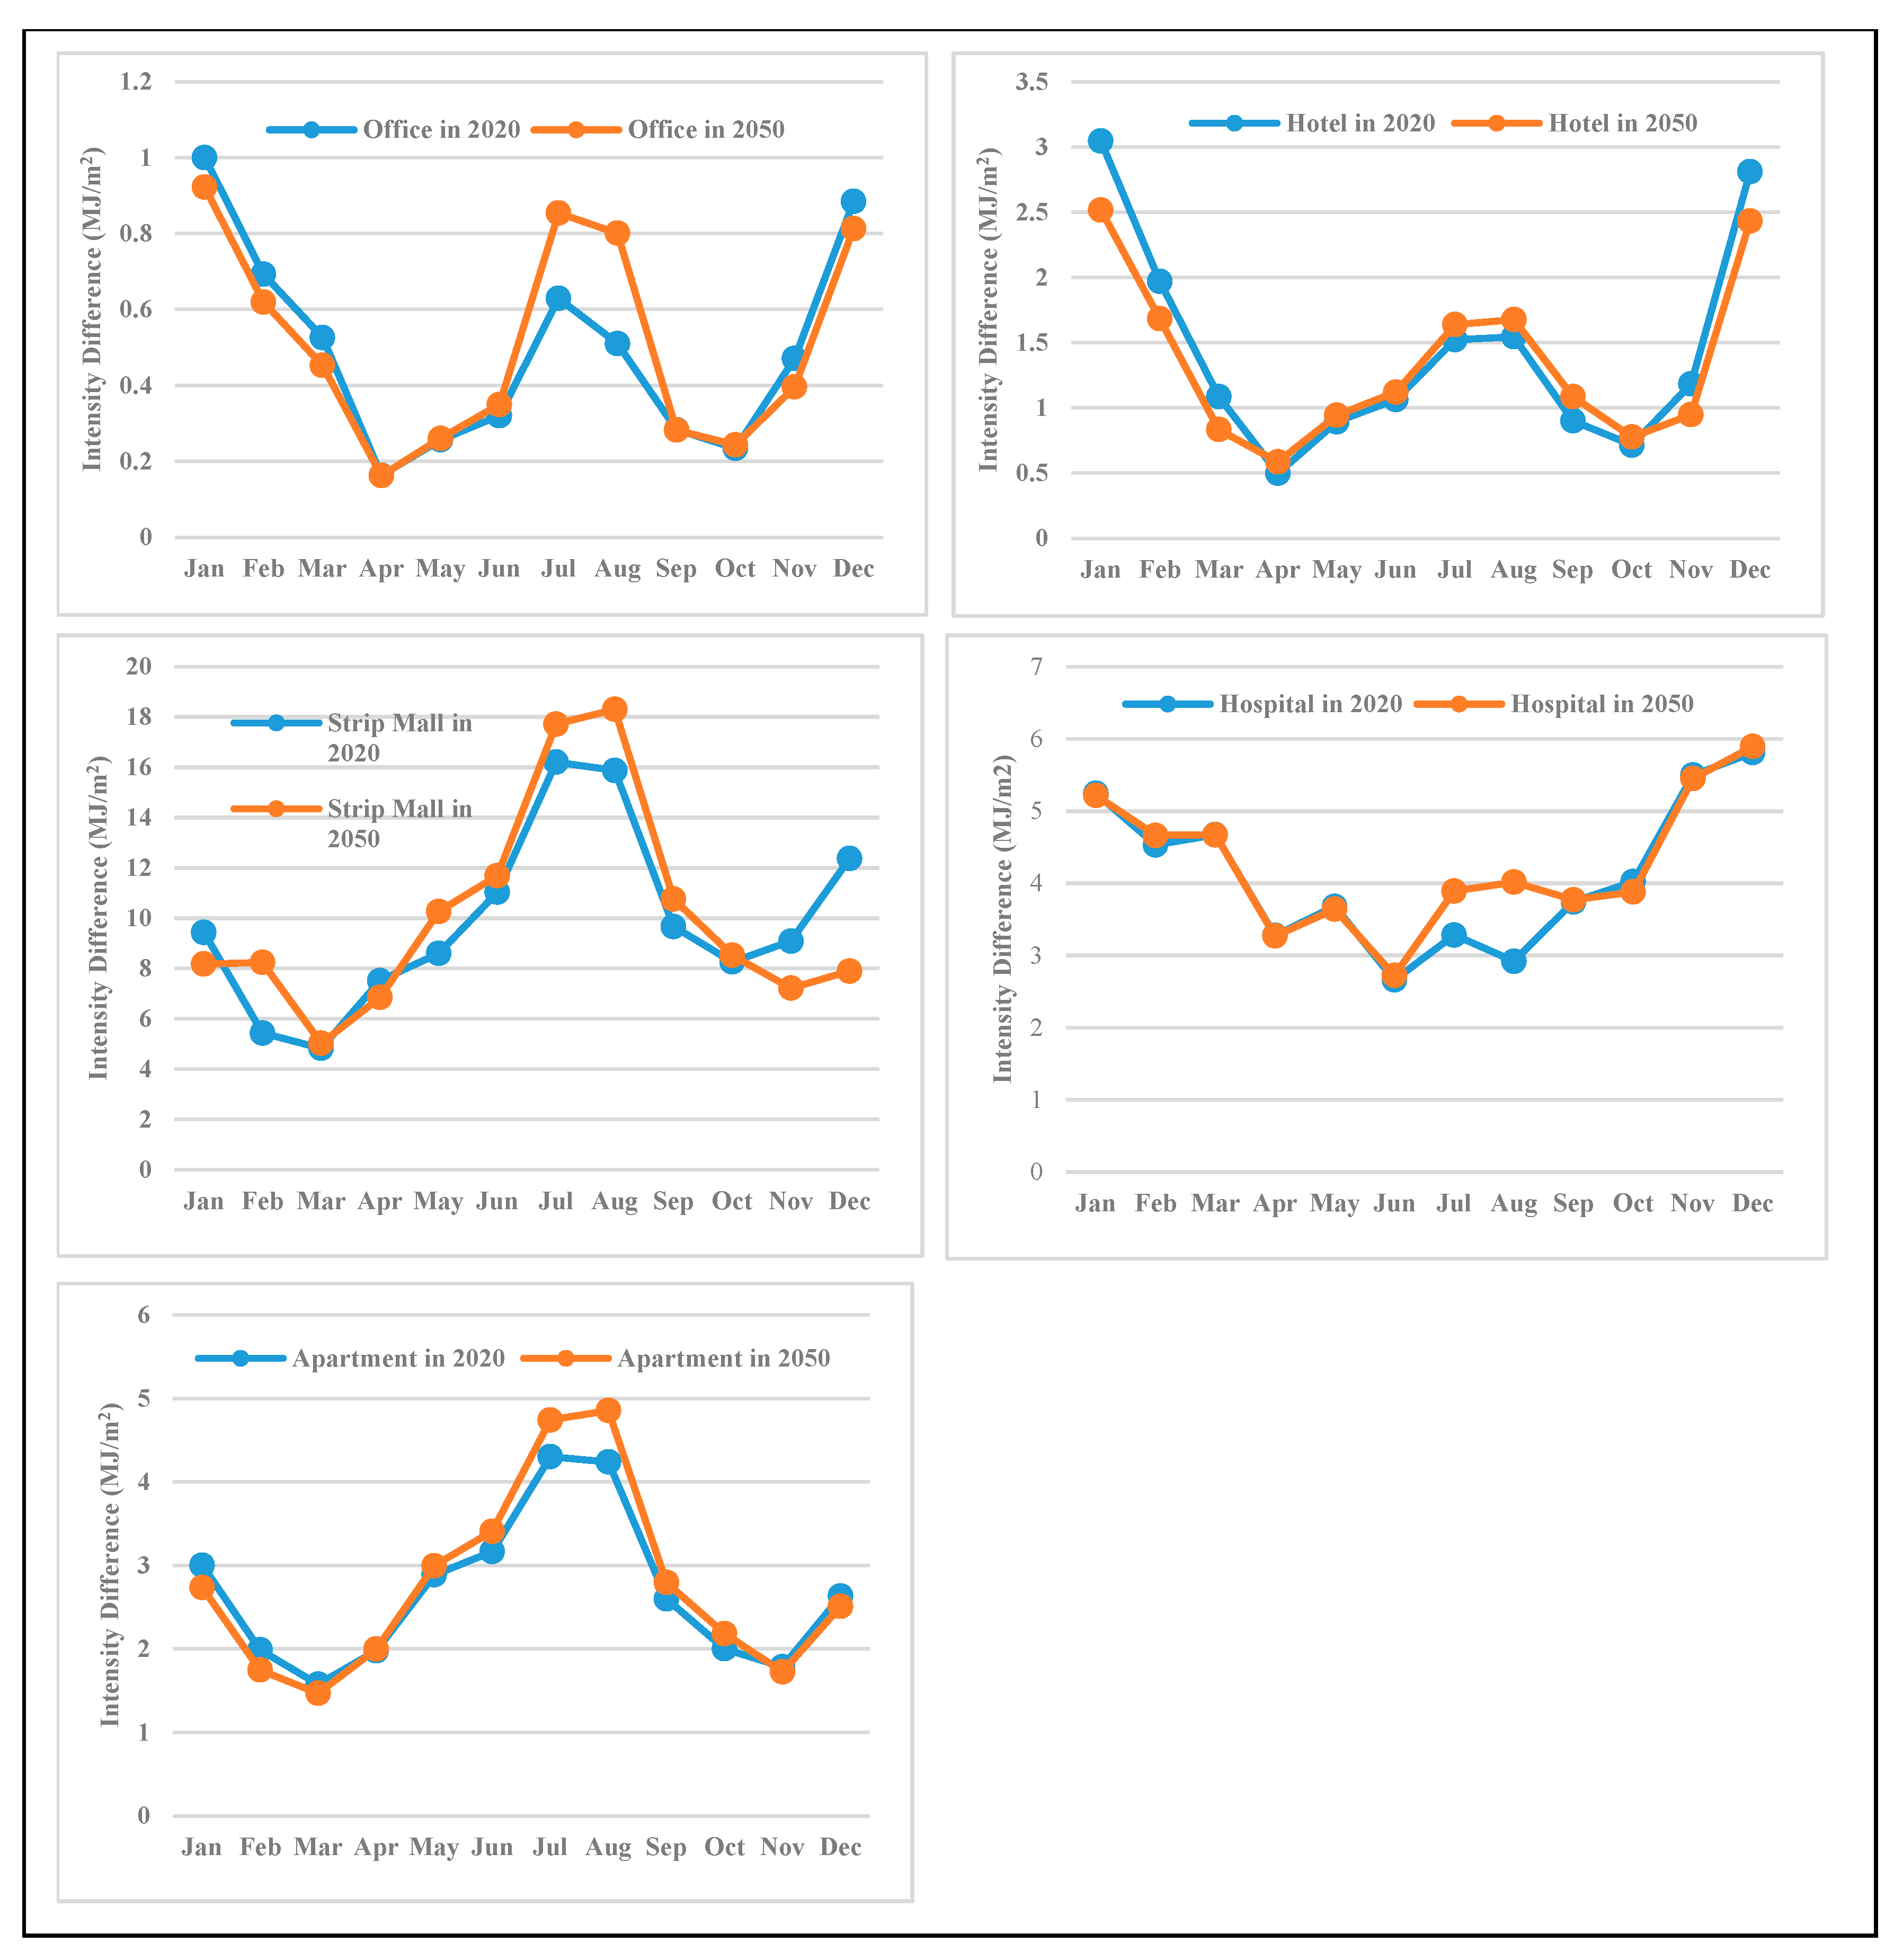
3.2. Effect of Green Roofs on Savings of Building Operational Energy at the Monthly Scale
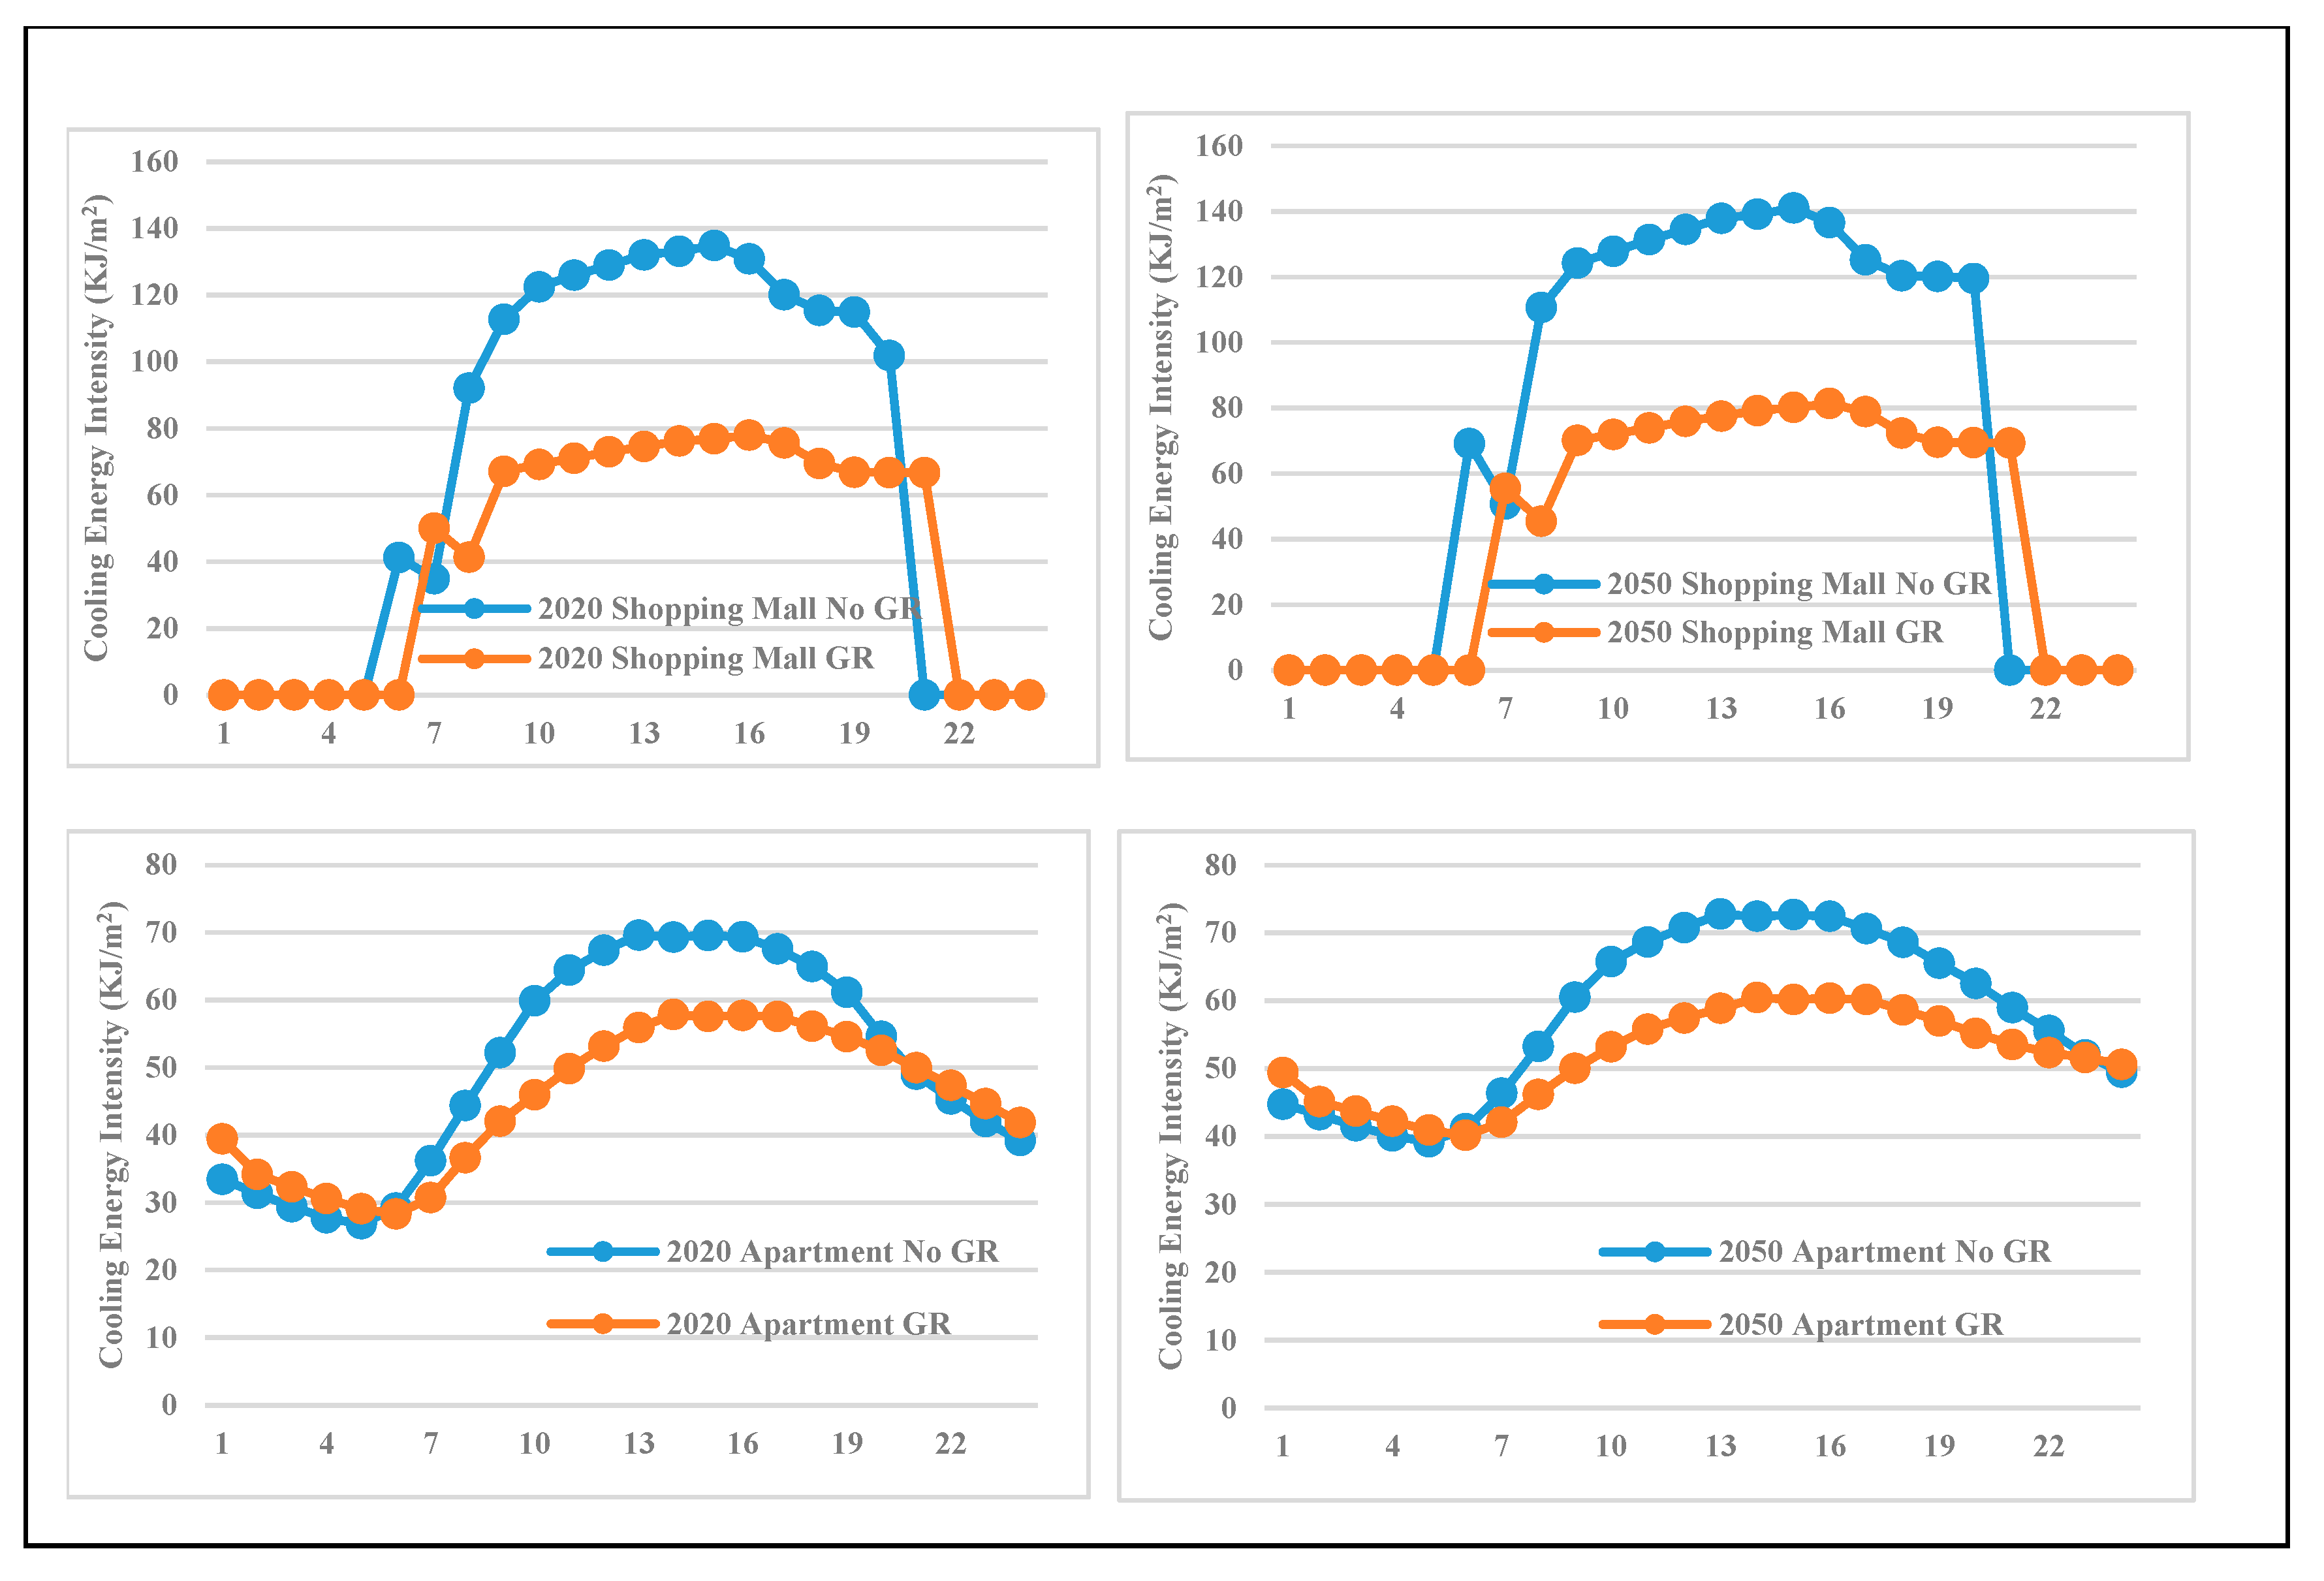
3.3. Effect of Green Roofs on Savings of Building Operational Energy at the Hourly Scale
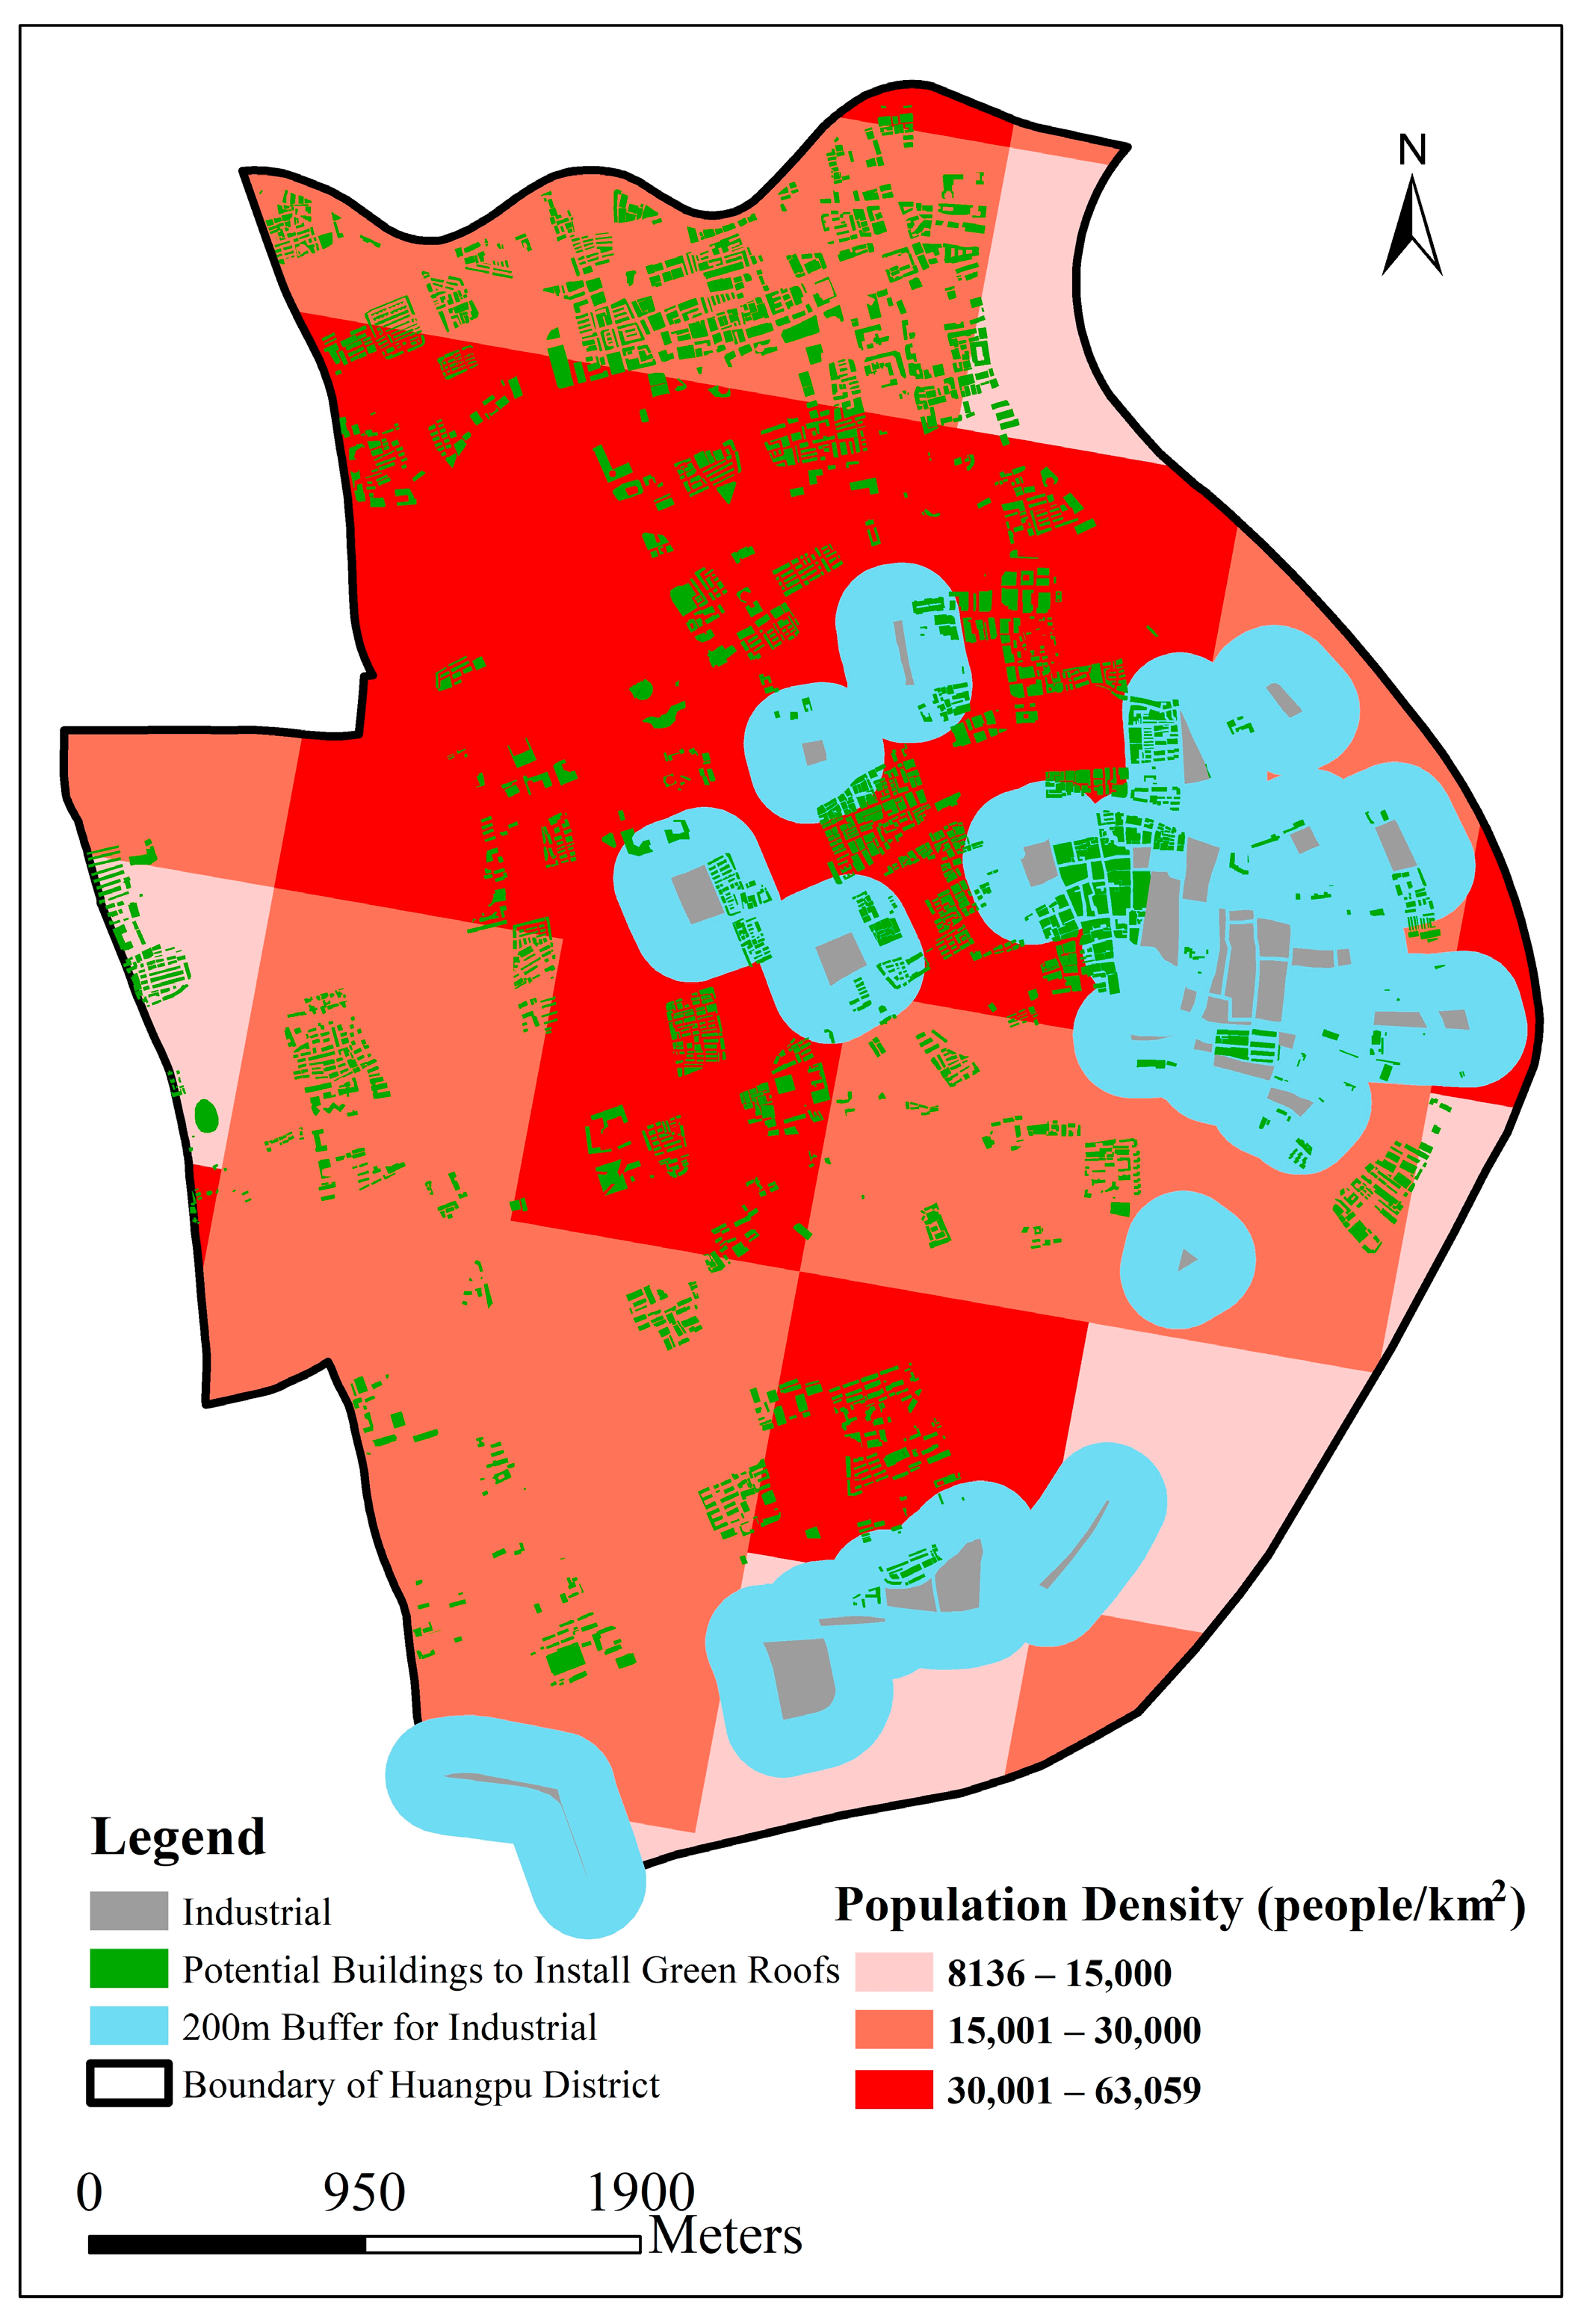
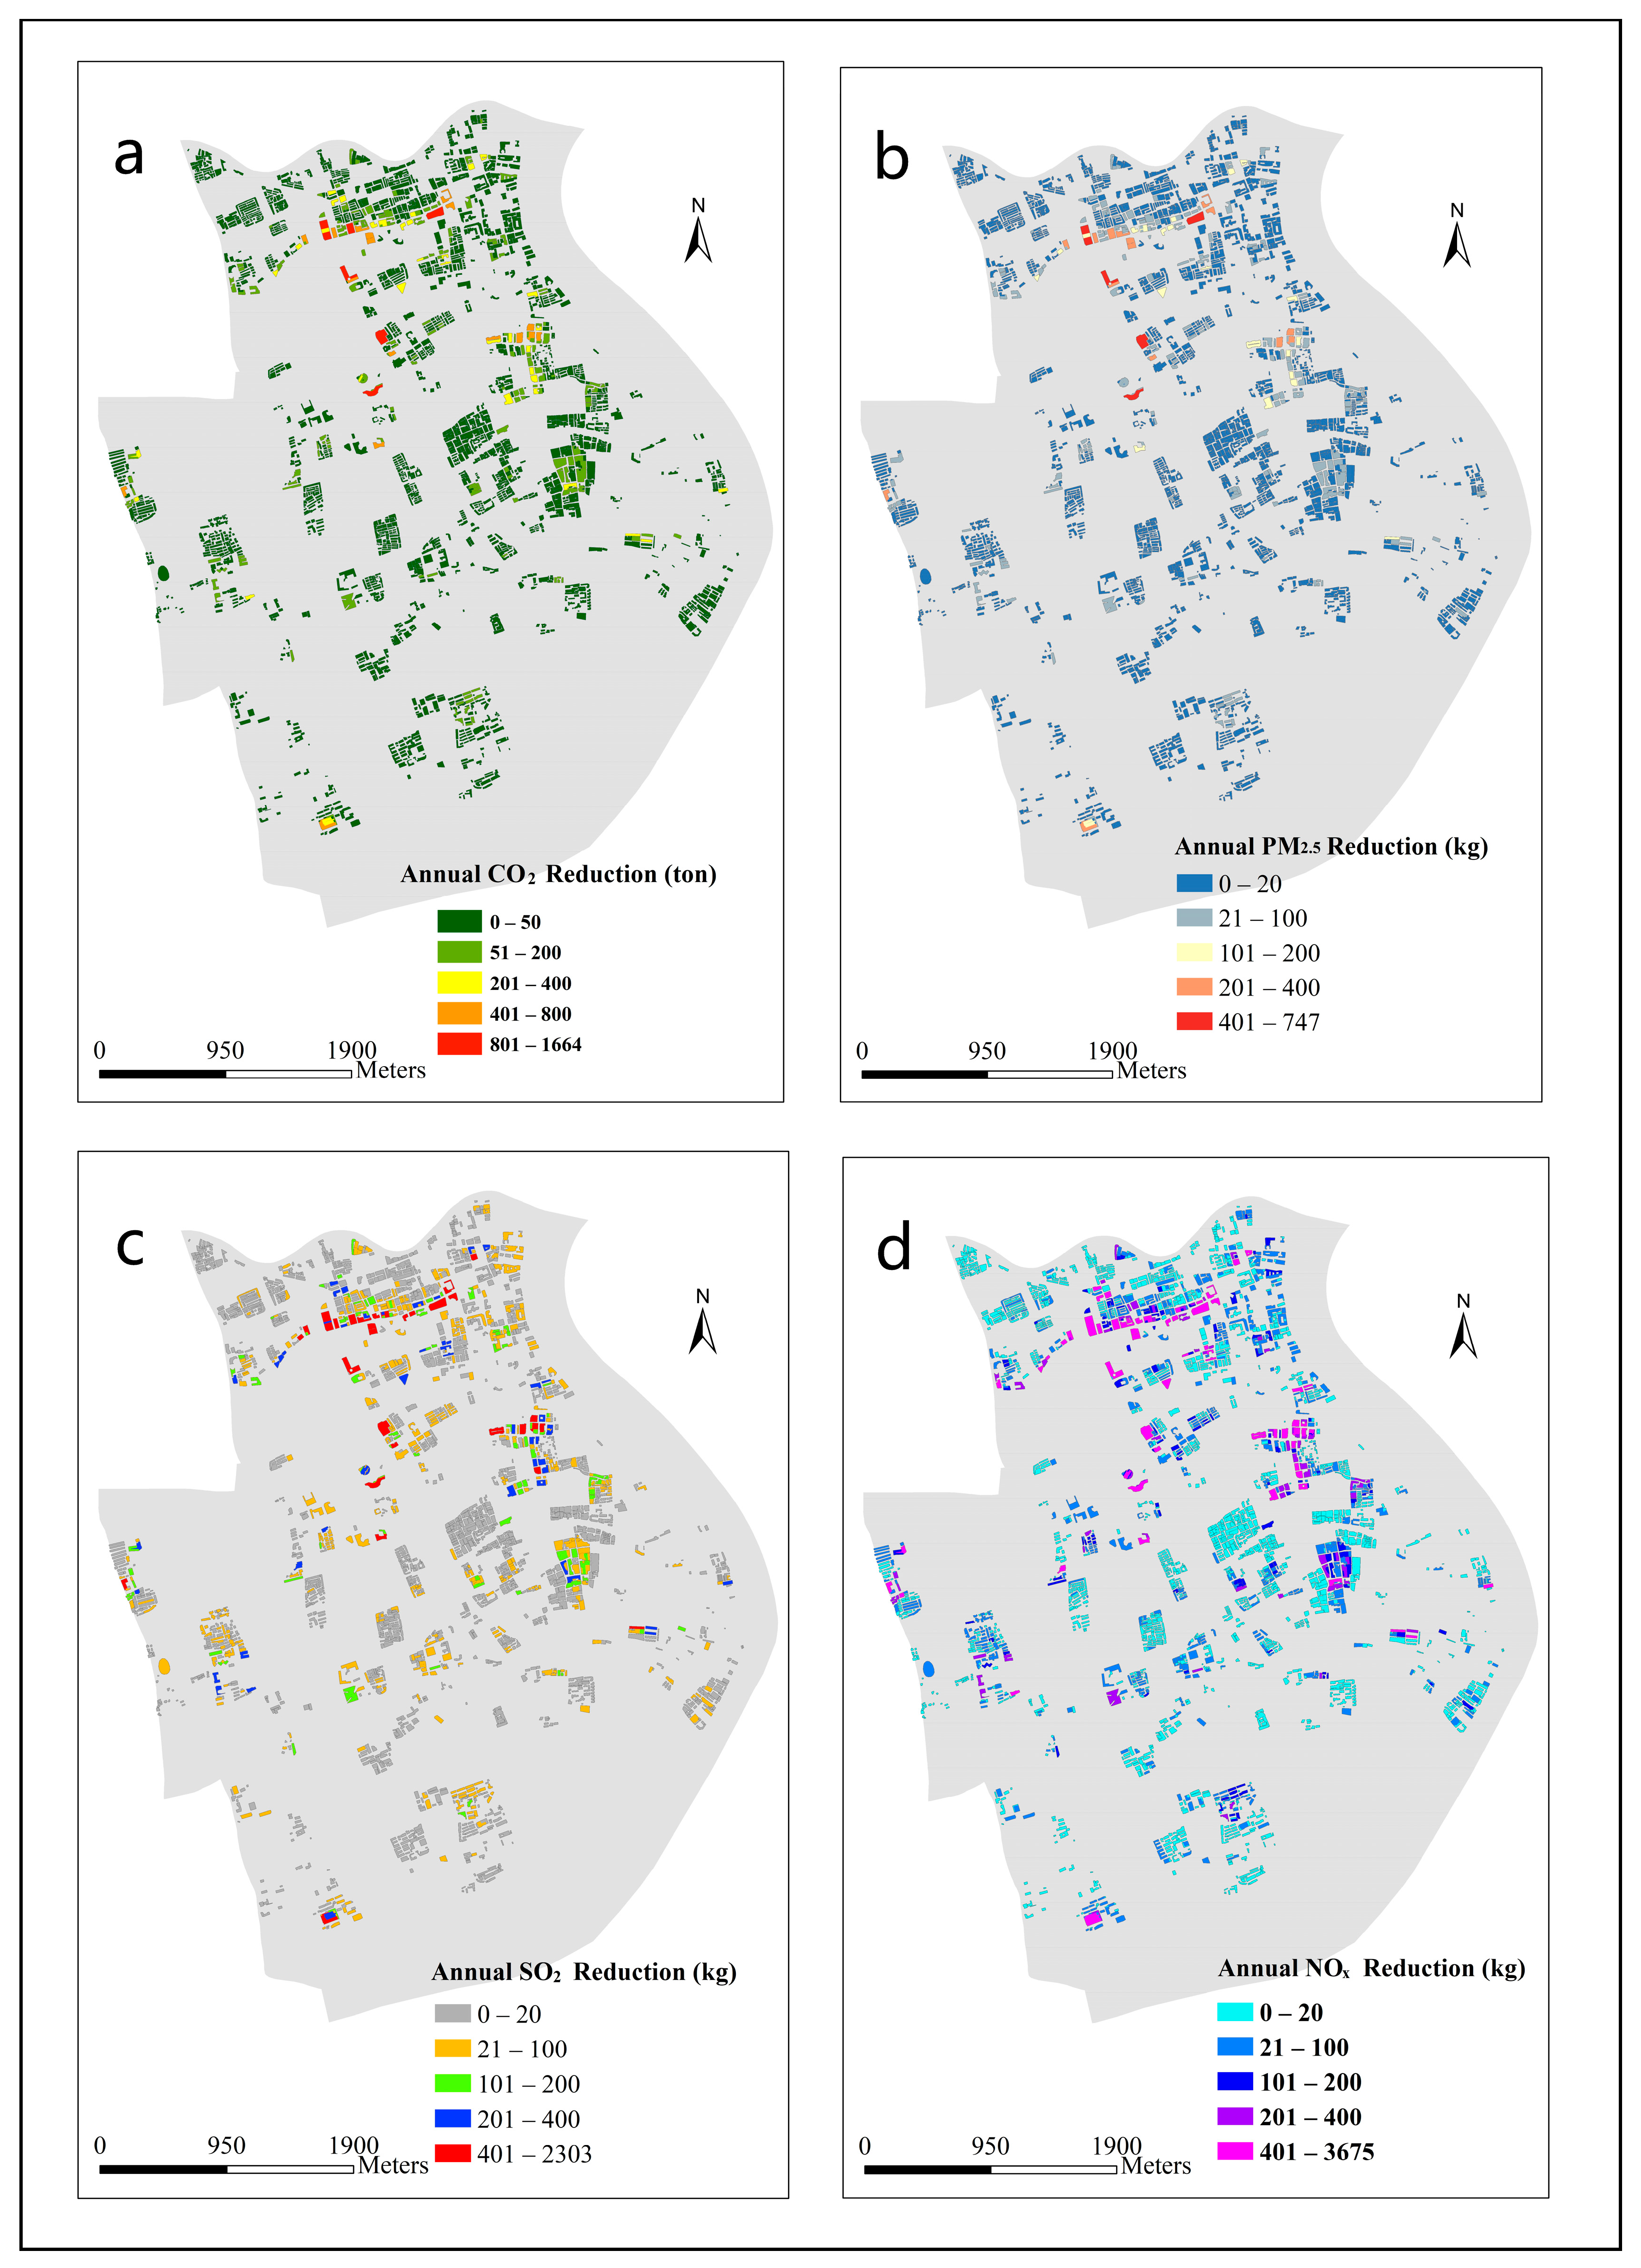
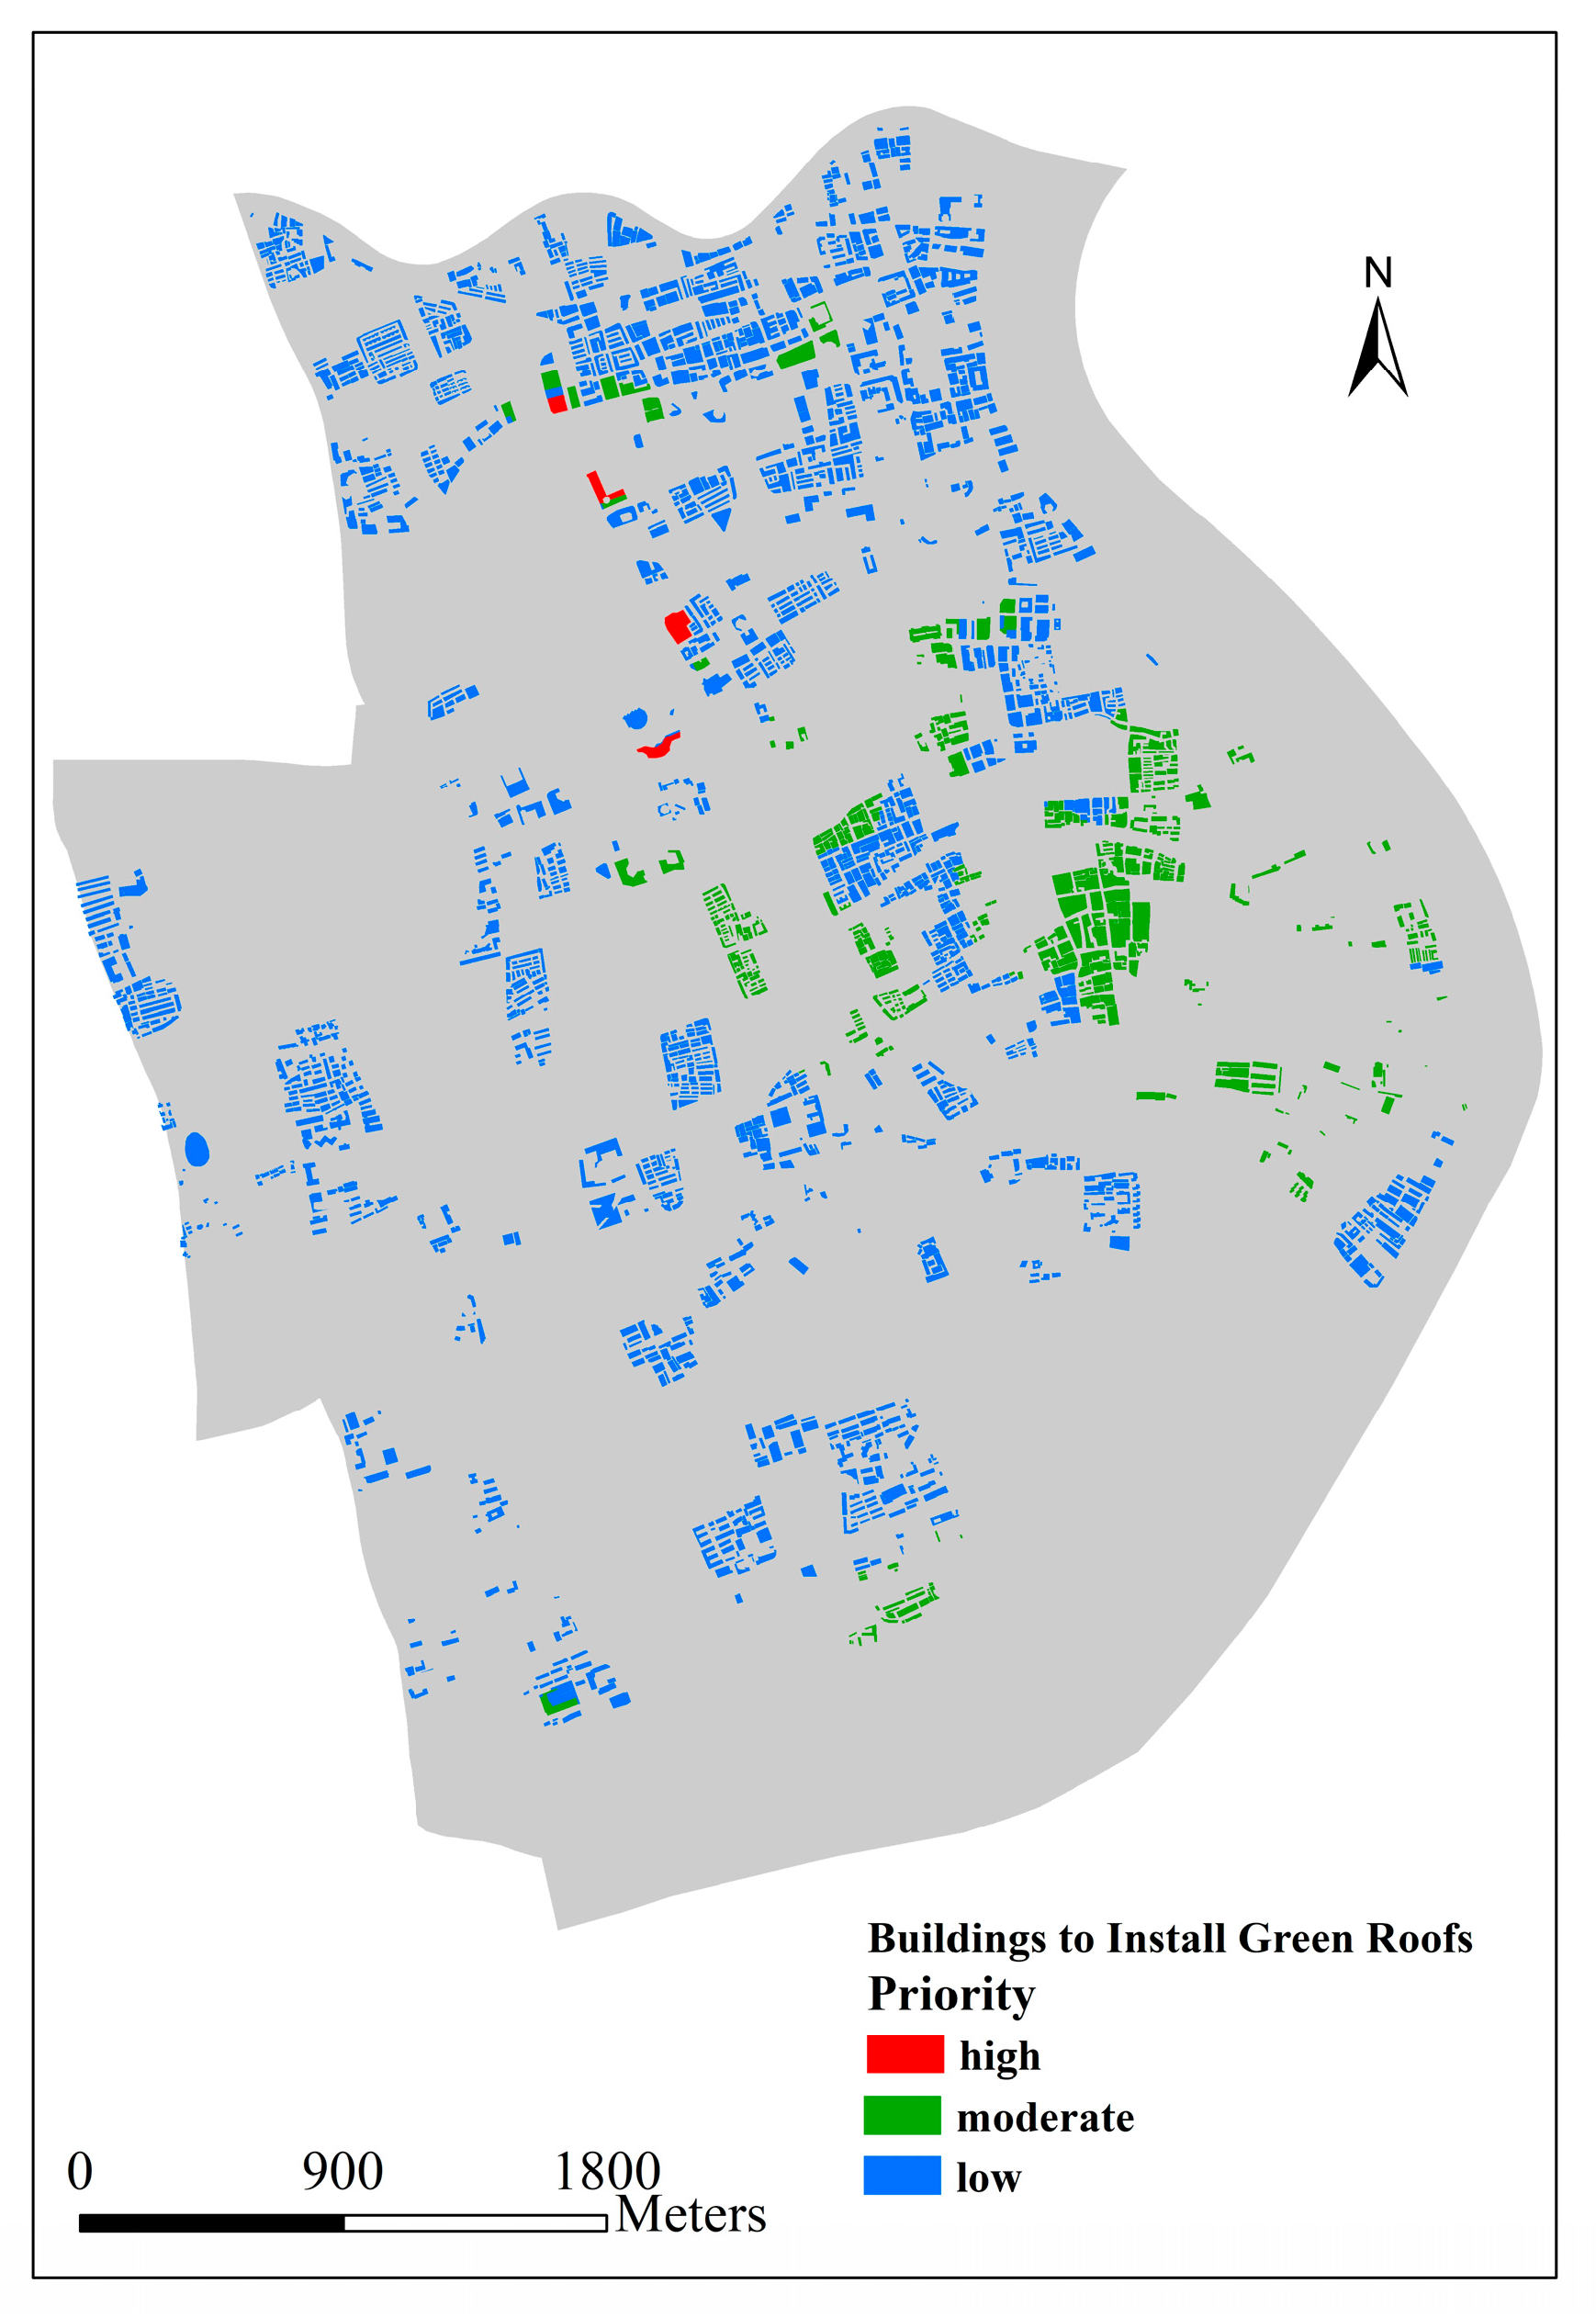
3.4. Case Study: Evaluation of Carbon Emission and Air Pollution Reduction after Green Roof Installation in Huangpu District
4. Discussion
5. Conclusions
Author Contributions
Funding
Institutional Review Board Statement
Informed Consent Statement
Data Availability Statement
Conflicts of Interest
References
- Chen, C.; Bi, L. Study on spatio-temporal changes and driving factors of carbon emissions at the building operation stage—A case study of China. Build. Environ. 2022, 219, 109147. [Google Scholar] [CrossRef]
- Qi, S.J.; Zhang, Y.B. Research on the influencing factors and reduction strategies of carbon emission of construction industry in China. Soft Sci. 2013, 27, 39–43. [Google Scholar] [CrossRef]
- Wu, P.; Song, Y.; Zhu, J.; Chang, R. Analyzing the influence factors of the carbon emissions from China’s building and construction industry from 2000 to 2015. J. Clean. Prod. 2019, 221, 552–566. [Google Scholar] [CrossRef]
- Building Energy Research Center of Tsinghua University (BERC). 2022 Annual Report on China Building Energy Efficiency; China Building Industry Press: Beijing, China, 2022; pp. 5–6. [Google Scholar]
- UNEP, International Energy Agency (IEA). 2020 Global Status Report for Buildings and Construction towards a Zero-Emissions, Efficient and Resilient Buildings and Construction Sector. 2020. Available online: https://globalabc.org/resources/publications/2020-global-status-report-buildings-and-construction (accessed on 1 October 2023).
- Bognar, F.; Bocskei, E. Potential Model to Support the Achievement of Corporate Carbon Neutrality. Public Financ. Q. 2022, 67, 379–395. [Google Scholar] [CrossRef]
- Professional Committee of Building Energy and Emissions (CABEE): 2021 Chinese Buildings Energy and Carbon Emissions Research Report. 2021. Available online: https://www.waitang.com/report/331222.html (accessed on 11 September 2023). (In Chinese).
- Yang, L.; Hong, S. Impact of the clean energy structure of building operation on the co-benefits of CO2 and air pollutant emission reductions in Chinese provinces. J. Clean. Prod. 2023, 413, 137400. [Google Scholar] [CrossRef]
- Xi, Z.; Xiao, Y.; Meng, W.J.; Xu, H.R.; Wei, D.; Shen, G.F.; Chen, H.F.; Ma, J.M.; Shu, T. Stacked Use and Transition Trends of Rural Household Energy in Mainland China. Environ. Sci. Technol. 2019, 53, 521–529. [Google Scholar] [CrossRef]
- Zheng, Y.; Weng, Q. Modeling the effect of climate change on building energy demand in Los Angeles County by using a GIS-based high spatial- and temporal-resolution approach. Energy 2019, 176, 641–655. [Google Scholar] [CrossRef]
- Intergovernmental Panel on Climate Change (IPCC). Climate Change 2021: The Physical Science Basis. In Contribution of Working Group I to the Sixth Assessment Report of the Intergovernmental Panel on Climate Change; Cambridge University Press: Cambridge, UK; New York, NY, USA, 2023; pp. 23–91. [Google Scholar] [CrossRef]
- Kirtman, B.; Power, S.B.; Adedoyin, A.J.; Boer, G.J.; Bojariu, R.; Camilloni, I.; Doblas-Reyes, F.; Fiore, A.M.; Kimoto, M.; Meehl, G.; et al. 2013: Near-Term Climate Change: Projections and Predictability. In Climate Change 2013: The Physical Science Basis. Contribution of Working Group I to the Fifth Assessment Report of the Intergovernmental Panel on Climate Change; Cambridge University Press: Cambridge, UK; New York, NY, USA; pp. 953–1028. [CrossRef]
- Dimond, K.; Webb, A. Sustainable roof selection: Environmental and contextual factors to be considered in choosing a vegetated roof or rooftop solar photovoltaic system. Sustain. Cities Soc. 2017, 35, 241–249. [Google Scholar] [CrossRef]
- Tang, X.; Qu, M. Phase change and thermal performance analysis for green roofs in cold climates. Energy Build. 2016, 121, 165–175. [Google Scholar] [CrossRef]
- Zheng, Y.; Weng, Q. Modeling the Effect of Green Roof Systems and Photovoltaic Panels for Building Energy Savings to Mitigate Climate Change. Remote Sens. 2020, 12, 2402. [Google Scholar] [CrossRef]
- Abuseif, M.; Jamei, E.; Chau, H. Simulation-based study on the role of green roof settings on energy demand reduction in seven Australian climate zones. Energy Build. 2023, 286, 112938. [Google Scholar] [CrossRef]
- Lukač, N.; Žalik, B. GPU-based roofs’ solar potential estimation using LiDAR data. Comput. Geosci. 2013, 52, 34–41. [Google Scholar] [CrossRef]
- Curre, B.; Bass, B. Estimates of air pollution mitigation with green plants and green roofs using the UFORE model. Urban. Ecosyst. 2008, 11, 409–422. [Google Scholar] [CrossRef]
- Yang, J.; Yu, Q.; Gong, P. Quantifying air pollution removal by green roofs in Chicago. Atmos. Environ. 2008, 42, 7266–7273. [Google Scholar] [CrossRef]
- Karteris, M.; Theodoridou, I.; Mallinis, G.; Tsiros, E.; Karteris, A. Towards a green sustainable strategy for Mediterranean cities: Assessing the benefits of large-scale green roofs implementation in Thessaloniki, Northern Greece, using environmental modeling, GIS and very high spatial resolution remote sensing data. Renew. Sustain. Energy Rev. 2016, 58, 510–525. [Google Scholar] [CrossRef]
- Mayrand, F.; Clergeau, P. Green roofs and green walls for biodiversity conservation: A contribution to urban connectivity? Sustainability. 2018, 10, 985. [Google Scholar] [CrossRef]
- Shafique, M.; Kim, R.; Rafiq, M. Green roof benefits, opportunities and challenges—A review. Renew. Sustain. Energy Rev. 2018, 90, 757–773. [Google Scholar] [CrossRef]
- Morakinyo, T.E.; Dahanayake, K.W.D.K.C.; Ng, E.; Chow, C.L. Temperature and cooling demand reduction by green-roof types in di_erent climates and urban densities: A co-simulation parametric study. Energy Build. 2017, 145, 226–237. [Google Scholar] [CrossRef]
- Ecogardens. Available online: https://Info.ecogardens.com/blog/what-are-the-layers-of-a-green-roof (accessed on 29 October 2023).
- Heusinger, J.; Sailor, D.J.; Weber, S. Modeling the reduction of urban excess heat by green roofs with respect to different irrigation scenarios. Build. Environ. 2018, 131, 174–183. [Google Scholar] [CrossRef]
- Agra, H.; Klein, T.; Vasl, A.; Kadas, G.; Blaustein, L. Measuring the effect of plant-community composition on carbon fixation on green roofs. Urban. For. Urban. Green. 2017, 24, 1–4. [Google Scholar] [CrossRef]
- Heusinger, J.; Weber, S. Extensive green roof CO2 exchange and its seasonal variation quantified by eddy covariance measurements. Sci. Total Environ. 2017, 607, 623–632. [Google Scholar] [CrossRef]
- Seyedabadi, M.R.; Karrabi, M.; Nabati, J. Investigating green roofs’ CO2 sequestration with cold- and drought-tolerant plants (a short- and long-term carbon footprint view). Environ. Sci. Pollut. Control Ser. 2021, 10, 14121–141230. [Google Scholar] [CrossRef]
- Irga, P.; Braun, J.; Douglas, A.; Pettit, T.; Fujiware, S.; Burchett, M.; Torpy, F. The distribution of green walls and green roofs throughout Australia: Do policy instruments influence the frequency of projects? Urban. For. Urban. Green. 2017, 24, 164–174. [Google Scholar] [CrossRef]
- Kostadinovic’, D.; Jovanovic’, M.; Bakic, V.; Stepanc, N. Mitigation of urban particulate pollution using lightweight green roof system. Energy Build. 2023, 293, 113203. [Google Scholar] [CrossRef]
- Motlagh, S.H.B.; Pons-Valladares, O.; Hosseini, S.M.A. City-scale model to assess rooftops performance on air pollution mitigation; validation for Tehran. Build. Environ. 2023, 244, 110746. [Google Scholar] [CrossRef]
- Kim, T.D.H.; Yu, B.; Srichandra, J.; Low-Choy, S.; Michael, R.N. Water flux and biomass production of native plants at different substrate compactions for landfill phytocaps in Southeast Queensland, Australia. Ecol. Eng. 2022, 183, 106745. [Google Scholar] [CrossRef]
- Jim, C.Y. Air-conditioning energy consumption due to green roofs with different building thermal insulation. Appl. Energy 2014, 128, 49–59. [Google Scholar] [CrossRef]
- Taleghani, M. Outdoor thermal comfort by different heat mitigation strategies a review. Renew. Sustain. Energy Rev. 2018, 81, 2011–2018. [Google Scholar] [CrossRef]
- Chen, J.; Yin, H.; Kong, F. Measuring the performance of green roof cooling effects from a multi-dimensional perspective. Acta Ecol. Sin. 2020, 40, 1445–1454. [Google Scholar] [CrossRef]
- He, Y.; Lin, E.S.; Tan, C.L.; Yu, Z.; Tan, P.Y.; Wong, N.H. Model development of Roof Thermal Transfer Value (RTTV) for green roof in tropical area: A case study in Singapore. Build. Environ. 2021, 203, 108101. [Google Scholar] [CrossRef]
- Tan, T.; Kong, F.; Yin, H.; Cook, L.M.; Middel, A.; Yang, S. Carbon dioxide reduction from green roofs: A comprehensive review of processes, factors, and quantitative methods. Renew. Sustain. Energy Rev. 2023, 182, 113412. [Google Scholar] [CrossRef]
- He, Y.; Yu, H.; Ozaki, A.; Dong, N. Thermal and energy performance of green roof and cool roof: A comparison study in Shanghai area. J. Clean. Prod. 2020, 267, 122205. [Google Scholar] [CrossRef]
- Zeng, C.; Bai, X.; Sun, L.; Zhang, Y.; Yuan, Y. Optimal parameters of green roofs in representative cities of four climate zones in China: A simulation study. Energy Build. 2017, 150, 118–131. [Google Scholar] [CrossRef]
- Zhou, L.W.; Wang, Q.; Li, Y.; Liu, M.; Wang, R.Z. Green roof simulation with a seasonally variable leaf area index. Energy Build. 2018, 174, 156–167. [Google Scholar] [CrossRef]
- Chinese National Bureau of Statistics. Available online: www.stats.gov.cn/sj/ndsj/2022/indexch.htm (accessed on 10 October 2023).
- Liang, Y.; Pan, Y.; Yuan, X.; Yang, X.; Yang, Y.; Fu, L.; Li, J.; Sun, T.; Huang, Z.; Kosonen, R. Assessment of operational carbon emission reduction of energy conservation measures for commercial buildings: Model development. Energy Build. 2022, 268, 112189. [Google Scholar] [CrossRef]
- Xu, L.; Liu, J.; Pei, J.; Han, X. Building energy saving potential in Hot Summer and Cold Winter (HSCW) Zone, China-Influence of building energy efficiency standards and implications. Energy Policy 2013, 57, 253–262. [Google Scholar] [CrossRef]
- Shanghai Statistical Yearbook 2022. Available online: https://tjj.sh.gov.cn/index.html (accessed on 8 October 2023).
- Crawley, D.B.; Lawrie, L.K.; Winkelmann, F.C.; Buhl, W.F.; Huang, Y.J.; Pedersen, C.O.; Strand, R.K.; Liesen, R.J.; Fisher, D.E.; Witte, M.J.; et al. EnergyPlus: Creating a new-generation building energy simulation program. Energy Build. 2001, 33, 319–331. [Google Scholar] [CrossRef]
- GB50189-2015; Design Standard for Energy Efficiency of Public Buildings. Ministry of Housing and Urban-Rural Development of the People’s Republic of China: Beijing, China, 2015.
- Zhang, G.; Li, X.; Shi, W.; Wang, B.; Li, Z.; Cao, Y. Simulations of the energy performance of variable refrigerant flow system in representative operation modes for residential buildings in the hot summer and cold winter region in China. Energy Build. 2018, 174, 414–427. [Google Scholar] [CrossRef]
- JGJ134-2010; Design Standard for Energy Efficiency of Residential Buildings in Hot Summer and Cold Winter Zone. Ministry of Housing and Urban-Rural Development of the People’s Republic of China: Beijing, China, 2010.
- Sailor, D.J. A green roof model for building energy simulation programs. Energy Build. 2008, 40, 1466–1478. [Google Scholar] [CrossRef]
- Sailor, D.J.; Elley, T.B.; Gibson, M. Exploring the building energy impacts of green roof design decisions—A modeling study of buildings in four distinct climates. J. Build. Phys. 2012, 35, 372–391. [Google Scholar] [CrossRef]
- He, Y.; Yu, H.; Ozaki, A.; Dong, N.; Zheng, S. Long-term thermal performance evaluation of green roof system based on two new indexes: A case study in Shanghai area. Build. Environ. 2017, 120, 13–28. [Google Scholar] [CrossRef]
- Nie, Y.; Bu, Z.; Yang, J. Discussion on heating strategies in winter of residential buildings in Shanghai aiming at ultra-low energy target. Procedia Eng. 2017, 205, 3130–3137. [Google Scholar] [CrossRef]
- Huang, Y.; Kang, J.; Liu, L.; Zhong, X.; Lin, J.; Xie, S.; Meng, C.; Zeng, Y.; Shah, N.; Brandon, N.; et al. A hierarchical coupled optimization approach for dynamic simulation of building thermal environment and integrated planning of energy systems with supply and demand synergy. Energy Convers. Manag. 2022, 258, 115497. [Google Scholar] [CrossRef]
- Zhang, Q. Development of the typical meteorological database for Chinese locations. Energy Build. 2006, 38, 1320–1326. [Google Scholar] [CrossRef]
- National Climatic Data Center (NCDC); U.S. Air Force Combat Climatology Center. International Surface Weather Observations 1982–1997; NCDC: New Delhi, India; National Oceanic and Atmospheric Administration: Washington, DC, USA; US Dept. of Commerce: Asheville, NC, USA; The Air Force Combat Climatology Center (AFCCC): Asheville, NC, USA; US Dept. of Air Force: Washington, DC, USA, 1998; Volume 1–5. [Google Scholar]
- Andrić, I.; Gomes, N.; Pina, A.; Ferrão, P.; Fournier, J.; Lacarrière, B.; Le Corre, O. Modeling the long-term effect of climate change on building heat demand: Case study on a district level. Energy Build. 2016, 126, 77–93. [Google Scholar] [CrossRef]
- Tamer, T.; Dino, I.G.; Baker, D.K.; Akgül, C.M. Coupling PCM wallboard utilization with night Ventilation: Energy efficiency and overheating risk in office buildings under climate change impact. Energy Build. 2023, 298, 113482. [Google Scholar] [CrossRef]
- Duan, Z. Impact of climate change on the life cycle greenhouse gas emissions of cross-laminated timber and reinforced concrete buildings in China. J. Clean. Prod. 2023, 395, 136446. [Google Scholar] [CrossRef]
- Ashrafian, T. Enhancing school buildings energy efficiency under climate change: A comprehensive analysis of energy, cost, and comfort factors. J. Build. Eng. 2023, 80, 107969. [Google Scholar] [CrossRef]
- Chen, Y.; Ren, Z.; Peng, Z.; Yang, J.; Chen, Z.; Deng, Z. Impacts of climate change and building energy efficiency improvement on city-scale building energy consumption. J. Build. Eng. 2023, 78, 107646. [Google Scholar] [CrossRef]
- Wu, Y.; Sharifi, A.; Yang, P. Mapping building carbon emissions within local climate zones in Shanghai. Energy Procedia 2018, 152, 815–822. [Google Scholar] [CrossRef]
- Aleksejeva, J.; Voulgaris, G.; Gasparatos, A. Assessing the potential of strategic green roof implementation for green infrastructure: Insights from Sumida ward, Tokyo. Urban For. Urban Green. 2022, 74, 127632. [Google Scholar] [CrossRef]
- Peng, L.L.H.; Yang, X.; He, Y.; Hu, Z.; Xu, T.; Jiang, Z.; Yao, L. Thermal and energy performance of two distinct green roofs: Temporal pattern and underlying factors in a subtropical climate. Energy Build. 2019, 185, 247–258. [Google Scholar] [CrossRef]
- Zheng, X.; Kong, F.; Yin, H.; Middel, A.; Yang, S.; Liu, H.; Huang, J. Green roof cooling and carbon mitigation benefits in a subtropical city. Urban For. Urban Green. 2023, 86, 128018. [Google Scholar] [CrossRef]
- Schindler, B.Y.; Blaustein, L.; Lotan, R.; Shalom, H.; Kadas, G.J.; Seifan, M. Green roof and photovoltaic panel integration: Effects on plant and arthropod diversity and electricity production. J. Environ. Manag. 2018, 225, 288–299. [Google Scholar] [CrossRef]
- Osma, G.; Ordonez, G.; Hernandez, E.; Quintero, L.; Torres, M. The impact of height installation on the performance of PV panels integrated into a green roof in tropical conditions. In Energy Production and Management in the 21st Century II: The Quest for Sustainable Energy; WIT Press: Southampton, UK, 2016; Volume 205, pp. 147–156. [Google Scholar]
- Schulte, J.; Knuts, S. Sustainability impact and effects analysis—A risk management tool for sustainable product development. Sustain. Prod. Consum. 2022, 30, 737–751. [Google Scholar] [CrossRef]
- He, Y.; Yu, H.; Dong, N.; Ye, H. Thermal and energy performance assessment of extensive green roof in summer: A case study of a lightweight building in Shanghai. Energy Build. 2016, 127, 762–773. [Google Scholar] [CrossRef]


| Building Type | Number of Floors | Prototypical Building Models |
|---|---|---|
| Office | 6 |  |
| Hotel | 5 |  |
| Shopping Mall | 5 | 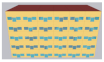 |
| Hospital | 6 |  |
| Apartment | 5 |  |
| Parameter | Value | Parameter Source from Ref. |
|---|---|---|
| Roof U-factor (W/m2K) | 0.4 | Liang et al. [42] |
| External Wall U-factor (W/m2K) | 0.6 | Liang et al. [42] |
| Shading coefficient (SC) | 0.4 | Liang et al. [42] |
| Air infiltration rate (h−1) | 0.2 | Liang et al. [42] |
| Outdoor air flow per person (m3/(h.p)) | 30 | Liang et al. [42] |
| Parameter | Value | Parameter Source from Ref. |
|---|---|---|
| Roof U-factor (W/m2K) | 0.557 | Zhang et al. [47] |
| External Wall U-factor (W/m2K) | 0.705 | Zhang et al. [47] |
| Floor U-factor (W/m2K) | 1.107 | Zhang et al. [47] |
| External Window U-factor (W/m2K) | 2.7 | Zhang et al. [47] |
| Parameter | Office | Hotel | Shopping Mall | Hospital |
|---|---|---|---|---|
| Per capita occupancy area (m2/p) | 10 | 25 | 8 | 8 |
| Equipment power density (w/m2) | 15 | 15 | 13 | 20 |
| Lighting power density | 9 | 7 | 10 | 9 |
| Fresh air volume (m3/(h.p)) | 30 | 30 | 30 | 30 |
| Pollutant Source | Emission Factor | Parameter Source from Ref. |
|---|---|---|
| CO2 | 0.584 (kg/Kwh) | Liang et al. [42] |
| 0.726 (kg/Kwh) | Yang and Hong [8] | |
| 0.788 (kg/Kwh) | Wu et al. [61] | |
| PM2.5 | 0.326 (kg/Mwh) | Yang and Hong [8] |
| SO2 | 1.005 (kg/Mwh) | Yang and Hong [8] |
| NOx | 1.604 (kg/Mwh) | Yang and Hong [8] |
| Building Type | 2020 AD | 2020 RC | 2050 AD | 2050 RC |
|---|---|---|---|---|
| Office | 5.97 | 1.73% | 6.16 | 1.77% |
| Hotel | 17.23 | 4.0% | 16.24 | 3.79% |
| Shopping mall | 118.3 | 21.6% | 120.66 | 22.2% |
| Hospital | 49.35 | 4.5% | 51.09 | 4.7% |
| Apartment | 32.16 | 8.5% | 33.16 | 8.6% |
| Building Type | Peak-to-Valley Ratio | Daily Cooling Energy (KJ/m2) |
|---|---|---|
| Shopping mall with regular roof | 2.8 | 1788 |
| Shopping mall with green roof | 1.8 | 1070 |
| Apartment with regular roof | 1.9 | 1389 |
| Apartment with green roof | 1.5 | 1246 |
| Building Type | Total Floor Area (km2) | Annual CO2 Reduction (Kt) | ||
|---|---|---|---|---|
| Scenario 1 | Scenario 2 | Scenario 3 | ||
| Office | 4.30 | 4.16 | 5.18 | 5.62 |
| Hotel | 1.90 | 5.32 | 6.61 | 7.17 |
| Shopping Mall | 1.61 | 31 | 38.54 | 41.83 |
| Hospital | 0.90 | 7.2 | 8.95 | 9.72 |
| Total | 9.71 | 47.68 | 59.28 | 64.34 |
| Building Type | Total Floor Area (km2) | PM2.5 (t) | SO2 (t) | NOx (t) |
|---|---|---|---|---|
| Office | 4.3 | 2.32 | 7.17 | 11.44 |
| Hotel | 1.90 | 2.97 | 9.15 | 14.60 |
| Shopping Mall | 1.61 | 17.31 | 53.35 | 85.15 |
| Hospital | 0.90 | 4.02 | 12.39 | 19.78 |
| Total | 9.71 | 26.61 | 82.06 | 130.97 |
| Priority to Install Green Roofs | Rules |
|---|---|
| High | (1) located in area of population density > 30,000 people/km2 and; (2) located near industrial area (within the 200 m buffer zone) and; (3) annual CO2 reduction larger than 800 t and annual air pollution (PM2.5, SO2, and NOx) reduction larger than 400 kg |
| Moderate | (1) located in area of population density > 15,000 people/km2 and; (2) annual CO2 reduction larger than 400 t and annual air pollution (PM2.5, SO2, and NOx) reduction larger than 200 kg or; (3) located near industrial area (within the 200 m buffer zone) |
| Low | the rest of the buildings |
Disclaimer/Publisher’s Note: The statements, opinions and data contained in all publications are solely those of the individual author(s) and contributor(s) and not of MDPI and/or the editor(s). MDPI and/or the editor(s) disclaim responsibility for any injury to people or property resulting from any ideas, methods, instructions or products referred to in the content. |
© 2023 by the authors. Licensee MDPI, Basel, Switzerland. This article is an open access article distributed under the terms and conditions of the Creative Commons Attribution (CC BY) license (https://creativecommons.org/licenses/by/4.0/).
Share and Cite
Zheng, Y.; Chen, L. Modeling the Effect of Green Roofs for Building Energy Savings and Air Pollution Reduction in Shanghai. Sustainability 2024, 16, 286. https://doi.org/10.3390/su16010286
Zheng Y, Chen L. Modeling the Effect of Green Roofs for Building Energy Savings and Air Pollution Reduction in Shanghai. Sustainability. 2024; 16(1):286. https://doi.org/10.3390/su16010286
Chicago/Turabian StyleZheng, Yuanfan, and Liang Chen. 2024. "Modeling the Effect of Green Roofs for Building Energy Savings and Air Pollution Reduction in Shanghai" Sustainability 16, no. 1: 286. https://doi.org/10.3390/su16010286
APA StyleZheng, Y., & Chen, L. (2024). Modeling the Effect of Green Roofs for Building Energy Savings and Air Pollution Reduction in Shanghai. Sustainability, 16(1), 286. https://doi.org/10.3390/su16010286