Article

Temporal and Spatial Changes of Agriculture Green Development in Beijing’s Ecological Conservation Developing Areas from 2006 to 2016

1
Institute of Plant Nutrition, Resources and Environment, Beijing Academy of Agriculture and Forestry Sciences, Beijing 100097, China
2
Institute of Grassland, Flowers and Ecology, Beijing Academy of Agriculture and Forestry Sciences, Beijing 100097, China
3
College of Land Science and Technology, China Agricultural University, Beijing 100193, China
4
College of Arts and Science, New York University, 383 Lafayette Street, New York, NY 10003, USA
*
Authors to whom correspondence should be addressed.
Sustainability 2024, 16(1), 219; https://doi.org/10.3390/su16010219
Submission received: 14 October 2023 / Revised: 14 December 2023 / Accepted: 15 December 2023 / Published: 26 December 2023

Abstract

:
As an irreplaceable ecological barrier, an ecological conservation developing area (ECDA) is vital for the integrated construction of urban and rural areas and the optimization and adjustment of industrial structures. However, few empirical studies have been conducted on the spatiotemporal variations of agricultural green development (AGD) in the ECDAs of large cities. Based on the green agricultural traits of Beijing and the accessible data, we evaluated the AGD and analyzed its spatial and temporal heterogeneity in Beijing’s ECDAs by constructing a framework with 13 indicators. The results stated that energy consumption is a vital factor in green agriculture production and that the agricultural output value per unit of arable land area is the key to green agricultural revenue. From 2006 to 2016, the AGD index of the ECDA had an increasing trend, until 2012 when it followed a decreasing tendency. The AGD index of the northern region was higher than in the southern ECDA. The obstacle degree model was used to verify the AGD limiting factors, where poor infrastructure, slow agritourism, low labor productivity, and low resource use efficiency varied by districts in the ECDA. Given these findings, our study is conducive to AGD evaluation at the district (county) level for the ECDAs of large cities and provides important policy implications.

1. Introduction

Rapid urbanization has had severe impacts on ecological security regarding environmental pollution in past decades [1,2]. How to achieve the dynamic equilibrium between economic development and environmental protection is of great concern during the urbanization process [3,4]. The concept of “green” has been recently brought up as an intrinsic requirement for worldwide economic development to reduce environmental pollution while earning a competitive advantage [5].
Green development has proven to be an effective path for governments around the world to achieve sustainable socio-economic development [5,6,7]. Green development has also been incorporated into the global development agenda in the United Nations Sustainable Development Goals (SDGs), with 56 out of 169 specific goals directly related to a green economy [8]. In addition, worldwide efforts have been repeatedly made for green development on national, regional, and watershed scales for green industries [5,9,10,11]. Against the background of decreasing global natural resources, increasingly severe environmental pollution, and rising demand for safe agricultural products, green development has become a major trend for agriculture across the globe. Agricultural green development (AGD) was even part of a global strategy to achieve the Sustainable Development Goals (SDGs) of agrifood systems proposed by the United Nations [8]. Thus, AGD has gradually become a research hotspot, representing an important path to sustainable agriculture [12,13,14,15,16,17,18,19,20,21,22].
China’s agricultural economy has experienced rapid growth since the introduction of economic reforms and opening up. However, increasingly prominent ecological issues, such as land degradation, the eutrophication of water bodies, and excessive carbon emissions, have arisen [21,22]. China has considered green development in agriculture as a crucial pathway to ensure food security and protect the ecological environment [23,24]. The General Office of the Communist Party of China (CPC) Central Committee formally introduced the concept of green development into agricultural modernization processes in the “Opinions on promoting green development of agriculture by innovation institutions and mechanisms” in 2017. In 2021, the Ministry of Agriculture and Rural Affairs and five other ministries jointly issued the 14th Five-Year Plan, making systematic arrangements for AGD in the next five years in China [25]. The AGD assessment in China thereby attracted increasing attention to advance its green level [23,24,26,27,28,29,30,31,32,33,34,35,36]. However, the Chinese AGD assessment is still in its infancy. Choosing the appropriate AGD evaluation model is still a big challenge in metropolises, such as Beijing and Shanghai, which have prominent contradictions between environmental protection and economic growth.
In past decades, large populations and rapid economic growth have triggered a series of environmental problems, such as water shortage and soil deterioration in Beijing, in the ecological conservation developing area (ECDA) in particular [37,38]. However, the implementation of ECDAs has made significant contributions to the sustainable development of neighboring metropolises [39,40,41,42]. Early in 2006, the Beijing municipal government adjusted the development paths and overall goals for ECDAs to significantly improve the level of eco-environment conservation, create substantial breakthroughs in the major fields and crucial links of eco-environment construction, increase the forest coverage rate to over 70%, and greatly improve the surface water quality and tree protection index by 2010. Policies related to environmental protection changed accordingly. For instance, industrial facilities and activities degrading the eco-environment were prohibited or limited in regions like Beijing’s ECDA. As a result, choosing conducive industries for sustainable development and the alternative livelihoods of local residents became a priority in these areas [39,42]. In the meantime, the development of the ECDA itself has been relatively slower than in other areas in Beijing, mainly reflected by infrastructure conditions, residents’ income level, and regional self-development ability. Therefore, it was a big challenge to coordinate the dual objectives of ecological environment construction and economic development to ensure eco-environment protection while increasing its rapid development level in the ECDA of Beijing. As the capital of China, Beijing has great motivation to achieve AGD, which has already been realized in developed countries and developing countries (such as the USA, Japan, and Australia and in the European Union) in the 20th century [9,10,11,12,13,14,15,16,17,18,19,37,38,41].
The objectives of this study were to (1) sort previous works of literature based on evaluation indicator frameworks and methods for AGD assessment in Beijing’s ECDA; (2) establish an AGD evaluation indicator framework and model for Beijing’s ECDA to provide a reference for a district (county) AGD evaluation in other big cities in China, such as Shanghai and Guangzhou; (3) analyze the temporal and spatial variations of AGD through panel data based on the socio-economic statistical data from 2006 to 2016 covering 13 districts of Beijing to provide systematic analysis on the regional disparities, spatial dynamics, and state transitions of AGD at a small scale; (4) establish regional policy countermeasures that can generate an improvement in the AGD in ECDAs.

2. Literature Review

2.1. AGD Evaluation Indicator Framework

We comprehensively reviewed previous studies with different AGD evaluation indicator frameworks and evaluation methods. A rational evaluation indicator framework serves as the foundation of AGD, with an ultimate goal of effectively evaluating regional green agriculture to provide a decision-making basis for agricultural structure upgrading and eco-environmental protection. Scientists have not reached an agreement on the evaluation index framework, which is the key to accurate calculation of AGD level. Previous studies on AGD at national, major river basin, and provincial scales have reported several material input indicators on agricultural energy and water consumption and the intensity of fertilizer, pesticide, and agricultural film use, as well as output indicators on land and agricultural labor productivity [12,13,14,15,22,23,24,25,29,30,31,32,33,34,35,36,37,43,44,45,46,47,48,49,50,51,52,53]. These indicators were context-dependent and varied slightly depending on the specific application. For example, energy consumption was calculated per unit of gross agricultural output value and per unit of arable land area; water consumption was measured by water-saving irrigation efficiency, unit of arable land area, and unit of agricultural output value [24,25,33,34,39]. Benjebli et al. [15] used renewable energy consumption to assess agricultural cointegration and Granger causality for the Tunisian economy. Nevertheless, it is acknowledged that AGD is a new development mode of harmonious coexistence between man and nature, with further research needed on its concept, characteristics, and type. AGD has economic and efficient use of resources as its main characteristics, ecological preservation as its basic requirement, environmental friendliness as its internal attribute, and abundant supply of green products as its central objective [37,39,40,41,42]. While these basic characteristics are independent of the evaluation scale, the AGD evaluation indicators were context-specific and varied according to the purpose of the study, research location, and data availability. For example, when assessing AGD in the Beijing–Tianjin–Hebei region, the proportion of agriculture, forestry, and water conservancy expenditure in fiscal expenditure and the arable land retention rate were chosen as evaluation indicators [44]. Kuang et al. [32] included sugar crop yield per unit land area in the evaluation of AGD in Guangxi Province. For AGD in the Yellow River Basin, Zha et al. [34] added indicators of soil erosion control level and agricultural disaster control capacity, while Zhang et al. [51] used forest coverage rate and agricultural natural disaster incidence to reflect local natural characteristics. In economically developed areas, the proportion of agritourism in agricultural output value was selected as the AGD output indicator in the Yangtze River Delta [35], as well as agritourism revenue in Tianjin [47], and industrial convergence level in the Yellow River Basin [46]. In addition, output indicators at the provincial level included the number of certifications of green, organic, and geographical labeling of agricultural products [42,53] and the area of nature reserves [30,33,45]. Considering that sustainability is often seen as (at least) three-dimensional (encompassing economic, ecological, and social sustainability attributes) [12], Janker [17] explained the social dimension of sustainability and then justified why moral conflicts are relevant to agricultural sustainability. Laurett et al. [18] applied socio-demographic characteristics to sustainable agricultural development in Brazil. Agricultural sustainability in developing countries includes a range of demographic, natural, socio-economic, political, institutional, and managerial factors [13]. On the other hand, agricultural carbon intensity was used to measure the degree of greening of agriculture from an emission reduction perspective. A lower value of agricultural carbon emissions represents a higher level of agricultural green development [14,16,38,54,55,56,57,58]. Saghaian et al. [58] studied the effects of agricultural product exports on the environmental quality of three developed countries and forty-three developing countries. Weinzettel et al. [59] found that the environmental footprints of agriculture were embodied in international trade.
Previous studies focused on the construction of AGD evaluation indicator frameworks at national and provincial scales, which often could not be applied at smaller scales (such as city, county, and industry sector) due to their inapplicability. The county is the fundamental administrative unit in China, with a rural, regional, hierarchical, comprehensive, and unbalanced economy. Thereby, the county economy has become the forefront and main battlefield in promoting AGD in China, especially in the context of rural revitalization and agricultural supply-side structural reform. It is of practical significance to conduct AGD evaluation at the county level. In general, due to the different evaluation dimensions and selected indicators, it is somewhat difficult to make comparisons of AGD over time and space. For example, natural reserve areas and water-saving irrigation efficiency at national or provincial scales are not applicable at the county scale. Therefore, researchers have made attempts to assess AGD at the county scale. Xiong et al. [60] adopted 11 indicators related to grain production for AGD evaluation in grain-producing counties of Sichuan. Hou et al. [61] constructed an indicator framework for AGD evaluation in Lishu County, Jilin Province, based on the NUFER-AGD model. Shen and Wang [62] used agricultural carbon footprint as the undesired output to construct the super-efficiency SBM model and panel Tobit fixed-effect model to evaluate the AGD efficiency of 11 cities in Hebei Province. Yang [63] constructed AGD indicators based on the county cross-section data of Hubei Province in 2017. These indicators took into account the county differences in Hubei Province, such as the mechanization level of mechanical tillage, mechanical sowing, mechanical harvesting, and the scale of livestock and poultry breeding. Duan et al. [64] established the evaluation indicators of AGD in Bailang County of Tibet, adding characteristic indicators such as the retention rate of arable land and wetlands, the comprehensive grassland vegetation coverage rate, and the balance ratio of livestock and natural grassland. Janker [17] studied the interests of different stakeholders for seven moral conflict scenarios in agriculture and the moral arguments for the idea of agricultural value chains. Quiroga et al. [65] identified the playing field for European Union agriculture in terms of farm productivity and efficiency. Despite their objective assessment of a particular industry or location, it is still difficult to compare AGD across industry types and regions using a microscale framework. For the county-level AGD evaluation indicator framework, it is necessary to fully reflect the heterogeneity of regional, physical, and economic characteristics between counties.

2.2. AGD Evaluation Methods

Previous studies have used different methods to assess AGD: objective methods, subjective methods, or a combination of both. Objective methods, such as the entropy method, have been widely used to avoid personal bias of decision makers in AGD evaluation [33,45,47,51]. The entropy–Technique for Order Preference by Similarity to Ideal Solution (TOPSIS) method [30,52,60,66,67], a modified version of the entropy method, allows the weighting of each criterion by the decision makers, without limitations on the number of indicators and samples or the investigation scale [68]. However, it has the disadvantage of overly weighting the indicators with high values and can only accurately reflect the distances to the ideal solution/sample [69]. Many researchers have used subjective methods, such as ecological footprint [59], stochastic frontier analysis [70], data envelopment analysis [71], nutrient flows in food chains, environment and resource use models [72], and system models [73,74]. The entropy–TOPSIS method was often employed for sample/solution ranking, while the entropy method was used to determine the weight of indicators with good stability [66,67]. The analytic hierarchy process (AHP) is a subjective, flexible, and practical multi-criteria decision-making method for quantitative analysis of qualitative problems [45,46,75]. The main advantage of the AHP is that it can determine the weights of indicators at the top and bottom levels [67]. However, assigning weights by the AHP requires comparing the importance of indicators in pairs, which can be difficult in practice [53]. The projection pursuit method is a new reliable statistical method proposed in the 1970s to deal with high-dimensional, non-linear, and non-normally distributed data [76,77,78]. It has the advantage of dimension reduction to find the most “interesting” projections in high-dimensional data by maximizing a so-called projection index stepwise. In certain cases, the projection index could have different definitions. For example, new projection indicators have been proposed to provide low-dimensional projections for efficient supervised classification [79]. For the classification of complex data, Grochowski and Duch [80] constructed a neural network algorithm using projection pursuit to find the simplest models. Projection pursuit has also been used to develop a novel recurrent neural network for discriminant analysis [81]. The projection pursuit model method can locate the optimal projection direction according to the data characteristics of the sample itself, allowing an objective determination of the influence weight of each evaluation indicator. In doing so, it has been widely used in many fields and various comprehensive evaluation problems, such as ecosystem carrying capacity [82], innovation capacity [51], efficiency and risk assessment [24], development quality [66], and water resource carrying capacity [83]. However, it has not been applied to AGD assessment of significant ecological value. Considering the serious impact of an ECDA on the surrounding areas, it is of great theoretical and practical importance to study the AGD status in regions with critical ecological value for further implementation of regional sustainable development and improvement of people’s welfare.

3. Materials and Methods

3.1. Study Area and Data

The 13 districts of Beijing are divided into a function expansion area (Chaoyang, Fengtai, and Haidian districts), urban developing area (Fangshan, Tongzhou, Shunyi, Changping, and Daxing districts), and ECDA (Mentougou, Huairou, Pinggu, Miyun, and Yanqing districts) (Figure S1). To analyze the temporal and spatial characteristics of AGD, we constructed the panel data of these districts from 2006 to 2016. These data were originally obtained from the Beijing Statistical Yearbook, the Beijing Regional Statistical Yearbook (issued by the Beijing Municipal Bureau of Statistics and the Survey Office of the National Bureau of Statistics in Beijing), the Beijing Culture and Tourism Statistics Report (issued by the Beijing Municipal Bureau of Culture and Tourism), the Beijing Ecology and Environment Statement (issued by the Beijing Municipal Ecology and Environment Bureau), the National Economic and Social Development Report (issued by the National Bureau of Statistics), and the 2nd and 3rd National Agricultural Census Reports (issued by the National Bureau of Statistics).
Vector maps (in the shp format) of basic Chinese geographical information were obtained from the 1:400 million map database of the National Geomatics Center of China (www.ngcc.cn, accessed on 19 December 2023), which was used as the base map for geographic information system (GIS) analysis. Geographical coordinates were registered to the Lambert conformal conic projection coordinate system through the digitalization of ArcGIS. The map had two information coverage layers: city layer (area data) and district/county layer (area data).
Two cross-sectional datasets (2006 and 2016) were selected to investigate the spatial pattern and development trajectory of green agriculture in Beijing at the district/county level.

3.2. AGD Evaluation Method—Projection Pursuit Method

The AGD in Beijing was evaluated using the projection pursuit method after being quantified using normalization in this study.
We first normalized the indicators in the AGD evaluation framework using the following equations.
x’i = (xi − min xi)/(max xi − min xi), when xi is a positive indicator;
x’i = (max xi − xi)/(max xi − min xi), when xi is a negative indicator.
A function of AGD projection indicators was then constructed, which transformed the multi-dimensional data {Xij|j = 1, 2, …, n} into one-dimension projected values:
Z i = j = 1 n a j X i j         ( i   =   1 ,   2 ,   ,   m ;   j   =   1 ,   2 ,   n )
Afterwards, a function of the AGD target indicators was then constructed with the following equations.
Q(a) = S(a)D(a)
where S(a) is the standard deviation of multiple Zi, and D(a) is the local density of Zi.
S   ( a ) = i m z i E 2 m 1         ( i   =   1 ,   2 ,   ,   m )
D ( a ) = i = 1 m j = 1 m R r i j u R r i j         ( i , j   =   1 ,   2 ,   ,   m )
where Ei is the mean value of Zi, and R is the window radius of the local density (generally 0.01); rij = |zi − zj| is the distance between the projected values, n is the number of samples, m is the number of indicators, i and j are the current count number of samples, u(t) is the unit step function as follows:
u ( t ) = 1 , t 0 0 , t < 0
t = R − rij
According to the following limiting constraints, the optimal projection direction aj, which indicates the weight of the indicators, can be obtained.
max Q a = S a D ( a ) 1 n a 2 j = 1
where max Q(a) is the maximum value of Q(a), aj is the weight of each index, and regional integrated assessment value Zi can be then calculated by entering aj in Equation (1) to analyze AGD in different districts.
Based on the regional integrated assessment value Zi, the AGD degree of Beijing (Pi) is found using the following equation:
P i   = Z i i = 1 n a i × 100

3.3. Obstacle-Degree-Calculating Model

The obstacle degree (Oij) has been introduced to identify and diagnose obstacle factors of the AGD index layer and to provide a reference value for AGD improvement in ECDAs. The equation to calculate the obstacle degree is as follows:
O i j = 1 r i j a i 100 i = 1 m 1 r i j a i
where Oij is the obstacle degree of index i to the AGD level in year j. The smaller the value of Oij, the less obstructive the index is to the AGD process and vice versa.

4. Results and Analysis

4.1. AGD Evaluation Indicator Framework for Beijing ECDA

Following the principles of accessibility, comparability, integrity, and regional heterogeneity, 13 indicators were selected to assess AGD in the ECDA (Table 1) according to the actual agricultural development in Beijing. They included eight indicators that reflecting green agricultural production (AP1–AP8) and five indicators that reflect green agricultural revenue (AI1–AI5). Among them, AP1–AP6 were negative indicators that decreased with increasing AGD, while the remaining seven were positive indicators.

4.2. Weight of Integrated Evaluation

According to Table 1, the green agricultural production was decisive in AGD in Beijing from 2006 to 2016, with a weight coefficient of 2.08. Energy consumption (AP1 and AP2) had a weight coefficient of 0.9549, indicating that agricultural development in ECDAs was overly dependent on energy consumption. Future AGD needs to continuously focus on reducing energy consumption and substituting clean energy. Therefore, Beijing has implemented the “coal to clean energy” and “coal reduction and cleaner coal” programs since 2016 to accelerate the use of clean energy in rural areas. The weight coefficients of these four indicators (AP1–AP4) accounted for 67.37% of the total green agricultural production, indicating that agricultural production still greatly relied heavily on resource consumption. Thus, the transition to modern agriculture had a long way to go in this area. The green agricultural revenue affected the AGD on the aspects of agricultural industry structure, technology level, labor productive efficiency, and investment in agricultural infrastructure. In addition to agritourism revenue, other indicators (AI2–AI5) contributed significantly to green agricultural revenue with high weighting coefficients. The decisive role of the value of agricultural output per unit of arable land (AI4, weight coefficient of 0.3428) in green agricultural revenue was mainly due to the large differences in the quality of arable land in ECDAs.
Comparing the evaluation layers, green agricultural production contributed more to AGD than green agricultural revenue from 2006 to 2016. At this stage, the AGD focused on green production rather than green revenue, which emphasized the need to take various measures to continuously increase green revenue in ECDAs.

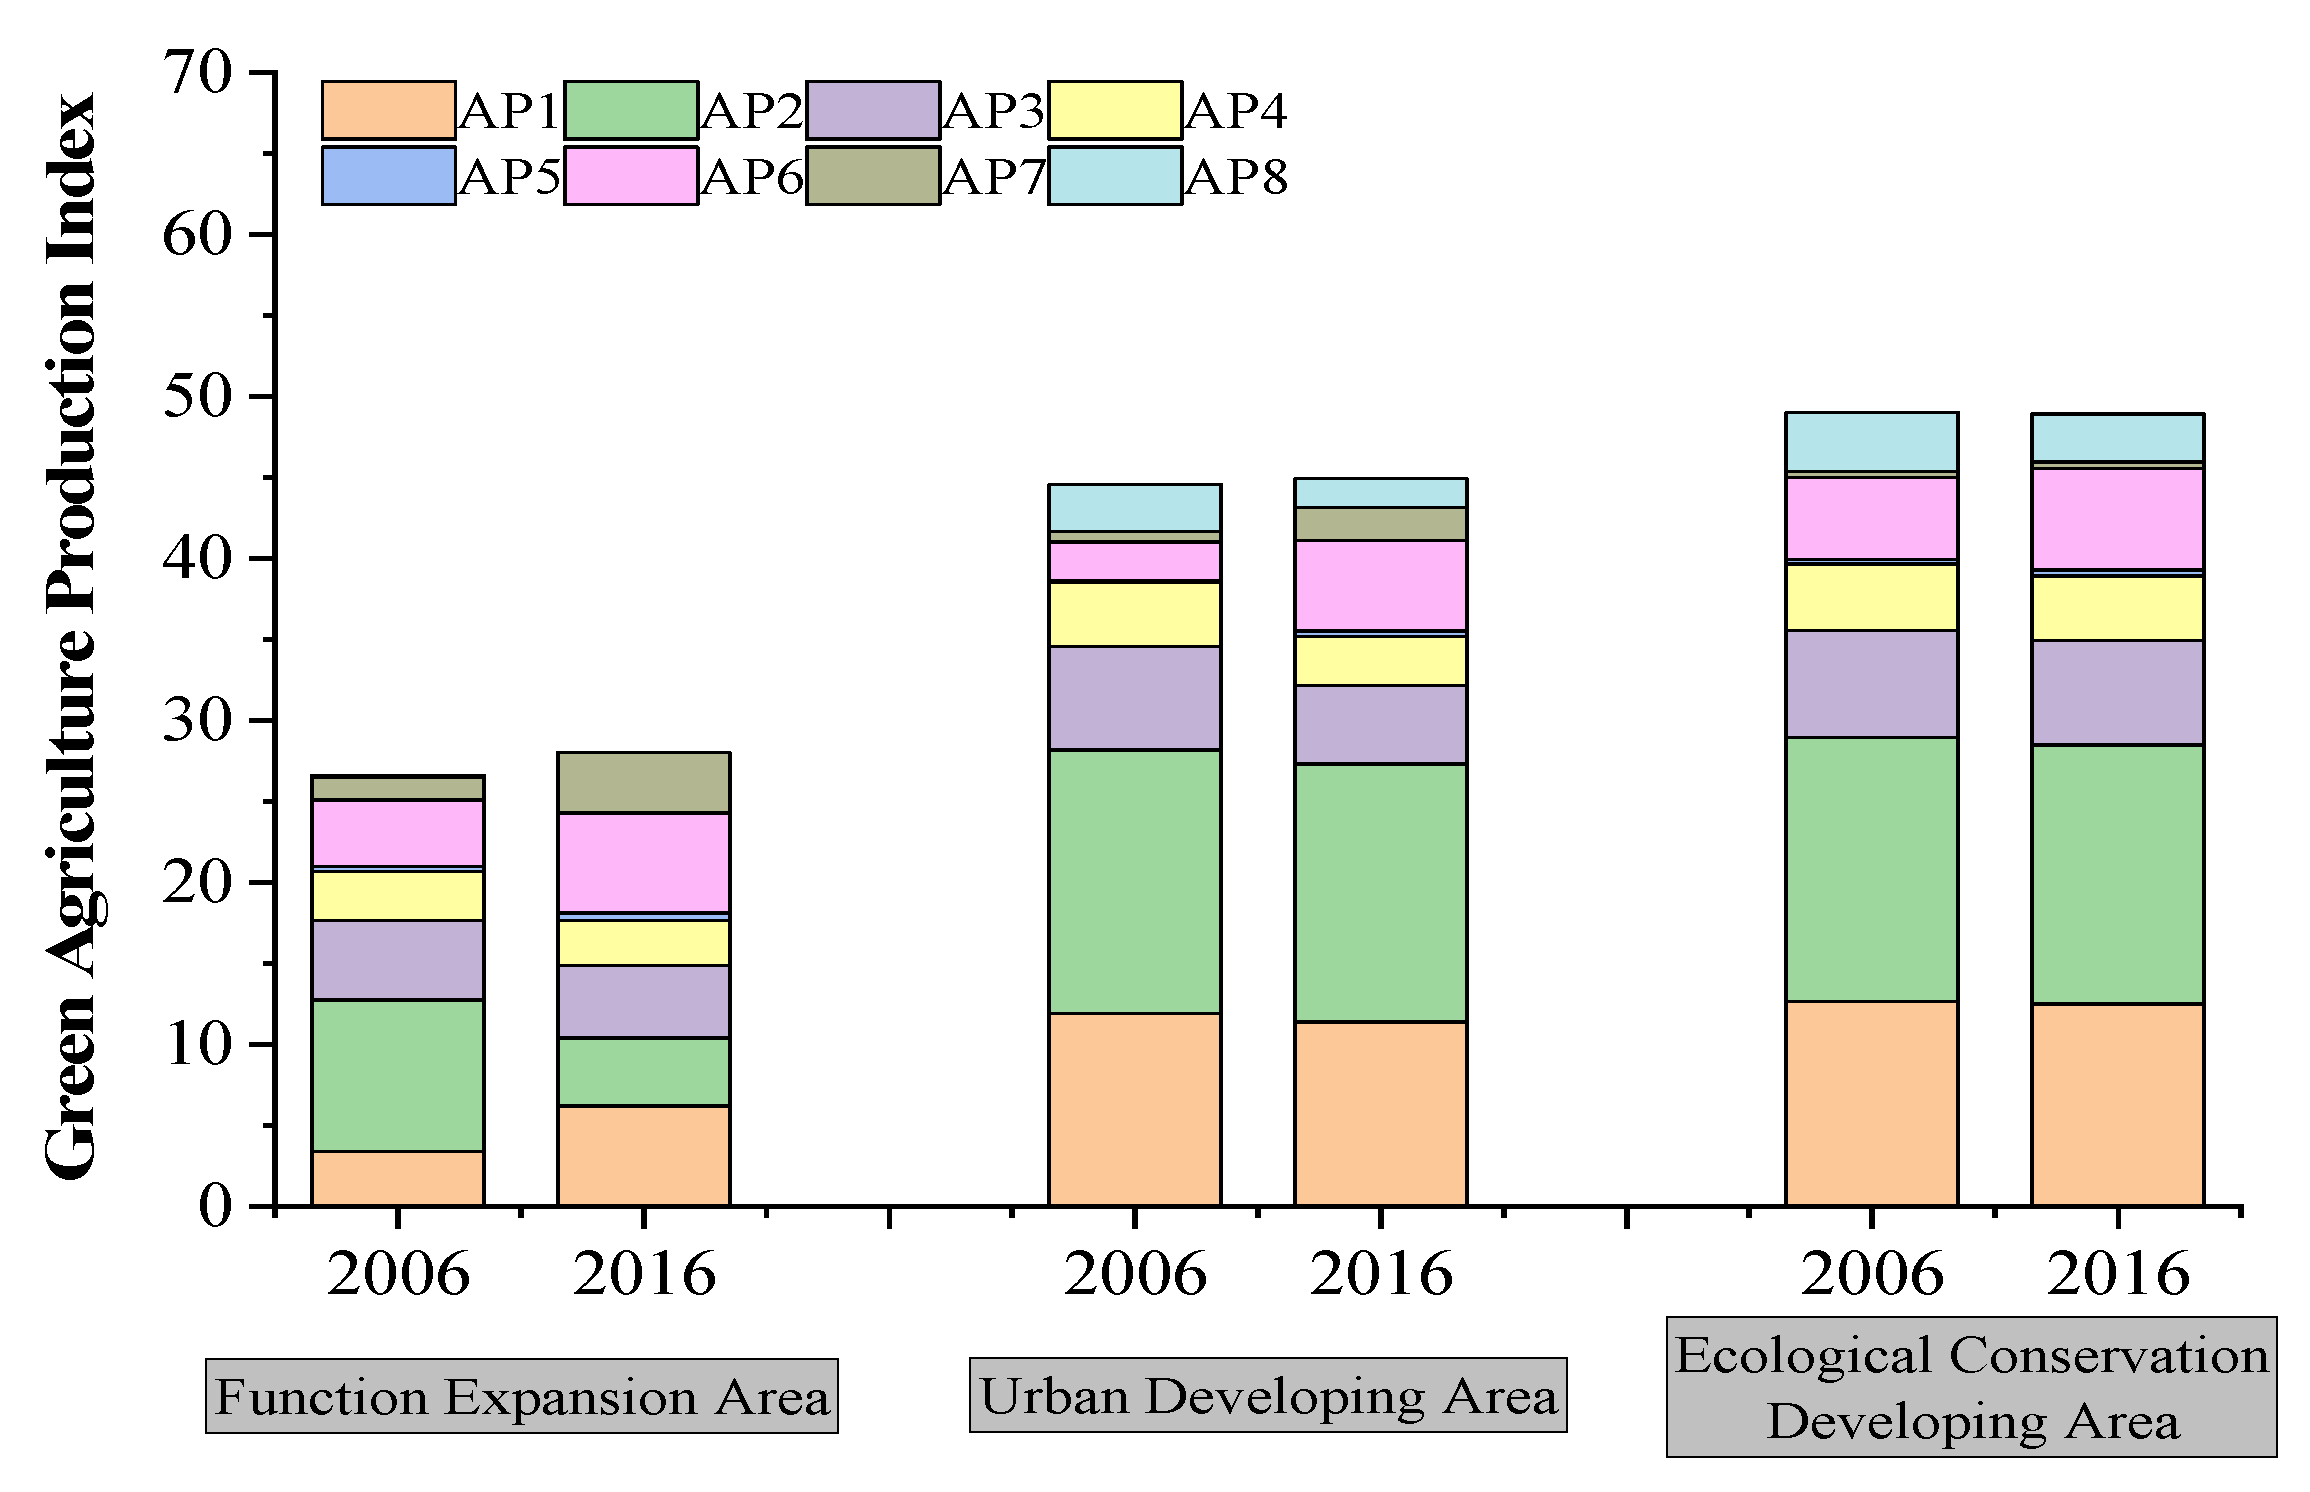
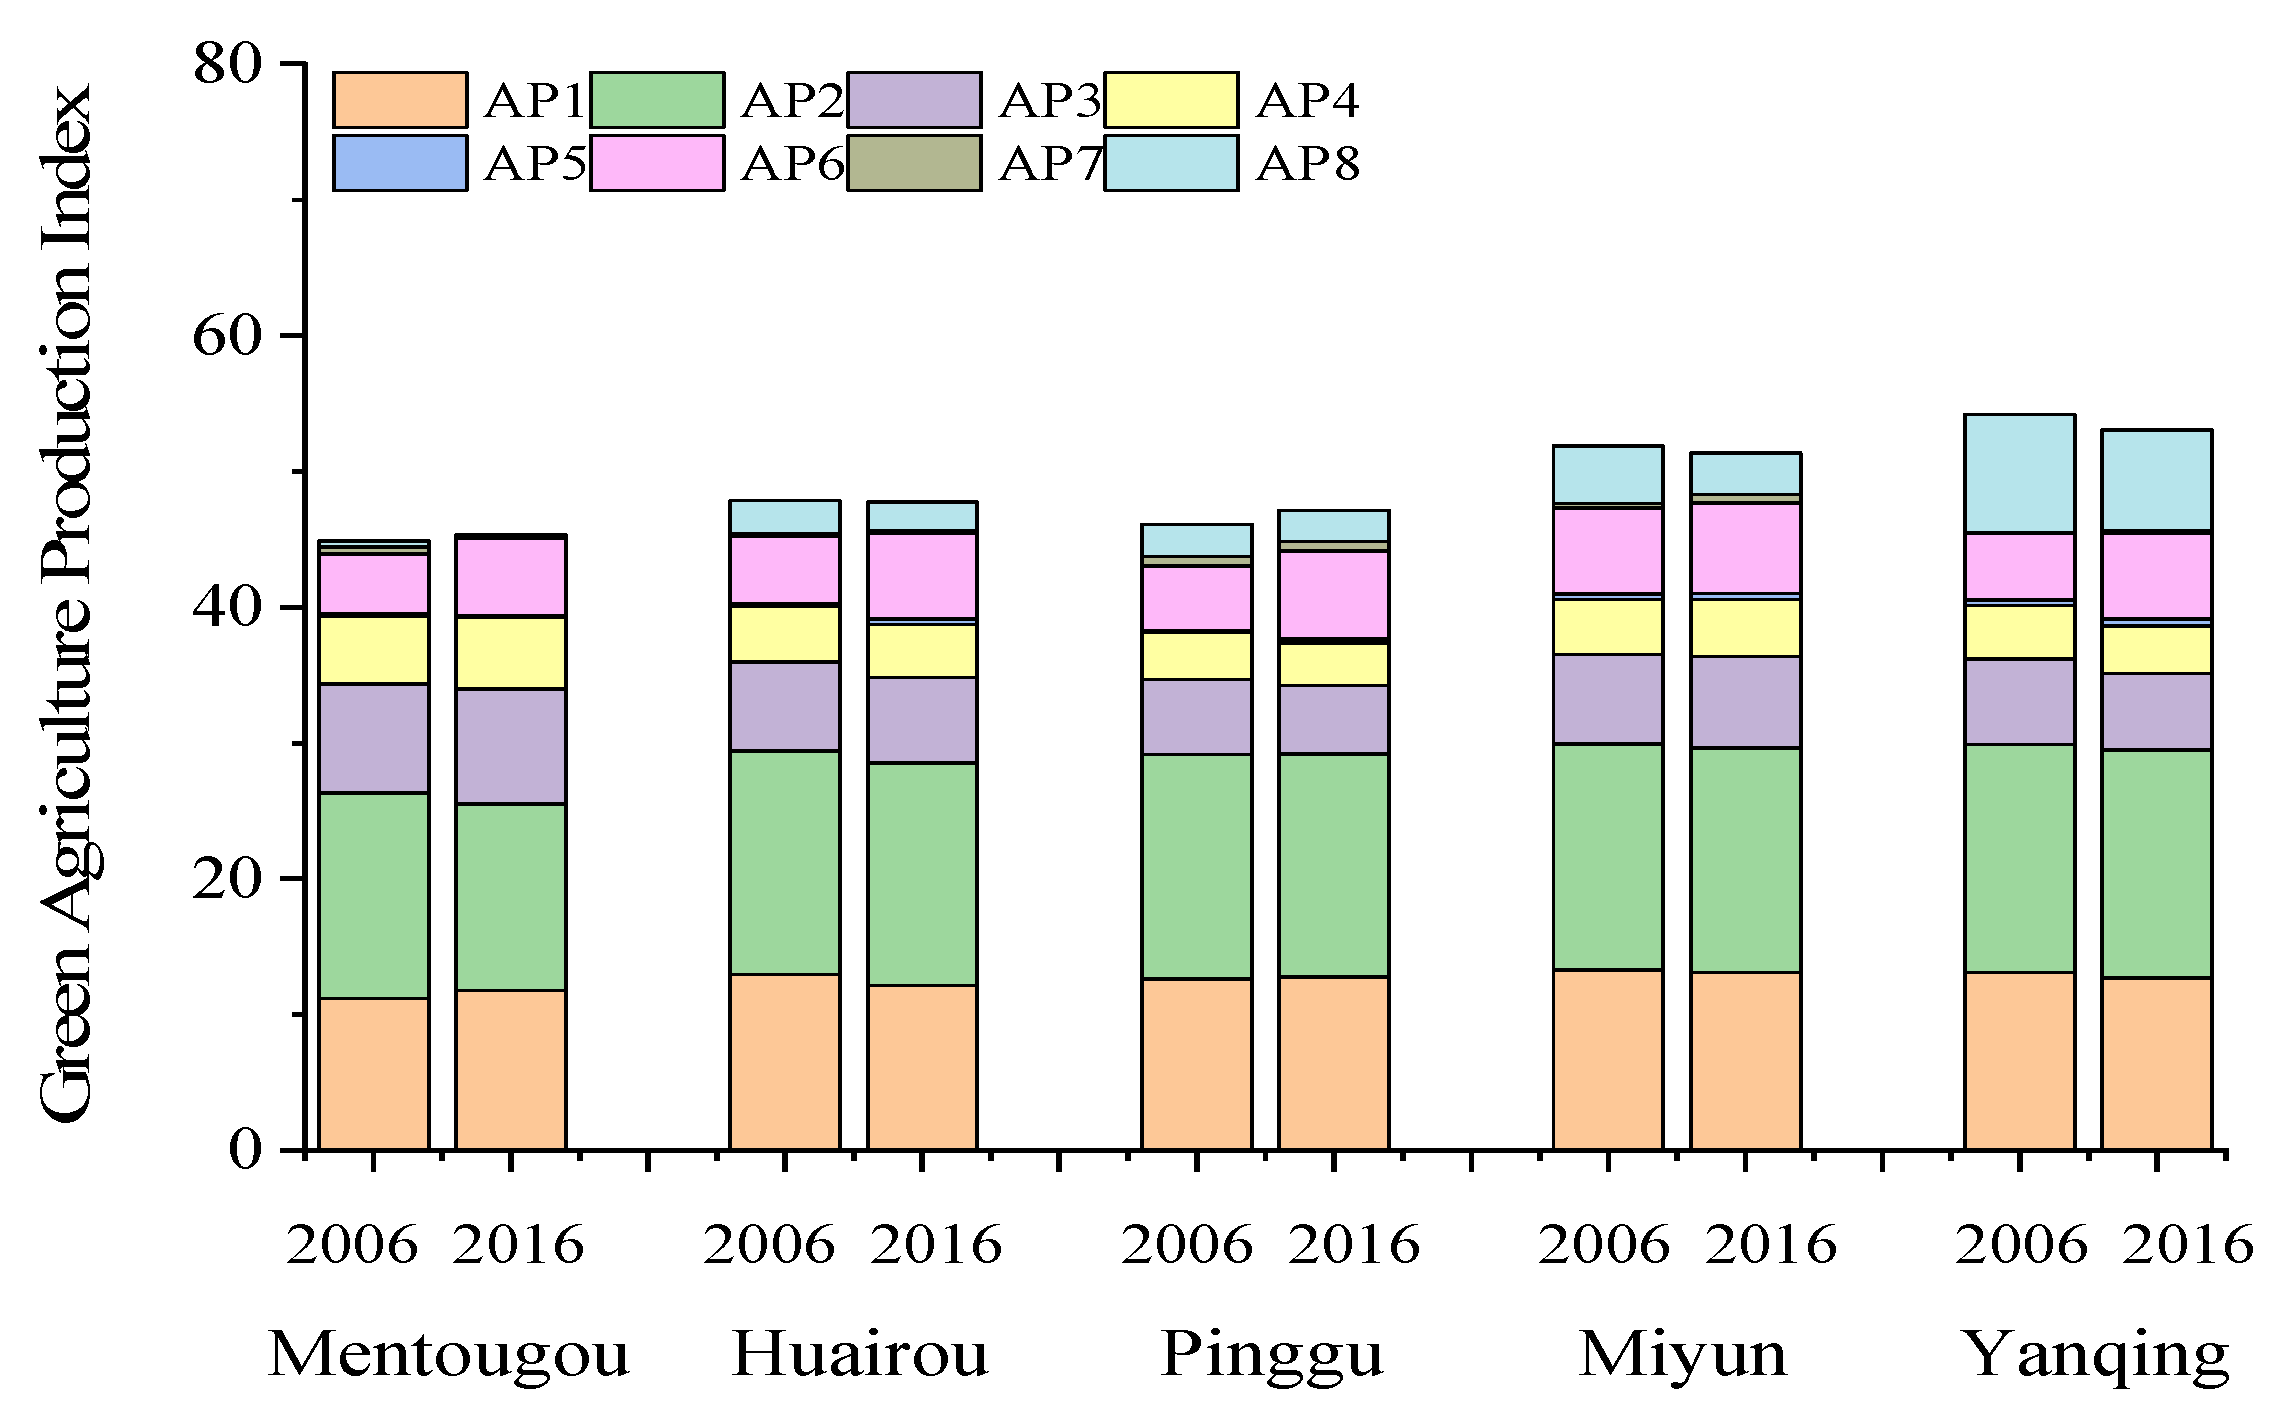
4.3. Green Agricultural Production

In 2016, the ECDA had a green agricultural production index of 48.91, which was higher than that of the urban developing area (44.90) and the function expansion area (28.01) (Figure 1). This was due to the lower energy consumption per unit of agricultural output value (AP1) and the larger arable land area per capita (AP8) in the ECDA. However, facility agriculture (0.36) in the ECDA was less developed than in the urban developing area (2.01) and the function expansion area (3.73) in 2016, mainly due to higher construction costs for the complex terrain conditions and insufficient investment in agricultural infrastructure. From 2006 to 2016, the green agricultural production index decreased by 0.07 in the Beijing’s ECDA, whose green agricultural sustainability is more insufficient than that of the urban developing area (0.36) and the function expansion area (1.44).
In general, changes were observed in most indicators of green agricultural production at the district level from 2006 to 2016. Indicator values for resource utilization (AP4, AP5, and AP6) were increased over the ten years in the ECDA, especially for fertilizer usage per unit of gross agricultural output value (AP4, increased by 33.19%). However, the increase in fertilizer use efficiency in the ECDA was much lower than in the urban developing area (increased by 100.59%) and function expansion area (83.09%), indicating that there is still room for improvement in resource use efficiency.
From a district perspective, the green agricultural production index in the ECDA ranged from 45.33 to 53.02, with the highest values in Yanqing (53.02) and Miyun (51.33) districts in 2016 (Figure 2). Despite the low chemical fertilizer usage, green agricultural production was the lowest in Mentougou district (45.33), which was mainly due to high energy consumption, large mountainous area (98.50%, Mentougou Statistical Yearbook), and low arable land area per capita. Compared with 2006, the green agricultural production index in 2016 decreased in Yanqing, Huairou, and Miyun districts, but increased in Pinggu and Mentougou districts, which resulted from increased agricultural output value per unit of arable land and agricultural labor productivity (Figure 2).

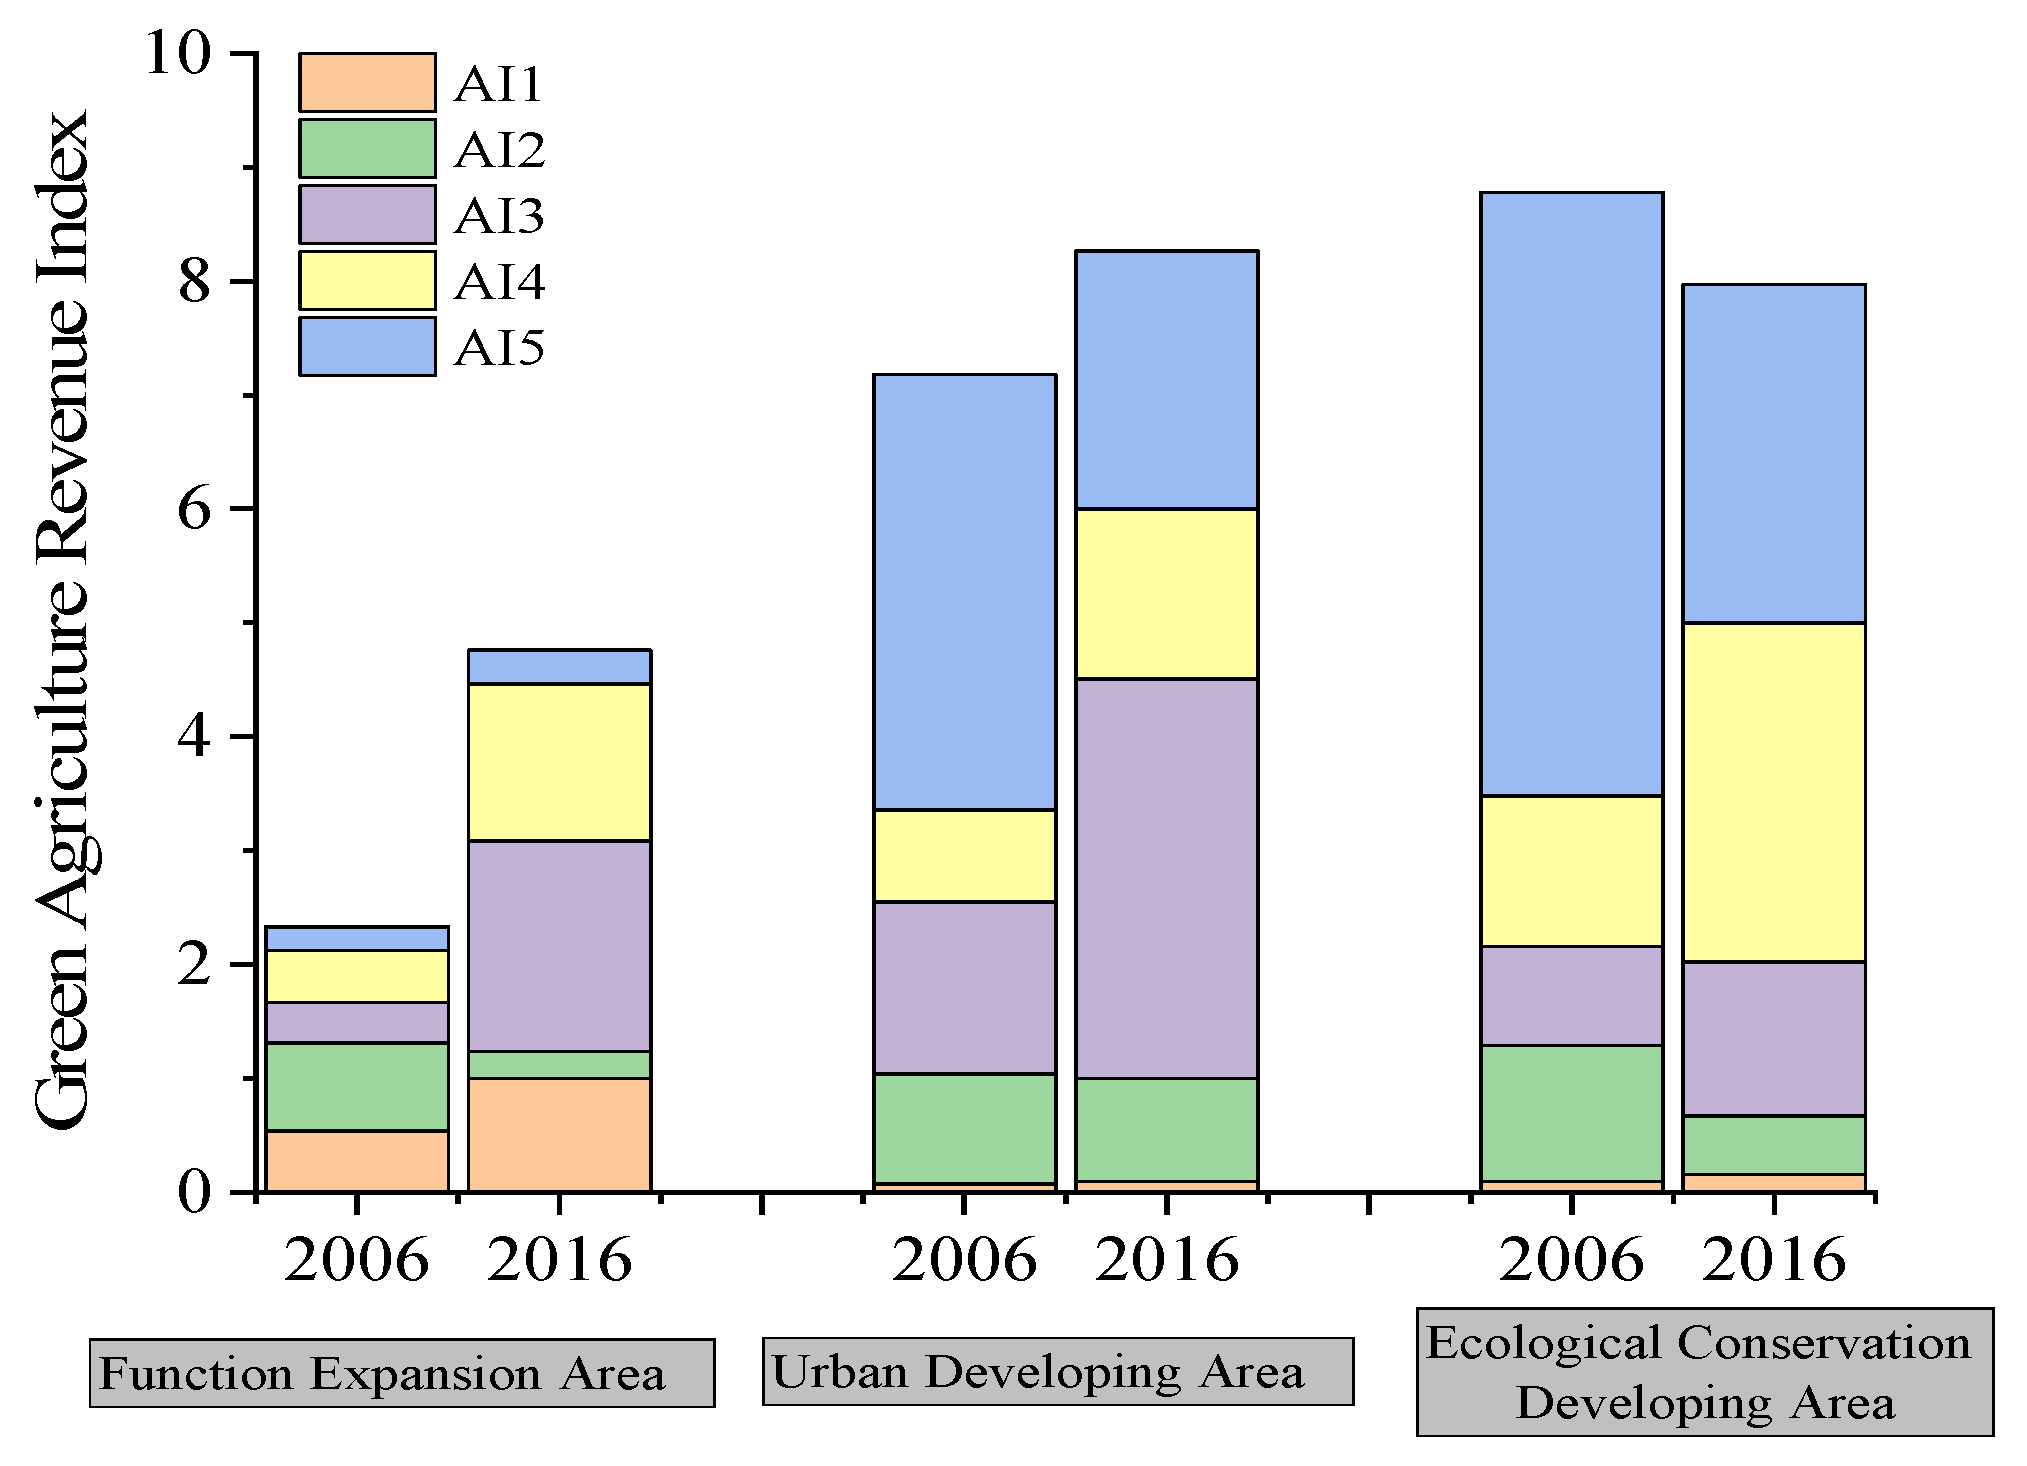
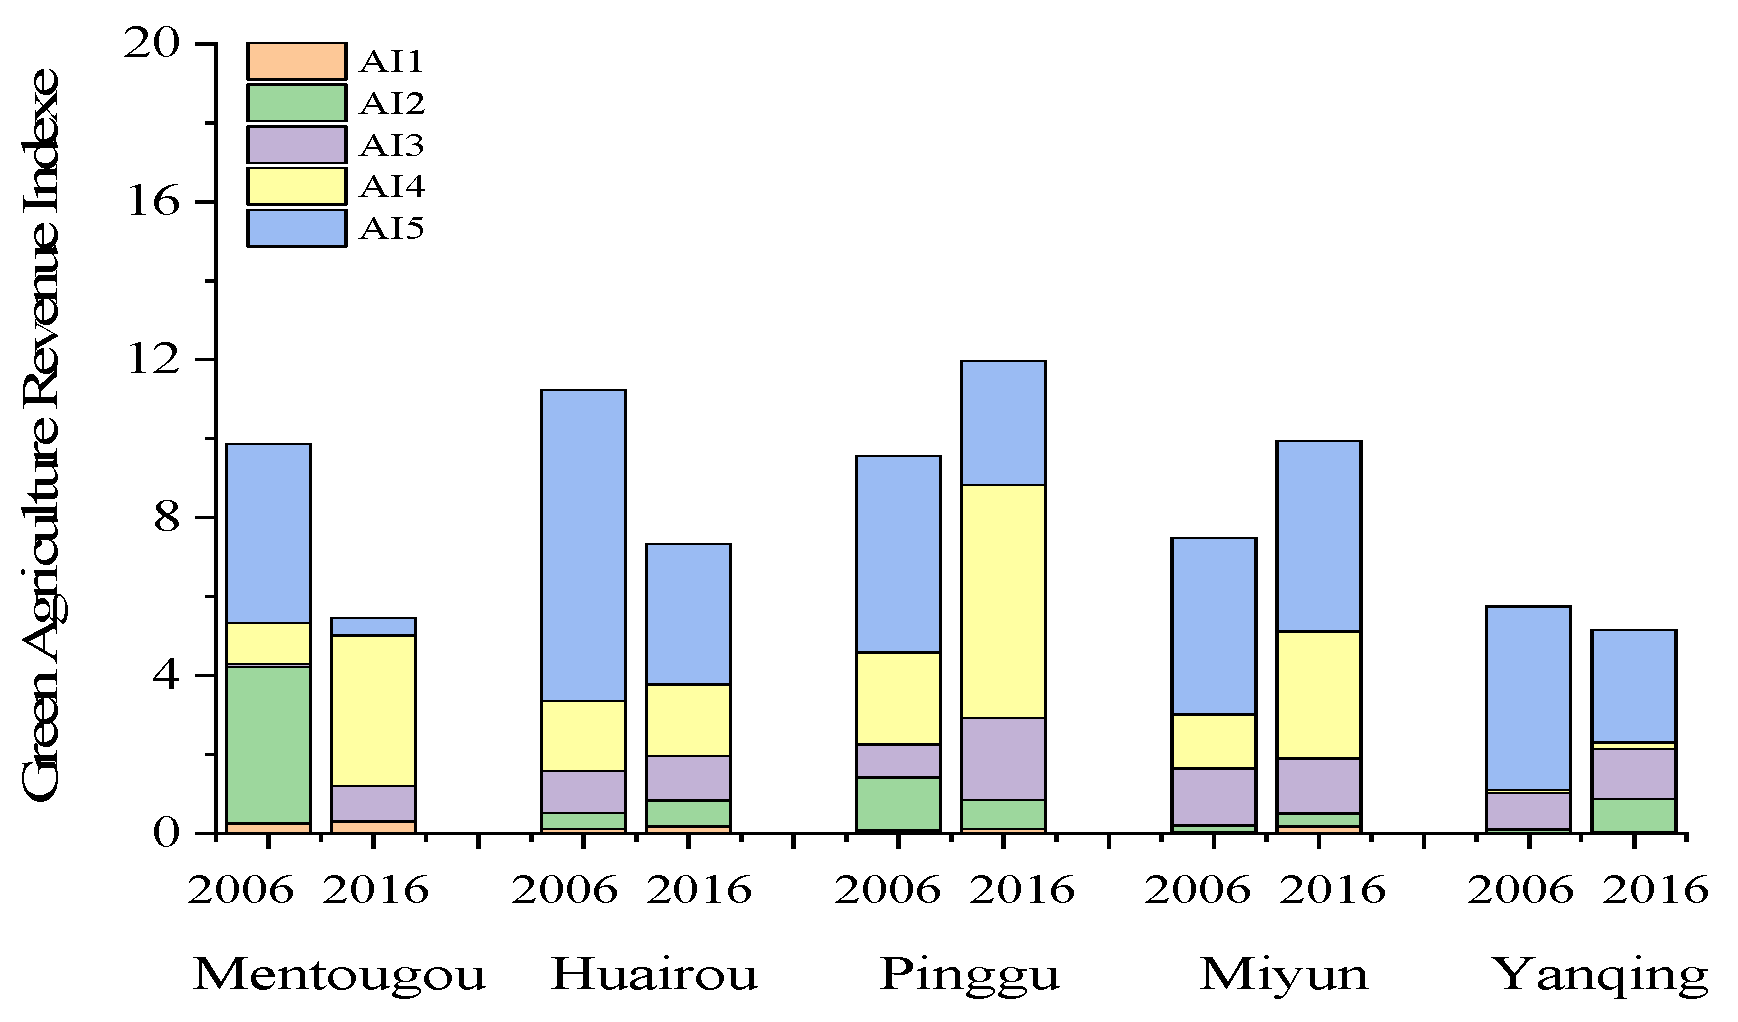
4.4. Green Agricultural Revenue

In 2016, the green agricultural revenue index of the ECDA was 7.97, mainly composed of agricultural production per unit of arable land area (AI4, 2.98) and the proportion of fixed asset investment in rural areas (AI5, 2.97). In 2016, the green agricultural revenue index of the ECDA was higher than that of the urban developing area (8.26) but lower than that of the function expansion area (4.76) (Figure 3). The green agricultural revenue indicators related to agritourism, seed industry, and labor productivity were relatively lower in the ECDA than the urban developing area, especially on the latter two indicators. With the improvement of agricultural infrastructure conditions, further improving agricultural production efficiency would be an important task to increase green agricultural revenue in the ECDA.
Considerable differences in the green agricultural revenue index and its components were observed among the five districts of the ECDA in 2016 (Figure 4). Among these five districts, high agricultural production efficiency (AI3 and AI4) contributed to the highest green agricultural revenue index (11.97) in Pinggu district. Miyun district has the second highest green agricultural revenue index (9.94), mainly due to the high proportion of fixed asset investment in rural areas (AI5, 4.84). The green agricultural revenue indexes of both Mentougou (5.46) and Yanqing (5.15) were comparably low, with different limiting factors.
In general, the green agricultural revenue index in the ECDA in 2016 was lower than in the urban developing area. In the ECDA, the green agricultural revenue index often varied by district, with different limiting factors from 2006 to 2016. Therefore, agricultural policies and measures should be adjusted according to the actual conditions in different districts of the ECDA to improve the green agricultural revenue.

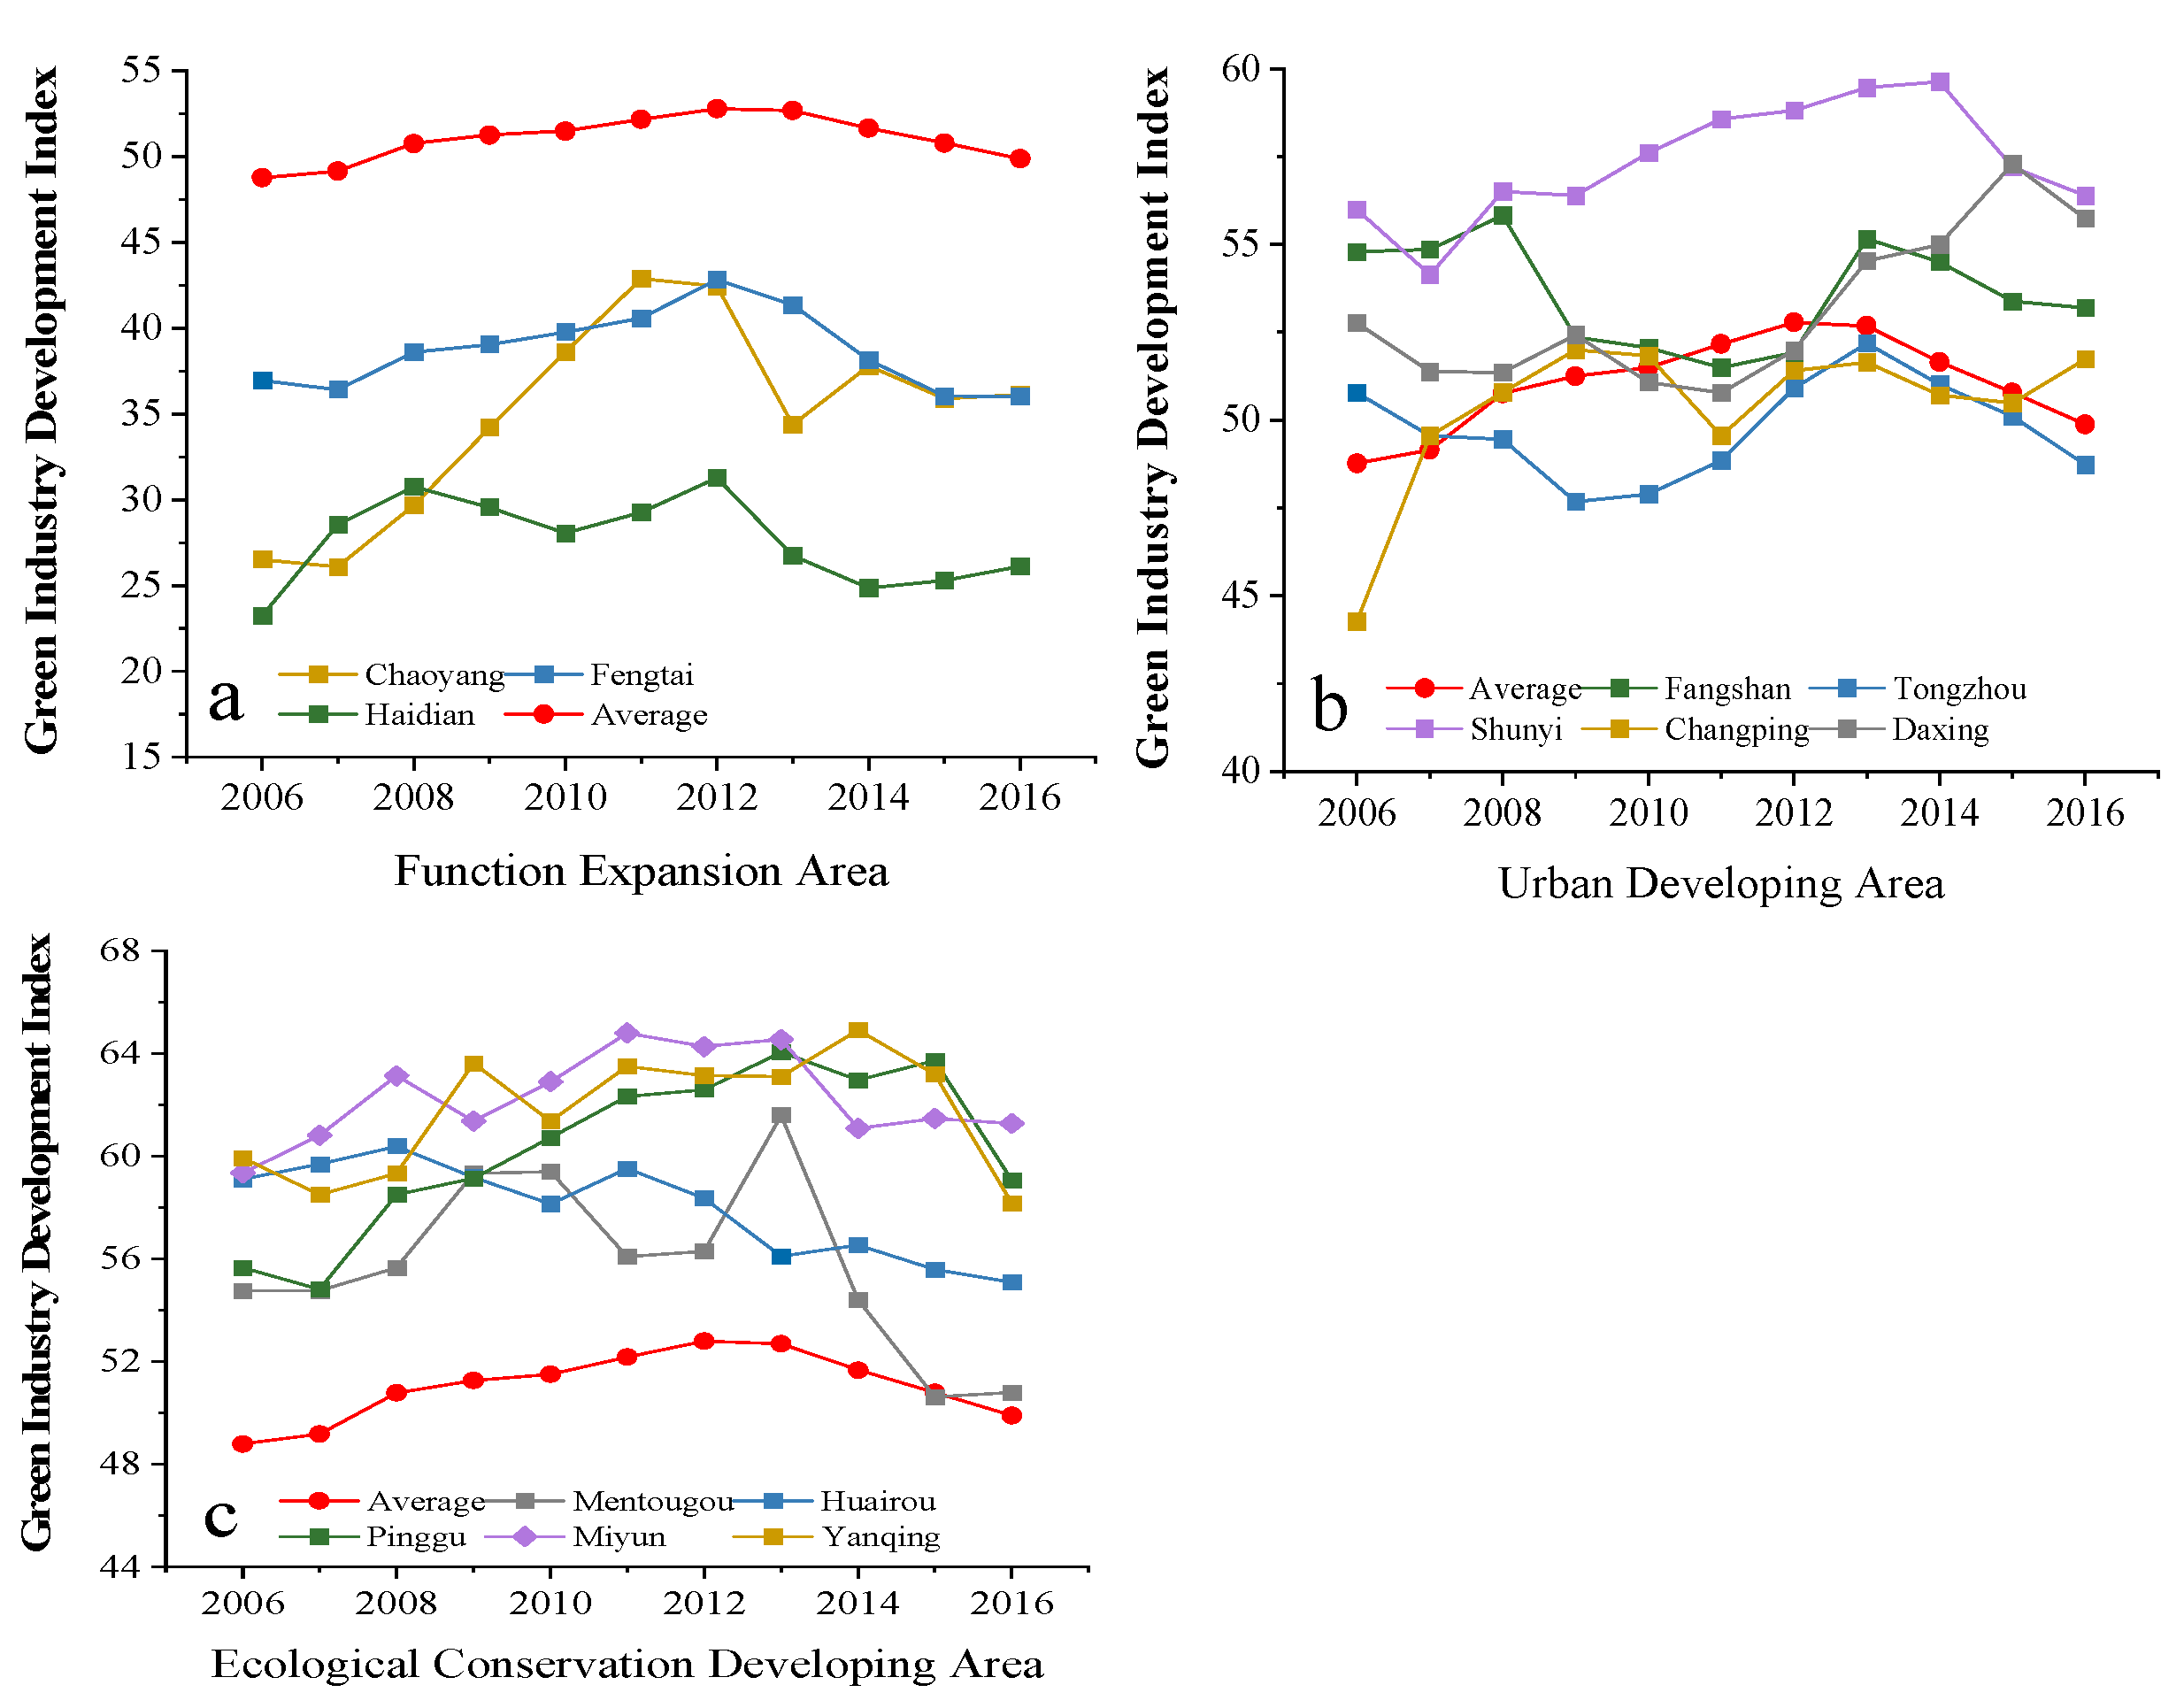
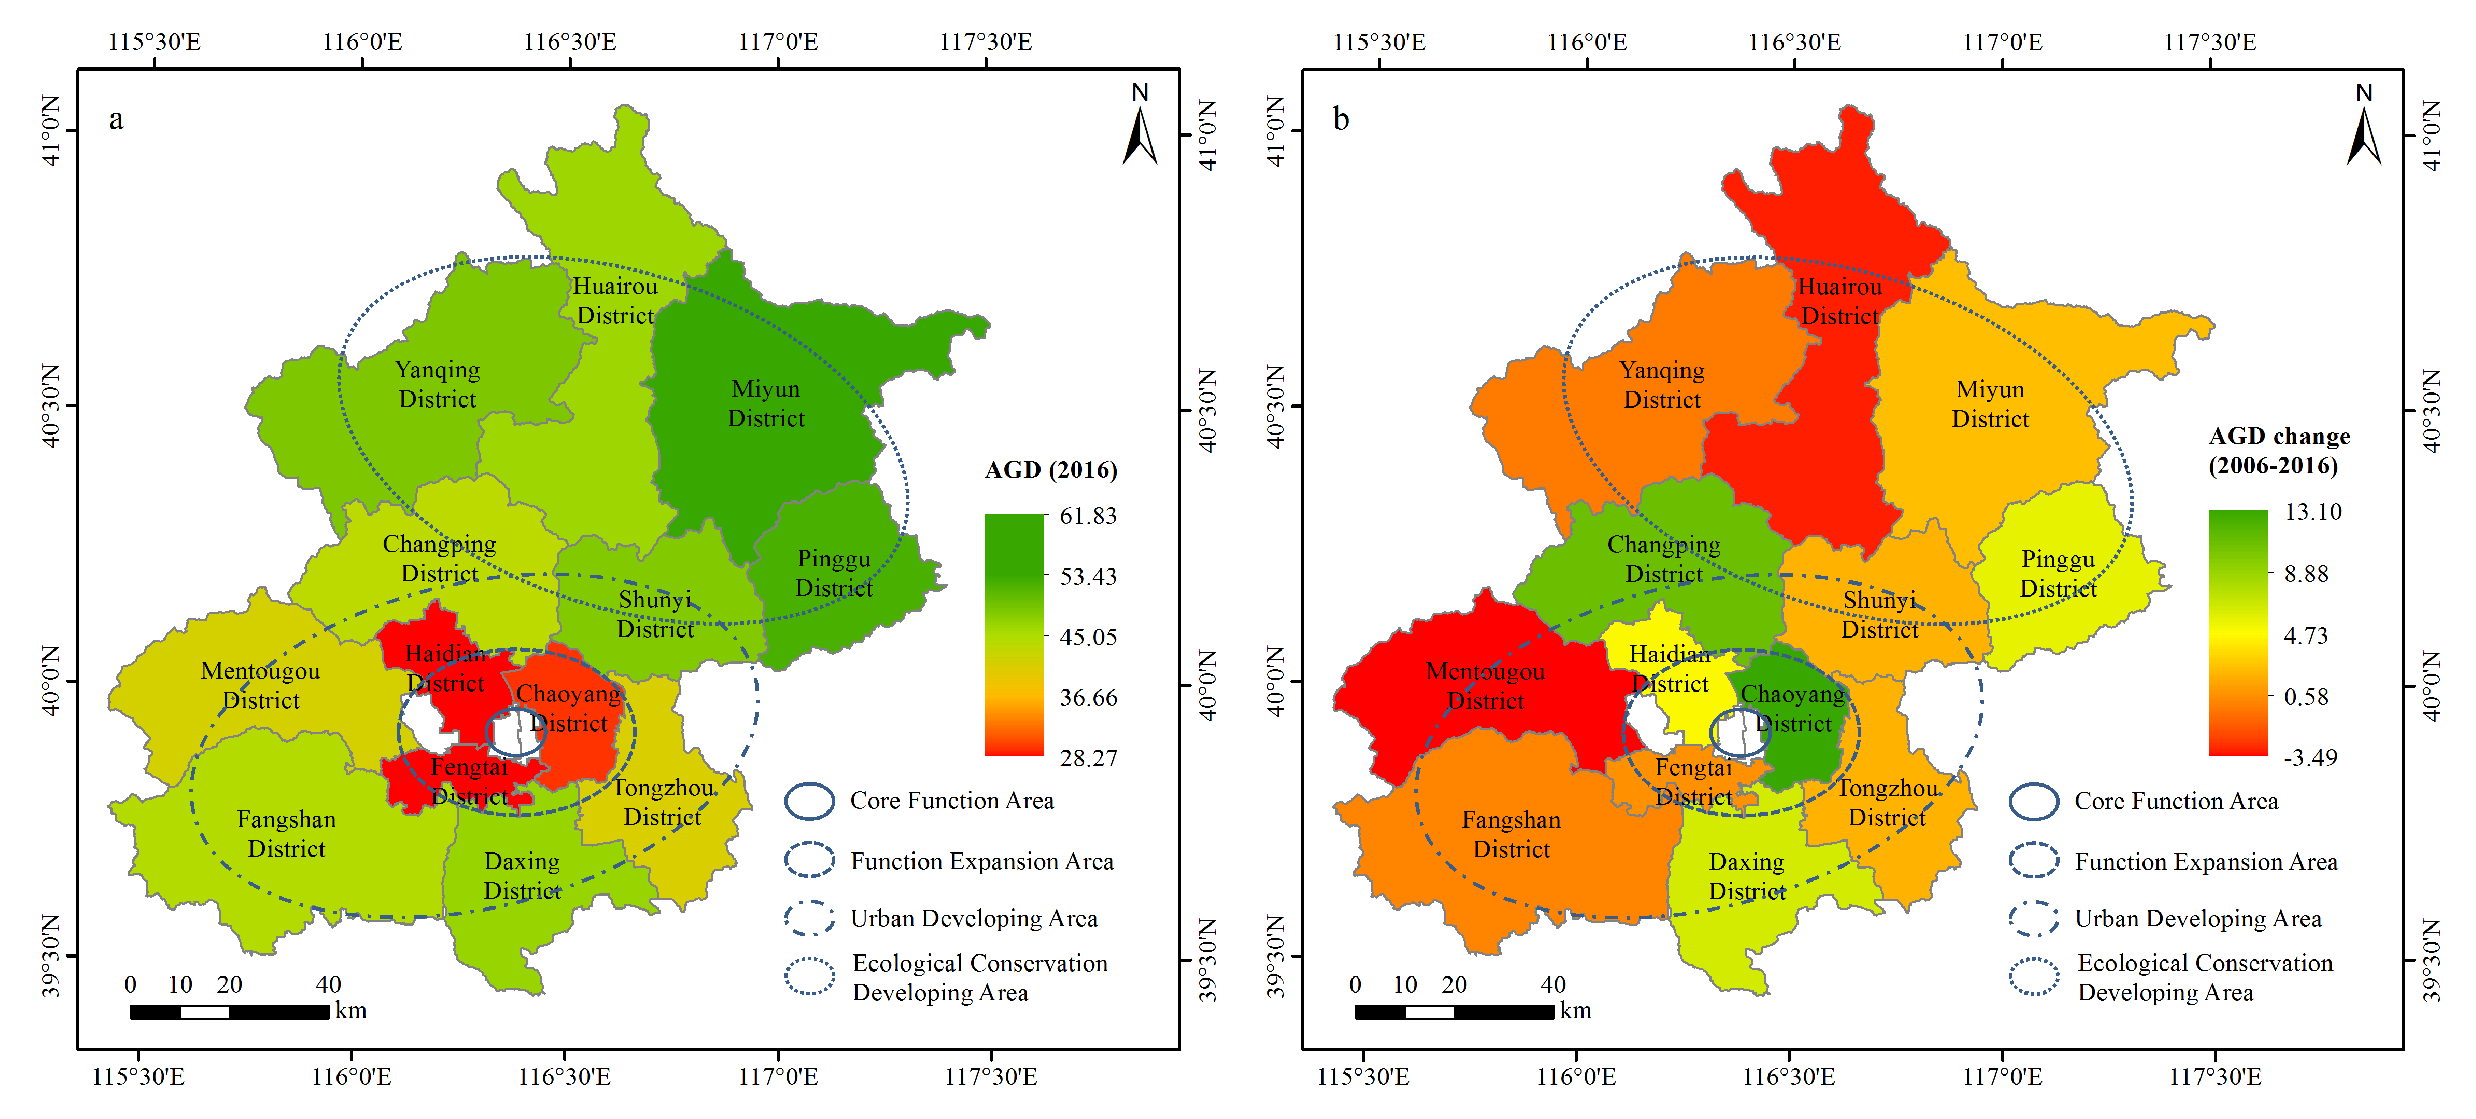
4.5. Temporal and Spatial Variations of AGD in Beijing’s ECDA

From 2006 to 2016, the AGD index of the district generally demonstrated an overall pattern of an increase followed by a decrease, with a peak from 2012–2013 (Figure 5). This was in line with the agricultural development policies in Beijing, such as the “Opinions on the development of water-saving and high-efficiency agriculture by adjusting structure and changing mode (Beijing No.16, 2014)” and “the first round of afforestation project of one million mu in Beijing plain area from 2012 to 2017”. All these policies resulted in a continuous reduction of arable land area (decreased from 283,000 ha in 2006 to 151,000 ha in 2016, Beijing Statistical Yearbook 2007–2017) and agricultural water consumption (decreased from 910 million m3 in 2012 to 610 million m3 in 2016, Beijing Statistical Yearbook 2013–2017). Figure 6b demonstrates the district differences in AGD index values from 2006 to 2016 in Beijing. In the EDCA, the AGD index demonstrated a differentiated tendency, with the highest accretion of 3.42 in Pinggu district and an obvious reduction in Yanqing, Huairou, and Mentougou districts (1.77, 4.00, and 3.97). All these results reflected that the year 2012 was a critical point in time, and the northern region had a spatial agglomeration of AGD.

4.6. Key Limiting Factors of AGD in ECDA

The AGD evaluation is to assess its green level and clarify the major limiting factors. Then, we could maximize the adjustment of the corresponding agricultural development mode and policy for accelerating AGD. Therefore, it is necessary to further “pathologically” diagnose AGD obstacles. Based on the calculated obstacle degree (Table 2), we further analyzed the top six indicators with obstacle degrees greater than 6%.
The proportion of facility agriculture area in arable land area (AP7) was the most important limiting indicator for AGD in Beijing’s ECDA, with a degree of limitation increasing from 8.34% in 2006 to 11.25% in 2016. The relatively backward infrastructure in the ECDA was the main reason. As infrastructure is the foundation of socio-economic development, regions with superior infrastructures are attractive to green industries and skilled personnel, which is also conducive to AGD. The ECDA had far worse infrastructure conditions than the function expansion area and the urban developing area because it was located in remote rural areas with limited socio-economic development.
Given the limited statistical data, the fixed asset investment in each district was used as a proxy for infrastructure conditions for comparative analysis. Although the proportion of fixed asset investment in rural areas was relatively high, the total amount of rural fixed asset investment in the ECDA was much lower than that in the urban developing area in 2016, indicating that the investment amount needs to be continuously increased (Figure S2).
The proportion of agritourism revenue in the gross agricultural output value (AI1) was the second major constraint to AGD, with an obstacle degree exceeding 8% from 2006 to 2016. Agritourism in the ECDA was weak in terms of boosting the regional economy and increasing farmers’ income (Table 1). Taking agritourism parks as an example, although the total income of tourism parks in the ECDA was significantly higher than that of the function expansion area and the urban developing area, its contribution rate (the proportion of the total agricultural output value) was comparatively low. In 2006, the density of agritourism parks, employees per park, visitors per park, and expenditure per capita were lower in the ECDA than in the other two areas (Figure S3). By 2016, the number of agritourism parks had increased significantly, in line with economic development and the growing ecological advantages in the ECDA. However, employees per park and expenditure per tourist of the ECDA were much lower. AGD in the ECDA was also limited by low labor productivity, possibly due to the lack of independent crop varieties, specialized and differentiated agricultural products, and agricultural green technology, as well as the inappropriate structure of agricultural industries. On the other hand, farmers in the ECDA had part-time jobs outside of their daily farming due to urbanization, with the wage income accounting for 75% of their total income (Beijing Statistical Yearbook 2017). The relatively few average years of education of workers in the ECDA (less than 8 years according to the sixth census data of Beijing) also limited their ability in acquiring high-end and new technologies.
The resource use efficiency factor had an obstacle degree of >6% over the ten years. Compared with 2006, resource use efficiency (AP4 and AP6) was generally lower for all districts in 2016 (Figures S4 and S5), which was comparatively higher in the ECDA. Low resource use efficiency limited their AGD to a certain extent. The above results suggest that resource-intensive agricultural industries with high energy consumption still play a dominant role in the ECDA, resulting in low resource production efficiency and land production efficiency (Figure S6).

5. Discussion

5.1. Effectiveness of the Selected AGD Indicators and Evaluation Method in Beijing

Based on the district panel data of Beijing from 2006 to 2016, an evaluation framework of 13 indicators was constructed for the evaluation of AGD in the ECDA, with the aim of revealing the development characteristics of green agriculture. These indicators can reflect the key objectives of AGD, which focuses on ensuring agricultural production to meet people’s diverse needs while protecting natural resources and the environment [5,14,15,20,21,22,23,24,73]. We have simplified the evaluation layers to green agricultural production and green agricultural revenue. In terms of resource (energy, fertilizer, and water) usage, both resource use efficiency (consumption per unit of gross agricultural output value) and resource use intensity (consumption per unit of sown area) were considered. BenJebli et al. [15] investigated the relationships between renewable energy and sustainable agriculture. Our evaluation indicator framework has fully taken into account the specificity of the ECDA’s eco-environmental protection, which is consistent with that of Xu et al. [40] and Tang et al. [44].
The agricultural characteristics of the metropolis were reflected in our framework, such as the proportion of agritourism revenue in gross agricultural output value (AI1). Previous studies in the Yellow River Basin [43], Tianjin [47], and the Yangtze River Delta area [46] also reported this indicator, indicating the prominent leading role of agritourism in economically developed areas. Meanwhile, the proportion of seed industry revenue in the gross agricultural output value (AI2) was included in our evaluation framework, which was closely related to the positioning of advanced and sophisticated development of the agricultural industry since 2014, when the “seed industry capital” was proposed in Beijing [45]. In fact, the AGD evaluation framework has often addressed multiple aspects (such as resource usage, environmental protection, economic benefits, social services, etc.), with different evaluation indicators selected according to the research purposes [13,18,22]. Laurett et al. [18] associated socio-demographic characteristics with the environmental aspect that tended to be most important among the family farmers interviewed, including gender, marital status, average age, type of farming, and average length of time spent in farming. Janker [17] identified different stakeholders’ interests for seven moral conflict scenarios in agriculture and the moral arguments behind them based on the idea of agricultural value chains. Wan et al. [84] combined the Gini coefficient to analyze the state of AGD in China. Ge et al. [85] explored the relationship between urbanization and AGD efficiency. These social factors were effective at larger scales and were less heterogeneous at smaller scales such as counties. To date, there are no social factors that are applicable at the district scale. The evaluation of social services is still at an evolving stage, with evaluation indicators and methodologies in need of improvement.
The key issue is how to make full use of the existing statistical data to construct an orderly and rigorous evaluation framework. Some scholars have adopted one-dimensional measurement indicators, such as total green factor productivity and agricultural carbon emission efficiency, which may have certain biases [14,16,38,54,55,56,57]. Our AGD evaluation indicators are the organic integration, refinement, and even sublimation of the original statistical data, rather than a simple copy or pile-up of the traditional indicators in economic, environmental, social, and other fields. The important role of selected indicators in AGD can be objectively reflected by using the projection pursuit model to determine the weight of indicators in assessing AGD at the district level. In this study, we could find that increasing the agricultural energy use efficiency of fertilizer and water is crucial to realize the development of local green agriculture in the ECDA on the analysis of the green agriculture production indicators. Our evaluation framework and model can also provide a reference for the evaluation of AGD at the district (county) scale in other large cities in China, such as Shanghai and Guangzhou.

5.2. Heterogeneous Spatial and Temporal Characteristics of AGD in ECDA

For the sake of authority, long-term comparability, and systematic collection of the existing statistical system and data, our evaluation indicator framework of AGD for the Beijing ECDA was constructed at the district (county) level. This made it relatively easy to make cross-time and cross-space comparisons of AGD. The apparent spatial differentiation characteristic of the AGD level among 13 districts in Beijing demonstrated an increasing trend from the core to the periphery: ECDA > urban developing area > function expansion area. This finding is somewhat at variance with Saghaian et al. [58], whose results showed that developed countries have reduced environmental pollution, such as N2O emissions, based on the panel data from 23 developed countries and 43 developing countries. This may be related to the difference in the scale of the study, with district scale in the current study and national scale in their study. Meanwhile, differences were also found in the evaluation indicators, which in the current study were relevant to green production and green output, while in their study they were relevant to agricultural exports. The spatial distribution of AGD indicated the absolute differences between the different areas and districts. These variations can be partly attributed to the heterogeneous environmental resources and socio-economic conditions for AGD across districts. The results of Guo and Huang [45] suggested that the level of green agricultural development in Beijing has increased by 304.3% from 2005 to 2018. Zhou and Wen [22] also proved that the level of green agriculture development in China has been increasing since 2003, although with different evaluating scales, indicators, and methods from the current study. This is the result of the great attention paid by the central and regional governments, together with the continuously applied measurements, which have strengthened the depth of AGD.
AGD in Beijing also showed temporal differentiation characteristics: a continuous increase from 2006 to 2013 and a general decrease from 2014 to 2016 for all districts (except Changping and Miyun districts). Zhou and Wen [22] showed a fluctuating downward trend characterized by periods of increase followed by decrease for China from 2003 to 2022. Gai et al. [53] found that AGD had three stages in the major grain-producing areas of northeast China. The above results indicated that AGD had distinct stages, despite the differences in research scales, evaluation indicators, methodologies, and regions. It is evident that interregional differences and the density of exceptional variations play a significant role in shaping the discrepancies in AGD [16]. The long-term AGD evaluation of the ECDA could provide an opportunity for further analysis of its temporal and spatial patterns and locate the possible spatial aggregation effect of AGD at certain critical points in time. As a result, our study fully reflected the comprehensive regional disparities, spatial differentiation, and evolutionary characteristics of AGD in the Beijing ECDA, which will provide researchers with a systematic study and analysis of the regional disparities, spatial dynamics, and state transitions. It is necessary to further explore the main driving factors that lead to this temporal change in AGD.

5.3. Factors Influencing AGD Level

Measuring and analyzing the degree of AGD helps to monitor and evaluate the environmental impact of agricultural activities while ensuring the sustainability of agricultural systems. In our study, the regional limiting factors of AGD, analyzed by the obstacle degree model, could be neglected in larger-scale evaluations, which often cover spatial differences and individual problems. Based on a literature review, the factors influencing AGD can be categorized into economic, political, technological, and other factors [22,86]. The main limiting factor influencing the AGD level in Beijing ECDA was AP7, with the exception of 2009 (Table 2). This was different from the conclusion of Xu et al. [40], who believed that fixed asset investment should be strengthened in the ECDA. Given the limited statistical data, the fixed asset investment of each district was used as a representative of infrastructure conditions to conduct a comparative analysis. Although the proportion of fixed asset investment in rural areas was relatively high, the total amount of rural fixed asset investment in the ECDA in 2016 was much lower than that in the urban developing area, indicating that the amount of investment should be continuously increased (Figure S2). The level of regional economic development could have a significant impact on investment in agricultural fixed assets. The smaller the gap between the levels of economic development, the more favorable it is to increase the total green factors in agriculture [33,34]. The impact of regional finance on agricultural green total factor productivity in China has also proved that agricultural investment flows are needed in the agricultural sector [86,87]. Rani et al. [88] and Lei et al. [89] stated that the misallocation of agricultural capital affects the efficiency of agricultural green production as well.
Second, the industrial structure affected the AGD level in the ECDA in this study, which is similar to that of Lei et al. [89], who concluded that land misallocation negatively affect the efficiency of agricultural green production. Hong et al. [90] also suggested that optimizing the structure of agricultural industry could bring a significant “structural growth effect”. Hadi et al. [91] found that optimizing the structure of the coffee industry in Indonesia reduced CO2 emissions. For a large city with little agriculture (the ratio of gross agricultural output value to GDP was less than 1% in 2017) and large suburbs with small urban areas such as Beijing, optimizing the structure of the agricultural industry is particularly important to improve AGD and increase the supply of ecological products for the city and its residents. As a new form of convergence industry, agritourism has become the most important measure to achieve multi-functional agriculture, which rationalized the great efforts of the Beijing Municipal Government to promote the development of agritourism in the suburbs (Beijing “ten-hundred-million-thousand” agritourism action implementation opinions).
Labor productivity, as one of the three main factors in the agricultural industry, plays a crucial role in influencing agricultural development. Agricultural labor productivity generally refers to the agricultural output produced by a unit of agricultural labor input. The rational allocation and effective utilization of these factors are crucial for AGD improvement. Agricultural labor productivity improvement can be ensured through two main channels: the continuous improvement of land productivity and the continuous expansion of the scale of agricultural land operation [19,72,92]. Due to the impact of urbanization, the labor force in Beijing’s ECDA has been decreasing, which has made labor productivity the key factor affecting the green production of agriculture. This has been confirmed by many scholars from different perspectives [89,93]. Balezentis et al. [72] reported that the changes in land productivity were the main source of agricultural labor productivity in China. Liu et al. [92] found that a labor force with a high education level significantly promoted AGD efficiency in the eastern region. Kansanga et al. [19] examined the impact of agricultural modernization on smallholder farming in Ghana. With the increasing development of green agriculture, the ECDA still has resource- and labor-intensive industries with low industrial convergence and a short industrial chain, with few high-tech and advanced industries. Agriculture in the ECDA was often weak in terms of market competitiveness and resilience to external risks, which limited labor productivity. Meanwhile, high production costs (including land, labor, seeds, fertilizer, irrigation, and other inputs) made it more difficult to improve agricultural labor productivity [23,51,65,70,89].
Resource use efficiency (including water, soil, and energy use efficiency and intensity) also constrains AGD in the ECDA of Beijing in this study. Similar conclusions have been drawn from different perspectives in previous studies [92,94,95]. Bare [16] stated that land and water use, which can have large spatial and long temporal impacts, are important for sustainability assessment. Ahmed et al. [14] discussed the relationship between air pollution and total agricultural green factor productivity in the United States. Du et al. [95] found the carbon emission reduction effect of agricultural policies in China. The essence of agricultural green development lies in its emphasis on minimizing the depletion of natural resources and mitigating the adverse environmental impacts as much as possible during the agricultural production process [22,23,31,32,33,34,35,36]. Improving the use efficiency of agricultural resources plays an important role in the green development of ECDA and even the whole city of Beijing [39,40].

5.4. Measurements to Accelerate AGD Level

Establishing evaluation indicators is an important way to quantitatively assess the level of AGD [13,22,89,92], while constructing an evaluation framework is a prerequisite for exploring ways and designing institutions to promote AGD. Fang et al. [87] proposed the implementation of ecological engineering measures such as vegetation restoration, soil improvement, and soil and water conservation to restore the ecological functions of farmland, improve the quality of arable land resources, and enhance the ecological environment. Zou et al. [94] emphasized the promotion of the resource utilization of agricultural wastes, such as utilizing crop straw and livestock manure for the production of biomass energy to reduce the discharge of agricultural wastes. Gao et al. [96] and Hou et al. [97] suggested that strengthening digital inclusive finance would improve agricultural green total factor productivity. On the other hand, there is optimizing industrial structure for AGD development [92,94]. Hong et al. [90] stated that both digital inclusive finance and agriculture industrial structure optimization promoted total agricultural green factor productivity. Nardia et al. [98] applied some basic sustainability criteria that could internalize environmental externalities, which would lead to a radical redistribution of first pillar Common Agricultural Policy payments in Poland. In view of green fertilizer technology, the impact of knowledge transfer on farmers’ decisions accelerated sustainable agricultural practices [98]. Therefore, local authorities and decision makers should focus on promoting comprehensive improvements in the level of green agricultural development. This study presents a list of relevant policy recommendations to promote AGD in ECDAs (Table S1).

6. Conclusions

In this study, a comprehensive analysis of the level of AGD, spatial and temporal heterogeneity, dynamic evolution, and obstacle factors in Beijing’s ECDA was conducted by constructing an evaluation framework based on the district scale. However, the current study still has limitations. For example, the indicators of agricultural film and pesticide use intensity were excluded due to the unavailability of data. This led to an underestimation of green agricultural production and thus influenced the results to some extent. In this study, the data published in the official statistical yearbook for the AGD evaluation were used for reasons of authority, long-term comparability, and systematic data collection. Therefore, this study can provide a reference for district (county) AGD evaluation in other large cities in China, such as Shanghai and Guangzhou, and also encourage systematic research and analysis on the regional disparities, spatial dynamics, and state transitions of small-scale AGD. Accordingly, the evaluation results provide insights for promoting policy coordination and cooperation among regions, leading to synergistic effects in overall AGD according to local development characteristics.

Supplementary Materials

The following supporting information can be downloaded at: https://www.mdpi.com/article/10.3390/su16010219/s1, Figure S1: Map of 13 studied districts of Beijing; Figure S2: Investment in rural fixed assets and proportion of fixed asset investment in rural areas of 13 districts in 2006 and 2016; Figure S3: Agritourism status at the district level in Beijing in 2006 and 2016: agricultural tourism park revenue (a), employees per park (b), expenditure per visitor (c), and visitors per park (d); Figure S4: Water consumption per unit of agricultural output value of 13 districts in Beijing in 2006 and 2016 (m3/10004 yuan, price of the indicated year); Figure S5: Fertilizer consumption per unit of agricultural output value of 13 districts in Beijing in 2006 and 2016 (ton/1000 yuan, price of the indicated year); Figure S6: Agricultural labor productivity of 13 districts in Beijing in 2006 and 2016 (1000 yuan per capita); Table S1: List of possible policies to promote AGD in ECDA.

Author Contributions

Conceptualization, H.L. and F.L.; methodology, X.X. and FL; software, W.Z. and N.S.; validation, H.L., F.L. and Y.S.; formal analysis, X.X.; investigation, X.X. and Y.S.; resources, X.X. and H.L.; data curation, X.X.; writing—original draft preparation, H.L., F.L. and N.S.; writing—review and editing, H.L.; visualization, N.S. and W.Z. All authors have read and agreed to the published version of the manuscript.

Funding

This work was funded by the Science and Technology Capacity Improvement Project of Beijing Academy of Agricultural and Forestry Sciences (ZHS202306); Beijing Innovation Consortium of Agriculture Research System (BAIC09-2023); the Natural Science Foundation of Beijing (8232028); Beijing Science and Technology Project of Beijing Municipal & Technology Commission (Z191100004019001); Beijing Bureau of Statistics research project on the third National Agricultural Census (2017012).

Data Availability Statement

Data will be available on request.

Conflicts of Interest

No conflicts of interest exist in the submission of this manuscript, and the manuscript is approved by all authors for publication.

References

  1. Gibbs, D.; Longhurst, J. Sustainable development and environmental technology: A comparison of policy in Japan and the European Union. Environmentalist 1995, 15, 196–201. [Google Scholar] [CrossRef]
  2. Su, Y.; Chen, X.; Liao, J.; Zhang, H.; Wang, C.; Ye, Y.; Wang, Y. Modeling the optimal ecological security pattern for guiding the urban constructed land expansions. Urban For. Urban Green. 2016, 19, 35–46. [Google Scholar] [CrossRef]
  3. Xie, H.; Yao, G.; Liu, G. Spatial evaluation of the ecological importance based on GIS for environmental management: A case study in Xingguo county of China. Ecol. Indic. 2015, 51, 3–12. [Google Scholar] [CrossRef]
  4. Sun, X.; Lu, Z.; Li, F.; Crittenden, J.C. Analyzing spatio-temporal changes and trade-offs to support the supply of multiple ecosystem services in Beijing, China. Ecol. Indic. 2018, 94, 117–129. [Google Scholar] [CrossRef]
  5. Holden, E.; Linnerud, K.; Banister, D. The imperatives of sustainable development. Sustain. Dev. 2017, 25, 213–226. [Google Scholar] [CrossRef]
  6. United Nations Environment Program (UNEP). Guidelines for AEO Cities Integrated Environmental Assessment and Report. 2005. Available online: https://www.unep.org/explore-topics/environment-under-review/what-we-do/environmental-assessment/guidelines-conducting (accessed on 12 December 2023).
  7. United Nations Environment Program (UNEP). Green Economy: Cities Investing in Energy and Resource Efficiency. 2011. Available online: https://wedocs.unep.org/handle/20.500.11822/7979 (accessed on 12 December 2023).
  8. Wang, X.; Song, C.; Cheng, C.; Ye, S.; Shen, S. Cross-national perspectives on using sustainable development goals (SDGs) indicators for monitoring sustainable development: A database and analysis. Chin. Geogr. Sci. 2021, 31, 600–610. [Google Scholar] [CrossRef]
  9. United Nations. Goal 2: End Hunger, Achieve Food Security and Improved Nutrition and Promote Sustainable Agriculture; Metadata Repository; United Nations: New York, NY, USA, 2016. [Google Scholar]
  10. Bolcárová, P.; Kološta, S. Assessment of sustainable development in EU 27 using aggregated SD index. Ecol. Indic. 2015, 48, 699–705. [Google Scholar] [CrossRef]
  11. Cracolici, M.F.; Cuffaro, M.; Lacagnina, V. Assessment of sustainable well-being in the Italian regions: An activity analysis model. Ecol. Econ. 2018, 143, 105–110. [Google Scholar] [CrossRef]
  12. James, H.S. Sustainable agriculture and free market economics: Finding common ground in Adam Smith. Agric. Hum. Values 2006, 23, 427–438. [Google Scholar] [CrossRef]
  13. Pham, L.V.; Smith, C. Drivers of agricultural sustainability in developing countries: A review. Environ. Syst. Decis. 2014, 34, 326–341. [Google Scholar] [CrossRef]
  14. Ahmed, N.; Hamid, Z.; Mahboob, F.; Rehman, K.U.; Ali, M.S.E.; Senkus, P.; Wysokinska-Senkus, A.; Sieminski, P.; Skrzypek, A. Causal linkage among agricultural insurance, air pollution, and agricultural green total factor productivity in United States: Pairwise granger causality approach. Agriculture 2022, 12, 1320. [Google Scholar] [CrossRef]
  15. BenJebli, M.; BenYoussef, S. Renewable energy consumption and agriculture: Evidence for cointegration and granger causality for tunisian economy. Int. J. Sustain. Dev. World Ecol. 2017, 24, 149–158. [Google Scholar] [CrossRef]
  16. Bare, J.C. Development of impact assessment methodologies for environmental sustainability. Clean Technol. Environ. Policy 2014, 16, 681–690. [Google Scholar] [CrossRef]
  17. Janker, J. Moral conflicts, premises and the social dimension of agricultural sustainability. Agric. Hum. Values 2020, 37, 97–111. [Google Scholar] [CrossRef]
  18. Laurett, R.; Paco, A.; Mainardes, E.W. Sustainable Development in Agriculture and its Antecedents, Barriers and Consequences-An Exploratory Study. Sustain. Prod. Consum. 2021, 27, 298–311. [Google Scholar] [CrossRef]
  19. Kansanga, M.; Andersen, P.; Kpienbaareh, D.; Mason-Renton, S.; Atuoye, K.; Sano, Y.; Antabe, R.; Luginaah, I. Traditional agriculture in transition: Examining the impacts of agricultural modernization on smallholder farming in Ghana under the new Green Revolution. Int. J. Sustain. Dev. World Ecol. 2019, 26, 11–24. [Google Scholar] [CrossRef]
  20. Horlings, L.G.; Marsden, T.K. Towards the real green revolution? Exploring the conceptual dimensions of a new ecological modernisation of agriculture that could ‘feed the world’. Glob. Environ. Chang. 2011, 21, 441–452. [Google Scholar] [CrossRef]
  21. Koohafkan, P.; Altieri, M.A.; Eric, H.G. Green agriculture: Foundations for biodiverse, resilient and productive agricultural systems. Int. J. Agric. Sustain. 2012, 10, 61–75. [Google Scholar] [CrossRef]
  22. Zhou, F.; Wen, C. Research on the level of agricultural green development, regional disparities, and dynamic distribution evolution in China from the perspective of sustainable development. Agriculture 2023, 13, 1441. [Google Scholar] [CrossRef]
  23. Liu, Y.; Sun, D.; Wang, H.; Wang, X.; Yu, G.; Zhao, X. An evaluation of China’s agricultural green production: 1978–2017. J. Clean. Prod. 2020, 243, 118483. [Google Scholar] [CrossRef]
  24. Zhou, S.; Zhang, N.; Zhang, X. Metro construction risk assessment based on PPC-D-S evidence theory. Mod. Tunn. Technol. 2021, 58, 75–83. [Google Scholar]
  25. Ma, L.; Bai, Z.; Ma, W.; Guo, M.; Jiang, R.; Liu, J.; Oenema, O.; Velthof, G.L.; Whitmore, A.P.; Crawford, J.; et al. Exploring future food provision scenarios for China. Environ. Sci. Technol. 2019, 53, 1385–1393. [Google Scholar] [CrossRef] [PubMed]
  26. The Ministry of Agriculture and Rural Affairs (MARA). National Plan for Green Agricultural Development during the 14th Five-Year. 2021. Available online: http://www.gov.cn/zhengce/zhengceku/2021-09/07/5635867/files/737ff96c0cc74f788394eb6194cc44c6.pdf (accessed on 8 May 2023).
  27. Yu, X. Promoting Agriculture Green Development to realize the great rejuvenation of the Chinese nation. Front. Agric. Sci. Eng. 2020, 7, 112–113. [Google Scholar]
  28. Zhou, X.; Li, X. Analysis of spatial heterogeneity of green agricultural production level: Based on empirical data of Shandong province from 2010 to 2019. Rev. Econ. Manag. 2021, 37, 152–164. [Google Scholar]
  29. Wang, X.; Lv, J. The comprehensive evaluation of agricultural green development level and analysis of its obstacle factors in Gansu Province. Terri. Nat. Resour. Stud. 2022, 22, 69–73. [Google Scholar]
  30. Li, X.; Li, J. Evaluation of agricultural green development level in Henan Province based on close value method. Shanxi Agric. Econ. 2022, 14, 22–24. [Google Scholar]
  31. Zhang, W.; Duan, L. Identification of driving factors and performance evaluation of Zhejiang agricultural green development. Chin. J. Agric. Resour. Region. Plan. 2022, 43, 24–33. [Google Scholar]
  32. Kuang, A.; Yue, Y.; Cao, S. Comprehensive evaluation of green agricultural development level in Guangxi. J. Guangxi Agric. 2022, 37, 37–43. [Google Scholar]
  33. Li, F.; Zhou, X.; Zhou, Y. Evaluation and regional difference analysis of agricultural green development level in Bohai Rim Region. J. Agric. Resour. Region. Plan. 2023, 44, 118–129. [Google Scholar]
  34. Zha, J.; Zhou, X.; Zhou, Y. Evaluation of agricultural green development level in the Yellow river. Chin. J. Agric. Resour. Region. Plan. 2022, 1, 18–28. [Google Scholar]
  35. Zhou, J. Evaluation, regional difference analysis and optimization path of agricultural green development in Yangtze River Economic Belt. Rural Econ. 2021, 12, 99–108. [Google Scholar]
  36. Liu, J.; Liu, X. Study on measurement and enhancement path of the level of the agricultural green development: An empirical example from 11 Cities in the Pearl River-West River economic belt. Ecol. Econ. 2022, 38, 100–107. [Google Scholar]
  37. Nandy, S.; Singh, C.; Das, K.K.; Kingma, N.C.; Kushwaha, S.P.S. Environmental vulnerability assessment of eco-development zone of Great Himalayan National Park, Himachal Pradesh, India. Ecol. Indic. 2015, 57, 182–195. [Google Scholar] [CrossRef]
  38. Gargano, G.; Licciardo, F.; Verrascina, M.; Zanetti, B. The agroecological approach as a model for multifunctional agriculture and farming towards the European Green Deal 2030-some evidence from the Italian experience. Sustainability 2021, 13, 2215. [Google Scholar] [CrossRef]
  39. Yang, Z.C.; Zhou, L.D.; Sun, D.F.; Li, H.; Yu, M. Proposal for developing carbon sequestration economy in ecological conservation area of Beijing. Adv. Mater. Res. 2012, 524, 3424–3427. [Google Scholar] [CrossRef]
  40. Xu, J.; Wang, J.; Xiong, N.; Chen, Y.; Sun, L.; Wang, Y.; An, L. Analysis of ecological blockage pattern in Beijing important ecological function area, China. Remote Sens. 2022, 14, 1151. [Google Scholar] [CrossRef]
  41. Jogo, W.; Hassan, R. Balancing the use of wetlands for economic well-being and ecological security: The case of the Limpopo wetland in southern Africa. Ecol. Econ. 2010, 69, 1569–1579. [Google Scholar] [CrossRef]
  42. Liu, C.L.; Chen, M.X.; Tang, Z.P.; Liu, W.; Lu, D.; Zhang, Y. The “valley economy” model of regional development: A case study of mountain areas in Beijing, Northern China. J. Mt. Sci. 2014, 11, 1372–1382. [Google Scholar] [CrossRef]
  43. Zhang, Y. Evaluation and spatial difference of agricultural green development level in the Yellow River basin based on entropy weight-TOPSIS. Hubei Agric. Sci. 2022, 61, 230–236. [Google Scholar]
  44. Tang, C.; Wu, X.; Zheng, Q.; Ning, L. Ecological security evaluations of the tourism industry in ecological conservation development areas: A case study of Beijing’s ECDA. J. Clean. Prod. 2018, 197, 999–1010. [Google Scholar] [CrossRef]
  45. Guo, J.; Huang, Y. Construction and empirical analysis of evaluation indicator system of agricultural green development in Beijing-Tianjin-Hebei region. Agric. Outlook 2022, 18, 50–56. [Google Scholar]
  46. Song, Y.; Yang, P.; Zheng, S. Evaluation of green development level of agriculture in Yangtze River Delta. J. Anhui Univ. Sci. Tech. 2022, 24, 11–17. [Google Scholar]
  47. Dou, Y.; Zhao, G.; Jiang, Y. Comprehensive evaluation of the green development level of agriculture in Tianjin. J. Chin. Agric. Mech. 2021, 42, 159–165. [Google Scholar]
  48. Li, Y.; Zhang, J.; Cui, S.; Ma, L.; Ma, W.; Wei, J. Temporal and spatial characteristics of agricultural green development indicators in counties of Hebei Province. Chin. J. Eco-Agric. 2020, 28, 1168–1180. [Google Scholar]
  49. Song, C.; Zhang, J.; Liu, L.; Ma, W.; Ma, L.; Ding, S.; Zhao, H. Spatial and temporal characteristics of agricultural green development indicators in Hainan Island. Chin. J. Eco-Agri. 2020, 28, 1156–1167. [Google Scholar]
  50. Yin, C.; Li, F.; Wang, S.; Hao, A. The concept, connotation and principle of agricultural green development in China. Chin. J. Agri. Resour. Reg. Plan. 2021, 1, 1–6. [Google Scholar]
  51. Zhang, Y.; Liu, L. The influence of the Sci-Tech finance ecosystem on technological innovation from symbiotic perspective. Syst. Eng. 2021, 39, 25–36. [Google Scholar]
  52. Zhang, Y.; Mu, L.; Zhao, Y. Research on evaluation and countermeasures of regional green industry development. Ecol. Econ. 2017, 33, 41–44. [Google Scholar]
  53. Gai, M.; Yang, Q.; He, Y. Spatiotemporal changes and influencing factors of agricultural green development level in main grain producing areas in Northeast China. Resour. Sci. 2022, 44, 927–942. [Google Scholar] [CrossRef]
  54. Li, J.; Huang, X.; Yang, T.; Su, M.; Guo, L. Reducing the carbon emission from agricultural production in China: Do land transfer and urbanization matter? Environ. Sci. Pollut. Res. 2023, 30, 68339–68355. [Google Scholar] [CrossRef]
  55. Li, S.; Wang, Z. The effects of agricultural technology progress on agricultural carbon emission and carbon sink in China. Agriculture 2023, 13, 793. [Google Scholar] [CrossRef]
  56. Shi, H.; Chang, M. How does agricultural industrial structure upgrading affect agricultural carbon emissions? Threshold effects analysis for China. Environ. Sci. Pollut. Res. 2023, 30, 52943–52957. [Google Scholar] [CrossRef] [PubMed]
  57. Wang, R.; Zhang, Y.; Zou, C. How does agricultural specialization affect carbon emissions in China? J. Clean. Prod. 2022, 370, 133463. [Google Scholar] [CrossRef]
  58. Saghaian, S.; Mohammadi, H.; Mohammadi, M. The effects of agricultural product exports on environmental quality. Sustainability 2022, 14, 13857. [Google Scholar] [CrossRef]
  59. Weinzettel, J.; Wood, R. Environmental footprints of agriculture embodied in international trade: Sensitivity of Harvested area footprint of Chinese exports. Ecol. Econ. 2018, 145, 323–330. [Google Scholar] [CrossRef]
  60. Xiong, Y.; Liu, Q.; Hu, X. Evaluation of agricultural green development in main grain producing counties of Sichuan Province. Agric. Outlook 2022, 18, 46–52. [Google Scholar]
  61. Hou, X.; Li, H.; Wang, Y.; Feng, G.; Liu, Y.; Li, X.; Gao, Q. Time variation characteristics of county agricultural green development index in Jilin Province-take Lishu County as an example. Chin. J. Eco-Agric. 2022, 31, 807–819. [Google Scholar]
  62. Shen, S.; Wang, L. Study on agricultural green development efficiency and influencing factors based on unexpected output model-taking 11 cities in Hebei Province as an example. Innov. Sci. Tech. 2021, 21, 80–88. [Google Scholar]
  63. Yang, J. Construction and empirical research on county agricultural green development index—Based on county cross-sectional data of Hubei Province in 2017. Jiangsu Agric. Sci. 2021, 49, 24–30. [Google Scholar]
  64. Duan, C.; Yu, C.; Li, S.; Zhong, Z.; He, Y. A comprehensive assessment of agricultural green development at the county level on the Tibetan plateau-a case study in Bailang County. Chin. J. Agric. Resour. Reg. Plan. 2023, 44, 82–90. [Google Scholar]
  65. Quiroga, S.; Suárez, C.; Fernández-Haddad, Z.; Philippidis, G. Levelling the playing field for European Union agriculture: Does the common agricultural policy impact homogeneously on farm productivity and efficiency? Land Use Policy 2017, 68, 179–188. [Google Scholar] [CrossRef]
  66. Neogi, D. Performance appraisal of select nations in mitigation of COVID-19 pandemic using entropy based TOPSIS method. Cien. Saude. Colet. 2021, 26, 1419–1428. [Google Scholar] [CrossRef] [PubMed]
  67. Wang, Z.; Wang, J.; Zhang, G.; Wang, Z. Evaluation of agricultural extension service for sustainable agricultural development using a hybrid entropy and TOPSIS method. Sustainability 2021, 13, 347. [Google Scholar] [CrossRef]
  68. Petridis, K.; Drogalas, G.; Zografidou, E. Internal auditor selection using a TOPSIS/nonlinear programming model. Ann. Oper. Res. 2021, 296, 513–539. [Google Scholar] [CrossRef]
  69. Bell, A.; Parkhurst, G.; Droppelmann, K.; Benton, T.G. Scaling uppro-environmental agricultural practice using agglomeration payments: Proof of concept from an agent-based model. Ecol. Econ. 2016, 126, 32–41. [Google Scholar] [CrossRef]
  70. Liu, J.; Li, Y.; Zheng, Y.; Tong, S.; Zhang, X.; Zhao, Y.; Zheng, W.; Zhai, B.; Wang, Z.; Zhang, X.; et al. The spatial and temporal distribution of nitrogen flow in the agricultural system and green development assessment of the Yellow River Basin. Agric. Water Manag. 2022, 263, 107425. [Google Scholar] [CrossRef]
  71. Veisi, H.; Liaghati, H.; Alipour, A. Developing anethics-based approach to indicators of sustainable agriculture using an alytichierarchy process(AHP). Ecol. Indicat. 2016, 60, 644–654. [Google Scholar] [CrossRef]
  72. Balezentis, T.; Li, T.; Chen, X. Has agricultural labor restructuring improved agricultural labor productivity in China? A decomposition approach. Socio-Econ. Plan. Sci. 2021, 76, 100967. [Google Scholar] [CrossRef]
  73. Yang, L.; Yang, Y. Evaluation of eco-efficiency in China from 1978 to 2016: Based on a modified ecological footprint model. Sci. Total Environ. 2019, 662, 581–590. [Google Scholar] [CrossRef]
  74. Bastan, M.; Ramazani Khorshid-Doust, R.; Delshad Sisi, S.; Ahmadvand, A. Sustainable development of agriculture: A system dynamics model. Kybernetes 2018, 47, 142–162. [Google Scholar] [CrossRef]
  75. Ahmad, N.; Qahmash, A. Implementing fuzzy AHP and FUCOM to evaluate critical success factors for sustained academic quality assurance and ABET accreditation. PLoS ONE 2020, 15, e0239140. [Google Scholar] [CrossRef] [PubMed]
  76. Li, L.; Wang, W. Spatial heterogeneity of manufacturing development quality in China: Analysis based on projection pursuit model. East China Econ. Manag. 2020, 34, 1–11. [Google Scholar]
  77. Li, Z. Projection pursuit technology (PPT) and its progress of application. Nat. Mag. 1997, 19, 224–227. [Google Scholar]
  78. Fu, Q.; Zhao, X. Principle and Application of Projection Pursuit Model; Science Press: Beijing, China, 2006. [Google Scholar]
  79. Lee, E.; Cook, D.; Klinke, S.; Lumley, T. Projection pursuit for exploratory supervised classification. J. Comput. Graph. Statist. 2005, 14, 831–846. [Google Scholar] [CrossRef]
  80. Grochowski, M.; Duch, W. Projection pursuit constructive neural networks based on quality of projected clusters. In International Conference on Artificial Neural Networks; Springer: Berlin/Heidelberg, Germany, 2008; pp. 754–762. [Google Scholar]
  81. Grear, T.; Avery, C.; Patterson, J.; Jacobs, D.J. Molecular function recognition by supervised projection pursuit machine learning. Sci. Rep. 2021, 11, 4247. [Google Scholar] [CrossRef]
  82. Qu, L.; Wang, Y.; Liu, Y.; Ma, Q. Evaluation of water and land resources system bearing capacity and path optimization for rural revitalization. J. Nat. Resour. 2021, 36, 300–314. [Google Scholar] [CrossRef]
  83. Jin, J.; Liu, D.; Zhou, R.; Zhang, L.; Cui, Y.; Wu, C. Evaluation model of water resources carrying capacity based on projection pursuit weight optimization. Water Resour. Prot. 2021, 3, 1–6. [Google Scholar]
  84. Wan, M.; Kuang, H.; Yang, Y.; He, B.; Zhao, S.; Wang, Y.; Huo, J. Evaluation of agricultural green development based on gini coefficient and hesitation fuzzy multi-attribute decision-making: The case of China. Agriculture 2023, 13, 699. [Google Scholar] [CrossRef]
  85. Ge, P.; Liu, T.; Wu, X.; Huang, X. Heterogenous urbanization and agricultural green development efficiency: Evidence from China. Sustainability 2023, 15, 5682. [Google Scholar] [CrossRef]
  86. Mei, B.; Khan, A.A.; Khan, S.U.; Ali, M.A.S.; Luo, J. An estimation of the effect of green financial policies and constraints on agriculture investment: Evidences of sustainable development achievement in northwest China. Front. Public Health 2022, 10, 903431. [Google Scholar] [CrossRef]
  87. Fang, L.; Hu, R.; Mao, H.; Chen, S. How crop insurance influences agricultural green total factor productivity: Evidence from Chinese farmers. J. Clean. Prod. 2021, 321, 128977. [Google Scholar] [CrossRef]
  88. Rani, P.S.; Mani, K.; Vidhyavathi, A. A study on agricultural credit in adoption of technology in banana cultivating farms in Tamil Nadu. Int. Res. J. Agric. Econ. Stat. 2019, 10, 194–200. [Google Scholar] [CrossRef]
  89. Lei, S.; Yang, X.; Qin, J. Does agricultural factor misallocation hinder agricultural green production efficiency? Evidence from China Journal. Sci. Total Environ. 2023, 891, 164466. [Google Scholar] [CrossRef] [PubMed]
  90. Hong, M.; Tian, M.; Wang, J. Digital inclusive finance, agricultural industrial structure optimization and agricultural green total factor productivity. Sustainability 2022, 14, 11450. [Google Scholar] [CrossRef]
  91. Hadi, A.; Suprihatin, H.; Pramuhadi, G. Exploring the sustainability dimensions of coffee agro-industry: A critical review and future research agenda. IOP Conf. Ser. Earth Environ. Sci. 2011, 1063, 012049. [Google Scholar] [CrossRef]
  92. Liu, Y.; Lu, C.; Chen, X. Dynamic analysis of agricultural green development efficiency in China: Spatiotemporal evolution and influencing factors. J. Arid Land 2023, 15, 127–144. [Google Scholar] [CrossRef]
  93. Joukhadar, I.S.; Walker, S.J.; Funk, P.A. Comparative mechanical harvest efficiency of six new Mexico pod–type green Chile pepper cultivars. HortTechnology 2018, 28, 310–318. [Google Scholar] [CrossRef]
  94. Zou, Y.; Cheng, Q.; Jin, H.; Pu, X. Evaluation of green agricultural development and its influencing factors under the framework of sustainable development goals: Case study of Lincang city, an underdeveloped mountainous region of China. Sustainability 2023, 15, 11918. [Google Scholar] [CrossRef]
  95. Du, Y.; Liu, H.; Huang, H.; Li, X. The carbon emission reduction effect of agricultural policy--evidence from China. J. Clean. Prod. 2023, 406, 137005. [Google Scholar] [CrossRef]
  96. Gao, Q.; Cheng, C.; Sun, G.; Li, J. The impact of digital Inclusive finance on agricultural green total factor productivity: Evidence from China. Front. Ecol. Evol. 2022, 10, 905644. [Google Scholar] [CrossRef]
  97. Hou, D.; Wang, X. Inhibition or promotion? The effect of agricultural insurance on agricultural green development. Front. Public Health 2022, 10, 910534. [Google Scholar] [CrossRef] [PubMed]
  98. Nadia, A.; Nordin, S.M.; Rahman, I.; Noor, A. The effects of knowledge transfer on farmers decision making toward sustainable agriculture practices: In view of green fertilizer technology. World J. Sci. Technol. Sust. Dev. 2018, 15, 98–115. [Google Scholar]
Figure 1. Green agricultural production indicators of Beijing in 2006 and 2016.
Sustainability 16 00219 g001
Figure 2. Green agricultural production indicators of five districts in ECDA of Beijing in 2006 and 2016.
Sustainability 16 00219 g002
Figure 3. Green agricultural revenue indicators of 13 districts in Beijing in 2006 and 2016.
Sustainability 16 00219 g003
Figure 4. Green agricultural revenue indicators in ECDA of Beijing in 2006 and 2016.
Sustainability 16 00219 g004
Figure 5. AGD index from 2006 to 2016 in districts of function expansion area (a), urban developing area (b), and ECDA (c).
Sustainability 16 00219 g005
Figure 6. (a) AGD index distribution map of 13 districts of Beijing in 2016; (b) Change in AGD index values between 2006 and 2016 for 13 districts in Beijing.
Sustainability 16 00219 g006
Table 1. The evaluating indicator framework of AGD in Beijing ECDA from 2006 to 2016.
Evaluation LayerIndexTypeUnitWeight Coefficient
Green agricultural production
2.08
AP1: energy consumption per unit of gross agricultural output valueNegative 1000 tons of standard coal/1000 yuan0.4220
AP2: energy consumption per unit of arable land areaNegative1000 tons of standard coal/ha0.5329
AP3: fertilizer usage per unit of sown areaNegativeton/ha0.2753
AP4: fertilizer usage per unit of gross agriculture output valueNegativekg/1000 yuan0.1711
AP5: water consumption per unit of arable land areaNegativeton/ha0.0169
AP6: water consumption per unit of gross agricultural output valueNegativem3/1000 yuan0.2239
AP7: proportion of facility agriculture area in arable land areaPositive%0.1530
AP8: arable land area per capitaPositiveHa/capita0.2809
Green agricultural revenue
1.10
AI1: proportion of agritourism revenue in gross agricultural output valuePositive%0.0695
AI2: proportion of seed industry revenue in gross agricultural output valuePositive%0.2040
AI3: agricultural labor productivityPositive1000 yuan/capita0.2314
AI4: agricultural output value per unit of arable land areaPositive10 million yuan/ha0.3428
AI5: proportion of fixed asset investment in rural areasPositive% 0.2503
Table 2. Top six indicators with obstacle degree greater than 6% in ECDA (the number in the brackets is obstacle degree of the indicator).
Ranking123456
2006AP7 (8.35)AI1 (8.06)AI3 (7.85)AI2 (7.43)AI4 (7.38)AP3 (6.27)
2007AP7 (8.50)AI1 (8.05)AI3 (7.82)AI2 (7.58)AI4 (7.38)AP3 (6.87)
2008AP7 (8.47)AI1 (8.04)AI3 (7.83)AI2 (7.58)AI4 (7.33)AP3 (6.76)
2009AI1 (8.13)AP7 (8.07)AI3 (7.84)AI4 (7.25)AI2 (7.16)AP3 (6.76)
2010AP7 (8.68)AI1 (8.17)AI3 (7.80)AI2 (7.32)AI4 (7.14)AP3 (6.93)
2011AP7 (9.02)AI1 (8.36)AI3 (7.80)AI2 (7.75)AI4 (6.96)AP3 (6.49)
2012AP7 (9.18)AI1 (8.22)AI3 (8.05)AI2 (7.76)AI4 (6.99)AP5 (6.41)
2013AP7 (9.57)AI1 (8.21)AI3 (8.10)AI2 (7.71)AP5 (7.67)AP8 (6.46)
2014AP7 (10.08)AI3 (8.41)AI1 (8.09)AI2 (7.53)AP5 (7.47)AI4 (6.75)
2015AP7 (10.74)AP5 (8.43)AI3 (8.32)AI1 (8.31)AI2 (7.62)AP4 (7.10)
2016AP7 (11.26)AI3 (9.15)AI1 (8.39)AP5 (8.07)AI2 (7.81)AP4 (7.25)
Disclaimer/Publisher’s Note: The statements, opinions and data contained in all publications are solely those of the individual author(s) and contributor(s) and not of MDPI and/or the editor(s). MDPI and/or the editor(s) disclaim responsibility for any injury to people or property resulting from any ideas, methods, instructions or products referred to in the content.

