Article

100 Years of Land-Use and Land-Cover Data: What Has Been the Effect of Spatial Planning in Coastal Land-Use and Land-Cover Change?

by
Raquel Faria de Deus
1,*,
José António Tenedório
2,
Denise Pumain
3,
Jorge Rocha
4 and
Margarida Pereira
1
1
Interdisciplinary Centre of Social Sciences (CICS.NOVA), School of Social Sciences and Humanities (NOVA FCSH), Universidade NOVA de Lisboa, Avenida de Berna, 26-C, 1069-061 Lisbon, Portugal
2
História, Territórios e Comunidades, History, Territories and Communities, Hub at NOVA FCSH for the Centre for Functional Ecology—Science for People & the Planet, Associate Laboratory TERRA, School of Social Sciences and Humanities (NOVA FCSH), Universidade NOVA de Lisboa, Avenida de Berna, 26-C, 1069-061 Lisbon, Portugal
3
Université Paris 1 Panthéon-Sorbonne, 191 rue Saint Jacques, 75005 Paris, France
4
Centre of Geographical Studies (CEG), Associate Laboratory TERRA, Institute of Geography and Spatial Planning (IGOT), Universidade de Lisboa, 1600-276 Lisbon, Portugal
*
Author to whom correspondence should be addressed.
Sustainability 2023, 15(9), 7636; https://doi.org/10.3390/su15097636
Submission received: 6 March 2023 / Revised: 27 April 2023 / Accepted: 28 April 2023 / Published: 6 May 2023
(This article belongs to the Special Issue Smart Spatial Planning)

Abstract

:
The Sustainable Development Goals require us to rethink spatial planning policies’ effectiveness. This article proposes a reproducible method for assessing the effect of past planning practices and simulating future land-use and land-cover (LULC) changes with a Cellular Automata model. The originality of our approach is to systematically compare observed changes in LULC with the planning rules in force over almost a century of evolution. A quasi-exhaustive database was constructed at a very fine spatial resolution for the municipality of Portimão (Southern Portugal), including the location and changes of LULC categories, and the planning rules of the corresponding time period on nine dates between 1947 and 2018. The quantified measurement of the actual effect of planning rules enables us to identify other determinants of the evolution. Findings reveal that the policies established by the local government—which aimed to foster well-planned comprehensive urban areas—were not as effective as intended. The quantified discrepancies between planning recommendations and observed evolution help to simulate which LULC scenarios could be designed to reach the expected result in future planning policies. Our assessment method could be applied in other urban and tourist regions where land artificialization exerts strong pressure on the environment.

1. Introduction

Changes in land-use and land-cover (LULC) reveal much of the social and economic organization of the communities that promote them. Therefore, history explains the changes in the functions of territories (e.g., agricultural, forestry, urban, industrial, commercial, housing, tourist, etc.) in the short term, but, above all, in the long term. A long-term perspective allows us to observe the most structural change trends—those changes that remain over time and explain the complex processes of the history of contemporary territories [1]. It seems evident that the history of LULC transitions helps us to reflect on whether these transitions are sustainable [2] and, in fact, on how the very communities are transformed [3]. These transitions cause environmental impacts, as has been proven in the scientific literature, namely contributing to accelerating climate change, reducing biodiversity, or even counteracting complex natural processes [4,5].
To observe the territory, scientists turn to geographic data that show quantitative evidence of LULC change. Producing maps with different spatial scales is an example of using this evidence. For instance, Moulds et al. [6] demonstrated that historical LULC data are crucial for identifying the location of change, as well as quantifying its pace and dimension, by means of their spatiotemporal reconstruction study of LULC for India from 1960 to 2010. Mäyrä et al. [7] derived valuable and robust long-term information on LULC change for a southern boreal forest area in Finland using scanned historical maps from 1965 to 2022. Sourn et al. [8] analyzed major LULC changes along with their drivers over 20 years in Cambodia using Landsat satellite imagery. Fathizad et al. [9] used Landsat image data to map the LULC of a desert area in Southwest Iran for 1990, 2000, and 2010, and thus investigated the physical characteristics of the land surface based on LULC changes. Leta et al. [10] used Landsat images and a Land Change Modeler to assess the temporal and spatial LULC dynamics of the Nashe watershed in Ethiopia from 2005 to 2019 and to predict the spatial distribution of LULC for 2035 and 2050. Moreover, based on scientific evidence (data), it has been possible to create in-depth studies on global land-cover trajectories and transitions [11]. For example, Mingarro and Lobo [12] examined LULC changes in 192 European National Parks based on the CORINE Land Cover data between 1986 and 2018. Matlhodi et al. [13] utilized Landsat images from 1984 to 2015 to study LULC change in the transboundary Gaborone dam catchment and then applied a CA-Markov model to simulate the possible LULC in 2035. Radwan et al. [11] quantified land-cover changes from 1992 to 2018 using a fine-resolution and temporally consistent land-cover dataset at global, continental, and national scales. All these scales hold great degrees of uncertainty in the analysis of both the LULC change trajectories and spatial planning data. For example, generating spatial data on spatial planning for large-scale case studies still remains a challenge [14]. However, regardless of what the purpose of the study at the territory level may be, LULC should be present as it is a piece of crucial information.
Spatial planning is a key element in ensuring the achievement of the objectives of ecological transition and sustainable development recommended by the United Nations [15,16,17]. Much work has recently emphasized the usefulness and urgency of providing a legal framework for the diversity of pressures on LULC in order to achieve the objectives directly related to future urban development [14,18,19,20,21]. The Portuguese government and planning agencies, similarly to those in other countries, have been striving to conduct urban development with the goal of creating both sustainable and resilient urban areas as supported by the diverse policy and strategic spatial documents (e.g., the 2030 Portuguese Urban Agenda, the Portuguese Legal Framework for Spatial Management Tools, and the more recent 2015 Regulatory Law, which established the criteria for the national classification and reclassification of land). However, how can we ensure the effectiveness of the measures that will be recommended? The application of public policies in different areas at a given time always poses problems in adapting policy principles to different local conditions [22]. Over time, policies are also modified according to development or protection objectives that change considerably [23,24]. Substantial research assessing the effects of spatial planning on LULC change has used qualitative approaches (for a comprehensive overview on assessment approaches of spatial planning outcomes for LULC change, see [14]). So far, few studies have succeeded in measuring the actual effect on LULC change of planning measures enacted by planners [18,22,25,26].
Hence, the present study introduces an approach based on previous research carried out by Faria de Deus [27] and aims to analyze quantitatively the effects of spatial planning policies on past and future LULC change on a coastal urban area using a GIS-based analysis and a CA-based modelling approach. In this article, we exploit two unique databases on LULC and spatial planning data that have been constructed for this purpose. We have chosen a Portuguese municipality representative of the problems posed by the evolution of LULC in a coastal area in the Algarve region, Portugal [2,28]. We have managed to obtain information with high spatial accuracy for a long period of time, covering the changes that occurred in its LULC on nine dates (from 1947 to 2018) and its expected LULC for 2047, over almost a century. We compare these changes with those that were permitted or expected according to the rules set out in twenty-four official land-use planning documents, both guiding and mandatory, and two hundred and twenty planning permits. These databases are unique in their accuracy in describing the quantities and qualities of LULC changes and in the long period of time observed. The originality of the proposed approach is the fact that it enables us to confront spatial planning features with LULC changes using high-resolution and long-term data and relevant categorization of changes—comprising low-density residential categories—which is recognized as a priority topic for research quantifying and understanding the effects of spatial planning on LULC change [14]. The proposed approach is rather straightforward and may be transposed to other geographic areas when the specific features of each geographic context are considered.

2. Materials and Methods
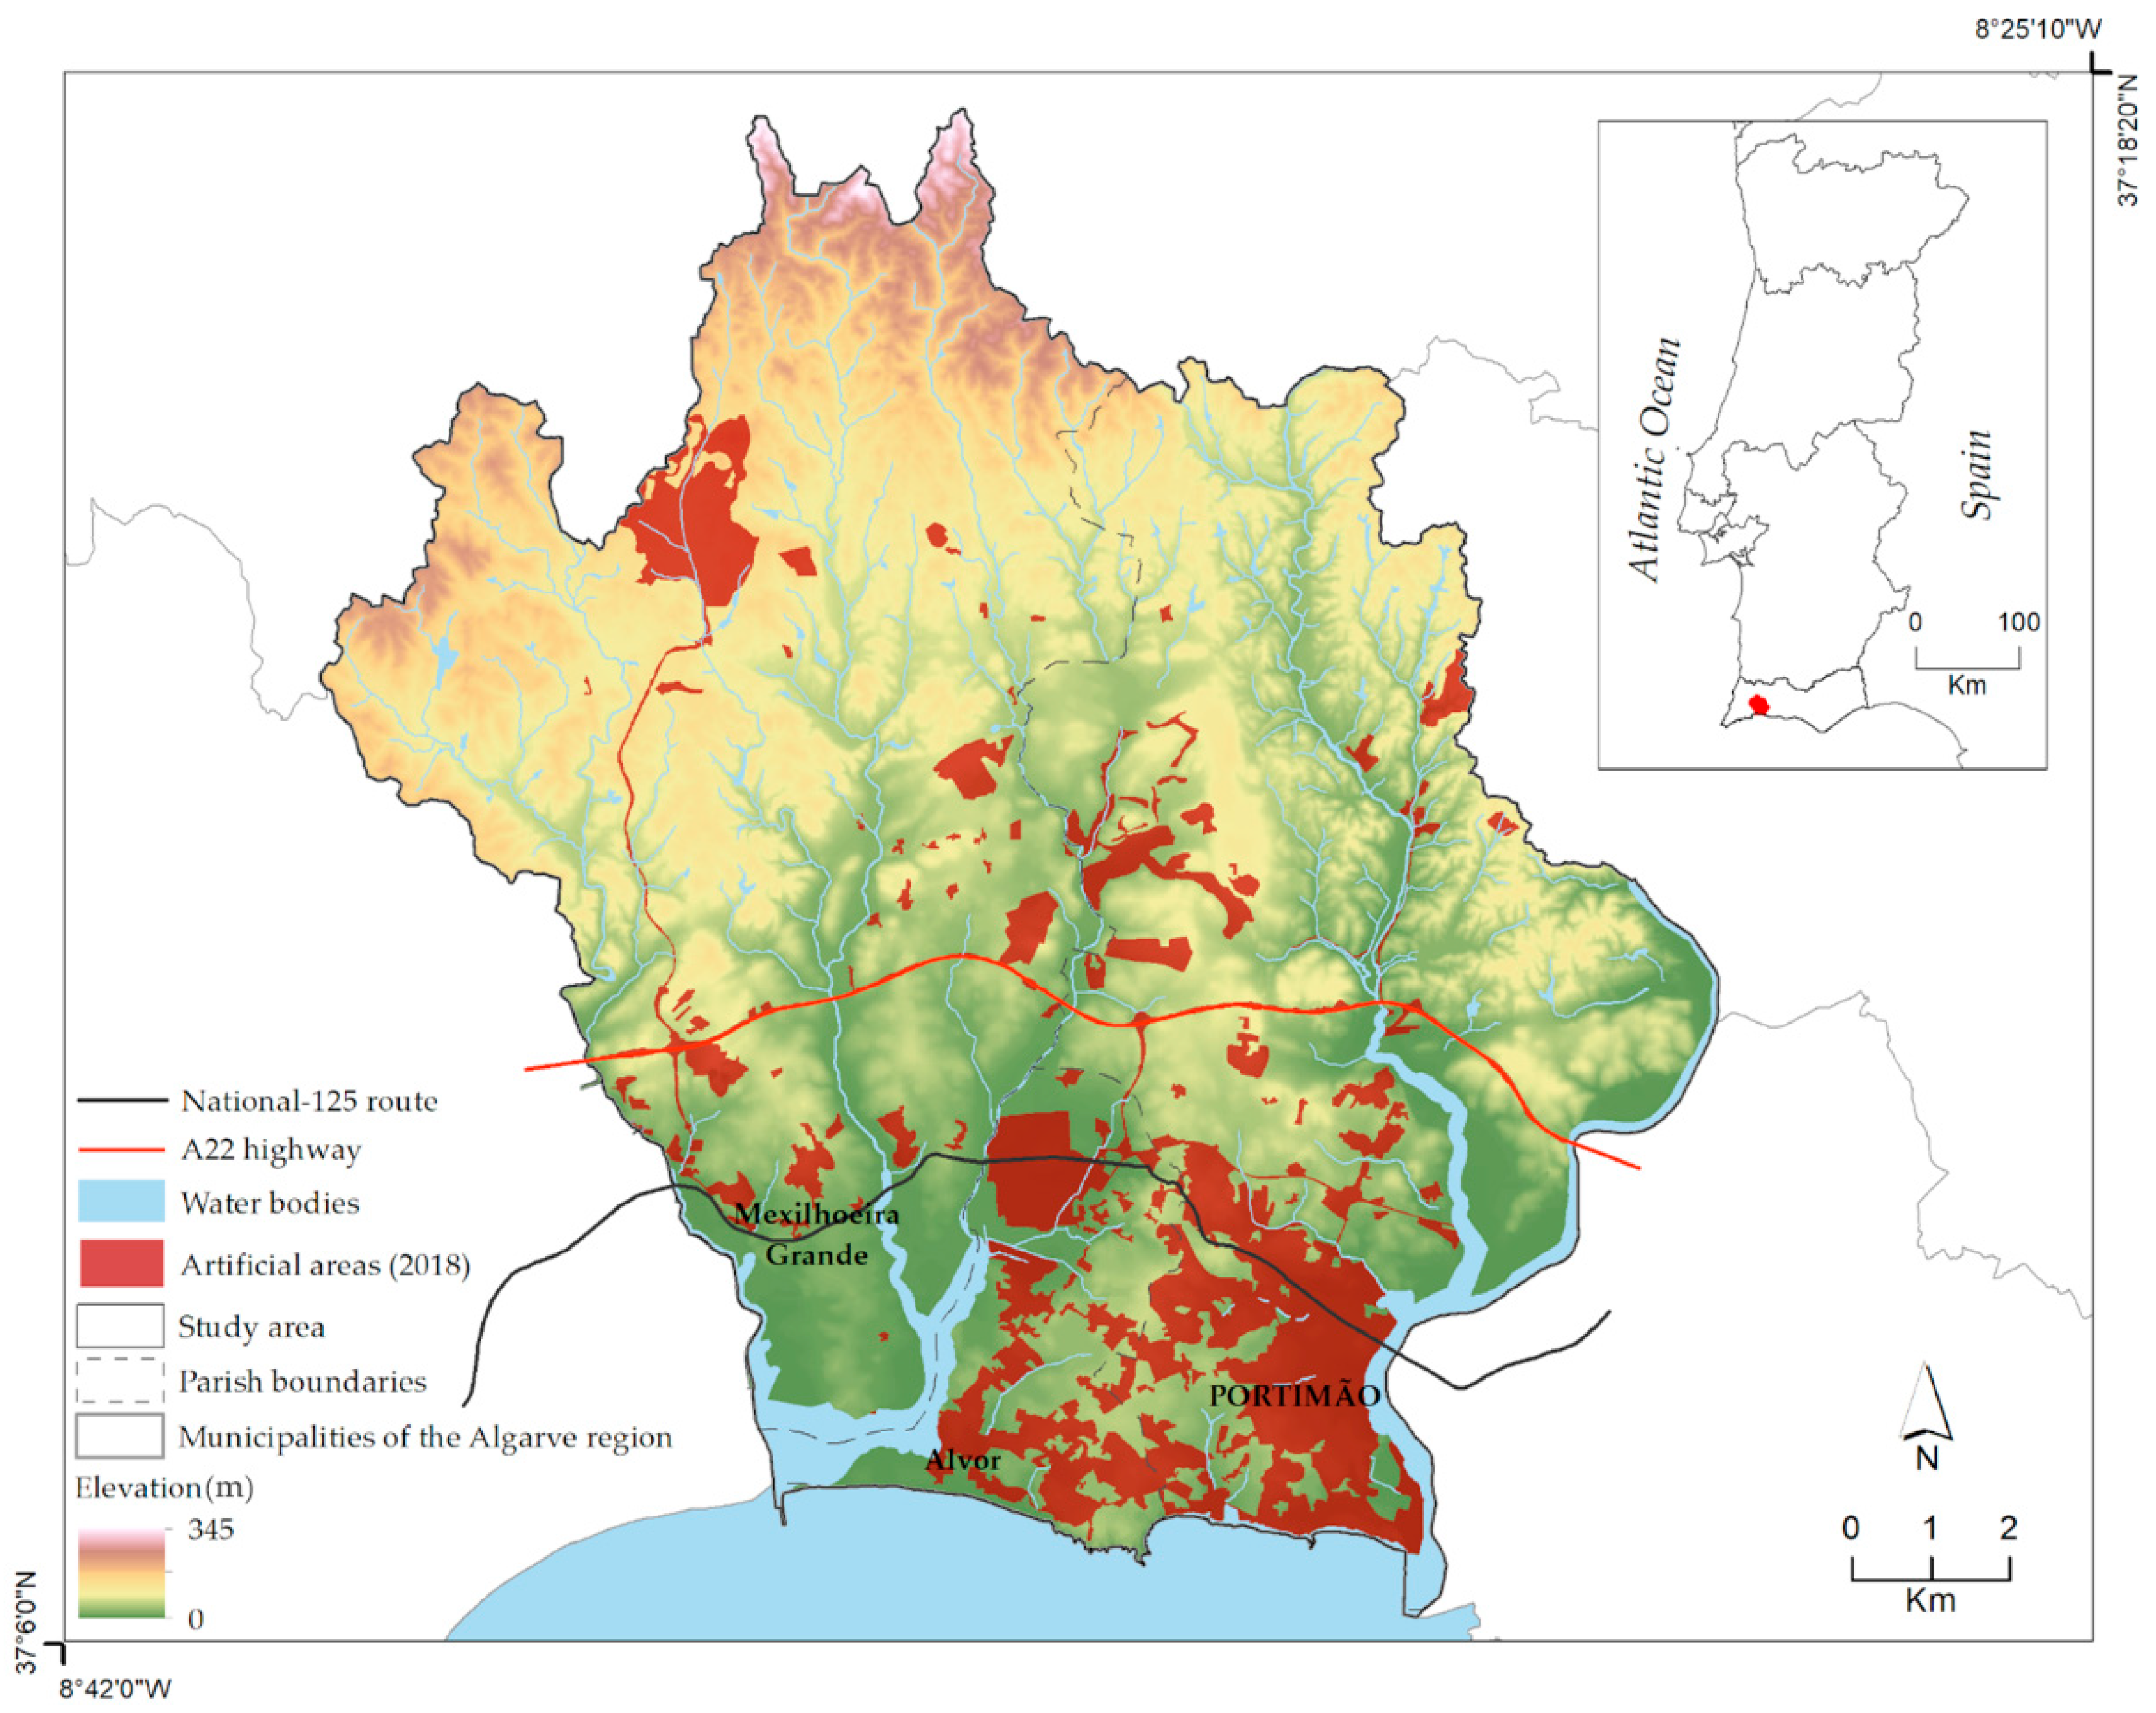
The methods described in this section are based on highly detailed spatial data sources to generate historical series of both LULC change and land-use planning data. These spatial data have been further introduced in a CA-based model for LULC change forecasting. Current and future LULC changes have then been compared to land-use planning policy data.

2.1. Study Area

The municipality of Portimão covers 183 km2 in Southern Mainland Portugal and had 59,896 inhabitants in 2021 [29] (Figure 1). Portimão is one of the most rapidly growing municipalities in the Algarve region. Its population grew by 15.4% between 1991 and 2001, and 24.1% between 2001 and 2011. Even though this trend has greatly decelerated since the 2008 economic crisis, the population of Portimão grew by 7.6% between 2011 and 2021, over the national negative population growth rate of 2.1%, evidencing the national demographic decrease trend announced by Statistics Portugal for the coming decades [30]. According to the results from the 2021 Census, the Algarve region was one of the Portuguese regions with the highest growth in conventional dwellings. The number of conventional dwellings in the municipality of Portimão is 49,296, which represents an increase of around 5% when compared with 2011. The growth of conventional dwellings in this decade was significantly lower than in the previous decades, when the numbers were around 54% between 2001 and 2011, and 34% between 1991 and 2001 [31,32,33]. In the last few decades, secondary residences were a substantial part of the conventional dwellings in Portimão: secondary residences accounted for 39.3%, 41.4%, 36.1%, and 31.8% of the total dwellings in 2021, 2011, 2001, and 1991, respectively. This research considers the municipality of Portimão since its territory is representative of the Portuguese urban environment, namely in terms of changes in LULC, urban polarization, coastal urbanization, and urban sprawl [34]. Administratively, the municipality of Portimão comprises three parishes: Portimão, Alvor, and Mexilhoeira Grande. Approximately 84% of the population lives in the parish of Portimão, which includes the city of Portimão as well. The terrain in Portimão is mostly flat and soft hills, and much of the study area sits between 0 and 147 m in elevation. By 2018, natural and semi-natural areas (50%)—particularly shrubs—and agricultural areas (31%) were the dominant land-cover categories in the study area. Artificial areas occupied nearly 14% and were located largely in the southern part of the municipality along the coastline (quantified using the Official Land-Use Land-Cover Map of Mainland Portugal for 2018, available in [35]). However, expansion of artificial areas is taking place in a discontinuous leapfrog spatial pattern, distant from existing artificial areas, towards the northern part of the municipality, due to the increase in denser tourist occupation initiatives. Given that it is part of an important region of tourist destinations in Portugal and Europe [2], the municipality of Portimão has experienced massive growth in artificial areas in the last few decades. This artificial area growth has been triggering several land-use challenges, including urban sprawl, the irreversible loss of biodiversity and protected agroforestry systems, and the abandonment of agricultural land.

2.2. Research Data Sources

2.2.1. Land-Use and Land-Cover Data

For this study, nine high-precision and compatible LULC digital vector maps were used. The nine LULC maps for the years 1947, 1958, 1968, 1972, 1987, 1995, 2000, 2010, and 2018 were produced by means of visual interpretation from historical aerial photographs and orthorectified digital aerial images. Even if uniform analysis intervals were more suitable, the analysis intervals were set on the basis of available aerial imagery for the study area. The LULC maps have a scale of 1:10,000, a minimum mapping unit of 1000 m2, and 45 LULC categories at the most detailed thematic level. The validation procedure was only carried out for the two most recent years due to the lack of higher-resolution ground-truthing spatial data for the earlier years. This shortcoming was overcome by using both the downdating classification method and ancillary data for an appropriate visual interpretation of the historical imagery. The 2010 and 2018 LULC maps have produced overall accuracy of 96.2% and 96.3%, respectively. The LULC maps were reclassified according to six LULC categories, namely vertical urban fabric (total sealing surface (S.S.): ≥80%); horizontal urban fabric (total S.S.: ≥80%); discontinuous urban fabric (total S.S.: 50–80%); sparsely discontinuous urban fabric (total S.S.: 30–50%), other artificial surfaces (including industrial, commercial, and transport units; mine, dump, and construction sites; artificial, non-agricultural vegetated areas, and car parks), and non-built areas. These are the LULC categories involved in the major trends of LULC transitions in the study area. For detailed information on the methodology and technical specifications applied to create the LULC maps, see [2,36].

2.2.2. Land-Use Planning Data

To analyze whether the LULC changes occurred in accordance with the spatial policies defined for the study area, land-use planning datasets were created based on both the historical and recent urban land-use plans (including Urbanization Plans and Detailed Plans), the Municipal Master Plan (MMP), and planning permits. These unique land-use planning datasets, represented in Figure 2, cover all planning models established or desired for Portimão from 1942 to 2022. Although most of the historical urban land-use plans were not mandatory (hereinafter, guiding plans), many have played an important role in the spatial organization of the territory.
The historical urban land-use plans were provided by the Directorate-General for Territory as raster images. They were georeferenced to the ETRS89/PT-TM06 reference system with a Root Mean Square Error (RMSE) of below 5 m. We have established three land classes to produce policy area maps for each analysis interval: areas proposed for urban development, outside urban proposed areas (including agricultural and agroforestry areas), and areas excluded from development. These data were collected from the historical planning schemes using the visual on-screen digitizing method. The recent urban land-use plans, the Municipal Master Plan, and the planning permits were provided by the Planning Department of Portimão’s City Hall in vector data file formats (i.e., .DWG and .SHP) already in the ETRS89/PT-TM06 reference system. A total of two hundred and twenty planning permits were analyzed and processed so that the same mentioned land classes were obtained. The three main land classes were also collected from the Municipal Master Plan. The ‘areas excluded from development’ land class of the Municipal Master Plan includes both the National Ecological Reserve (REN) and the National Agricultural Reserve (RAN) areas, which aim at protecting valuable ecological areas and soils with high agricultural potential, respectively.

2.2.3. Spatial Determinants

Four groups of variables were assumed to have an effect on the LULC change processes. These included density variables, distance variables, topographic characteristics, and land-use planning policies. A transportation network density index was derived from the LULC maps and computed by combining a line density method and a kernel point density method. The line density surfaces were weighted by the road network hierarchy. The kernel density surfaces were computed to measure the density of railway stations and highway exits weighted by their linear distance to the closest urban areas. Distance variables were generated using the Euclidean distance. Distance from existing LULC categories and distance from agricultural and shrubland areas were calculated using the LULC datasets. Distance from the coastal line was extracted from the 2010 Portuguese Administrative Map (available in [35]). The slope was computed from a 25-m-resolution digital elevation model (DEM) provided by the Directorate-General for Territory. The areas proposed for urban development from the urban planning schemes were included to characterize the effect of land-use planning actions taken by local governance on LULC change. These data were further disaggregated based on the guidelines of each urban planning scheme regulation (on the allowable land-use categories and housing type) to represent the effect of the planning actions on the simulated LULC categories according to their lifetime. Constraint factors were also identified, producing a dichotomous variable. These included water bodies, agroforestry and ecological protected areas, and land excluded from development defined by urban planning schemes. All spatial data were rasterized with a 10-m resolution, and normalized through fuzzy logic, except for land-use planning data and both policies and natural constraints, which were expressed as Boolean maps.

2.3. Spatial Analysis Techniques

To evaluate whether the historical and recent land-use planning policies have produced the desired LULC change, a two-step analysis was conducted. Firstly, we applied a GIS overlay technique to the reclassified LULC maps to create a spatial–temporal difference map. The overlay results represent, on a single map, the LULC change in the study area between each analysis interval. We then used GIS to overlay the policy area maps and the LULC change maps. Finally, the percentage of area that changed for each LULC category (i) within areas proposed for urban development by the several land-use planning policies, (ii) within planning permit areas, (iii) outside urban proposed areas, and (iv) within areas excluded from development were computed for the analysis intervals.

2.4. Land-Use and Land-Cover Change Simulation

The simulation of future LULC change was conducted using a CA-based model—the CAMLucc. It is a hybrid framework, implemented using the TerrSet software. CAMLucc combines the advantages of logistic regression, Markov chain analysis, and a regular two-dimensional CA to generate simulations of LULC change. It was introduced in 2015 by [27] and applied to the empirical analysis of future LULC change and urban sprawl in the municipality of Portimão for the year 2025 [36]. Moreover, the CAMLucc model proved to be an effective tool to assist urban planners and policymakers to define forthcoming land-use planning policies. A comprehensive description of the model’s design as well as the calibration, simulation, and validation components is given in [36]. The CAMLucc workflow involves (i) producing LULC maps, (ii) creating suitability maps by means of logistic regression based on spatial determinants, (iii) computing transition area matrices through the Markov chain model using LULC maps, (iv) calibrating and validating the model using a retrospective simulation method to assess the model’s performance when simulating LULC change, and (v) forecasting LULC maps (here, the year 2018 was assigned as the starting point to perform the simulations for the year 2047) by means of CA, iterating the allocation of LULC until the estimated quantity of change is achieved, using a common von Neumann 5 × 5 neighborhood configuration. The allocation procedure was carried out using multi-objective land allocation analysis (MOLA) [37]. Several Kappa statistics were used to validate the CAMLucc simulation results based on the reclassified LULC maps [36]. The traditional Kappa index of agreement [38]—KIA—which was not less than 0.75, has a progressive improvement through time. The CAMLucc model shows a KIA index of 0.95 and 0.94 for the years 2010 and 2018, respectively, determining that the simulations exhibited great overall performance.

3. Results

This section describes the results of both the spatial analysis of LULC change using an LULC time series of 71 years and the simulation of LULC change for 2047. These results allowed us to explore in detail the effects of land-use planning policies on past, current, and future LULC change in Portimão, as well as to analyze the discrepancies between land-use planning recommendations and the actual LULC changes in the study area.

3.1. Analysis of the Effects of Land-Use Planning Policies on LULC Change

Figure 3 and Figure 4 represent the seven LULC change maps, as well as the policy areas for each analysis interval. The percentage of LULC change in policy areas and outside urban proposed areas is provided in Table 1. Table 1 reveals significant details of how LULC change has been affected by each type of land-use planning policy at different analysis intervals. It also shows how past and future urban LULC change trends conflict with planned zoning as recommended or approved by the urban land-use plans and the Municipal Master Plan. From the analysis of Table 1, we can distinguish two macro-time periods in the study period, from 1968 to 1995 and from 1995 to the present. In these periods, important Portuguese planning acts and regulations were introduced and distinct urban LULC change trends occurred, which will be analyzed in the following sections.

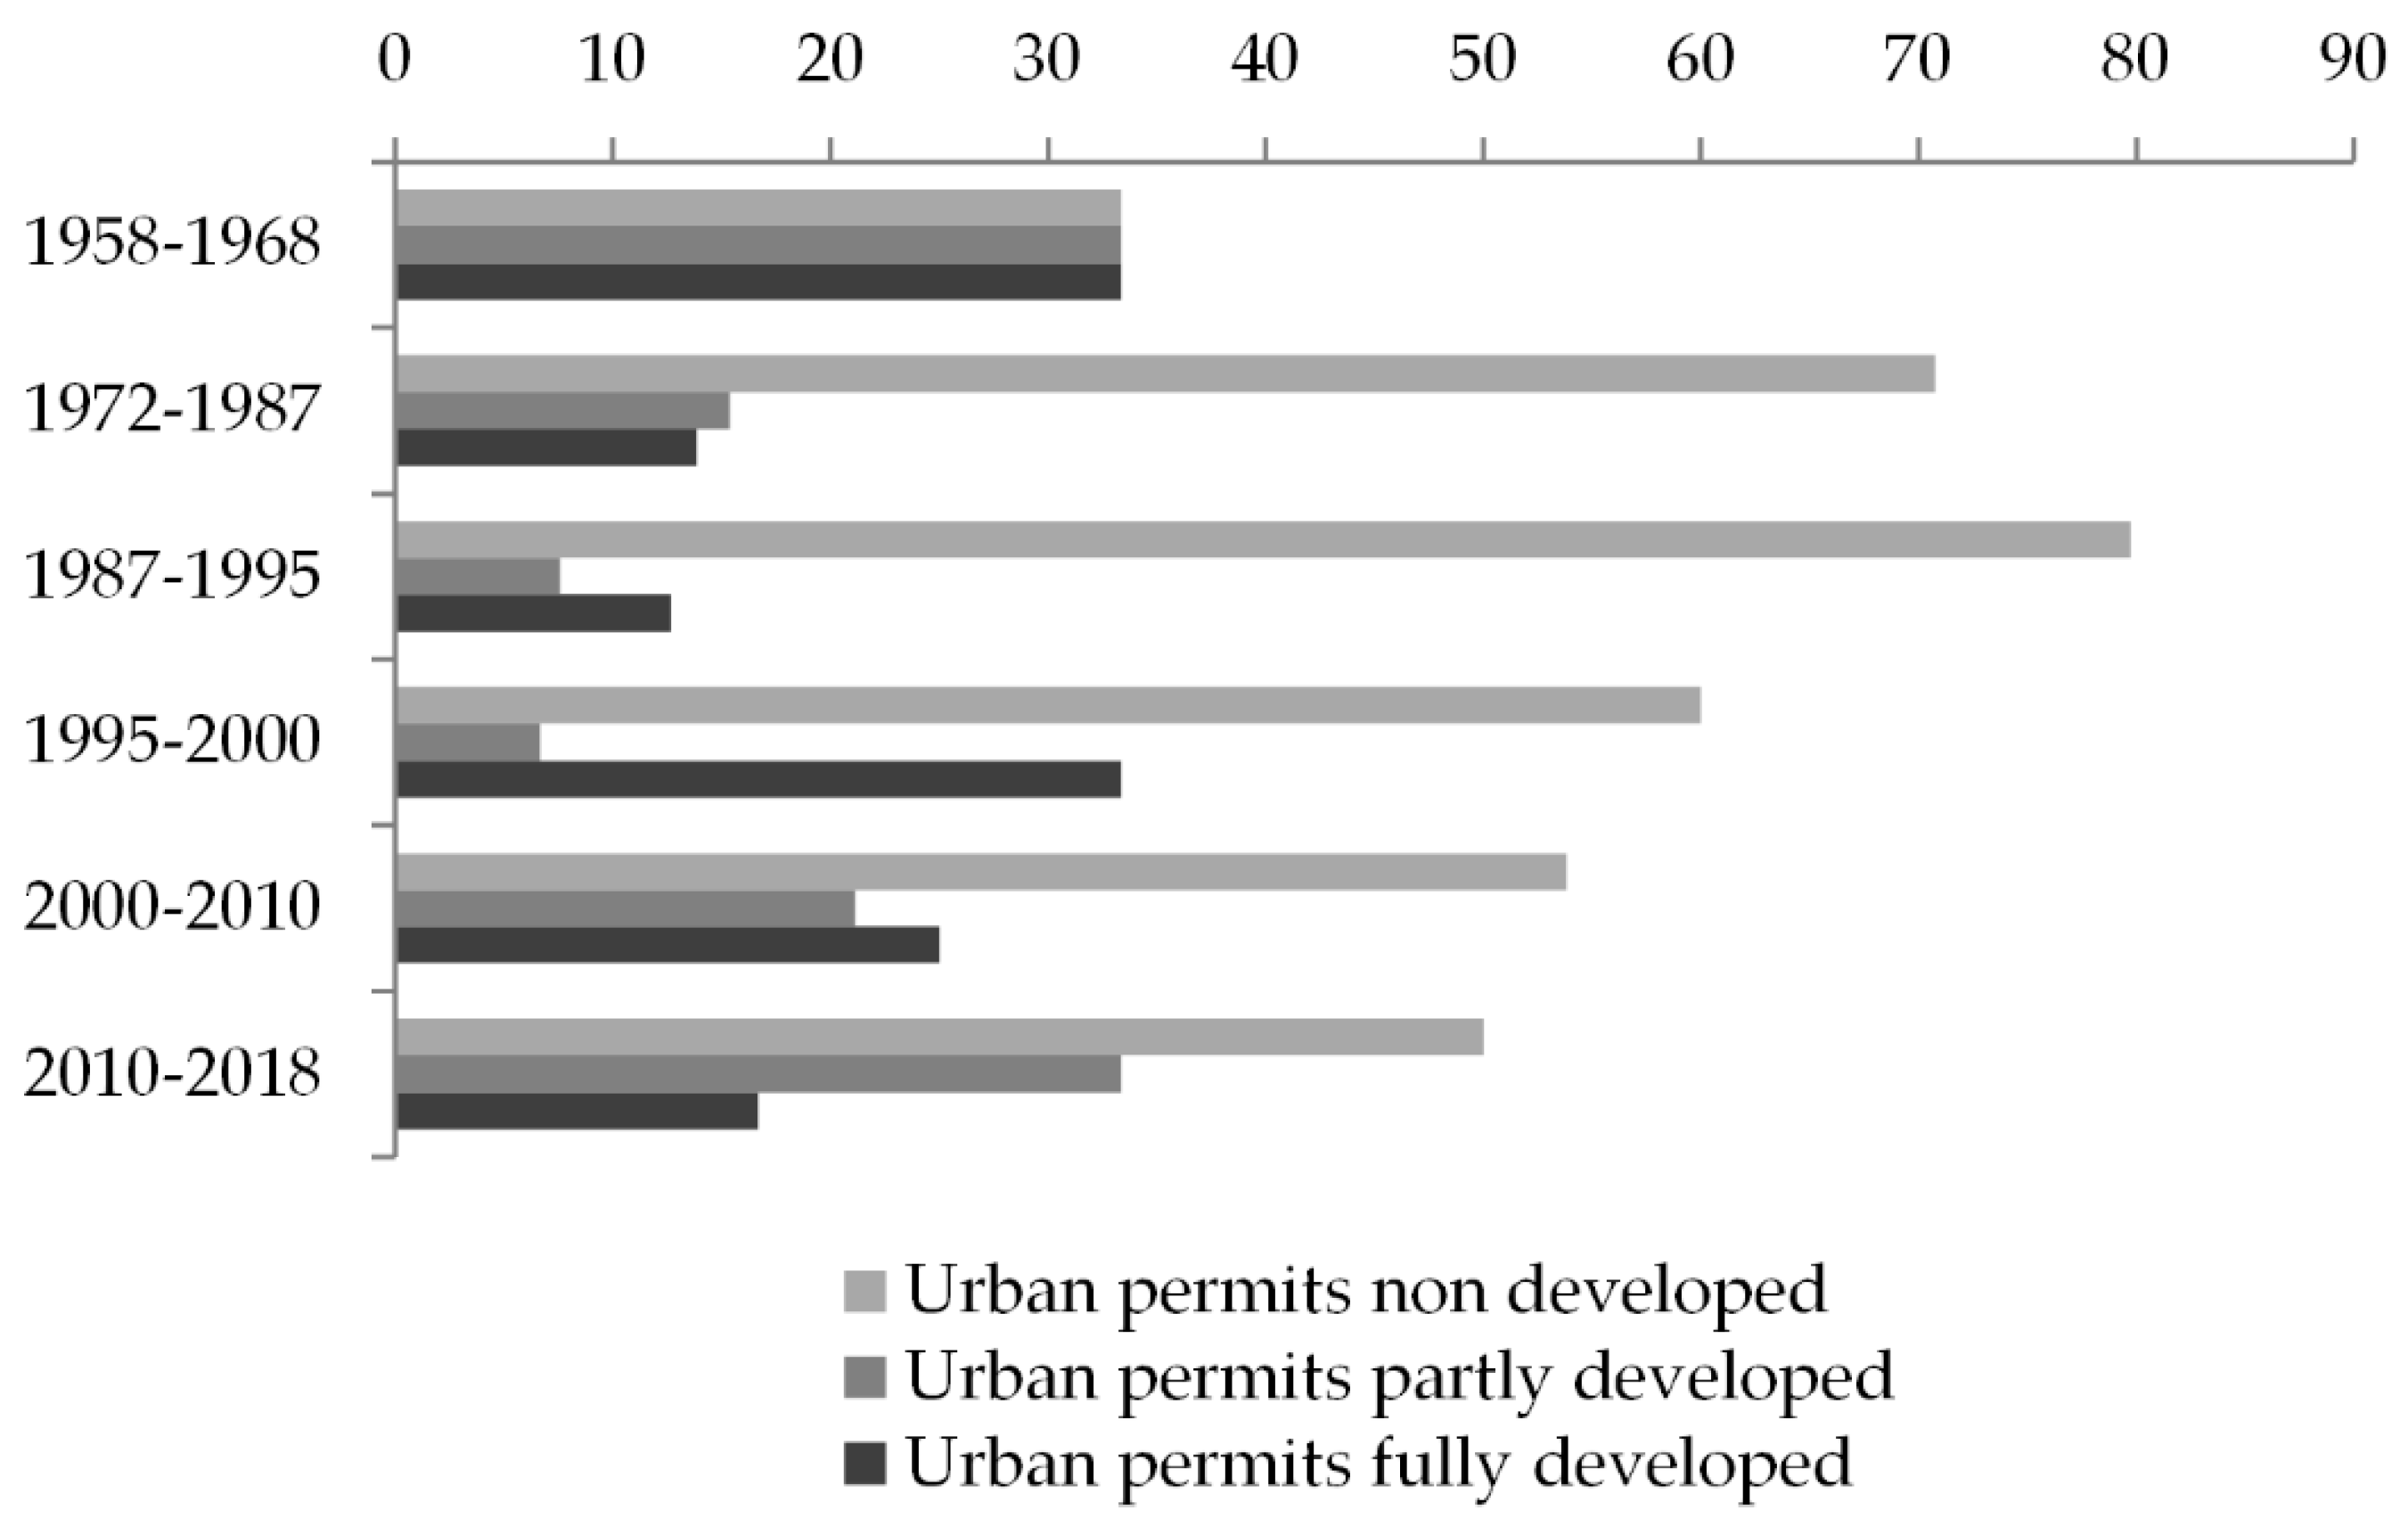
3.1.1. LULC Change under the Control of Guiding Plans: 1958–1995

In Portugal, LULC change and urban growth processes were controlled by the top-down government system from the 1930s until the early 1960s. General Urbanization Plans and Partial Urbanization Plans were introduced and expressed in the Portuguese urban planning law. Regulations on urban land-use usually had a lifetime of 15 to 25 years. Their main goals were the spatial reorganization of urban areas and the spatial distribution of both road and urban infrastructure networks, all of which intended to guarantee rationality in urban areas. However, a shift occurred in the urban growth process control in 1965. To cope with the high demand for housing in peri-urban or suburban areas, the State transferred the power to provide plots with infrastructures in the urban-land market to private initiatives. The Private Urbanization Act was established by law (Law 46.673/1965, of 29 November), which prompted the beginning of private initiatives in the urban growth process by means of planning permits. Such planning permits promoted by private initiatives that operate at the bottom-up level are, however, dependent on the municipal level of the government.
Under this national planning framework, several urban land-use plans were elaborated and almost three dozen planning permits by the landowner’s initiative approved by the municipality of Portimão from 1958 to 1982. The early urban land-use plans desired for Portimão (namely, the urban land-use plans of ‘Praia da Rocha 1942’, ‘Portimão 1948’, ‘Bemposta 1964’, ‘Bemparece 1967’, and ‘Aldeia das Sobreiras 1968’) had contracted urban perimeters, which resulted in a shortage in the supply of urban land. They covered approximately 311 hectares (around 2% of the municipality’s total land area) and aimed at developing basic infrastructure networks and public facilities for the main urban settlements, as well as promoting urban expansion based on low-density residential development (single-family dwellings, maximum of two floors allowable), preferably at locations near core areas. From Table 1, we can gather that for the 1958–1968 and 1968–1972 periods, there were minor changes in the horizontal urban fabric in areas proposed for urban development by these urban land-use plans (see also Figure 3a,b).
Of the total area of change into horizontal urban fabric, only 29% and 21% occurred in these areas in the 1958–1968 and 1968–1972 periods, respectively. Furthermore, during these periods, there were barely any changes into other artificial surfaces within areas proposed for urban development (6.7% in the 1958–1968 period and 2.1% in the 1968–1972 period). On the other hand, changes into both horizontal urban fabric and other artificial surfaces occurred primarily outside urban proposed areas.
Table 1 shows that 63% and 79% of changes into horizontal urban fabric occurred outside urban proposed areas in the 1958–1968 and 1968–1972 periods, respectively. Regarding changes into other artificial surfaces, 59.8% of the transitions occurred in areas proposed for urban development by planning permits between 1958 and 1968, and 88.5% were located outside urban proposed areas between 1968 and 1972. Therefore, these early urban land-use plans apparently had no significant effect on the spatial distribution of both horizontal urban fabric and other artificial surfaces during this period. This can be related to the fact that at the end of the Portuguese dictatorship (called Estado Novo, i.e., New State), the land-use plans were developed for urban areas only. At the time, there was no land-use plan covering the whole territory of the municipality, which meant that locations outside the main urban areas could only be developed through planning permits. This, along with population pressure and tourism demand, has greatly contributed to the diffused LULC change in the municipality based mostly on the horizontal urban fabric, discontinuous urban fabric, and sparsely discontinuous urban fabric, as we can see in Figure 3a,b.
However, from the late 1960s onwards, the basic principles upon which urban land-use plans relied changed, when greater development control started to be regularly imposed at the municipal level. The urban land-use plans elaborated for the municipality by 1982 (namely, the urban land-use plans of ‘Portimão 1966’, ‘Portimão 1968’, ‘Coca-Maravilhas 1973’, ‘Portimão 1977’, ‘Praia da Rocha 1978’, ‘Portimão 1979’, and ‘Alvor 1982’) covered approximately 1857 hectares (around 10% of the municipality´s total land area). They intended to contain urban development in the different existing urban areas in a coherent and coordinated manner, avoiding unplanned urban development. Thus, the local level of government intentionally promoted high-density residential development (based on both mid-rise and high-rise buildings) to stimulate the concentration of the urban population, which in turn would lead to the release of natural and agricultural areas. Between 1958 and 1987, changes to the vertical urban fabric were mainly found in areas proposed for urban development by urban land-use plans (Table 1). This indicates that such guiding plans proved to be very effective on changes to vertical urban fabric, particularly between 1972 and 1987. Notwithstanding, Figure 3a–c reveals patterns of diffuse urbanization between 1958 and 1987, which conflicted with the land-use transformation options prescribed by these urban land-use plans. The greater demand for permanent housing and commercial areas led the city to sprawl as the population increased. This growth pattern was further reinforced by the high demand for a second home (based on a condominium property type with a pool and tennis court), mainly due to Algarve´s tourism boom, triggered by the favorable economic situation in the European countries, thus resulting in increased accommodation capacity and the construction of Faro International airport (1965). Indeed, Table 1 shows that changes to the discontinuous urban fabric and sparsely discontinuous urban fabric were almost all located outside urban proposed areas.
The urban development of the municipality tended to be self-organized and generated by its own internal dynamics, including private and individual initiatives. The individual initiative is referred to as the private parties (families) that buy plots to build or commission the construction of a home to meet their housing needs. Moreover, it does not involve massive urban infrastructure development. Private agents, however, are referred to as urban developers that are interested in plots to implement urban infrastructures and build houses to sell for quick profits according to a detailed plan previously submitted to and approved by the local authority. This is different from the individual initiative as it is always a business initiative that involves both massive land and the real estate market. As Table 1 shows of the total area of LULC change, 86.4%, 95.2%, and 75.9% occurred outside urban proposed areas and within areas proposed for urban development by planning permits, during the 1958–1968, 1968–1972, and 1972–1987 periods, respectively. This reveals that between 1968 and 1987, LULC change in the municipality was largely the result of local decisions performed by private agents and individuals.

3.1.2. LULC Change under the Control of Mandatory Plans: 1995–2018

The early 1980s were marked by important changes in the Portuguese legal framework for spatial planning and by the introduction of major policy initiatives (namely the introduction of REN and RAN). The Municipal Master Plan was defined by law (Law 208/1982, of 26 May) and thereafter planning decisions became a legal responsibility of the local level of government, even if it needs the final opinion of the Portuguese Regional Coordination and Development Committee and must be ratified by the central government. Consequently, the spatial extension of planning to the entire municipality was achieved. The complexity and ambition of the content of this Law, along with the technical inexperience of the planning teams and the scarcity of national cartographic and statistical resources, resulted in its residual application. Only a new legal framework implemented in 1990 (Law 69/1990, of 2 March), which simplified the elaboration process and penalized the municipalities with no effective Municipal Master Plans in accessing community and national funds, gave rise to the so-called ‘first generation of Municipal Master Plans’.
The Municipal Master Plan of Portimão came into force in 1995. Between 1987 and 1995, the LULC change process of Portimão continued to be mainly governed by private initiatives (Table 1). Figure 5 shows the percentage of planning permits that were not developed, partly developed (S.S.: 80%), and fully developed for each analysis interval. Figure 6 illustrates the number of years required for planning permits to be fully developed between 1958 and 2018. Both figures reveal an unbridled urbanization process (inherent in land and real estate speculative processes), which did not have an equivalent demand, compromising the execution of planning permits. Despite the mismatch between supply and demand, the promoters’ strategy was to obtain planning permits to attract capital gains and consolidate construction rights, even if they were not accomplished.
As indicated in Figure 5, most of the planning permits in the study area were approved between 1972 and 1995. Figure 5 also shows that it was during this period that the greatest gap between the percentage of planning permits approved, and the percentage of planning permits partly/fully developed occurred. In addition, Figure 6 indicates that approximately half of the planning permits in the study area took between 5 and 15 years to become fully developed. We should point out that 13% of the planning permits took between 20 and 25 years to become fully developed. These findings reveal that the land-use transformation by planning permits was a slow process, suggesting a land speculation process. This land speculation process points to a trend in which landowners voluntarily left their land uncultivated, looking for favorable urban development circumstances that were largely triggered by the tourism potential of the municipality. As a result, the increasing interstitial open areas of the main urban areas clearly acquired the status of ‘expectant’ land, and the city grew in a diffuse manner (Figure 3d and Figure 4a,b).
To further analyze the effect of private initiatives on LULC change, we explored the percentage of urban permits of the inner city, inner ring, and outer ring over the study period (Figure 7). The ‘inner city’ was defined to include all areas within 2 km of the downtown area center. The ‘inner ring’ was defined to be those areas within 2–4 km of the downtown area center. The ‘outer ring’ was defined to be those areas that are 4 km away from downtown. Changes in the number of planning permits resemble those in the urban expansion process. As Figure 7 illustrates, the planning permits dynamic was very similar at the beginning and the end of the study period. However, between these time periods, there were important fluctuations. The maximum urban expansion cycle occurred between 1987 and 1995 and was related to the maximum increase in the number of planning permits, specifically in the inner and outer rings. Between 1995 and 2000, a major deceleration cycle of urban expansion occurred, connected with the decrease in the number of planning permits throughout the study area. The recovery of urbanization that followed between 2000 and 2010, much slower than the previous urban expansion cycle, was linked to both the urban densification and infilling of the inner city. In the period from 2010 to 2018, a second deceleration cycle of urban expansion occurred, which was, however, less significant in percentage terms. This was related to a downward trend in the number of planning permits across the study area, triggered by the 2008 economic crisis.
In order to reverse the diffuse urbanization process of the municipality, the primary focus of Portimão´s Municipal Master Plan was to (i) promote the consolidation and densification of existing urban areas; (ii) promote the urban renewal of both the core area and suburban areas; (iii) create protected areas including RAN and REN; (iv) preserve rural areas through the definition of sparsely developed rural zones; (v) develop well-planned comprehensive urban areas for future growth; (vi) promote tourism supply renewal through the definition of areas for high-quality tourism development (mostly based on medium-density development and 5-star hotels); and (vii) control future urban growth on the narrow coastal area. Notwithstanding, Portimão´s Municipal Master Plan (as with most Portuguese Municipal Master Plans) promoted oversized urban perimeters, with a high supply of buildable land.
Under the Municipal Master Plan’s framework, by 2020, ten urban land-use plans (specifically the urban land-use plans of ‘Zona Ribeirinha 2006’, ‘Escampadinho 2007’, ‘Alto do Poço e Alvor 2007’, ‘Praia do Vau e Prainha 2008’, ‘Morgado do Reguengo 2008’, ‘Barranco do Rodrigo 2008’, ‘Taipas 2009’, ‘Horta do Palácio 2011’, ‘Quinta da Praia—Alvor 2011’, and ‘Quinta do Malheiro 2020’) covering nearly 1300 hectares were approved. They aimed at renewing existing urban areas and reinforcing the tourism component of the municipality. However, as we can see from Table 1 and Figure 4a–c, the effects of this sensible municipal-level intervention were not as effective as intended and actually triggered unexpected effects. Table 1 shows that between 1995 and 2000, approximately 20% of LULC change was located within areas excluded from development. In the 2000–2010 period, this percentage was approximately 13%, and in the 2010–2018 period, it was 31.4%. LULC change—primarily into discontinuous urban fabric, sparsely discontinuous urban fabric, and other artificial surfaces—conflicted with the protected/restricted areas defined by the Municipal Master Plan. In addition, Table 1 shows that there was little change to the vertical urban fabric in areas proposed for development by the Municipal Master Plan and urban land-use plans, unlike what happened in the previous period controlled by guiding plans. Table 1 also reveals that between 2010 and 2018, 36% of the total LULC change occurred outside urban proposed areas. Moreover, nearly 32% of the total LULC change occurred within areas excluded from development. We can see that these LULC change dynamics are mostly based on the horizontal urban fabric, discontinuous urban fabric, and other artificial surfaces that seem to escape the control of mandatory plans.
The Municipal Master Plan of Portimão is still in line with the first generation of Municipal Master Plans—with almost thirty years. Although the Municipal Master Plan had a ten-year time horizon, it is still valid and is undergoing a revision process that was initiated in 2008. By 2018, the percentage of executed buildable land was much lower than planned—approximately fifty percent. On the other hand, Portimão´s municipality is already in breach of Regulatory Law No. 15/2015 of 19 August on the disappearance of the buildable type-land and the need to change accordingly both the land classification and reclassification in the municipality planning map. It should be noted that municipalities had to make this change by 2020, and now the deadline has been postponed until 2023. While the Municipal Master Plan is outdated and it does not proceed with the urban perimeters’ contraction, the extensive development model will continue as the dominant development model on the territory with high-density urban areas mainly along the coast.

3.2. Analysis of the Expected LULC Change under the Control of Mandatory Plans

Figure 8 represents the spatial patterns of expected LULC change in Portimão for 2047 and respective policy areas. According to the CAMLucc model results, two processes will govern Portimão’s LULC change: a self-organization process and a planned LULC transformation process. For 2047, we can expect changes to the vertical urban fabric, discontinuous urban fabric, and other artificial surfaces to be mostly located within existing planned urban areas (Figure 8). This may indicate that the land-use planning policies will influence future LULC change, especially towards the compact city model, by the densification of existing urban areas. This seems to be in line with the current Regulatory Law No. 15/2015 hypotheses for urban evolution, i.e., urban infill development, urban renewal, and urban regeneration. On the other hand, there will be hardly any LULC change in areas excluded from development (2.9%). This is mainly because the CAMLucc’s focus was to let the land show its intrinsic urban suitability according to the several spatial determinants and constraint rules used. Consequently, we expect that protected/restricted areas will experience minimal urban development. During the 2018–2047 period, changes to the sparsely discontinuous urban fabric and other artificial surfaces will be dominant beyond urban planned areas (Table 1 and Figure 8a). These ‘hotspots’ of unplanned urban development predicted by the CAMLucc model may assist in fine-tuning spatial policies as well supporting their further analysis.

4. Discussion

Our analysis of the effectiveness of spatial planning policies on Portimão’s LULC change reveals that most LULC changes were not dominant in urban areas proposed by the several urban land-use plans over the study period. These findings are in line with other empirical studies showing the limited effectiveness of land-use planning in conducting the development of metropolitan areas in Portugal [25] or large, complex, and densely populated environments in Israel [40]. Indeed, this indicates that spatial planning practices and processes are complex, and their outcomes are constrained by, namely, a certain level of inertia in the spatial planning system [22], demanding and lengthy construction processes [25], and ever-changing economic, social, and environmental circumstances [18,40,41,42].
According to our results, most LULC changes—especially into discontinuous urban fabric, sparsely discontinuous urban fabric, and other artificial surfaces—occurred outside proposed urban areas in a dispersed manner, seeming to escape the control of mandatory plans. The comparative analysis allowed us to observe that urban development in the municipality tended towards self-organization, generated by its own internal dynamics. The current LULC change in Portimão indicates that the land-use planning policies have been overcome by private initiatives (i.e., between 2000 and 2010, nearly 57% of the total LULC change occurred within planning permit areas). The results show that planning permits have played, for many years, a major role in Portimão’s LULC change, which was mainly governed by private agents’ dynamics.
Our findings also reveal that the several spatial planning policies had limited effectiveness in restraining the emergence of dispersed patterns of artificial surfaces and are consistent with the literature regarding a lack of efficient spatial planning on urban sprawl [19,25,26,43,44]. These findings appear more disquieting when confronted with results from previous research showing the discrepancy between population trends and urban growth dynamics worldwide [26,45] and particularly in Mediterranean countries [2,18,19]. Current policies in Portugal are more restrictive in their strategic visions and already address these contradictory dynamics, which are clear signs that the Portuguese government wishes to accomplish the compact city paradigm. For example, the 2015 Regulatory Law eliminated the buildable land type in the municipalities’ planning maps. However, the Portimão municipality, as most Portuguese municipalities, is still in breach of this specific regulatory law. This absence of explicit implementation is an important aspect that may further influence (negatively) an effective sustainable land-use planning [18]. Even though the population is likely to maintain low growth rates in the study area, Portimão is still a coastal area under great tourism and urban pressure. This, together with its outdated Municipal Master Plan, ensures that the extensive development model still prevails in the territory.
Moreover, our spatial analysis has revealed past urban change trends that conflict with planned zoning, as well as ‘hotspots’ of unplanned urban development. We identified LULC change—primarily into discontinuous urban fabric, sparsely discontinuous urban fabric, and other artificial surfaces—within protected/restricted areas. The ineffectiveness of the Municipal Master Plans, RAN, and REN in limiting urbanization within restricted areas was also acknowledged in comprehensive case studies conducted by Concepción [46], Mingarro and Lobo [12], Abrantes et al. [25], Silva and Clarke [47], and Padeiro [48]. As reported by Daunt et al. [26], if development continues to occur within these areas, the efficiency regarding LULC stability and both agricultural and forest protection is expected to decrease in the near future. We also identified that from 2010 to 2018, nearly 40% of the total LULC change occurred outside proposed urban areas. This result suggests that there seems to be a relationship between the 2008 economic crisis and informal urban growth, a trend that is contradictory to what occurred in the analysis interval prior to the 2008 crisis.
It is important to stress that we did observe, however, that the land-use planning policies were very effective on LULC change—more specifically, on changes to vertical urban fabric—in certain analysis periods controlled by guiding plans. This is an interesting result that suggests that even old and guiding land-use plans can be efficient enough to foster the desired LULC change. The capacity of spatial planning policies to promote the planned urban LULC change has been also demonstrated in Italy [18], the Netherlands [22], and Brazil [26].
In terms of future LULC change dynamics, our analysis also indicates that we can expect land-use planning policies to have a great effect on future LULC change—particularly on changes to the vertical urban fabric, discontinuous urban fabric, and other artificial surfaces—especially towards the densification of existing urban areas, which is overtly in line with the compact city paradigm, which has been a key concern for Portuguese spatial planning in recent decades [25,34] and worldwide ([49,50], among others). However, are there other ongoing urbanization processes in the study area due to political choices or other different socioeconomic and historical reasons? For instance, our results show that during the 2010–2018 period, changes to the vertical urban fabric were dominant outside planned urban areas (Table 1 and Figure 4c). A further interval analysis (e.g., 2021–2031) would be useful to better underline this possible ongoing verticalization process outside traditional areas.
There are two weaknesses in the LULC data definition of our research. Firstly, the analysis intervals were set on the basis of available aerial imagery for the study area, leading to unequal intervals of analysis. Secondly, the year 2018, which is already outdated, was assigned as the starting point to perform the prediction of the LULC maps. More research including LULC data for a recent period will be necessary for a more robust analysis and discussion of the simulations for the year 2047. This study represents an early attempt to systematically compare observed changes in LULC with the past, current, and future planning rules using a unique LULC database with high-level precision and a long-term duration (encompassing nearly 100 years of LULC change in Portimão), and a detailed classification scheme for land. Accordingly, our approach provided very rich and actionable data on the long-term LULC structural evolution of the study area, thus overcoming the referred limitations.
Our assessment method has been successfully applied to analyze the effectiveness of spatial planning policies on LULC change in Portimão and predict its LULC change. This method seems to be sufficiently straightforward to be replicated and used in other urban and tourist regions. However, urban development cycles depend on time and historical events that can be disruptive (i.e., 2008 economic crisis, COVID-19 pandemic). Future research should be devoted to exploring the results that we would obtain if our approach was applied to all Portuguese coastal municipalities. Reading the history from long-term LULC data may be very important to generate public policies that target the achievement of urban sustainability goals and a circular economy in cities to induce more sustainable LULC change trends.

5. Conclusions

This article highlights the value of assessing the effectiveness of spatial planning policies on LULC change to provide crucial insights into both the long-term LULC change processes and their possible futures. The used GIS-based analysis of past LULC changes and CA-based future LULC simulation method enable straightforward comparisons between the actual LULC change, the future LULC change simulation generated by CAMLucc, and the planning practices of the municipality. This comparative analysis delivers significant quantitative and spatially explicit results for a detailed evaluation of (i) the effects of spatial planning policies on past (and expected) LULC change in Portimão, and (ii) the discrepancies between planning recommendations and observed LULC transformations in the study area. The originality of this research is to use a unique LULC database with a high of level precision and long-term duration and a detailed classification scheme for land—including low-density residential land-use categories—which reinforce the relevance of our experiments. We provide a detailed description of our approach to ensure its possible reproduction and transposition to other geographic situations. LULC change and urban growth are complex and dynamic processes that result from several political, economic, and social factors and present unprecedented challenges both for society and the environment. This article concludes by calling for researchers to reproduce the methodology herein provided to determine whether applying the same approach to other coastal municipalities in the country or in Europe generates similar outcomes, namely similar cycles of urban expansion and decay as illustrated in Figure 7.

Author Contributions

Conceptualization, R.F.d.D., J.A.T. and D.P.; methodology, R.F.d.D., J.A.T., D.P. and J.R.; formal analysis, R.F.d.D., J.A.T., D.P., J.R. and M.P.; research, R.F.d.D.; writing—original draft preparation, R.F.d.D.; writing—review and editing, R.F.d.D., J.A.T., D.P., J.R. and M.P.; supervision, J.A.T. and D.P.; funding acquisition, R.F.d.D. and J.A.T. All authors have read and agreed to the published version of the manuscript.

Funding

This work is financed by national funds through the FCT—Foundation for Science and Technology, I.P., within the scope of the project “UIDB/04647/2020” of CICS.NOVA—Interdisciplinary Centre of Social Sciences of Universidade Nova de Lisboa. The first author was financed by the FCT, under the Norma Transitória—DL 57/2016/CP1453/CT0105 and by grant number SFRH/BD/61544/2009. This work is also carried out at the R&D Unit Centre for Functional Ecology—Science for People and the Planet (CFE), with reference UIDB/04004/2020, financed by FCT/MCTES through national funds (PIDDAC).

Institutional Review Board Statement

Not applicable.

Informed Consent Statement

Not applicable.

Data Availability Statement

Data sharing is not applicable to this article. LULC data were produced by the first author.

Acknowledgments

The authors would like to thank the anonymous reviewers for their insightful comments and crucial reviews on an earlier version of this article.

Conflicts of Interest

The authors declare no conflict of interest. The funders had no role in the design of the study; in the collection, analyses, or interpretation of data; in the writing of the manuscript; or in the decision to publish the results.

References

  1. Tenedório, J.A. Télédétection, Systèmes d’information Géographique et Suivi de l’étalement Périurbain Dans l’aire Métropolitaine de Lisbonne (Remote Sensing and Geographical Information Systems: Monitoring the Urban Fringe Expansion of the Lisbon Metropolitan Area). Bull. L’association Géogr. Fr. 2001, 78, 66–77. [Google Scholar] [CrossRef]
  2. Faria de Deus, R.; Tenedório, J.A. Coastal Land-Use and Land-Cover Change Trajectories: Are They Sustainable? Sustainability 2021, 13, 8840. [Google Scholar] [CrossRef]
  3. Lambin, E.F.; Geist, H.J. Land-Use and Land-Cover Change: Local Processes and Global Impacts; Springer: Berlin/Heidelberg, Germany, 2006. [Google Scholar]
  4. Rojas, C.; Pino, J. Assessing Land-Use and -Cover Changes in Relation to Geographic Factors and Urban Planning in the Metropolitan Area of Concepción (Chile). Implications for Biodiversity Conservation. Appl. Geogr. 2013, 39, 93–103. [Google Scholar] [CrossRef]
  5. Rogan, J.; Chen, D. Remote Sensing Technology for Mapping and Monitoring Land-Cover and Land-Use Change. Prog. Plan. 2004, 61, 301–325. [Google Scholar] [CrossRef]
  6. Moulds, S.; Buytaert, W.; Mijic, A. A Spatio-Temporal Land Use and Land Cover Reconstruction for India from 1960–2010. Sci. Data 2018, 5, 180159. [Google Scholar] [CrossRef]
  7. Mäyrä, J.; Kivinen, S.; Keski-Saari, S.; Poikolainen, L.; Kumpula, T. Utilizing Historical Maps in Identification of Long-Term Land Use and Land Cover Changes. Ambio 2023. [Google Scholar] [CrossRef]
  8. Sourn, T.; Pok, S.; Chou, P.; Nut, N.; Theng, D.; Rath, P.; Reyes, M.R.; Prasad, P.V.V. Evaluation of Land Use and Land Cover Change and Its Drivers in Battambang Province, Cambodia from 1998 to 2018. Sustainability 2021, 13, 11170. [Google Scholar] [CrossRef]
  9. Fathizad, H.; Tazeh, M.; Kalantari, S.; Shojaei, S. The Investigation of Spatiotemporal Variations of Land Surface Temperature Based on Land Use Changes Using NDVI in Southwest of Iran. J. Afr. Earth Sci. 2017, 134, 249–256. [Google Scholar] [CrossRef]
  10. Leta, M.K.; Demissie, T.A.; Tränckner, J. Modeling and Prediction of Land Use Land Cover Change Dynamics Based on Land Change Modeler (LCM) in Nashe Watershed, Upper Blue Nile Basin, Ethiopia. Sustainability 2021, 13, 3740. [Google Scholar] [CrossRef]
  11. Radwan, T.M.; Blackburn, G.A.; Whyatt, J.D.; Atkinson, P.M. Global Land Cover Trajectories and Transitions. Sci. Rep. 2021, 11, 12814. [Google Scholar] [CrossRef]
  12. Mingarro, M.; Lobo, J.M. European National Parks Protect Their Surroundings but Not Everywhere: A Study Using Land Use/Land Cover Dynamics Derived from CORINE Land Cover Data. Land Use Policy 2023, 124, 106434. [Google Scholar] [CrossRef]
  13. Matlhodi, B.; Kenabatho, P.K.; Parida, B.P.; Maphanyane, J.G. Analysis of the Future Land Use Land Cover Changes in the Gaborone Dam Catchment Using CA-Markov Model: Implications on Water Resources. Remote Sens. 2021, 13, 2427. [Google Scholar] [CrossRef]
  14. Hersperger, A.M.; Oliveira, E.; Pagliarin, S.; Palka, G.; Verburg, P.; Bolliger, J.; Grădinaru, S. Urban Land-Use Change: The Role of Strategic Spatial Planning. Glob. Environ. Chang. 2018, 51, 32–42. [Google Scholar] [CrossRef]
  15. UN DESA. The Sustainable Development Goals Report 2022; Statistics, Sustainable Development; UN DESA: New York, NY, USA, 2022. [Google Scholar]
  16. Stead, D.; Nadin, V. Spatial Planning. Key Instrument for Development and Effective Governance with Special Reference to Countries in Transition; United Nations Economic Commission for Europe; United Nations: Geneva, Switzerland, 2008.
  17. Koomen, E.; Rietveld, P.; de Nijs, T. Modelling Land-Use Change for Spatial Planning Support. Ann. Reg. Sci. 2008, 42, 1–10. [Google Scholar] [CrossRef]
  18. Amato, F.; Maimone, B.A.; Martellozzo, F.; Nolè, G.; Murgante, B. The Effects of Urban Policies on the Development of Urban Areas. Sustainability 2016, 8, 297. [Google Scholar] [CrossRef]
  19. Domingo, D.; Palka, G.; Hersperger, A.M. Effect of Zoning Plans on Urban Land-Use Change: A Multi-Scenario Simulation for Supporting Sustainable Urban Growth. Sustain. Cities Soc. 2021, 69, 102833. [Google Scholar] [CrossRef]
  20. Carter, J.G. Urban Climate Change Adaptation: Exploring the Implications of Future Land Cover Scenarios. Cities 2018, 77, 73–80. [Google Scholar] [CrossRef]
  21. Domingo, D.; van Vliet, J.; Hersperger, A.M. Long-Term Changes in 3D Urban Form in Four Spanish Cities. Landsc. Urban Plan. 2023, 230, 104624. [Google Scholar] [CrossRef]
  22. Koomen, E.; Dekkers, J. The Impact of Land-Use Policy on Urban Fringe Dynamics. In Cities and Nature; Springer: Berlin/Heidelberg, Germany, 2013; pp. 9–35. ISBN 978-3-642-40199-2. [Google Scholar]
  23. Erickson, D.L. Rural Land Use and Land Cover Change: Implications for Local Planning in the River Raisin Watershed. Land Use Policy 1995, 12, 223–236. [Google Scholar] [CrossRef]
  24. Wang, C.; Wang, Y.; Wang, R.; Zheng, P. Modeling and Evaluating Land-Use/Land-Cover Change for Urban Planning and Sustainability: A Case Study of Dongying City, China. J. Clean. Prod. 2018, 172, 1529–1534. [Google Scholar] [CrossRef]
  25. Abrantes, P.; Fontes, I.; Gomes, E.; Rocha, J. Compliance of Land Cover Changes with Municipal Land Use Planning: Evidence from the Lisbon Metropolitan Region (1990–2007). Land Use Policy 2016, 51, 120–134. [Google Scholar] [CrossRef]
  26. Daunt, A.B.P.; Inostroza, L.; Hersperger, A.M. The Role of Spatial Planning in Land Change: An Assessment of Urban Planning and Nature Conservation Efficiency at the Southeastern Coast of Brazil. Land Use Policy 2021, 111, 105771. [Google Scholar] [CrossRef]
  27. Faria de Deus, R. GIS-Based Measurement, Analysis and Modelling of Land-Use and Land-Cover Change in Coastal Areas. The Case of the Algarve-Portugal. Ph.D. Thesis, Universidade Nova de Lisboa, Lisbon, Portugal, 2015. [Google Scholar]
  28. Santos, T.; Deus, R.; Rocha, J.; Tenedório, J.A. Assessing Sustainable Urban Development Trends in a Dynamic Tourist Coastal Area Using 3D Spatial Indicators. Energies 2021, 14, 5044. [Google Scholar] [CrossRef]
  29. Statistics Portugal. Statistics Portugal Population and Housing Census 2021; Statistics Portugal: Lisbon, Portugal, 2021.
  30. Statistics Portugal. Statistic Portugal Projections of Resident Population in Portugal 2018–2080; Statistics Portugal: Lisbon, Portugal, 2020.
  31. Statistics Portugal. Statistics Portugal Population and Housing Census 2011; Statistics Portugal: Lisbon, Portugal, 2011.
  32. Statistics Portugal. Statistics Portugal Population and Housing Census 2001; Statistics Portugal: Lisbon, Portugal, 2001.
  33. Statistics Portugal. Statistics Portugal Population and Housing Census 1991; Statistics Portugal: Lisbon, Portugal, 1991.
  34. Faria de Deus, R.; Tenedório, J.A.; Moix Bergadà, M. Urban Sprawl in Portugal Based on Urban Systems Spatial Boundaries. ACE 2012, 7, 131–148. [Google Scholar] [CrossRef]
  35. SNIG. National Geographic Information Infrastructure Portugal 2022; SNIG, Direção-Geral do Território: Lisbon, Portugal, 2022. [Google Scholar]
  36. de Deus, R.F.; Tenedório, J.A.; Rocha, J. Modelling Land-Use and Land-Cover Changes: A Hybrid Approach to a Coastal Area. In Methods and Applications of Geospatial Technology in Sustainable Urbanism; Tenedório, J.A., Estanqueiro, R., Henriques, C.D., Eds.; IGI Global: Hershey, PA, USA, 2021; pp. 57–102. ISBN 978-1-79982-249-3. [Google Scholar]
  37. Eastman, J.R.; Jiang, H.; Toledano, J. Multi-Criteria and Multi-Objective Decision Making for Land Allocation Using GIS. In Multicriteria Analysis for Land-Use Management; Beinat, E., Nijkamp, P., Eds.; Springer: Dordrecht, The Netherlands, 1998; pp. 227–251. ISBN 978-94-015-9058-7. [Google Scholar]
  38. Cohen, J. A Coefficient of Agreement for Nominal Scales. Educ. Psychol. Meas. 1960, 20, 37–46. [Google Scholar] [CrossRef]
  39. van den Berg, L.; Drewett, R.; Lh, K.; Rossi, A.; Cht, V. Urban Europe: A Study of Growth and Decline; Pergamon: Oxford, UK, 1982. [Google Scholar]
  40. Alfasi, N.; Benenson, I.; Almagor, J. The Actual Impact of Comprehensive Land-Use Plans: Insights from High Resolution Observations. Land Use Policy 2012, 29, 862–877. [Google Scholar] [CrossRef]
  41. Ferreira, J.A.; Condessa, B.; Castro e Almeida, J.; Pinto, P. Urban Settlements Delimitation in Low-Density Areas—An Application to the Municipality of Tomar (Portugal). Landsc. Urban Plan. 2010, 97, 156–167. [Google Scholar] [CrossRef]
  42. Abrantes, P.; Marques da Costa, E.; Queirós, M.; Padeiro, M.; Mousselin, G. Lezíria Do Tejo: Agriculture et Étalement Urbain Aux Marges Métropolitaines de Lisbonne. Cah. Agric. 2013, 22, 526–534. [Google Scholar] [CrossRef]
  43. Wu, Y.; Fan, P.; Li, B.; Ouyang, Z.; Liu, Y.; You, H. The Effectiveness of Planning Control on Urban Growth: Evidence from Hangzhou, China. Sustainability 2017, 9, 855. [Google Scholar] [CrossRef]
  44. Hewitt, R.; Escobar, F. The Territorial Dynamics of Fast-Growing Regions: Unsustainable Land Use Change and Future Policy Challenges in Madrid, Spain. Appl. Geogr. 2011, 31, 650–667. [Google Scholar] [CrossRef]
  45. Dutta, V. Land Use Dynamics and Peri-Urban Growth Characteristics Reflections on Master Plan and Urban Suitability from a Sprawling North Indian City. Environ. Urban. Asia 2012, 3, 277–301. [Google Scholar] [CrossRef]
  46. Concepción, E.D. Urban Sprawl into Natura 2000 Network over Europe. Conserv. Biol. 2021, 35, 1063–1072. [Google Scholar] [CrossRef]
  47. Silva, E.A.; Clarke, K.C. Complexity, Emergence and Cellular Urban Models: Lessons Learned from Applying SLEUTH to Two Portuguese Metropolitan Areas. Eur. Plan. Stud. 2005, 13, 93–115. [Google Scholar] [CrossRef]
  48. Padeiro, M. The Influence of Transport Infrastructures on Land-Use Conversion Decisions within Municipal Plans. JTLU 2014, 7, 79–93. [Google Scholar] [CrossRef]
  49. Zitti, M.; Ferrara, C.; Perini, L.; Carlucci, M.; Salvati, L. Long-Term Urban Growth and Land Use Efficiency in Southern Europe: Implications for Sustainable Land Management. Sustainability 2015, 7, 3359–3385. [Google Scholar] [CrossRef]
  50. Zambon, I.; Serra, P.; Pili, S.; Bernardini, V.; Ferrara, C.; Salvati, L. A New Approach to Land-Use Structure: Patch Perimeter Metrics as a Spatial Analysis Tool. Sustainability 2018, 10, 2147. [Google Scholar] [CrossRef]
Figure 1. Study area of this research. Source of geospatial data: © EuroGeographics for the administrative boundaries available for free at www.eurogeographics.org (accessed on 1 November 2022). Licensing terms are available at https://eurogeographics.org/maps-for-europe/open-data/topographic-data (accessed on 1 November 2022).
Sustainability 15 07636 g001
Figure 2. Planning models established by the municipality of Portimão (a) and planning permits promoted by private initiatives (b) between 1942 and 2022.
Sustainability 15 07636 g002
Figure 3. Spatial patterns of LULC change in Portimão within (a) 1958–1968, (b) 1968–1972, (c) 1972–1987, and (d) 1987–1995, and policy areas.
Sustainability 15 07636 g003
Figure 4. Spatial patterns of LULC change in Portimão within (a) 1995–2000), (b) 2000–2010, and (c) 2010–2018, and policy areas.
Sustainability 15 07636 g004
Figure 5. Percentage of non-developed, partly developed, and fully developed planning permits in Portimão by analysis intervals.
Sustainability 15 07636 g005
Figure 6. Number of years required for planning permits to be fully developed from 1958 to 2018.
Sustainability 15 07636 g006
Figure 7. Percentage of urban permits of the inner city, inner ring, and outer ring over the study period (figure inspired by van den Berg et al. [39]).
Sustainability 15 07636 g007
Figure 8. Spatial patterns of expected LULC change in Portimão for 2047 and policy areas. The Figure 8a shows the main urban zone of Portimão city in more detail.
Sustainability 15 07636 g008
Table 1. LULC change for the policy areas (unit: %).
Period TUVTUHTUDTUDEOAATotal LULC Change
1958–1968Within urban land-use plans 163.329.017.27.26.710.5
Within planning permits 24.63.48.612.759.841.8
Outside urban proposed32.263.271.474.730.844.6
Areas excluded from development0.04.52.85.52.73.1
1968–1972Within urban land-use plans64.621.010.50.02.14.3
Within planning permits0.00.030.535.08.818.6
Outside urban proposed25.979.059.065.088.576.6
Areas excluded from development9.50.00.00.00.60.5
1972–1987Within urban land-use plans66.623.17.53.420.916.9
Within planning permits10.818.353.09.517.927.4
Outside urban proposed9.650.233.384.752.848.5
Areas excluded from development12.98.46.22.48.47.2
1987–1995Within urban land-use plans44.79.17.20.315.814.0
Within planning permits39.547.457.119.930.237.6
Outside urban proposed4.737.733.175.846.442.2
Areas excluded from development11.15.82.64.07.66.2
1995–2000Within urban land-use plans + MMP21.428.015.67.716.215.9
Within planning permits53.357.674.030.416.329.0
Outside urban proposed25.37.87.236.142.835.2
Areas excluded from development0.06.63.225.824.819.9
2000–2010Within urban land-use plans + MMP8.315.315.40.820.817.2
Within planning permits75.349.154.470.654.256.7
Outside urban proposed16.024.913.014.812.012.8
Areas excluded from development0.510.717.313.813.013.3
2010–2018Within urban land-use plans + MMP1.34.216.51.819.214.6
Within planning permits22.862.549.66.512.818.0
Outside urban proposed68.429.222.647.332.436.0
Areas excluded from development7.64.211.344.435.631.4
2018–2047 3Within urban land-use plans + MMP46.443.473.034.452.451.6
Within planning permits41.652.624.66.56.311.4
Outside urban proposed11.62.61.758.237.334.2
Areas excluded from development0.41.30.70.84.02.9
1 LULC change within areas proposed for urban development by urban land-use plans; 2 LULC change within areas proposed for urban development by planning permits; 3 LULC change forecasted by the CAMLucc model.
Disclaimer/Publisher’s Note: The statements, opinions and data contained in all publications are solely those of the individual author(s) and contributor(s) and not of MDPI and/or the editor(s). MDPI and/or the editor(s) disclaim responsibility for any injury to people or property resulting from any ideas, methods, instructions or products referred to in the content.

