Abstract
Plastic debris is a significant problem aesthetically, environmentally, and across food chains. Hence it is important to increase understanding of the mechanisms of how this debris is distributed and potentially managed, especially in areas such as Africa with relatively large populations and poor infrastructure. Debris can be derived from local sources (such as the resident population) or from further afield via wind or ocean currents. We investigated these by systematically measuring debris density in sites on land and on coastal sites in three regions around Africa (Cape Town, Durban and Mombasa), and compared these between and within regions. We then compared them to simulated flows of debris on currents in the surrounding ocean to hypothesize likely sources of debris. Comparisons of relative quantity and makeup of inland and coastal debris suggested different patterns at different sites. We expected the Agulhas Current (coming from Indian Ocean and east coast Africa) to be a strong source of debris and therefore have a strong effect on the arrival of debris in eastern coastal sites, and the Benguela Current (from the southern Atlantic Ocean) to have a weaker effect. However, the evidence collected here seemed mixed in support of this and was greater in support of debris coming predominantly from local sources.
1. Introduction
Plastic pollution has been recognized as a substantial economic, environmental and social problem with consequences to coastal tourism [,], coastal and marine megafauna [,] and potentially to human health []. At the same time, plastic in the ocean appears to be increasing, proportionate to cumulative plastic production []. Plastic pollution is a global, transboundary problem []. It is found on all continents and in all oceans [], and can readily move across borders after it is littered or otherwise lost to the environment. Plastic can move by wind or ocean currents [], along transportation corridors, or be carried by animals []. In addition, plastic waste has historically been transported from higher income countries to lower income countries for recycling and/or disposal [].
To understand the mechanisms that govern the distribution of plastic pollution, measuring environmental concentrations at a range of locations both within and between countries is useful. However, there are challenges in comparing across geopolitical boundaries and the drivers behind patterns observed in the environment may not be the same within all parts of a country, much less between countries. Plastic density can be affected by a number of different factors, including socio-economic, environmental, legal, and social [].
The challenges of waste management are particularly relevant in the continent of Africa, which has both the world’s fastest growing population and significant waste management challenges []. Differences in environment, culture, and legislation can be important, and these may operate at a number of scales, from local to provincial to national. At a national scale, plastic bag bans have been the most commonly implemented form of waste control in Africa []. On a provincial level, policies and regulations may vary in terms of whether and how waste in the environment is collected, recycling is carried out, and whether public areas (such as beaches) are cleaned. Governments are not the only entities that influence waste management. In many countries, civil groups conduct clean-up activities. For example, in 2020, International Coastal Cleanup events were held in Burundi, Cameroon, Egypt, Ghana, Kenya, Malawi, Morocco, Mozambique, Nigeria, Senegal, Sierra Leone, and South Africa []. Most often, such activities take place at popular beaches near city centres which are readily accessible to the public.
Environmental factors, including oceanic currents and prevailing wind, can also affect debris distribution, particularly in coastal sites []. Prevailing currents and wind can force debris to collect at points on the coast or disperse it. In southern Africa there are two main prevailing currents that could carry or disperse debris. The Agulhas current runs southward along the coast of east Africa, so we expect it might transport debris as it passes major cities such as Mogadishu, Mombasa, Dar es Salaam, Maputo, and Durban []. Conversely, the Benguela current, which runs northward along the western coast of Africa, originates from the Antarctic circumpolar current, and hence is less likely to transport plastic to southern Africa []. Hence, if plastic distributions along the coastline are predominately influenced by oceanic transport, we would expect to see higher levels of debris in Mombasa and Durban, along the east coast, than we would in Cape Town.
If debris distributions are most heavily influenced by local factors such as littering, we would expect to find similar types of debris littered in both coastal and inland areas, whereas ocean-borne debris would likely be different in both size and type to littered debris, as the processes governing its transport are different. Debris that has been resident in the ocean would tend to be smaller, as it breaks down over time [,].
Previous studies in South Africa have noted a correlation between pumice (naturally occurring ocean-borne object) and debris, suggesting that oceanic factors may have been a strong contributor to the variability of plastic found on local beaches [,], though recent work highlights local debris sources on South African beaches [].
In this paper we aim to describe the variability of debris in coastal areas in two southern African countries and discuss whether environmental or social factors are most likely to explain the patterns observed based on a rigorously designed survey of waste leakage in the environment.
2. Materials and Methods
2.1. Site Selection, Study Area and Survey Methodology
We selected survey areas in three regions of the east and south coasts of Africa: two in South Africa (Cape Town and Durban), and one in Kenya (Mombasa). In the Cape Town region, we surveyed an area roughly 350 km long and 50 km wide, extending from St. Helena Bay to Franskraal. The Durban sites were roughly 290 km long, between Prospecton and Mtunzini. Metropolitan and regional areas surrounding Mombasa, on Africa’s east coast, were used for comparison (Figure 1). We selected a region roughly 250 km long from the Tanzanian border to the town of Marereni, north of Malindi. Areas surveyed were based on a stratified random sampling approach [] taking into account accessibility, geography, time available for surveys, and other relevant factors. Hence, not all survey areas were identical. However, all analysis takes into account the number of surveys conducted within each survey region.
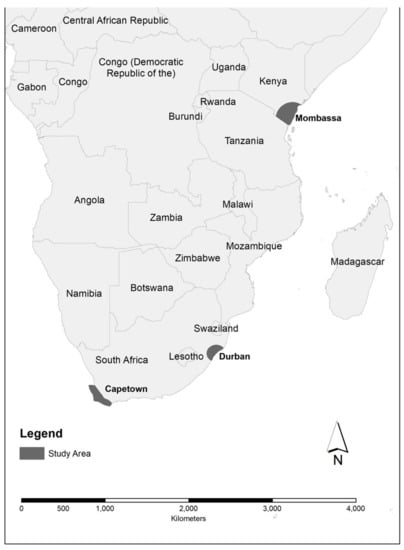
Figure 1.
Location of study sites in South Africa and Kenya.
We measured debris both at coastal sites and inland sites within a watershed to quantify the debris available to move to the coast. We used a consistent survey method across both inland and coastal sites (see detail in next paragraph). Information was recorded about the site’s accessibility, apparent cleanliness, and number of people present, as well as weather conditions, time of day, and details of the survey recorder. At coastal sites, aspect was also included as it has been shown to be an important factor associated with litter in the environment there [].
At each site, a minimum of three and a maximum of six transects were carried out. Coastal surveys were 2 m wide, with the length determined by the width of the shoreline (distance from the waterline to the backshore vegetation). For inland surveys, surveys were fixed at constant area of 25 m2, and dimensions were typically 12.5 m × 2 m, though in some instances (for safety) transect dimensions were 25 m × 1 m.
Coastal transects always began at the water’s edge and ran perpendicular to the shoreline until reaching two metres into the backshore vegetation. The starting point for inland transects was that which was closest to the GPS location identifying the site (pre-selected using a stratified random sampling design, prior to arriving at each site). Debris on transects was counted by two observers walking slowly next to each other, counting items from a standing vertical position. Each item of debris was classified into one of 86 categories and identified either as whole or fragment. For further detail, see [].
We compared the differences in type and frequency of debris at three coastal regions, while using inland sites as an input for these comparisons to determine the most likely reasons for observed differences. We used a Wilcoxon paired rank sum test and compared the magnitude of the differences in makeup using Cohen’s d.
In addition to conducting robust surveys within the surrounds of the three focal cities using a stratified random sampling design, we also utilized publicly available information from Ocean Conservancy’s International Coastal Cleanup (ICC) activities within those regions from 2012 to 2015. While ICC activities are not designed surveys, these activities provide important information about local engagement in clean-up activities around the world. Hence, we utilized ICC information to gauge local beach cleaning activity within and around the three focal cities.
2.2. Oceanographic Modelling of Debris Movement
We used oceanographic models to understand how debris is transported by ocean currents around Africa. We simulated the movement of particles to see where debris would likely accumulate along the African coast using an open-source particle tracking model (see below; CONNIE). The model simulation accounted for pathways and trajectories of particle movement and presumed passive drift of particles (for further detail see https://connie.csiro.au/, last accessed on 24 March 2022). This approach allows a user to evaluate particle movement in regions around the globe.
We modelled particles from two sources: particles derived from the African coast and particles derived 200 km offshore. This was done to examine where land-derived debris may move to and where debris from oceanic sources may arrive. There were two steps in modelling plastics movement in the oceans surrounding Africa. First, we ran an oceanographic model to simulate where a large number of particles (small items with no ability of their own to determine where they go) moved to when released into currents at evenly spaced locations around the coast of Africa.
We used open-source freeware oceanographic models CONNIE (https://connie.csiro.au/) and BRAN (https://research.csiro.au/bluelink/global/reanalysis/data-assimilation/, last accessed on 24 March 2022) [,]. Such models are frequently used to examine the dispersal of fish larvae or oil spills or other passively floating objects. Upon release, particles’ movements are simulated with their position recorded at regular intervals. By running time forward in models (forward projections), they can be used to identify where the particles go. By running time backwards (hindcast projections), they can identify where particles came from prior to arriving at a location.
A total of 1474 release points were created from the land interface of the coast around the entire continent of Africa, at approximately 25 km intervals. A second group of 1296 release points was created 200 km off the coast. Particles ‘released’ from each of these points were followed for 90 days after release. Positions of particles were recorded 10 times during each 24 h period. Releases were evenly spread over a 12-month period, with a total of 36,500 particles released. Releases were made both with and without wind effects. Predictions were made with no wind, as well as with light or strong winds.
Positions of particles were thinned by reducing the recording of positions to a single position/day and then by using every 100th particle’s track. The one position a day was justified as there were no tidal effects in the models used herein.
Secondly, we rasterised Africa into a matrix of squares for binning the positions of particles. Bins were 1/5 × 1/5 degrees (approximately 25 × 25 km), which was chosen to approximate the distance between release points. We then summed the matrices of particles coming from all release points, with particle numbers from each of the land release points weighted by the population in that area/1000.
3. Results
3.1. Debris on Transects
We conducted 105 coastal and 78 inland transects in Cape Town, 37 coastal and 84 inland in Durban, and 74 coastal and 160 inland transects in Mombasa.
We compared the density of debris on transects in coastal and inland areas of different cities (Figure 2). In Cape Town, the coastal load was approximately one quarter of that for inland areas in the Cape Town surrounds. In Durban, the coastal load was somewhat higher than inland sites surveyed near to Durban, and the Mombasa coastal load was substantially higher than the inland debris load within the Mombasa area (by approximately five times).
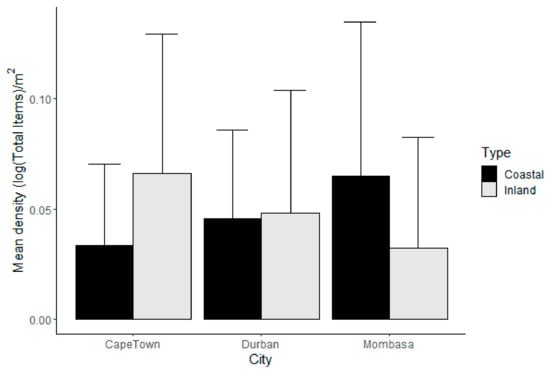
Figure 2.
The mean density of debris found in the coastal and inland transects in Cape Town, Durban and Mombasa.
Debris density was much higher at inland transects around Cape Town than it was for both Durban and Mombasa. However, debris loads in Cape Town were higher at inland transects (nearly double) compared to coastal litter loads. Inland transects in Cape Town were nearly double those in Durban, which were again twice as high as sites surveyed in Mombasa.
We compared the total counts of each type of debris found on transects at inland and coastal locations in the three cities (Figure 2 and Figure 3; Table 1). For whole items, unknown hard plastic, small beverage bottles, lollipop stick/ear buds, and bottle caps/lids were common in all areas while all other types of anthropogenic debris were observed in a variable order and combinations (Figure 3). For fragments, bottle caps, cigarette butts, and earbuds were common in all areas. Nurdles were very common at Durban but were not common at the other two locations (Figure 3).
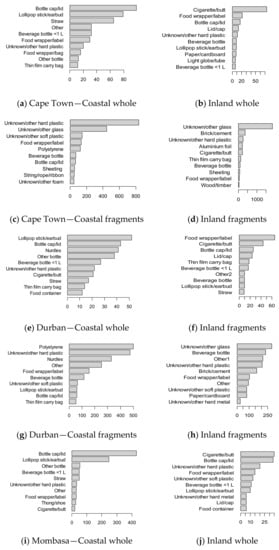
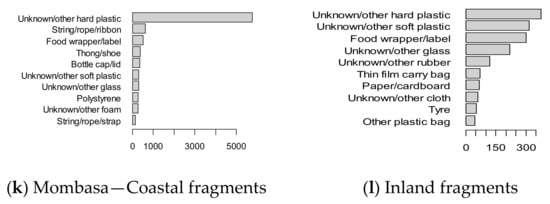
Figure 3.
Ten most abundant debris items (counts of whole items and fragments) recorded during coastal and inland transects around Cape Town, Durban or Mombasa. ((a–d) Cape Town; (e–h) Durban; (i–l) Mombasa).

Table 1.
Results of Wilcoxon paired rank sum test for comparison of debris collected from inland or coastal sites (Cohen’s d classification of effect sizes which is 0.1 (small effect), 0.3 (moderate effect) and 0.5 and above (large effect)). * indicates statistically significant outcome, ** indicates highly significant outcome (at p ≤ 0.01).
We compared the quantity of different debris types (both whole and fragments) found in coastal and inland transects using a Wilcoxon ranked sum test (Table 1). There is a large difference in proportions in the population for whole items in Cape Town and a moderate one for Mombasa, while for fragments, there is a small difference for all locations. The differences were greater in Cape Town than the other cities (Table 1 and Table 2).
Table 2.
Ratio of whole debris items recorded to fragments of debris and number of transects conducted for inland and coastal sites within each of the three city survey areas.
3.2. Where do Floating Particles Go?
Based on model projections using CONNIE, debris drifting from sources along the African coastline generally remained near larger populations, indicating much floating debris likely remains in the area from where it originated (Figure 4). This differed between the two South Africa survey sites, however: debris particles remained close to the shore in eastern South Africa (Durban), though a substantial quantity of particles drifted offshore to the north from western South Africa (Cape Town) (Figure 5).
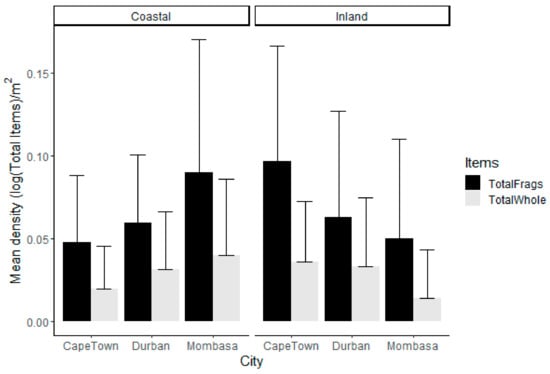
Figure 4.
The density of Fragments and Whole Items (in the log base 10 of items per m2) within each surveyed area.
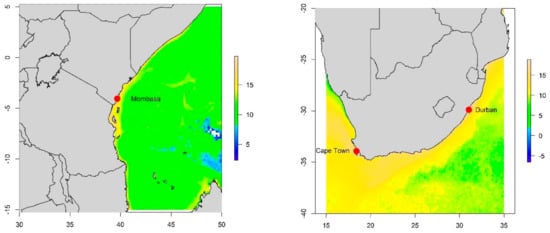
Figure 5.
Debris particles released from locations around the coast of Africa (each square weighted by the population of their origin and log-transformed). Blue indicates lower density and yellow indicates higher density of particles (see scale to right of each figure).
Particles released 200 km offshore collected on the coast near Mombasa in eastern Africa (Figure 6), as well as along the southern coast of South Africa, including around Durban.
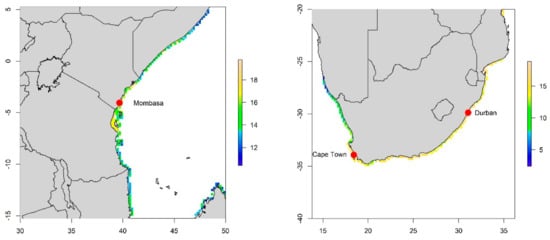
Figure 6.
Areas where offshore particles arrived within eastern Africa (left) and southern African (right) waters (each square weighted by the population of their origin and log-transformed). Red circles show cities where surveys took place. Blue indicates lower density and yellow indicates higher density of particles (see scale to right of each figure).
3.3. Do Community Clean Ups Happen near the Areas Surveyed?
International Coastal Cleanup (ICC) beach clean-up events took place at 160 beach sites in South Africa over the period 2012–2015 (Figure 7). Of these coastal clean ups, 99 were west of Cape Agulhas in south-western South Africa. Only eight were east of East London, and only one took place around Durban (and well away from our transects). Hence there was considerably more citizen-science led cleaning activity in the region of Cape Town. However, we are aware that litter and other anthropogenic debris is frequently collected from beaches in front of hotels in Mombasa [].
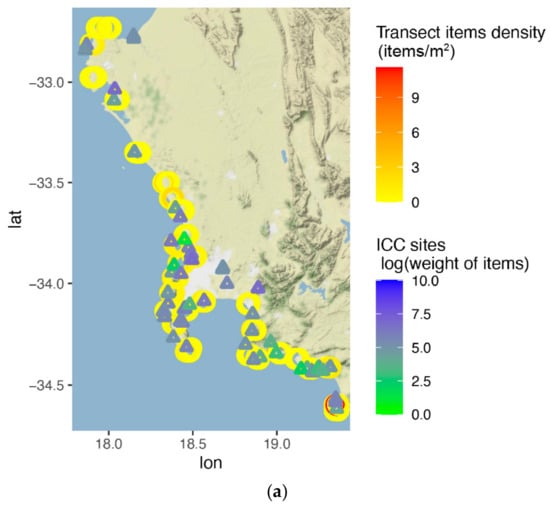
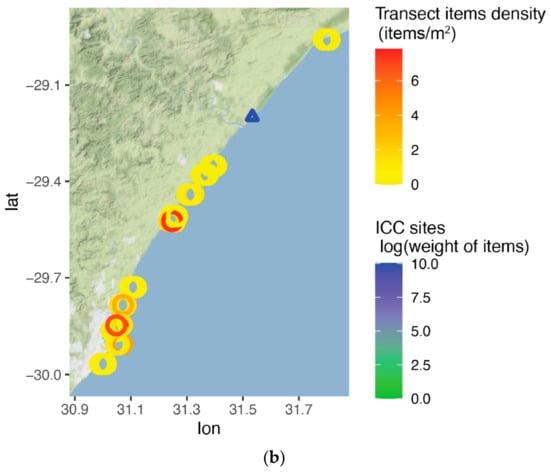
Figure 7.
Positions of Coastal Transects for Cape Town (a) and Durban (b). Transect locations are in circles with colour indicating density of debris recorded. Triangles show locations of ICC marine debris clean-up efforts.
4. Discussion
Designed surveys can provide useful information about plastic pollution—what influences where we find plastic? How do different regions compare? This information can help in designing the most effective interventions to reduce both land-based and marine plastics.
We hypothesized that debris observed at coastal sites can come predominately from local (land-based) sources, or via the ocean. Debris coming from local sources can either be deposited directly onto the coast or move from where it has been deposited at inland sources. Both sources would likely lead to a similar composition of debris at coastal sites. If most debris is derived locally, we would assume higher inland debris density would associate with similarly high debris densities on nearby coastal sites. We would also expect to see relatively similar distributions in terms of the item types. However, the survey results from more than 500 transects in and around three cities in southern and eastern Africa do not show this pattern. Cape Town has a relatively high inland density, but lower density on coastal sites, while in both Durban and Mombasa, the opposite is the case. The debris types are also very different between inland and coastal areas in Cape Town, and moderately different in Mombasa. There must be an alternative explanation; either more anthropogenic debris is arriving in Durban and Mombasa from the ocean, or less is being littered or moving to coast from inland sites near Cape Town. An alternative hypothesis is that local debris is being removed before it is being counted.
We expected the Agulhas Current (coming from the Indian Ocean and east coast Africa) to be a strong source of debris and therefore have a strong effect on the arrival of debris in eastern coastal sites, and the Benguela Current (from the southern Atlantic Ocean) to have a weaker effect. We do see higher levels of debris in both Durban and Mombasa than in Cape Town (Figure 1), providing some support for this hypothesis. However, assuming that Cape Town coastal sites are less influenced by ocean-borne debris, and more influenced by direct deposition, we would have also expected Cape Town coastal debris to be more similar in composition to nearby inland sites than for the other two cities. However, we found a greater difference between the distribution of both fragment and whole debris types found in coastal and inland sites in Cape Town than the other two cities surveyed. In addition, we would expect that oceanic debris would be more fragmented than directly deposited items. In spite of this, coastal debris surveys from Cape Town comprised a lower proportion of whole items than fragments, in contrast to other regions we have studied.
There was mixed support for the oceanic hypothesis, hence, we considered alternatives. Through the International Coastal Cleanup, regular beach clean-ups are conducted throughout the Cape Town study region. Between 2012–2015, there were 99 cleanups recorded in the region of our study. In contrast, only one ICC cleanup was recorded in the Durban region. However, various small-scale cleanup projects are often conducted in KwaZulu-Natal even though they are not always synchronized or recorded (RM, pers. obs.). While there were no ICC clean-ups conducted in Kenya, Mombasa hotel staff also clean the beach in front of them daily []. Overall, it is relevant to know that debris clean-ups are more likely to target whole items (and larger items) than fragments []. The strong difference in the composition of whole debris types between inland and coastal areas for Cape Town and Mombasa (but not for Durban) supports this hypothesis. If local clean-up activities are a substantial driver in the patterns of coastal litter we observed, then we would anticipate a higher ratio of fragments compared to whole items as anecdotal evidence and observations of the authors in working with thousands of volunteers in more than 15 countries suggests that volunteers generally focus their efforts on larger, whole items than they do on small fragments which may be difficult to see (much less remove). Based on data from the designed surveys, it appears that governance has a strong influence on debris distribution. This is even the case where the beach cleaning is at the commercial level, rather than at a government level. Clean-up activities will lead to a (temporary) reduction of debris on coastal sites. They will also potentially change the composition of the debris depending on biases of which items are picked up (e.g., larger, more obvious items). The results here highlight the importance of considering local stewardship as evidenced by clean-up activities as a driving factor of debris. Other forms of governance may also impact debris distributions. Both Cape Town and Mombasa have plans to ban single use plastics, though Durban has yet to sign on to a similar agreement (https://www.capetownetc.com/news/cape-town-signs-pact-to-phase-out-plastic/, last accessed on 24 March 2022). https://www.unep.org/news-and-stories/story/kenya-emerges-leader-fight-against-plastic-pollution, last accessed on 24 March 2022). These policies were both implemented after this study took place, and it would be interesting to repeat the surveys to determine whether the bans are effective at reducing plastic waste in the environment. This would allow for a thorough comparison of the value and change associated with such policies.
The surveys we conducted were relatively close to urban areas; however, some sites in Durban were situated in rural areas. It is also worth noting the difference in topography between the three sampling sites. Kenya for instance, has relatively flat terrain, while some parts of Cape Town have elevated terrain and Durban presents a largely mountainous topography. This difference in topography could have also influenced the ridge to reef transportation of plastics in these regions. It is likely that outside of the larger metropolitan areas, environmental factors might play a stronger role in determining debris distribution. In a study conducted at nine Kenyan beaches, locally manufactured water bottles were most prevalent in cities and at urban beaches, but at remote beaches, water bottles were predominately of foreign origin []. Similarly, in these surveys, the highest mean density of debris we found was in Mombasa, at approximately 1 item/m2 in Mombasa. This is significantly lower than debris densities recorded along the remote Transkei coast, along the southeast coast of South Africa, where mean counts ranged from 19.6 to 72.5 items/m2 [].
5. Conclusions
Overall, we found differing litter densities between coastal and inland survey sites within three cities surveyed in southern and eastern Africa. In Cape Town, a relatively high inland density was observed, with lower density reported from coastal survey sites. By contrast, around both Durban and Mombasa, coastal litter loads were higher than observed at inland survey sites. The debris types were also different between inland and coastal areas in Cape Town, and moderately different in Mombasa. We suggest that both environmental and governance factors play a role in determining the quantity and distribution of the debris that we found across our survey areas. Clean-up activities likely also play a role in altering both the quantity and distribution of debris, though given where such activities generally take place, they are more likely to have an impact closer to urban areas, where clean-up activities are more common. This work demonstrates the utility of being aware of ancillary activities that may affect local debris loads observed and highlights the utility of considering local actions that may affect patterns of debris observed in the environment.
Author Contributions
Conceptualization, T.R., Q.S., C.W. and B.D.H.; methodology, C.W. and B.D.H.; software, open source; validation, Q.S., C.W., T.R. and B.D.H.; formal analysis, T.R. and Q.S.; investigation, B.D.H. and Q.S.; field surveys; B.D.H., T.R., C.W. and R.M.; resources, B.D.H.; data curation, Q.S. and T.R.; writing—original draft preparation, B.D.H., T.R. and Q.S.; writing—review and editing, T.R., Q.S., R.M., C.W. and B.D.H.; project administration B.D.H.; funding acquisition, B.D.H. All authors have read and agreed to the published version of the manuscript.
Funding
This research has been supported by Oak Family Foundation, PM Angel Foundation, Schmidt Marine Technologies and CSIRO.
Institutional Review Board Statement
Not applicable.
Informed Consent Statement
Not applicable.
Data Availability Statement
Data used herein can be provided upon request to BDHardesty (denise.hardesty@csiro.au).
Acknowledgments
We acknowledge the efforts of data collectors from the countries in which this work was undertaken, particularly Andrea Haas from Earthwatch Australia and the AMCOR participants involved in Capetown surveys; David Marquis from United Nations and the Kenya Marine and Fisheries Research Institute as well as participants involved in Mombasa surveys, particularly Kate Agneta, and Gilbert Owato; and the Refilwe Matlotlo NGO participants involved in Durban surveys. We also acknowledge the numerous volunteers who carried out coastal clean ups as part of Ocean Conservancy’s International Coastal Cleanup 2012–2015.
Conflicts of Interest
The authors declare no conflict of interest. The funders had no role in the design of the study; in the collection, analyses, or interpretation of data; in the writing of the manuscript, or in the decision to publish the results.
References
- Jang, Y.C.; Hong, S.; Lee, J.; Lee, M.J.; Shim, W.J. Estimation of lost tourism revenue in Geoje Island from the 2011 marine debris pollution event in South Korea. Mar. Pollut. Bull. 2014, 81, 49–54. [Google Scholar] [CrossRef] [PubMed]
- Zhao, S.; Zhu, L.; Li, D. Characterization of small plastic debris on tourism beaches around the South China Sea. Reg. Stud. Mar. Sci. 2015, 1, 55–62. [Google Scholar] [CrossRef]
- Wilcox, C.; Mallos, N.J.; Leonard, G.H.; Rodriguez, A.; Hardesty, B.D. Using expert elicitation to estimate the impacts of plastic pollution on marine wildlife. Mar. Policy 2016, 65, 107–114. [Google Scholar] [CrossRef]
- Gall, S.C.; Thompson, R.C. The impact of debris on marine life. Mar. Pollut. Bull. 2015, 92, 170–179. [Google Scholar] [CrossRef] [PubMed]
- Vethaak, A.D.; Legler, J. Microplastics and human health. Science 2021, 371, 672–674. [Google Scholar] [CrossRef] [PubMed]
- Wilcox, C.; Hardesty, B.D.; Law, K.L. Abundance of Floating Plastic Particles Is Increasing in the Western North Atlantic Ocean. Environ. Sci. Technol. 2020, 54, 790–796. [Google Scholar] [CrossRef]
- Villarrubia-Gómez, P.; Cornell, S.E.; Fabres, J. Marine plastic pollution as a planetary boundary threat–The drifting piece in the sustainability puzzle. Mar. Policy 2018, 96, 213–220. [Google Scholar] [CrossRef]
- Rochman, C.M. Microplastics research—From sink to source. Science 2018, 360, 28–29. [Google Scholar] [CrossRef]
- Welden, N.A.C.; Lusher, A.L. Impacts of changing ocean circulation on the distribution of marine microplastic litter. Integr. Environ. Assess. Manag. 2017, 13, 483–487. [Google Scholar] [CrossRef]
- Vermeiren, P.; Muñoz, C.C.; Ikejima, K. Sources and sinks of plastic debris in estuaries: A conceptual model integrating biological, physical and chemical distribution mechanisms. Mar. Pollut. Bull. 2016, 113, 7–16. [Google Scholar] [CrossRef]
- Wen, Z.; Xie, Y.; Chen, M.; Dinga, C.D. China’s plastic import ban increases prospects of environmental impact mitigation of plastic waste trade flow worldwide. Nat. Commun. 2021, 12, 425. [Google Scholar] [CrossRef]
- Schuyler, Q.; Wilcox, C.; Lawson, T.J.; Ranatunga, R.R.M.K.P.; Hu, C.S.; Hardesty, B.D. Human Population Density is a Poor Predictor of Debris in the Environment. Front. Environ. Sci. 2021, 9, 583454. [Google Scholar] [CrossRef]
- Jambeck, J.; Hardesty, B.D.; Brooks, A.L.; Friend, T.; Teleki, K.; Fabres, J.; Beaudoin, Y.; Bamba, A.; Francis, J.; Ribbink, A.J.; et al. Challenges and emerging solutions to the land-based plastic waste issue in Africa. Mar. Policy 2018, 96, 256–263. [Google Scholar] [CrossRef]
- Nyathi, B.; Togo, C.A. Overview of Legal and Policy Framework Approaches for Plastic Bag Waste Management in African Countries. J. Environ. Public Health 2020, 2020, 8892773. [Google Scholar] [CrossRef] [PubMed]
- Ocean Conservancy. We Clean On. International Coastal Cleanup 2021 Report; Ocean Conservancy: Washington, DC, USA, 2021. [Google Scholar]
- Olivelli, A.; Hardesty, B.D.; Wilcox, C. Coastal margins and backshores represent a major sink for marine debris: Insights from a continental-scale analysis. Environ. Res. Lett. 2020, 15, 074037. [Google Scholar] [CrossRef]
- Pearce, A.; Jackson, G.; Cresswell, G. Marine debris pathways across the southern Indian Ocean. Deep. Sea Res. Part II Top. Stud. Oceanogr. 2019, 166, 34–42. [Google Scholar] [CrossRef]
- Collins, C.; Hermes, J. Modelling the accumulation and transport of floating marine micro-plastics around South Africa. Mar. Pollut. Bull. 2019, 139, 46–58. [Google Scholar] [CrossRef]
- Thompson, R.C.; Olsen, Y.; Mitchell, R.P.; Davis, A.; Rowland, S.J.; John, A.W.G.; McGonigle, D.; Russell, A.E. Lost at sea: Where is all the plastic? Science 2004, 304, 838. [Google Scholar] [CrossRef]
- Ryan, P.; Moloney, C. Plastic and other artefacts on South African beaches: Temporal trends in abundance and composition. S. Afr. J. Sci./S.-Afr. Tydskr. Wet. 1990, 86, 450–452. [Google Scholar]
- Ryan, P.G. The transport and fate of marine plastics in South Africa and adjacent oceans. South Afr. J. Sci. 2020, 116, 1–9. [Google Scholar] [CrossRef]
- Ryan, P.G.; Perold, V.; Osborne, A.; Moloney, C.L. Consistent patterns of debris on South African beaches indicate that industrial pellets and other mesoplastic items mostly derive from local sources. Environ. Pollut. 2018, 238, 1008–1016. [Google Scholar] [CrossRef] [PubMed]
- Schuyler, Q.; Willis, K.; Lawson, T.J.; Mann, V.; Wilcox, C.; Hardesty, B.D. Handbook of Survey Methodology–Plastics Leakage; CSIRO: Canberra, Australia, 2018.
- Oke, P.; Brassington, G.; Griffin, D.A.; Schiller, A. The Bluelink ocean data assimilation system (BODAS). Ocean Model. 2008, 21, 46–70. [Google Scholar] [CrossRef]
- CSIRO. Connie3, CSIRO Connectivity Interface. 2019. Available online: https://connie.csiro.au/ (accessed on 24 March 2022).
- Ryan, P.G. Land or sea? What bottles tell us about the origins of beach litter in Kenya. Waste Manag. 2020, 116, 49–57. [Google Scholar] [CrossRef]
- Loizidou, X.I.; Loizides, M.I.; Orthodoxou, D.L. Persistent marine litter: Small plastics and cigarette butts remain on beaches after organized beach cleanups. Environ. Monit. Assess. 2018, 190, 414. [Google Scholar] [CrossRef] [PubMed]
- Madzena, A.; Lasiak, T. Spatial and temporal variations in beach litter on the Transkei coast of South Africa. Mar. Pollut. Bull. 1997, 34, 900–907. [Google Scholar] [CrossRef]
Disclaimer/Publisher’s Note: The statements, opinions and data contained in all publications are solely those of the individual author(s) and contributor(s) and not of MDPI and/or the editor(s). MDPI and/or the editor(s) disclaim responsibility for any injury to people or property resulting from any ideas, methods, instructions or products referred to in the content. |
© 2023 by the authors. Licensee MDPI, Basel, Switzerland. This article is an open access article distributed under the terms and conditions of the Creative Commons Attribution (CC BY) license (https://creativecommons.org/licenses/by/4.0/).