1. Introduction
With the continuous reform of the land management system in China, cultivated land quality management has gradually become a hot spot of concern for government policymakers and scholars [
1,
2]. Building and maintaining high-quality cultivated land is an essential part of putting the strictest cultivated land protection system into practice, a fundamental guarantee for increasing the capacity of the entire agricultural sector and ensuring national food security, and a practical method for maximizing the use of land resources and creating a barrier for national ecological security. The studies related to cultivated land quality mainly focus on discussing the selection of a cultivated land quality evaluation index [
3,
4,
5], the establishment of cultivated land quality monitoring system [
6], the dynamic balance of a cultivated land quality [
7], and cultivated land zoning protection [
8], and the studies on cultivated land quality restriction factors mostly use regression analysis from the perspective of production capacity.
The evaluation and research on the changes in cultivated land quality are realized internationally by monitoring the cultivated land, soil, and natural resources and investigating the land resources [
9,
10,
11,
12], and certain results have been achieved in the scientific selection of soil quality indicators [
13,
14,
15,
16] and improvement of soil quality [
17,
18]. In a previous study, Taye et al. analyzed the area of cultivated land use situated on the non-arable land capability class by considering raster layers of terrain, the average ATRF, and soil texture [
19]. Greiner et al. adapted 10 static soil function assessment (SFA) methods and applied them to agricultural soils in a study area on the Swiss Plateau [
20].
The above studies have led to the establishment and application of a cultivated land quality evaluation system [
21], but there are fewer studies on finding restriction factors [
22,
23] through cultivated land quality evaluation. Numerous articles have been written about soil characteristics that are similar to the restrictions on cultivated land. A system model framework is built to simulate soil functions for evaluating soil functionality based on the mechanistic link between soil functional features [
24]. Data from a continental long-term simulation using the DayCent model were used to construct crop-specific Bayesian networks in order to determine the maximum potential of the soil function and evaluate the interdependencies between the soil functions [
25]. The restriction index model is an attribute model that comprehensively explores the restriction factors [
26] affecting the improvement of cultivated land quality on the basis of a comprehensive evaluation of cultivated land quality.
The productivity of cultivated land is largely dependent on the quality of the area under cultivation. To effectively carry out cultivated land conservation work, a thorough analysis of the current state of cultivated land quality and its spatial and temporal distribution characteristics to explain the spatial variability of cultivated land quality is necessary [
27]. The analysis of cultivated land quality restriction factors is used to understand the status of cultivated land quality and propose measures for cultivated land quality improvement from the perspective of restriction factor abatement. This helps to carry out arable land protection and cultivated land quality improvement more precisely and accurately. In this paper, using East Anhui as the study area, we diagnose and excavate the dominant restriction factors of cultivated land quality using the cultivated land quality restriction index model and determine the cultivated land quality improvement measures in a targeted manner based on the cultivated land quality and restriction factors.
2. Study Area
East Anhui is a narrow sense that refers specifically to Chuzhou City, Anhui Province, China. Chuzhou City is located in the easternmost part of Anhui Province, in the lower reaches of the Yangtze River plain and the hilly areas between Jiangsu and Huai, with geographical coordinates of 118°21′18″–119°27′55″, 30°37′54″–31°04′12″, and a humid, semi-humid monsoon climate with four distinct seasons. The climate is warm, with rain and heat in the same season, making it susceptible to drought and flooding. Winter is chilly and rainy; spring is cold and warm; summer is hot and rainy; and fall is bright and cool. Chuzhou is a key ecological barrier area in the Yangtze River Delta region as well as the Ning-Hang ecological and economic belt.
The main body of Chuzhou City is the lower reaches of the Yangtze River plain area and the Jianghuai hilly area; the terrain is high in the west and low in the east. Across its territory, the Phoenix Mountains, Mopan Mountains, Baimishan, Jiashan, Changshan, etc. constitute the Jianghuai watershed; Chuzhou into the Yangtze River; and the Huai River’s two major watersheds. The hilly area mainly includes the Gushan Mountain in Quanjiao, the Nanjun Mountain and the Beijun Mountain in Nanqiao, the Daishan Mountain in Dingyuan, the Xingshan Mountain in Mingguang, and the Banta in Lai’an, a large area of arc-shaped hills extending from southwest to northeast, and the hills formed by Fengyang Mountain and Shimen Mountain in the middle of the study area. The altitude is generally more than 100 m, and the relative height is more than 50 m. On the hilly platform, there are mostly thin-layer slope deposits and eluvium with exposed bedrock or gravel, and under the slope there are coarse slope deposits and diluvium. The soil is mostly young, with weak development, a thin soil layer, and low fertility. The hilly area includes the surrounding areas of Fengyang Mountain in the northwest of Dingyuan and the southwest of Fengyang, the platforms and undulating zones surrounding the hills in the northwest of Mingguang, the northeast and southwest of Nanqiao, the northwest of Lai’an, and the southeast of Quanjiao, and the platforms bordering Liuhe in Jiangsu Province in the southwest of Tianchang. The altitude is generally 50–100 m, the surface is hilly and undulating, and the soil is mainly Xiashu loess with a deep soil layer. The plain area is mainly distributed along the banks of the Chuhe River and Huaihe River and in the lakeside areas of Nushan Lake and Gaoyou Lake, with an altitude of less than 50 m and a relative height of less than 10 m.
The eastern Anhui region is located at the junction of the southern margin of the North China platform and the northern margin of the Yangtze platform. The Tancheng-Lujiang fault enters the territory from the east side of Wuhe County, cuts diagonally to the northwest of Mingguang City and the east of Dingyuan County in the northeast, and extends to the Lujiang River in the southwest. It has the geological characteristics of both the north and the south. Taking the Tan-Lu fault as the boundary, Fengyang, Dingyuan, and Mingguang West belong to the Bengbu and Changfeng communities in the west of the North China stratigraphic region. The strata are relatively complete from the lower Proterozoic to the Quaternary, except for the missing Middle Ordovician to the Triassic. Dingyuan County, the eastern part of Mingguang City, and Tianchang, Lai’an, Quanjiao, Langya, and Nanqiao belong to Chuxian and Nanjing communities in the lower Yangtze sub-region of the South China Stratigraphic Region. The exposed strata range from the Middle Proterozoic to the Quaternary, and the Silurian to the Tertiary are missing.
Chuzhou City and Lai’an, Quanjiao, and Tianchang are part of the Yangtze River basin, accounting for about 33.1% of the city’s total area; Mingguang, Fengyang, Dingyuan, and Tianchang are part of the Huaihe River basin, accounting for about 66.9% of the city’s total area. The city’s landforms can be divided into three major types: hilly areas, hill areas, and plain areas, accounting for 8.2%, 40.4%, and 39.2% of the city’s total land area, respectively.
3. Materials and Methods
3.1. Materials
The data mainly include a Chuzhou 1:50,000 scale soil map, a land use status map, an administrative division map, and 1266 sampling points covering 8 counties (cities and districts) in the eastern part of Anhui. Sampling point data include sampling time, latitude and longitude, administrative division name, texture of the cultivated layer, texture configuration, topographic areas, effective phosphorus, fast-acting potassium, organic matter, pH, capacity, barriers, effective soil layer thickness, heavy metal content, biodiversity, etc.
Using the overlapping division method of soil map, land use status map, and administrative division map, the plots of the same soil unit, land use status type and administrative division unit form an evaluation unit, namely the format of "land use status type-soil type-administrative division unit". The evaluation unit generated after the superposition of the three maps includes not only soil information but also land use and administrative division information. The evaluation unit generated after the superimposition of the three maps includes not only soil information but also land use and administrative division information. Through the overlay and retrieval of the maps and the merging of small spots, the eastern Anhui area is divided into 327,950 evaluation units.
The indicators related to the evaluation of cultivated land quality in the sampling point data are divided into qualitative and quantitative categories. Qualitative indicators such as topographic site, farmland forest network, texture configuration, obstacle factors, cultivated layer texture, biodiversity, cleanliness, irrigation capacity, drainage capacity, etc. Biodiversity in cultivated land quality assessment is an important indicator of cultivated land health. The level of soil biodiversity on cultivated land is vulnerable to human interference. Biodiversity in this study is comprehensively determined through a field survey, combined with expert experience, and expressed in rich, general rich, and not rich. The above indicators are assigned to the evaluation units by the method of point substitution and attribute connection for quantitative indicators such as soil nutrients, effective soil layer thickness, and capacitance. Data are extracted by sampling spatial interpolation and assigned to each assessment unit for quantitative indicators such as soil nutrients, effective soil layer thickness, bulk density, pH, organic matter, effective phosphorus, and fast-acting potassium.
3.2. Methods
3.2.1. Cultivated Land Quality Level Evaluation
The evaluation of the quality level of cultivated land involves various aspects such as the health condition of the land, standing conditions, soil nutrients, physical and chemical properties, and farmland management. In this study, according to the middle and lower reaches of the Yangtze River, where the eastern part of Anhui Province is located, a total of 15 evaluation indexes in 6 categories were selected to establish the evaluation index system. These include the cleanliness and biodiversity indicators reflecting the health of farmland, the forest network and topography indicators representing farmland standing conditions, the effective phosphorus, fast-acting potassium, and organic matter content of soil nutrients, and the capacity, acidity, and texture indicators representing the physical and chemical properties of soil, as well as two indicators reflecting the management of farmland, such as drainage capacity and irrigation capacity, and three indicators reflecting the barrier factors, the effective soil layer, and three profile indicators, such as thickness and texture.
In this study, the combination of the Telfer method and hierarchical analysis was used to determine the weights of each indicator involved in cultivated land quality evaluation [
28,
29,
30]. The weights of cultivated land quality evaluation indexes are in
Table 1. Firstly, according to the Telfer method, each indicator was assigned a weight, and on this basis, the hierarchical analysis was used to classify the indicators, compare the importance of each indicator in each category, and determine the weights of all indicators using the judgment matrix. After establishing the evaluation index system for cultivated land quality and determining the weights of each index, the weighted summation method is used to calculate the comprehensive cultivated land quality index of each evaluation unit. According to the principle that the order number of evaluation units is the x-axis and the comprehensive cultivated land quality index is the y-axis, the distribution chart of the comprehensive index is drawn, the number of grades and the critical point for dividing the comprehensive index are determined according to the abrupt change point (inflection point) of the slope of the curve, and the grade of cultivated land quality is graded.
3.2.2. Restriction Factors of Cultivated Land Quality
In this study, the restrictive index model is introduced to quantitatively study the restriction factors of cultivated land quality in East Anhui, analyzing the actual situation of cultivated land use characteristics, agricultural production status, basic conditions of cultivated land, and soil properties in East Anhui, and selecting the limiting factor index of cultivated land quality. Rice and wheat are planted in East Anhui. Rice is mainly planted in plain areas and hilly areas with good irrigation and drainage conditions, while wheat is mainly planted in northern plain areas. Poor irrigation and drainage conditions are common in mountainous areas with less cultivated land and mainly forest land. The selected limiting factors are not only due to the local actual situation but also due to the large weight of these indicators in the evaluation system, which has a great impact on the evaluation results of cultivated land quality. Most of these restriction factors are quantitative indicators, which are more objective than qualitative indicators. Based on the above reasons, according to the principles of stability, productivity, and comprehensiveness, eight indicators such as effective soil layer thickness, soil organic matter, soil texture, irrigation capacity, drainage capacity, obstacle factors, and cleanliness are the restriction factors of cultivated land quality. The influence of different indicators on the quality of cultivated land is shown in
Table 2. The analysis of the data from the sampling sites in eight counties (cities and districts) in East Anhui shows that the influence of different indicators on the quality of cultivated land is positively correlated, i.e., the improvement of the positively correlated indicators will lead to the improvement of the quality of cultivated land due to their own conditions.
According to the minimum law proposed by German chemist Liebig, which is used for the study of cultivated land quality restriction factors, the minimum factor in this theory can be expressed as the maximum restriction factor that restricts the quality of improvement of cultivated land. The restrictiveness index model is based on the formula of the comprehensive quality index in the evaluation of cultivated land quality level, and the maximum value of the restrictive factor affecting cultivated land quality in the cultivated land quality level is compared with the actual score, and the percentage of the difference between them to the maximum value is the degree of restriction of the factor in the whole area. The specific calculation formula is:
is the restriction size of the kth restriction factor of the ith plot; is the maximum contribution of the kth restriction factor of the ith plot; is the actual contribution of the kth restriction factor of the ith plot; is the weight of the kth restriction factor of the jth designated crop; is the kth affiliation of the restriction factor; is the light-temperature production potential index of the jth crop; is the yield ratio coefficient of the jth crop; and k is the restriction factor number.
According to the obtained restriction index L, the larger its value, the greater the potential that can be enhanced; the more restrictive the restriction spectrum order, the stronger the restriction; the largest L value item is the dominant restriction type of cultivated land quality. The correspondence between restriction index L and restriction type is shown in
Table 3.
4. Results
4.1. Cultivated Land Grades
The total area of cultivated land in East Anhui is 716,390.48 hectares, and the specific arable land quality evaluation results are shown in
Table 4. As shown in
Figure 1, the first- to third-grade land is the better-quality cultivated land in East Anhui, with an area of 169,789.9 hectares, accounting for 23.70%. The distribution area is mainly plain, with a deep soil layer and relatively good evaluation indexes in the area, fertile soil, irrigation and drainage conditions to meet crop growth conditions, and high production performance. The fourth to sixth grade is mainly the middle grain producing area in East Anhui, with an area of 445,206.7 hectares, accounting for 62.15%. The distribution area is mainly a plain and hilly hillock area, with certain undulations in the terrain, a deeper soil layer, better irrigation and drainage conditions, and soil nutrients in the middle to upper levels, suitable for crop growth. The seventh to tenth areas are the poorest quality of cultivated land in eastern Anhui, with an area of 101,393.9 hectares, accounting for 14.15% of the total area. The topography of the distribution area is mainly mountainous and hilly, with relatively large topographic relief, and generally speaking, the cultivated land is slightly less cultivated, and the conditions of water conservancy facilities can only basically meet the needs of irrigation and drainage of cultivated land. The effective nutrient content is generally low, the suitability for planting is poor, and the yield level is relatively low.
In addition to the natural conditions of the soil itself, the quality of cultivated land is also influenced by man-made farming factors, so each administrative region has its own characteristics of the distribution of the quality of cultivated land grade. The distribution of the administrative region of the quality of cultivated land in East Anhui is shown in
Table 5. The evaluation unit of cultivated land quality in East Anhui is formed by superimposing three maps: a soil map, a current land use map, and an administrative division map. The administrative affiliation of the evaluation unit is very clear, and the distribution of each grade of cultivated land in each administrative division can be calculated from the table of cultivated land quality evaluation results.
4.2. Restriction Type and Restriction Factors
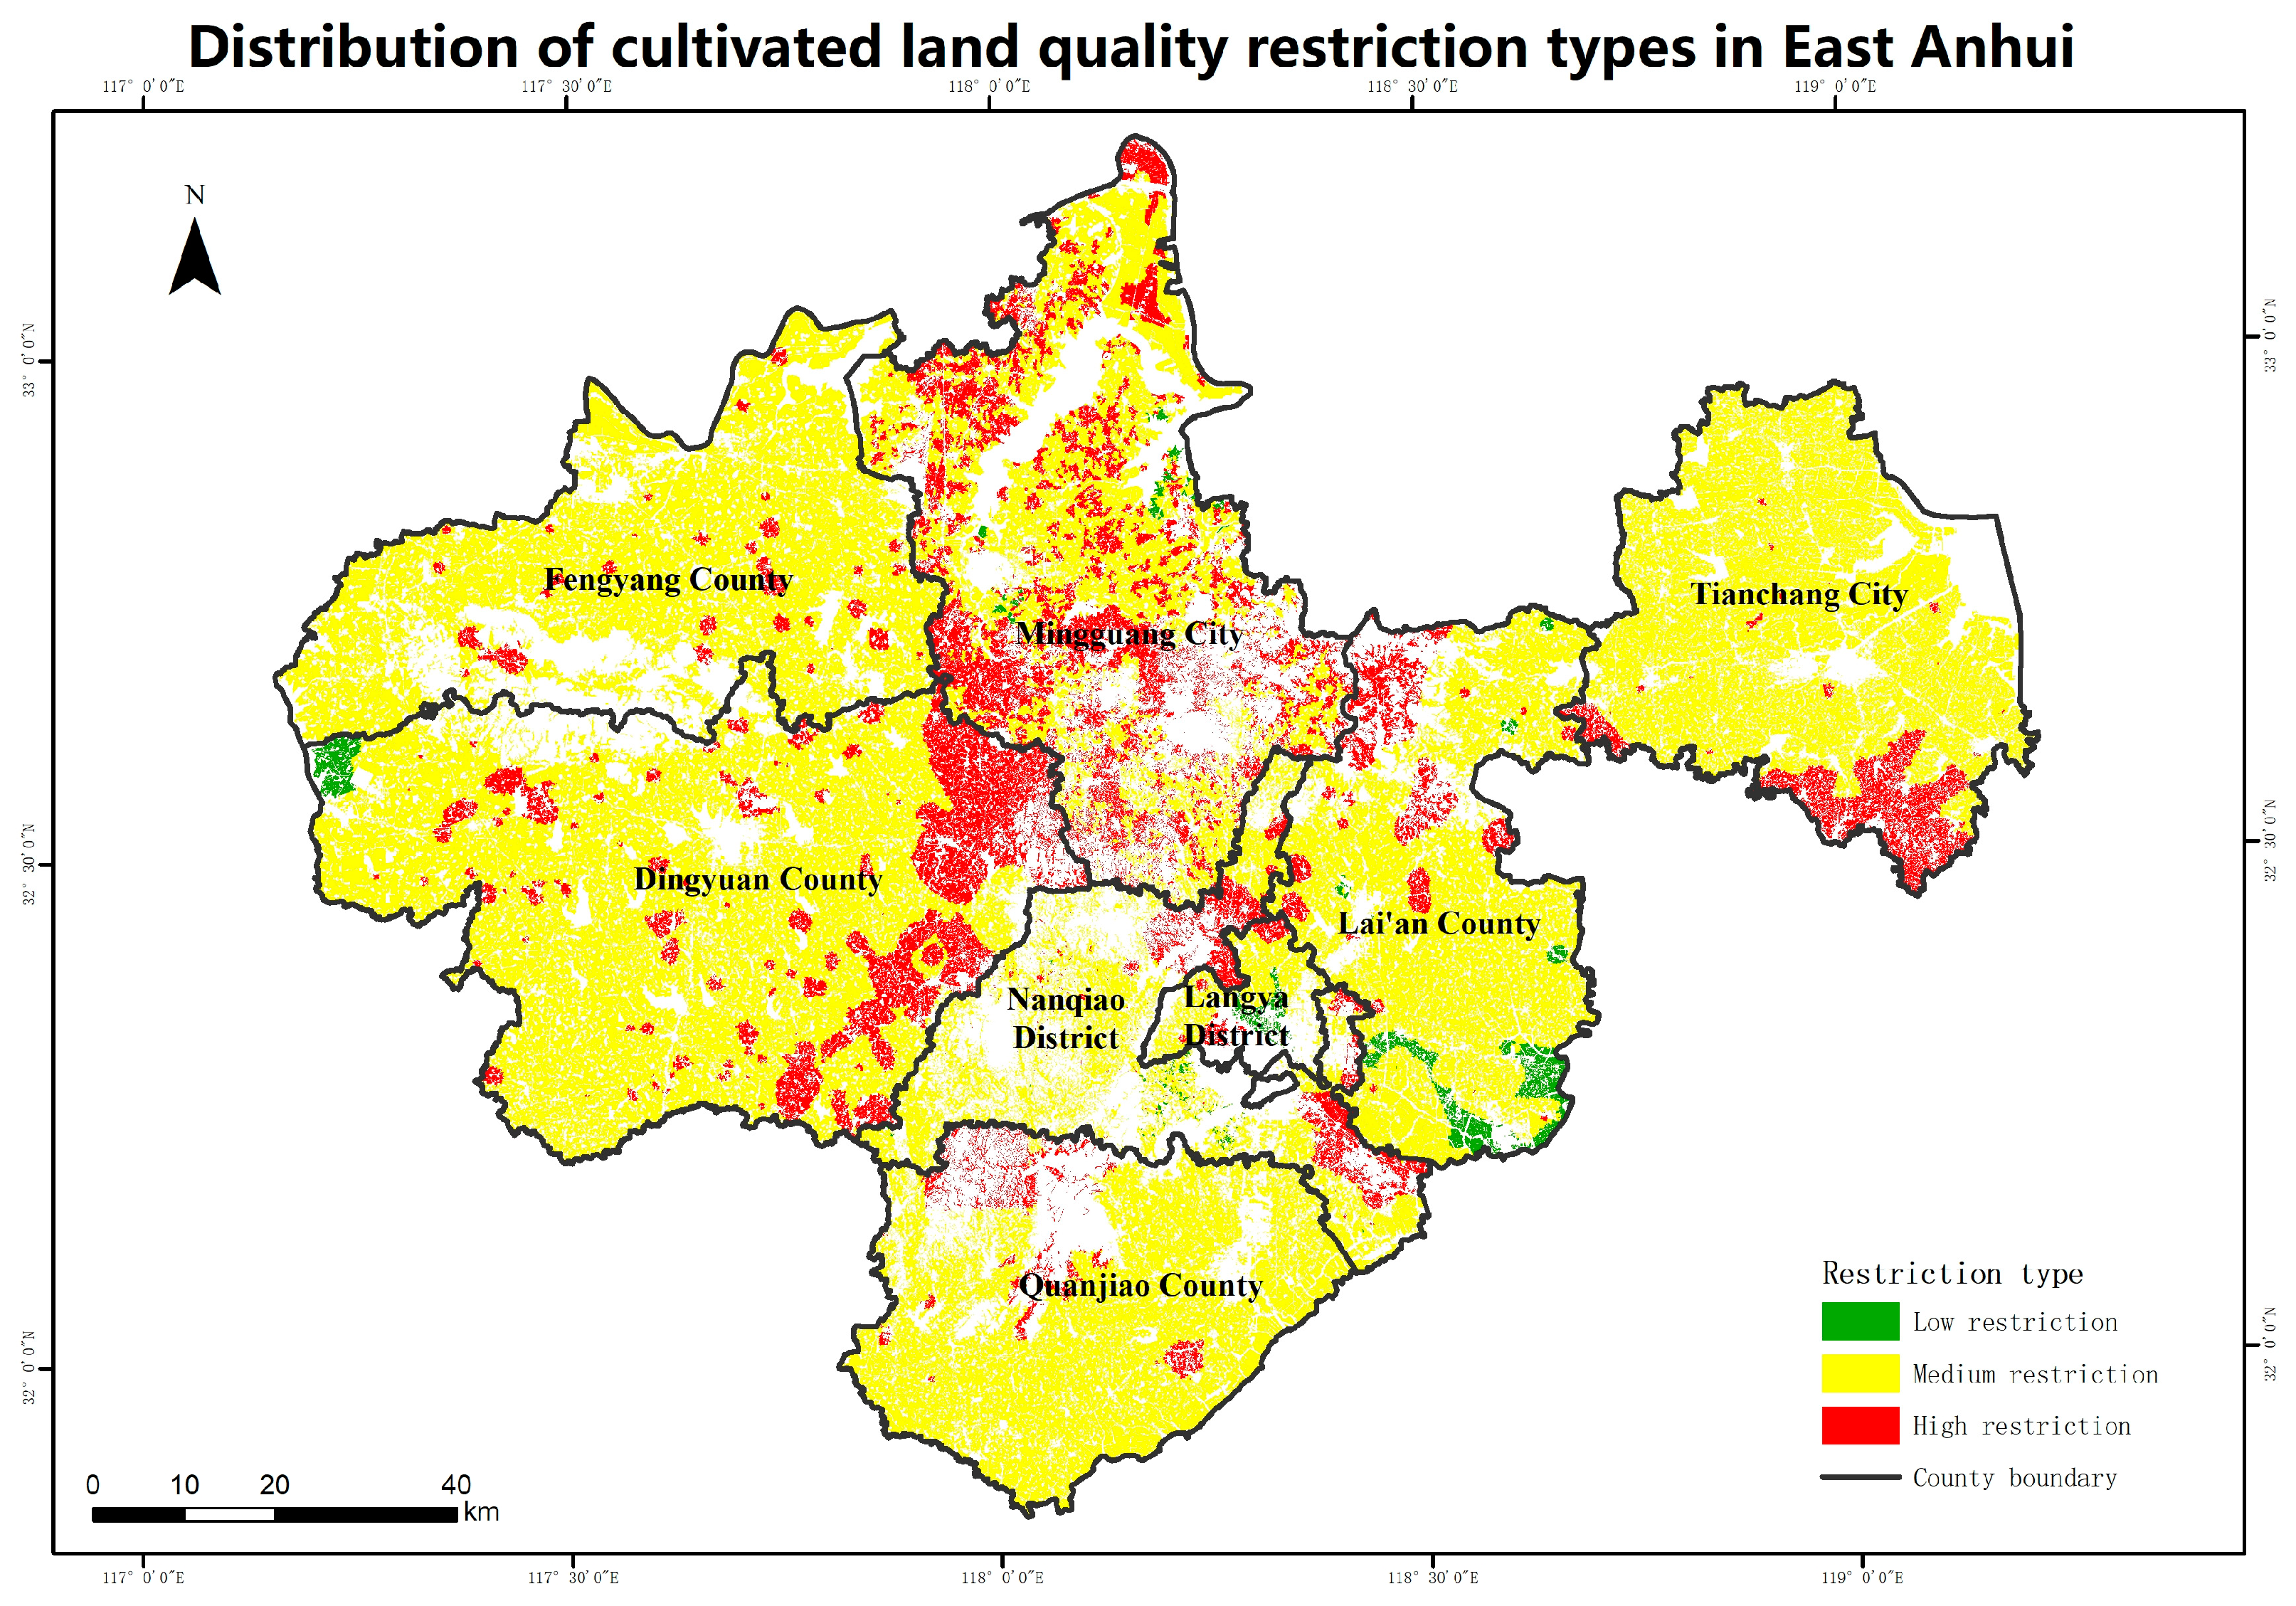
Based on the obtained all-factor cultivated land quality improvement restriction index and restriction types, the administrative area distribution of cultivated land quality restriction types in East Anhui was counted. The area of cultivated land with high restriction type is 123,128.49 hectares, accounting for 17% of the total cultivated land area, mainly located in Dingyuan County and Mingguang City; the area of cultivated land with medium restriction type is the largest, with 583,920.07 hectares of cultivated land, accounting for 81.5% of the total cultivated land area, which is distributed in most areas in East Anhui; and the area of cultivated land with low restriction type is relatively small, accounting for about 1.3% of the total cultivated land.
The spatial distribution characteristics of the restriction types on cultivated land of various cultivated land grades are further defined in light of the cultivated land grades and the results of the restriction index model. From
Figure 2, it can be seen that the high restriction type of cultivated land is mainly located in the low terrain area and part of the high elevation hill and mountainous areas in the central part of East Anhui, and most of the study area is dominated by the medium restriction type of cultivated land, with some low restriction type cultivated land sporadically distributed. Through the statistical analysis of all grades of cultivated land in the study area (
Table 6), there is high restriction type cultivated land in the first to the tenth grade, accounting for 17% of the cultivated land area in the study area, mainly concentrated in the fourth to the eighth grade; the study area is dominated by medium restriction type cultivated land, accounting for 81.68% of the total cultivated land area, mostly located in the second to the seventh grade; low restriction type cultivated land is more distributed in the first to the fifth grade, accounting for only 1.32% of the area.
The restriction index model was applied to calculate the restriction factors of different cultivated land quality classes, and the specific distribution of different cultivated land quality restriction factors is shown in
Figure 3. Among them, the main restriction factors for the first to third grades are soil organic matter and pH. The main restriction factors in the fourth to seventh grades are soil organic matter, irrigation capacity, and obstacle factors. The main restriction factors in the eighth to tenth grades are soil organic matter, effective soil layer thickness, and obstacle factors.
Soil organic matter is the main restriction factor for improving the quality of cultivated land in East Anhui. The total area of organic matter restriction type area is 171,176.7 ha, accounting for 23.89% of all cultivated land area in the study area, which has a large impact on the first to tenth grades. The organic quality restriction type area contains secondary restriction factors such as plough layer texture, irrigation capacity, and effective soil layer thickness. In improving the quality of cultivated land, the soil organic quality content should be improved first, and irrigation capacity, plough layer texture, and effective soil layer thickness should also be considered to strengthen the construction of farmland infrastructure.
5. Discussion
The restrictive index model was used to comprehensively analyze the restrictive factors affecting the quality of cultivated land in this study. Analyze the quality state of the cultivated land in East Anhui using the Analytic Hierarchy Process and Delphi technique to assess the level of quality [
29]. While the quality of cultivated land in plain areas is quite high, with decent irrigation and drainage conditions, the East Anhui region’s cultivated land is generally of good quality. Hilly and mountainous areas have small and fragmented cultivated land areas, poor water conservation facilities, and low soil nutrients.
Based on the evaluation of cultivated land quality, a quantitative analysis of the restrictive factors affecting cultivated land quality was carried out. It was discovered that the organic matter concentration, irrigation capability, and soil texture of the cultivated area in East Anhui were the key restriction factors. In this study, soil organic matter was assessed as a restriction factor for the quality of cultivated land, and it was discovered that soil organic matter generally limited the quality of cultivated land in the study area, most likely as a result of anthropogenic exploitation and the extensive use of chemical fertilizers [
30]. There are cultivated lands with a high degree of irrigation capacity restriction in the study area, and the degree of irrigation and drainage capacity restriction reflects the investment in farmland construction [
31]. Future construction of high-standard farmland can be improved according to local cultivated land constraints with corresponding improvement measures. The low restriction of acidity to each grade of cultivated land indicates that soil acidification in the study area is not serious and has a low impact on the quality of cultivated land.
Soil organic matter [
32], as an important parameter affecting soil health [
14] and cultivated land quality, the spatial variability of accurate soil organic matter content is important for promoting scientific fertilization and improving cultivated land quality [
33]. In recent years, large areas of high-standard farmland have been constructed, and irrigation and drainage facilities have improved the irrigation and drainage capacity of cultivated land. Deep plowing and leveling of land can improve the obstructive factors, the texture of the cultivated layer, and the effective soil layer thickness [
34,
35].
This study only analyzes the limiting factors of cultivated land quality in eastern Anhui, and the selected limiting factor indicators are suitable for the current study area. If we want to find more universal limiting factor indicators, we need to select different research areas to explore. This study lacks the application research of the restrictive index model and combines the restrictive index model with measures to improve the quality of cultivated land to further explore the deep relationship between the restrictive factors and the improvement of cultivated land quality, so as to provide a reference and basis for the improvement of cultivated land quality.
6. Conclusions
In this study, eight cultivated land quality restriction factors were selected based on the evaluation indexes of cultivated land quality in East Anhui, among which six are the main restriction factors of cultivated land quality in East Anhui, such as effective soil layer thickness, soil organic matter, soil acidity and alkalinity, plough layer texture, irrigation capacity, and obstacle factors. The results show that soil organic matter content has an impact on all cultivated land in East Anhui, while drainage capacity and cleanliness have less of an impact on the quality improvement of cultivated land in East Anhui.
By introducing the restriction index model and quantitatively analyzing the restriction factors of cultivated land quality level in East Anhui, the types of cultivated land quality restrictions in East Anhui were calculated. The types of cultivated land quality restrictions in East Anhui were mainly medium restrictions, and medium and high restriction factors existed in most areas.
The influence of restriction factors such as effective soil layer thickness, soil acidity and alkalinity, plough layer texture, irrigation capacity, and obstacle factors on grades one to ten differs. On higher-quality cultivated land, plough layer texture, soil acidity and alkalinity and soil organic matter have higher restrictions on cultivated land quality; on medium-quality cultivated land, cultivated land quality restriction factors are dominated by irrigation capacity; on lower-quality cultivated land, effective soil layer thickness and obstacle factors have higher restrictions on cultivated land quality improvement. The restriction on cultivated land quality is higher.


