Article

Research on Calculating Traffic Capacity in Extra-Long Subsea Tunnels—A Case Study of the Qingdao Jiaozhou Bay Subsea Tunnel

1
College of Traffic & Transportation, Chongqing Jiaotong University, Chongqing 400074, China
2
College of Smart City, Chongqing Jiaotong University, Chongqing 400074, China
3
Chongqing Linggu Transportation Technology Co., Ltd., Chongqing 400064, China
*
Author to whom correspondence should be addressed.
Sustainability 2023, 15(9), 7543; https://doi.org/10.3390/su15097543
Submission received: 14 March 2023 / Revised: 26 April 2023 / Accepted: 28 April 2023 / Published: 4 May 2023

Abstract

:
Analyzing the traffic capacity of extra-long tunnels is crucial in assessing their sustainable capacity. However, previous studies on tunnel capacity mainly considered the influence of a single factor, ignoring the interaction between multiple factors, which cannot reflect the actual tunnel capacity. Therefore, considering the influence of multiple factors, this paper constructs an actual capacity calculation model for extra-long tunnels. Firstly, by combining hierarchical analysis and the entropy method, we determined the key factors that influence the capacity of extra-long tunnels. Secondly, based on the constructed traffic simulation model, we constructed an actual capacity model of extra-long tunnels by using multiple non-linear regression equations and tested the goodness of fit with the help of the misfit term. Finally, we determined the key correction coefficients of the model using the difference proportion method. Taking Qingdao Jiaozhou Bay undersea Tunnel as an example, the research results show that the method proposed in this paper can accurately determine the tunnel capacity with an error of less than 4%, providing a theoretical basis and practical guidance for the management and control of the tunnel’s sustainable carrying capacity after traffic congestion.

1. Introduction

Extra-long subsea tunnels are unique pieces of infrastructure that require specific research to optimize their performance. These tunnels present different challenges compared to standard highway tunnels, such as more longitudinal sections and varying slopes, leading to vehicle inefficiency and traffic congestion [1]. Additionally, driving for long distances within these tunnels can increase the risk of driver fatigue and inattention, which could potentially lead to traffic accidents. Therefore, investigating the capacity of extra-long subsea tunnels is crucial to enhancing the efficiency and safety of vehicle traffic within the tunnel and to promoting the sustainable development of these tunnels.
Previous studies have explored various factors that affect capacity in subsea tunnels. For instance, the Highway Capacity Manual has identified road condition, traffic, and technical factors as critical elements influencing highway capacity [2]. Yang et al. [3] investigated the impact of lane-changing behavior on capacity reduction, while Anders et al. [4] studied the effect of public information on highway tunnel capacity. Mostafa et al. [5] investigated how tunnel structure affects capacity, and Cai [6] used numerical simulation to determine the main influencing factors on traffic capacity, including slope, slope length, and the proportion of large vehicles. Marcel et al. [7] noted that lane change rates could lead to decreased road capacity, with a higher rate of lane changes resulting in lower observed traffic flow. Other studies, such as Zhou et al. [8], Hashim et al. [9], Ghiasi et al. [10], Cheng et al. [11], Chang et al. [12], and Hisanaga [13], have examined various factors such as road alignment, design speed, the presence of auxiliary lanes, mixed passenger and freight traffic, road radius, and the number of connected and autonomous vehicle (CAV) lanes, among others, and their impact on tunnel capacity using different analytical methods.
Research on subsea tunnel capacity has a long history dating back to the 1950s. Early studies, such as those by Bressler [14] and Hughes [15], used theoretical analysis to estimate tunnel capacity, but the limited accuracy of their models led many scholars to develop capacity models from different perspectives using various analytical methods. For example, Wada et al. [16] studied tunnel bottleneck capacity using the continuous following model, while Ghiasi et al. [10] analyzed the relationship between CAV lanes and capacity using a Markov chain and proposed a mixed traffic flow capacity model. Yuan et al. [17] developed a capacity calculation model based on time headway and applied it to an underpass tunnel. Dhamaniya et al. [18] established a simultaneous velocity equation for different vehicle classes to determine the capacity of an urban trunk road, while Fu et al. [19] evaluated tunnel section capacity based on the Greenshields traffic flow model and compared it with adjacent ordinary sections. Due to the high data requirements of these methods and the lack of sufficient data, many scholars have turned to simulation-based capacity models. For instance, Beheshtitabar et al. [20] used a VISSIM model to investigate the impact of increased look-ahead distance at the Hampton Road Bridge Tunnel in Virginia, while Fang et al. [21] developed an urban tunnel capacity model based on VISSIM and analyzed the impact of variable lanes on capacity. Ye et al. [22] analyzed the impact of driverless driving on capacity using a road cellular automaton model based on the two-state safety speed model, and Winkler and Fan [23] built a capacity model for high-speed traffic paths based on VISSIM simulations to evaluate the effects of lane restrictions, driver behavior, and interchange density on expressway capacity.
Most tunnel capacity standards currently refer to highway or municipal road standards due to a lack of standardized capacity calculation standards for extra-long subsea tunnels. On the basis of quantifying the relationship between multiple factors and capacity, a tunnel capacity model based on simulation was proposed, which reflected the actual capacity of the tunnel under different routes and control measures in detail, and provided theoretical support for improving the sustainable carrying capacity of the tunnel by optimizing the linear and control conditions of the tunnel. The main contributions of this paper follow:
  • This paper aims to examine the impact of various factors related to the road environment and control measures on tunnel traffic capacity. Unlike the existing literature [3,4,5,6,7,8,9,10,11,12,13], which focuses mainly on single factors and neglects the interplay between multiple factors, this paper considers a combination of factors that could potentially influence traffic capacity. By analyzing both single and multiple factors, the paper seeks to provide a more comprehensive understanding of the complex dynamics involved in tunnel traffic capacity. Overall, this approach enhances the existing body of research on this topic and provides valuable insights for policymakers, engineers, and other stakeholders involved in the design and management of tunnels.
  • The paper suggests a novel screening method for determining the influencing factors of tunnel capacity, which is based on the analytic hierarchy process (AHP) and the entropy weight method. This approach improves upon the subjective judgment method that has been traditionally used in most of the existing literature [6,8,9,11,12]. By combining AHP with the entropy weight method, the proposed screening method can effectively quantify the relative importance of different factors and minimize the impact of subjective biases. This enables more objective and accurate identification of the factors that have the greatest influence on tunnel capacity. The use of this screening method provides a valuable contribution to the field of tunnel engineering and can help guide the design and management of tunnels in a more effective and efficient manner.
  • The paper discusses the various methods that have been used in existing traffic capacity model research and divides them into three categories [14,15,16,17,18,19,20,21,22,23]: theoretical analysis, data mining, and simulation. Table 1 provides a comparison of the three methods. Theoretical analysis, although useful in some cases, neglects the interaction between vehicles in traffic flow and can result in traffic capacity results that are far from the actual situation. As a result, its current application is limited. Given the difficulty in collecting actual traffic data in very long tunnels with many factors influencing traffic capacity, this paper proposes the use of simulation methods. Simulation methods can help compensate for the lack of traffic observation data and allow for the reproduction of actual traffic capacity in tunnels under different combinations of influencing factors. Therefore, the use of simulation methods can provide valuable insights for tunnel engineers and other stakeholders involved in the design and management of tunnels, ultimately leading to more effective and efficient tunnel systems.
This paper is structured as follows: Section 2 examines the factors of influencing extra-long tunnels capacity and contructs the capacity model of these tunnels; Section 3 validates the built model; Section 4 presents the conclusions and outlook.

2. Methods

2.1. Overview of the Extra-Long Subsea Tunnel Capacity Model

Since the traffic operating conditions of extra-long subsea tunnels are different from those of general urban roads or highways, the recommended capacity values in the relevant manuals are not adaptable. In this paper, the existing road capacity calculation method is used as the basis, and the geometrical conditions and control measures of the tunnel are combined to establish a capacity calculation model applicable to extra-long subsea tunnels. The main process is shown in Figure 1.
In terms of tunnel simulation model selection, the traffic simulation models that are currently used more often are VISSIM, SimTraffic, CORSIM, etc. The main characteristics of each model are as follows:
(1)
VISSIM: It can be used to model and analyze the operation of urban traffic and public transportation under various traffic conditions.
(2)
SimTraffic: The companion software of Synchro, which has good adaptability in urban-oriented traffic network simulation.
(3)
CORSIM: It can be used for microscopic simulation models of urban traffic networks and highway networks, and its highway network simulation model is more complete.
(4)
Transmodeler: Combines macro, meso, and microsimulation models.
In this paper, the VISSIM simulation model is selected for the actual capacity simulation experiment. The main reason is that VISSIM can be adjusted according to the actual situation, such as the following model, lane change model, lateral behavior model, etc., which can make the simulation results more accurately reflect the traffic condition of the long cross-harbor tunnel.

2.2. Identification of the Factors Influencing Extra-Long Subsea Tunnel Capacity

2.2.1. Selection of Influencing Factors

The HCM standard [2] in the United States summarizes the factors affecting capacity, which primarily include: road conditions (road alignment, longitudinal slope gradient, slope length, lane width, etc.), traffic conditions (vehicle composition, lane distribution, etc.), other technical conditions (primarily refers to the Intelligent Traffic System), and other aspects. The following results can be obtained from the above analysis of the traffic flow characteristics of extra-long subsea tunnels: traffic marking in extra-long subsea tunnels will result in uneven traffic distribution; changes in the slope and curve radius of the tunnel, as well as the design of the traffic marking, will affect the speed, resulting in large fluctuations in the speed of the section, the operation of extra-long subsea tunnels’ traffic flow and their road conditions, traffic conditions, and traffic control measurability. As a result, the factors considered to affect the capacity of extra-long subsea tunnels are primarily focused on three aspects: road conditions, traffic conditions, and traffic control measures, which are chosen on the basis of the following criteria.
(1)
Road conditions
Geographical constraints lead to complex alignment combinations in extra-long subsea tunnels with clear distinctions from urban roads. The extra-long subsea tunnels’ cavities are on the ground, at the bottom of the sea, or along the coast, and have a double slope with an increasing slope length. As a result, we consider the longitudinal slope, curve radius, lane road, and lane width as the factors that affect the condition of the road.
(2)
Traffic conditions
Large vehicles must drive on the right side of the extra-long subsea tunnel, which makes the uneven distribution of lanes in the tunnel particularly significant. Additionally, there are some differences between extra-long subsea tunnels and urban roads, so the traffic composition and lane distribution are chosen as the factors that influence traffic conditions.
(3)
Traffic management techniques
The speed limit, traffic markings, and lane control are chosen as the factors that influence the traffic control mode because the control mode in extra-long subsea tunnels is relatively simple compared to city roads and mainly includes these features.
In conclusion, this study combines the traits of extra-long subsea tunnels and chooses the variables that affect their capacity, as shown in Table 2.

2.2.2. Identification of the Key Influencing Factors

(1)
Evaluation system construction
In this paper, based on the factors affecting the capacity of extra-long subsea tunnels identified in the previous section, an index system for evaluating the factors affecting the capacity of extra-long subsea tunnels is established, as shown in Figure 2.
(2)
Weighting calculation
This paper integrates hierarchical analysis and the entropy power method to determine the key influencing factors of extra-long subsea tunnel capacity. Firstly, a judgment matrix is constructed by combining the analysis of different influencing factors on tunnel traffic flow with expert scoring, and the judgment matrix of each factor is shown in Table 3, Table 4, Table 5 and Table 6.
Through the calculation, it can be seen that the consistency ratio of the judgment matrix of each influence factor is less than 0.1, indicating that each judgment matrix meets the consistency requirement. Therefore, the weights of the influence factors of extra-long subsea tunnel capacity are obtained, as shown in Table 7.
Since the hierarchical analysis method is too subjective, this paper uses the entropy weighting method to calculate the objective weights of the indicators. To facilitate the calculation, each line of data represents a section of the tunnel evaluation object. The starting and ending pile numbers are shown in the data table. In the table is also shown traffic composition, lane distribution, lane control set to 1, the solid line set to 1, the left change set to 2, and the vehicle convergence set to 3. The impact factor evaluation table is shown in Table 8 below.
The weights of each influencing factor were calculated by the entropy weighting method, as shown in Table 9 below.
The capacity of extra-long subsea tunnels is primarily influenced by slope, traffic marking, curve radius, traffic composition, and lane distribution, according to Table 9. As a result, the effect of traffic patterns and the environment in which vehicles operate on the capacity of exceptionally long subsea tunnels is not taken into account in this paper. The slope, traffic markings, and curve radius are found to be the key influencing factors of extra-long subsea tunnels based on the results of the integrated hierarchical analysis and entropy power method.

2.3. Development of the Capacity Model for Extra-Long Subsea Tunnels

Based on the comparison of capacity models in various manuals, it can be determined that the basic calculation of capacity is based on the basic capacity of the lane and its correction, so the basic form of the capacity calculation model can be summarized as follows:
C r = C 0 × N × f ( i 1 , i 2 , , i n )
Cr—Actual capacity of the extra-long subsea tunnel;
C0—Basic capacity of a single lane under ideal conditions, vehicles/h/lane;
N—Number of lanes;
I—Tunnel Slope, %;
f(i1,i2,…,in)—Correction factor for the influence factor of traffic capacity.
(1)
According to the key influencing factors of the extra-long subsea tunnel capacity identified in Section 2.2.2 of this paper, the influence of each factor on the capacity was analyzed, the relationship between the influencing factors and the capacity was established, and the form of each parameter in the capacity model was determined.
(2)
By analyzing the three key influencing factors on the capacity of the extra-long subsea tunnel, including the slope of the longitudinal slope, the radius of the flat curve, and the marking, and after determining the form of each parameter, the capacity model of the extra-long subsea tunnel was constructed, and the multiple non-linear regression equation is as follows, where the dependent variable is the actual capacity, the independent variable is the slope of the longitudinal slope and the radius of the flat curve, and the form of the marking is used as the correction coefficient.
C r = ( C 0 × N × β 0 + f ( i ) + f ( R ) ) × f l
R—Radius of the flat curve, km;
fl—Traffic marking correction factor;
β 0 —Coefficient to be determined.
(3)
Using VISSIM simulation software, we constructed a traffic simulation model of an extra-long underwater tunnel, conducted a sensitivity analysis on the driving behavior and other parameters in the model, determined the key parameters, and then calibrated them to obtain a traffic simulation model that can accurately reflect the actual operation of the tunnel. Based on the simulation model of the extra-long cross-harbor tunnel, the traffic flow data of the tunnel were obtained, and the actual capacity of the tunnel was obtained by comparing the measured capacity methods.
(4)
Based on the data in the third step, the model was fitted using the multiple nonlinear regression method to determine the parameters of each influencing factor.
(5)
For the test of the multiple nonlinear regression model, the test used was the misfit term test, which was used to judge the reliability of the model.

2.4. Development and Calibration of the Simulation Model for Extra-Long Subsea Tunnels

2.4.1. Simulation Model Construction Process

When using VISSIM for road simulation, model distortion may occur if default driving behavior parameters are used. To solve this problem, the process of constructing and correcting the traffic simulation model of the extra-long subsea tunnel based on VISSIM simulation software used in this paper is shown in Figure 3.
As can be seen from Figure 3, the simulation model construction and calibration methods for the extra-long subsea tunnel in this paper mainly include: data acquisition, traffic element modeling, model element checking, simulation parameter sensitivity analysis, simulation model parameter calibration, and simulation model validation.
(1)
Data acquisition: The data required for modeling the long undersea tunnel mainly include: road network data (road type, road length, lane width, number of lanes, slope, etc.); traffic control data (signs and markings); driver-vehicle data (vehicle class, traffic composition, etc.); model calibration data (cross-sectional flow, etc.).
(2)
Traffic element modeling: Based on the collected traffic elements, they are correctly and reasonably expressed in VISSIM.
(3)
Model element checking: mainly includes basic road network model checking (no cut-off roads, road alignment matching with actual); traffic control checking (whether simulated vehicles comply with control measures); animation checking (whether there is abnormal congestion, vehicle crush collision phenomenon).
(4)
Sensitivity analysis of simulation parameters: test the degree of influence of each driving behavior parameter in the simulation model on the traffic operation status of the extra-long subsea tunnel, statistically analyze the influence of each parameter on the flow and travel time of the extra-long subsea tunnel, and determine the parameters to be calibrated for the simulation model.
(5)
Simulation model parameter calibration: Based on the simulation parameter sensitivity analysis results, the parameters to be calibrated are determined, and the measured data are used as data support to determine the values of key parameters.
(6)
Simulation model validation: Select typical indicators for statistical analysis, such as: section flow, speed, queue length and other indicators of the measured data and simulation results for comparison.

2.4.2. Simulation Parameter Sensitivity Analysis

The models that need to be calibrated based on measured traffic data in VISSIM are the desired speed distribution, driving behavior model (follow-along model), lane change model, and lateral behavior model. In this paper, we focus on the parameters of the desired speed and driving behavior model (Wiedemann 99 follow-along model) for parameter sensitivity analysis.
(1)
Expected speed distribution
Desired speed is the safe driving speed that the driver expects to achieve under the condition that the vehicle is not disturbed or constrained by other vehicles. In the VISSIM simulation model, the desired speed determines the initial speed and acceleration of the vehicle entering the road network, which has an important impact on the vehicle’s lane-changing behavior and queuing.
(2)
Follower model
VISSIM uses the physiological–psychological driving behavior model established by Wiedemann. The basic idea of the model is that the driver of a vehicle traveling at a faster speed perceives a slower vehicle in front of them and starts to decelerate and reaches the desired speed limit to follow the driver because the driver of the car behind cannot accurately judge the speed of the car in front, so their speed will be lower than the speed of the car in front, which triggers them to take accelerating measures to a certain extent until they reach the desired value again. Thus, the iterative process of acceleration and deceleration is repeated.
In the VISSIM simulation software, there are two vehicle-following models: the Wiedemann 74 model and the Wiedemann 99 model. The Wiedemann 74 model is mainly applied to the study of urban road traffic flow characteristics, while the Wiedemann 99 model is optimized on the original Wiedemann 74 model and mainly applied to expressways and highways. Therefore, this paper focuses on the calibration of the relevant parameters in the Wiedemann 99 model.
The Wiedemann 99 model is a following model proposed by Wiedemann in 1999, which refines the impact parameters into nine, including stopping distance, headway time distance, and following variables.
CC0 (Parking distance): the desired stopping distance between two vehicles.
CC1 (Headway time distance): the distance the driver wants to maintain at a given speed. As the value increases, the driver also has to increase their attention.
CC2 (Following variable): the distance difference allowed (longitudinal fluctuation) needs to be limited before the driver becomes aware of approaching the vehicle driving in front.
CC3 (Threshold for entering the following state): defines, in seconds, the beginning of the deceleration process before reaching a safe distance. At this point in time, the driver will detect the slower vehicle ahead.
CC4 (Negative following threshold): defines the negative speed difference during following. Lower values cause the driver to react more sensitively to the acceleration or deceleration of the vehicle moving ahead.
CC5 (Threshold for active following state): defines the positive speed difference during following.
CC6 (Vehicle speed vibration): the effect of distance on speed fluctuation during following a vehicle value 0; fluctuations are independent of distance. As the distance increases, the speed fluctuation also becomes larger.
CC7 (Acceleration vibration amplitude): acceleration during fluctuation.
CC8 (Acceleration at stopping): desired acceleration when starting from a stop by the maximum acceleration limit of the acceleration curve.
CC9 (Acceleration at vehicle speed of 80 Km/h): Acceleration at a speed of 80 km/h limited by the maximum acceleration of the acceleration curve.

3. Results and Discussion

3.1. Qingdao Jiaozhou Subsea Tunnel

3.1.1. Tunnel General Information

The Qingdao Jiaozhou Bay Subsea Tunnel is about 7797 m long overall, and the left and right lines are set up separately in the main tunnel. The Jiaozhou Bay Subsea Tunnel is designed as an urban expressway; the main road has six two-way lanes, and the total width of the travel lane is 10.75 m. Among them, the headroom in the main tunnel is about 8.2 m, and the width is about 14.3 m; it has a designated speed of 80 km/h. The right tunnel (Qingdao–Huangdao) has a maximum longitudinal slope of 3.9%, an 830 m slope length, nine variable slope points, and a minimum turning radius of 1000 m. The left tunnel (Huangdao–Qingdao) has a maximum longitudinal slope of 4.0%, a slope length of 797 m, nine side slope points, and a minimum turning radius of 1200 m. The subsea tunnel is a V-shaped, multi-bore, one-way subsea tunnel that is particularly long, has a steep longitudinal slope, and has a road alignment that generally slopes continuously from downhill to gently uphill throughout the tunnel.
The road conditions following the second alignment of the Qingdao Jiaozhou Bay Subsea Tunnel were chosen. After the second delineation, the design of the tunnel markings was determined, and the VISSIM simulation model was adjusted to obtain the traffic flow parameters to determine the actual capacity of the tunnel section; then, the parameters corresponding to the influencing factors such as tunnel slope, curve radius, and marking form were brought into the actual capacity calculation model of Jiaozhou Bay Subsea Tunnel constructed in this paper to obtain the calculated valence.
Figure 4 depicts the tunnel’s road plan following the second round of delineation of the Qingdao Jiaozhou Bay Tunnel. Table 10 and Table 11 show the road data.
According to the above data, the VISSIM simulation model of Jiaozhou Bay Crossing was modified, and some of the model modifications are shown in Figure 5 (the red box is where the marking form changed after the second crossing).

3.1.2. Environmental Characteristics

(1)
Spatial structure characteristics
The key components of a cross-harbor tunnel’s structure are the tunnel door, the tunnel body, and the internal systems necessary to maintain traffic safety. To ensure the comfort and visual safety of the driver’s eyes, the tunnel door can moderate the contrast between the light and dark inside and outside the tunnel entrance. The topography, geology, and engineering technology of the tunnel place restrictions on the tunnel body’s structure, resulting in a confined space inside the tunnel.
The tunnel’s enclosed space creates a single environment with poor lighting, which makes for a poor driving environment and makes it simple for drivers to underestimate their vehicle’s speed and go over the posted limit. The driver in the entrance and exit section of the cross-harbor tunnel will quickly complete the conversion of strong and weak visual reference environments despite the high illumination outside, the open field of view, and the presence of some safety hazards. Additionally, as cars are moving through the tunnel, the monotonous side walls will make the driver tense, which will cause cars to veer to the left. Additionally, when a driver is in a long-term state of anxiety, their operational effectiveness decreases, which affects the stability of the tunnel traffic flow and lowers the efficiency of tunnel traffic.
(2)
Travel environment characteristics
Cross-harbor tunnels have advantages over regular highways in that they are stable, disaster-resistant, and weather-unaffected, ensuring traffic flow on both sides of the strait. At the same time, cross-harbor tunnels’ driving conditions differ greatly from those of other highways due to their unique geographic location and intricate structural features.
Lighting conditions
To ensure traffic safety, the interior of the cross-harbor tunnel is illuminated by an artificial lighting system to achieve all-weather lighting, while the illumination outside the tunnel is similar to that of a regular open road, with natural lighting during the day and artificial lighting at night.
Air quality, ventilation, and noise
The noise generated by vehicles and facilities in the tunnel is difficult to dissipate quickly due to its closed space, making drivers and passengers easily bored and anxious, affecting driving safety to some extent; the longitudinal slope of the tunnel affects ventilation conditions, and the deposited vehicle exhaust will reduce the air quality inside the tunnel, posing a potential threat to drivers and passengers.
Auxiliary services
The cross-harbor tunnel is outfitted with a central control system, signs, markings, ventilation system, lighting system, traffic monitoring system, fire detection and alarm facilities, fire-fighting facilities, and passageways, among other things, to ensure traffic safety and comfort. These complex ancillary facilities require long-term maintenance to ensure normal operation.

3.1.3. Traffic Flow Characteristics

(1)
Uneven traffic distribution
The statistical results of the all-day traffic flow of the right lane of the Qingdao Jiaozhou Bay Tunnel (Qingdao–Huangdao) for a week in January 2021 for the left center and right lanes are shown in Figure 6.
As shown in Figure 6, the middle lane traffic is slightly higher than the left lane traffic, while the right lane traffic accounts for less than 25%, and there is an obvious lane unevenness phenomenon in the traffic distribution. The analysis of its causes focuses on three key points: ① Large vehicles (buses and coaches) must drive on the right side of the Qingdao Jiaozhou Bay Subsea Tunnel, while the remaining two lanes are small car lanes. The subsea tunnel’s right lane is a mix of large and small cars, and the slow speed of buses and coaches reduces the rate of small cars driving, resulting in low utilization of the right lane. ② Because the tunnel markings are mostly solid lines, vehicles entering the tunnel are limited in their ability to choose a lane, resulting in low utilization of the right lane. ③ Due to the side wall effect, which the tunnel’s side wall will have on the driver’s psychology, the driver will be more inclined to choose the middle lane.
(2)
Excessive head spacing
The average headway corresponding to different slopes in the subsea tunnel was counted separately using Qingdao Jiaozhou Bay Subsea Tunnel inside-loading video images for a total of 11 cross-sections in the left lane and 10 cross-sections in the right lane, as shown in Figure 7 (Figure: 1—downhill, 2—flat slope, 3—uphill).
As shown in Figure 7, the change in slope in the tunnel has an effect on vehicle headway, and there is an inverse relationship between headway and traffic flow; the larger the average headway with the same car ratio, the lower the traffic flow through, so the change in slope will have an effect on road capacity.
(3)
Significant fluctuations in operating speed
The section speed data of different slopes are collected from the subsea tunnel side-loading video, and the speed variation of vehicles in different sections of each lane is plotted, as shown in Figure 8.
As can be seen from Figure 8, the tunnel speed has lane unevenness and the speed of each section of the tunnel fluctuates widely, which is due to the following reasons. ① The driver’s own factors. ② Traffic composition—the mix of different types of vehicles on the road and the proportion of different vehicle types are important factors affecting the distribution of speed; the subsea tunnel provides for large vehicles to drive on the right, making the right lane speed significantly lower than the left lane and the middle lane. ③ Road factors, changes in slope and curve radius in the subsea tunnel, and the design of traffic markings will all have an impact on vehicle speed. ④ Environmental factors—bright and dark adaptation of drivers at tunnel entrances and exits leads to fluctuations in vehicle speed.

3.1.4. Key Factors and Characteristics Affecting Tunnel Capacity

(1)
Longitudinal slope gradient
In this paper, we use the video data collected from the side-mounted video of the Qingdao Jiaozhou Bay Tunnel to obtain the section flow of different slope sections and analyze the influence of longitudinal slope on the section flow of the tunnel. The statistical results are shown in Figure 9 and Figure 10 (section 1—downhill, 2—flat slope, 3—uphill in the figure).
As seen in the above figure, there is a relationship between the tunnel flow and the slope of the longitudinal slope; in the downhill section, as the slope decreases, the tunnel cross-sectional flow increases, but in the flat section and the uphill section, the relationship is not significant. This is primarily because changes in the tunnel’s slope cause speed fluctuations, such as when a vehicle is driving a downhill section immediately after ascending.
(2)
Curve radius
In this paper, we use the video data collected from the side-mounted video of the Qingdao Jiaozhou Bay Tunnel to obtain the section flow of different curve radius sections and analyze the influence of curve radius on the tunnel section flow. The statistical results are shown in Figure 11 (section 1—downhill, 2—flat slope, 3—uphill).
The left lane of the subsea tunnel increases with the radius of the tunnel curve in the downhill and flat slope sections, as shown in Figure 11, and the tunnel cross-sectional flow increases with the radius of the curve. However, the relationship between the curve radius and flow rate is not significant in the uphill section; in the right lane of the tunnel, the tunnel cross-sectional flow rate increases with increasing curve radius in the flat-slope section, but not in the other sections. The main reason for this could be that the main influencing factor for the change in tunnel section flow is the stability of the traffic flow, i.e., the speed of the vehicles in the section before and after a certain section, whereas the longitudinal slope has a greater impact on the speed of the moving vehicles, so the relationship is not significant when analyzing the relationship between the curve radius and the flow.
(3)
Traffic Markings
This paper chooses a tunnel marking before and after the application of tunnel cross-sectional flow data for comparative analysis, and for workdays, cross-sectional hourly traffic flow statistics before and after the marking of the roadway, as shown by the solid line; the statistical results are shown in Figure 12.
According to the above graph, the overall situation demonstrates an increase in cross-sectional traffic following the marking of the line, as well as a slight increase in cross-sectional traffic at all times, with an average growth rate of 4.95%. As a result, the marking will have an impact on the tunnel section’s effectiveness.

3.2. Simulation Model for Qingdao Jiaozhou Bay Tunnel

3.2.1. Development of Simulation Models

Given the complex geometric alignment of the Jiaozhou Bay Subsea Tunnel, and in order to analyze the impact of the single factors of tunnel slope and curve radius on capacity, this section builds a traffic simulation model of the Jiaozhou Bay Subsea Tunnel based on the VISSIM simulation model to lay the groundwork for the capacity model.
In order to accurately simulate the actual operation of the Jiaozhou Bay Subsea Tunnel under different traffic operating conditions, this paper constructs a microscopic simulation model of the Jiaozhou Bay Subsea Tunnel based on the VISSIM simulation software, including the establishment of the basic road sections, where the tunnel slope is achieved based on the Z coordinate settings, as shown in Figure 13 (since the depth of the Jiaozhou Bay Subsea Tunnel is about 80 m, the horizontal elevation is set to 100 m for the convenience of model adjustment). The traffic input and traffic composition are set in the upstream lane of the tunnel to achieve accurate adjustment of lane level traffic, vehicle composition, and lane transformation, which can simulate the operation of the Jiaozhou Bay Subsea Tunnel under different traffic conditions more accurately. The section of the Jiaozhou Bay Subsea Tunnel is drawn in the VISSIM simulation software as shown in Figure 14.
This paper uses additional lane-level trail sections as the starting point and end point of lane change path decisions before and after the tunnel markings to simulate the operating characteristics of vehicles in the tunnel at different markings, as shown in Figure 15. Using existing lane change data for proportional input, the left lane level traffic error is 5% at maximum and 1.6% at minimum, the total traffic difference is 3.3%, and the right lane level traffic error is 3.3% at maximum. Table 12 and Table 13 show the specific values.

3.2.2. Test Simulation Parameter Sensitivity

The set of parameters to be calibrated is determined based on the parameters in the VISSIM simulation, and a parameter sensitivity analysis is performed using the control single variable method, with the other parameters taking default values when one of the parameters is selected for testing. The following parameters were chosen for testing for the Jiaozhou Bay Subsea Tunnel, and the parameter sensitivity analysis scheme is shown in Table 14.
For the purpose of testing the sensitivity of the simulation parameters, the morning peak data of the right (Qingdao–Huangdao) and left (Huangdao–Qingdao) test sections of the Jiaozhou Bay Subsea Tunnel were chosen. The measured traffic flow data of the tunnel, including the flow through the tunnel entrance, the ratio of vehicles changing lanes, and the composition of the vehicles, were entered into the simulation model, and the results are shown in Table 15.
Dual indicators are used in this paper to assess the sensitivity of each parameter, and the specific results are shown in Table 16 and Table 17 below. The table below shows that the expected speed, CC0 stopping distance, CC1 headway time distance, and CC2 following variables have a large impact on the simulation model’s flow and travel time results, with a difference ratio of greater than 7%; the other parameters have a smaller impact on the simulation model, with a difference ratio of less than 5%. As a result, the key influencing parameters in the Jiaozhou Bay Subsea Tunnel simulation model are as follows: desired speed, CC0 stopping distance, CC1 headway time distance, and CC2 following variables.

3.2.3. Calibration of Simulation Model Parameters

For the key parameters of the model (desired speed, CC0 stopping distance, CC1 headway time distance, and CC2 following variables), the simulation parameters were calibrated and the results were determined as shown below.
(1)
CC0 stopping distance: 2.3 m.
(2)
CC1 headway time distance: as shown in Table 18.
(3)
CC2 following variables: tunnel left lane (Huangdao–Qingdao)—4.094; tunnel right lane (Qingdao–Huangdao)—3.520.
After optimization according to the above parameters, a comparative analysis was performed for the optimized simulation model and the actual measured tunnel data, comparing the flow rates obtained from Wiedemann 99 (default parameters), Wiedemann 99 (optimized) and the actual measured data; the data results are shown in Table 19.
In Table 19, it can be seen that the matching effect of the traffic operation parameters of the calibrated and optimized Jiaozhou Bay Subsea Tunnel VISSIM simulation model is better than the simulation results when the default parameters are set, and the relative error of its traffic is controlled below 5%, which can reflect the actual operation of the tunnel vehicles.

3.3. Relationship between Key Influencing Factors and Capacity

3.3.1. Longitudinal Slope Gradient

There are differences in the capacity obtained at different longitudinal slope gradients, and the capacity varies with the slope, as shown in Table 20.
A polynomial regression fit was performed based on the simulation data in Table 20 to establish the relationship between slope and capacity, as shown in Figure 16.
The goodness-of-fit R-sq of the model is close to 1, the fit is good, and the regression equation is obtained as
C = 4809 1685 i 52535 i 2
Figure 16 clearly shows that as the slope increases, the road capacity decreases. When the longitudinal slope reaches 3%, the road capacity decreases significantly, and this value is more significant in the tunnel’s uphill section.

3.3.2. Curve Radius

Given the issue of experimental data unit conversion, the unit of curve radius was set to km. Because the curve radius of the straight section of the tunnel cannot be directly expressed, the reciprocal of the curve radius, i.e., 1/R, was used to represent the variable of curve radius when analyzing the relationship between the curve radius and the tunnel capacity, and the statistical results are shown in Table 21.
A polynomial fit regression was performed to establish the relationship between curve radius and capacity based on the simulation data in Table 21, as shown in Figure 17. The model fits with average goodness of fit and the regression equation is obtained:
C = 4807 74.46 R
Overall, the subsea tunnel capacity is linearly negatively correlated with 1/R, and the tunnel capacity shows a decreasing trend with the increase of 1/R, i.e., the capacity increases with the increase of curve radius.

3.3.3. Traffic Markings

Fifteen cross-sections in the tunnel were selected to count the capacity under different traffic markings, and the statistical results are shown in Figure 18.
From the above figure, it can be seen that the capacity of the traffic marking is increased when the dashed line is compared with the solid line, but there is no significant pattern, which can be used as a correction factor to optimize the actual capacity calculation model of the subsea tunnel in the subsequent model construction process.

3.4. Qingdao Jiaozhou Subsea Tunnel Capacity Model

3.4.1. Development of the Capacity Model

Based on the relationship between slope, radius and marking, and tunnel capacity established above, a multiple non-linear regression analysis is used to establish a tunnel capacity model, where the dependent variable is the actual capacity, the independent variables are the slope and radius of the flat curve, and the traffic marking is used as a correction factor. The multiple non-linear regression equation is:
C r = ( C 0 × N × β 0 + β 1 i 2 + β 2 R 1 ) × f l
Cr—Actual capacity of the Qingdao Jiaozhou Bay Subsea Tunnel;
C0—Basic capacity of a single lane under ideal conditions, vehicles/h/lane;
N—Number of lanes;
i—Tunnel slope, %;
R—Radius of the flat curve, km;
fl—Traffic marking correction factor;
β 0 , β 1 , β 2 —Coefficient to be determined.

3.4.2. Obtaining Actual Tunnel Capacity

The actual capacities of the left lane (Huangdao–Qingdao) and right lane (Qingdao–Huangdao) of the Qingdao Jiaozhou Bay Subsea Tunnel were obtained and are shown in Table 22.

3.4.3. Fitting the Nonlinear Regression Equation

Based on the data obtained from Table 22 above, a multivariate nonlinear regression was fitted and the calculated results were obtained as shown in Table 23.
According to Table 23, the nonlinear regression equation can be obtained as:
(1)
Left line (Huangdao–Qingdao)
C r = C 0 × N × 0.74063 2.42536 i 2 30.8482 R 1
(2)
Right line (Qingdao–Huangdao)
C r = C 0 × N × 0.759083 5.70397 i 2 50.6497 R 1
Cr—Actual capacity of the Qingdao Jiaozhou Bay Subsea Tunnel;
C0—The basic capacity of a single lane, pcu/h/lane, under ideal conditions, is taken as 2100 pcu/h/lane;
N—Number of lanes, taken as 3;
i—Slope of the tunnel, %;
R—Radius of the flat curve, km.

3.4.4. Checking the Goodness of Fit

The misfit term test was used to determine whether the regression model is acceptable for the goodness-of-fit test for the affordability model established in this paper. The misfit test’s key parameters are DF (degrees of freedom), SS (different sums of squared errors), MS (mean square of different errors), F (chi-square test), and p-value (significance).
Table 24 shows the misfit test results for the models used in this paper to calculate the actual capacity of the left and right lanes of the Qingdao Jiaozhou Bay Subsea Tunnel. The table shows that the misfit test parameter F is small for both models, and the p-values are greater than 0.05 for the left line of the tunnel and 0.701 for the right line of the tunnel. If the p-value is greater than the significance level, no model misfit is detected, and the regression equation is proven to be reliable.

3.4.5. Determining the Marking form Correction Factor

On the basis of the geometric condition-based Qingdao Jiaozhou Bay Subsea Tunnel capacity model developed above, the correction factors for traffic markings were determined using the difference scaling method, as shown in Table 25.
According to the above table, the average difference in capacity after traffic marking changes from solid lines to dashed lines is 33.6, and the percentage difference is 0.73%, so the correction factor is 1.0073. To summarize, the actual capacity model of the Qingdao Jiaozhou Bay Subsea Tunnel built in this paper is as follows:
(1)
Left line (Huangdao–Qingdao)
C r = ( C 0 × N × 0.74063 2.42536 i 2 30.8482 R 1 ) × f l
(2)
Right line (Qingdao–Huangdao)
C r = ( C 0 × N × 0.759083 5.70397 i 2 50.6497 R 1 ) × f l
Cr—Actual capacity of the Qingdao Jiaozhou Bay Subsea Tunnel;
C0—Under ideal conditions, the basic capacity of a single lane, taken as 2100 pcu/h/lane;
N—Number of lanes, number of lanes in the Qingdao Jiaozhou Bay Subsea Tunnel, taken as 3;
i—Slope of the tunnel, %;
R—Radius of flat curve, km;
fl—Traffic marking correction factor, solid lines take 1, dashed lines take 1.0073.

3.5. Comparative Analysis of Passage Capacity

For model validation, the Qingdao Jiaozhou Bay Tunnel’s road conditions following the second marking were chosen. The design of the tunnel markings after the second alignment, the traffic flow parameters, and the parameters corresponding to the tunnel slope, curve radius, and traffic markings were then added to the actual capacity calculation model of the subsea tunnel built in this paper, the calculated values were obtained, and the two were then compared for analysis.
The actual capacity of eight cross-sections before and after delineation was compared with the calculated capacity of the model to validate the capacity calculation model of the subsea tunnel based on geometric conditions and control measures established in this paper. Because the majority of the delineated places in the tunnel are concentrated on flat or uphill slopes, six uphill slopes, one flat slope, and one downhill slope were chosen, and traffic data were extracted in the VISSIM simulation model. The section selections are shown in Table 26 below, and the results of the Jiaozhou Bay Tunnel example verification section capacity comparison are shown in Table 27 and Figure 19.
In the previous article, the factors affecting the tunnel capacity were determined, and the slope, marking form, etc. have a greater impact on the capacity. For No. 5, the slope is 0.3, the vehicle driving experience is better, the traffic marking form is dashed, and the vehicle can change driving lanes in the tunnel safely, avoiding the existence of tunnel congestion caused by improper driving behavior of the previous vehicle, thus improving the capacity, so the capacity of No. 5 is higher. As mentioned above, the slopes of No. 3 and No. 8 are larger, and the marking in No. 8 is in the form of solid lines, vehicles cannot change lanes, vehicle driving behavior is restricted, and in some specific cases, the tunnel capacity will be reduced.
By comparing the actual capacity and the calculated capacity of the model in Table 25, it can be seen that the calculated results of the tunnel capacity model constructed in this paper have a small error compared to the actual capacity value, where the error between the calculated capacity and the actual capacity is only 0.51% at No. 5, which proves that the tunnel capacity model constructed in this paper has a smaller error compared to the actual one and can calculate the tunnel capacity better. Moreover, by comparing the data, we can conclude that the calculation results of the Jiaozhou Bay Subsea Tunnel capacity model based on geometric conditions and control measures constructed in this paper are within 4% error of the actual capacity, which is within the acceptable range and can calculate the actual capacity of the subsea tunnel more accurately.

4. Conclusions

The effects of longitudinal slope gradient, the radius of the flat curve, and control measures on the capacity of extra-long subsea tunnels are studied in this paper, and the multiple linear regression model idea is used to establish a calculation model of the capacity of Jiaozhou Bay’s extra-long subsea tunnel based on geometric conditions and control measures. The following are the key conclusions:
(1)
Road conditions, traffic conditions, traffic control measures, and tunnel traffic flow operation are all closely related to the tunnel and have an effect on its capacity. The traffic marking in extra-long subsea tunnels will result in uneven traffic distribution; the change of slope will affect the headway between vehicles, affecting road capacity; the change of slope and curve radius in the tunnel, as well as the design of traffic marking, will affect speed, resulting in large fluctuations in speed in the section, which provides a new idea for the improvement of the continuous carrying capacity of the tunnel.
(2)
As the slope increases, the capacity of the tunnel road decreases. When the longitudinal slope reaches 3%, the road capacity decreases significantly as the slope increases.
(3)
Tunnel capacity is linearly and negatively correlated with the reciprocal of the curve radius (1/R), with tunnel capacity decreasing as 1/R increases, i.e., the capacity increases as the curve radius increases.
(4)
Although there is no significant relationship between traffic marking and capacity growth, the difference ratio method can be used to optimize the actual capacity calculation model of the Qingdao Jiaozhou Bay Subsea Tunnel.
(5)
The capacity of the Qingdao Jiaozhou Bay Subsea Tunnel is calculated using a multiple non-linear regression model with an error of less than 4% when compared to measured data, indicating that the method is practical and scientific, and has important significance for evaluating the sustainable traffic capacity of the tunnel.
This paper examines the factors that influence the capacity of extra-long subsea tunnels, develops a model for calculating actual capacity, and validates it using the Jiaozhou Bay Subsea Tunnel as a case study. Due to time and resource constraints, more research on the capacity of subsea tunnels is required, and the following aspects are suggested.
(1)
Because of the cross-harbor tunnel’s unique spatial structure and road alignment, only the impact factors of its capacity, such as the slope of the longitudinal slope, the radius of the flat curve, and the design of traffic markings, are examined in this paper.
(2)
The lane change characteristics and driver behavior characteristics are not verified and calibrated when constructing the simulation model of the cross-harbor tunnel, which can be further analyzed in the future.
(3)
In this paper, the actual capacity calculation model for the basic section of extra-long subsea tunnels is established, and the capacity calculation model for the intertwined area and ramps of the subsea tunnel can be considered later.

Author Contributions

Methodology, R.X. and X.C.; validation, B.P.; data curation, T.Y.; writing—original draft preparation, Z.L. and X.R.; writing—review and editing, Z.L. All authors have read and agreed to the published version of the manuscript.

Funding

This work was supported by the Young Scientists Fund of the National Natural Science Foundation of China (grants nos. 52002045), the Science and Technology Research Program of Chongqing Municipal Education Commission (grants nos. KJQN201900725) and the Project of Innovative Research Groups for Universities in Chongqing (grants nos. CXQT21022).

Institutional Review Board Statement

The study did not require ethical approval.

Informed Consent Statement

Not applicable.

Data Availability Statement

The numerical data used to support the findings of this study are included within the article.

Conflicts of Interest

The authors declare that they have no conflict of interest.

References

  1. Qin, F.; Wang, S.; Xiao, B.; Zhang, Y. Statistics of extra-long highway tunnels over 10 km in China by the end of 2021. Tunn. Constr. (Chin. Engl.) 2022, 42, 1111–1116. [Google Scholar]
  2. Washington, D. Highway Capacity Manual; Transportation Research Board; National Research Council: Washington, DC, USA, 2000. [Google Scholar]
  3. Yang, L.; Wang, C.; Li, Z. Tunnel Traffic Evolution during Capacity Drop Based on High-Resolution Vehicle Trajectory Data. Algorithms 2022, 15, 240. [Google Scholar] [CrossRef]
  4. Anders, T.; Oddrun, H.; Ad, T. Use of public information for road-capacity reductions: A study of mediating strategies during tunnel rehabilitations in Oslo. Transportation 2020, 48, 2263–2286. [Google Scholar]
  5. Mostafa, Z.; Mohamed, A.; Osama, M. Improving the existing roadway tunnels capacity by adding new tunnels—A structural approach. Arab. J. Geosci. 2018, 11, 89. [Google Scholar]
  6. Cai, S. Research on Capacity of Long and Steep Upgrade Sections in Extra Long Underwater Tunnels Based on Cellular Automata. Master’s Thesis, Huazhong University of Science and Technology, Wuhan, China, 2020. [Google Scholar]
  7. Marcel, S.; Francesc, S. Freeway lane-changing: Some empirical findings. Transp. Res. Procedia 2018, 33, 107–114. [Google Scholar]
  8. Zhou, Y.; Gong, H.; Zhao, C.; Xu, X.; Huang, B. Interchange Basic Segment Capacity Impact Factor Analysis Based on Panel Data. J. Transp. Syst. Eng. Inf. Technol. 2020, 20, 163–168. [Google Scholar]
  9. Hashim, I.H.; Abdel-wahed, T.A. Effect of highway geometric characteristics on capacity loss. J. Transp. Syst. Eng. Inf. Technol. 2012, 12, 69–79. [Google Scholar] [CrossRef]
  10. Ghiasi, A.; Hussain, O.; Qian, Z.; Li, X. A mixed traffic capacity analysis and lane management model for connected automated vehicles: A Markov chain method. Transp. Res. Part B Methodol. 2017, 106, 266–292. [Google Scholar] [CrossRef]
  11. Cheng, X.; Guo, X. Analysis on Influencing Factors of Road Traffic Capacity Based on Grey Relational Degree Theory. Urban Roads Bridges Flood Control 2021, 267, 238–240+24. [Google Scholar]
  12. Chang, X.; Li, H.; Rong, J.; Zhao, X.; Qin, L. Effect of the Tunnel Warning System on Traffic Capacity Based on Aggregated Spatiotemporal Characteristics of Vehicles. J. South China Univ. Technol. (Nat. Sci. Ed.) 2020, 48, 107–115+123. [Google Scholar]
  13. Sato, H.; Xing, J.; Tanaka, S.; Morikita, K. Examining the effect of connecting auxiliary lanes on mitigation of expressway traffic congestion. Int. J. Intell. Transp. Syst. Res. 2011, 9, 55. [Google Scholar] [CrossRef]
  14. Olcott, E. The Influence of Vehicular Speed and Spacing on Tunnel Capacity. J. Oper. Res. Soc. Am. 1955, 3, 147–167. [Google Scholar] [CrossRef]
  15. Newell, G. A Theory of Platoon Formation in Tunnel Traffic. Oper. Res. 1959, 7, 589–598. [Google Scholar] [CrossRef]
  16. Wada, K.; Martìnez, I.; Jin, W. Continuum car-following model of capacity drop at sag and tunnel bottlenecks. Transp. Res. Part C Emerg. Technol. 2020, 113, 260–276. [Google Scholar] [CrossRef]
  17. Yuan, Q.; Jing, X.; Shi, C. Traffic Capacity Calculation for Urban Underground Interchange. J. Tongji Univ. (Nat. Sci.) 2021, 49, 236–242. [Google Scholar]
  18. Dhamaniya, A.; Bari, C.; Patkar, M. Capacity Analysis of Urban Arterial Midblock Sections Under Mixed Traffic Conditions. Int. J. Intell. Transp. Syst. Res. 2022, 20, 409–421. [Google Scholar] [CrossRef]
  19. Fu, C.; Gao, L.; Zhong, Y.; Xie, L.; Tu, R. Capacity Evaluation and Application in Urban Expressway Tunnel Section under Lane-Reduction Condition. J. Chongqing Jioatong Univ. (Nat. Sci.) 2022, 41, 52–57. [Google Scholar]
  20. Beheshtitabar, E.; Cetin, M.; List, G. Impacts of Downstream Observability on the Traffic Performance within a Tunnel. In International Conference on Transportation and Development 2019: Smarter and Safer Mobility and Cities; American Society of Civil Engineers: Reston, VA, USA, 2019; pp. 291–302. [Google Scholar]
  21. Fang, S.; Shen, L.; Ma, J.; Xu, C. Study on the design of variable lane demarcation in urban tunnels. Sustainability 2022, 14, 5682. [Google Scholar] [CrossRef]
  22. Ye, L.; Yamamoto, T. Modeling connected and autonomous vehicles in heterogeneous traffic flow. Phys. A Stat. Mech. Its Appl. 2018, 490, 269–277. [Google Scholar] [CrossRef]
  23. Winkler, M.; Fan, W. Evaluating impacts on freeway capacity using VISSIM: Accounting for truck lane restrictions, driver behavior, and interchange density. Adv. Transp. Stud. 2011, 25, 15–28. [Google Scholar]
Figure 1. The process of constructing the capacity of extra-long subsea tunnels.
Sustainability 15 07543 g001
Figure 2. Evaluation system of factors influencing the capacity of extra-long subsea tunnels.
Sustainability 15 07543 g002
Figure 3. Simulation model construction and calibration method for extra-long subsea tunnels.
Sustainability 15 07543 g003
Figure 4. Plan of the Jiaozhou Bay Subsea Tunnel after the second delineation.
Sustainability 15 07543 g004
Figure 5. Schematic diagram of VISSIM simulation model modification.
Sustainability 15 07543 g005
Figure 6. Statistics of lane level daily flow of the right line of the Qingdao Jiaozhou Bay Subsea Tunnel.
Sustainability 15 07543 g006
Figure 7. Statistics of average headway of Qingdao Jiaozhou Bay Subsea Tunnel.
Sustainability 15 07543 g007
Figure 8. Statistics of Qingdao Jiaozhou Bay Subsea Tunnel speed.
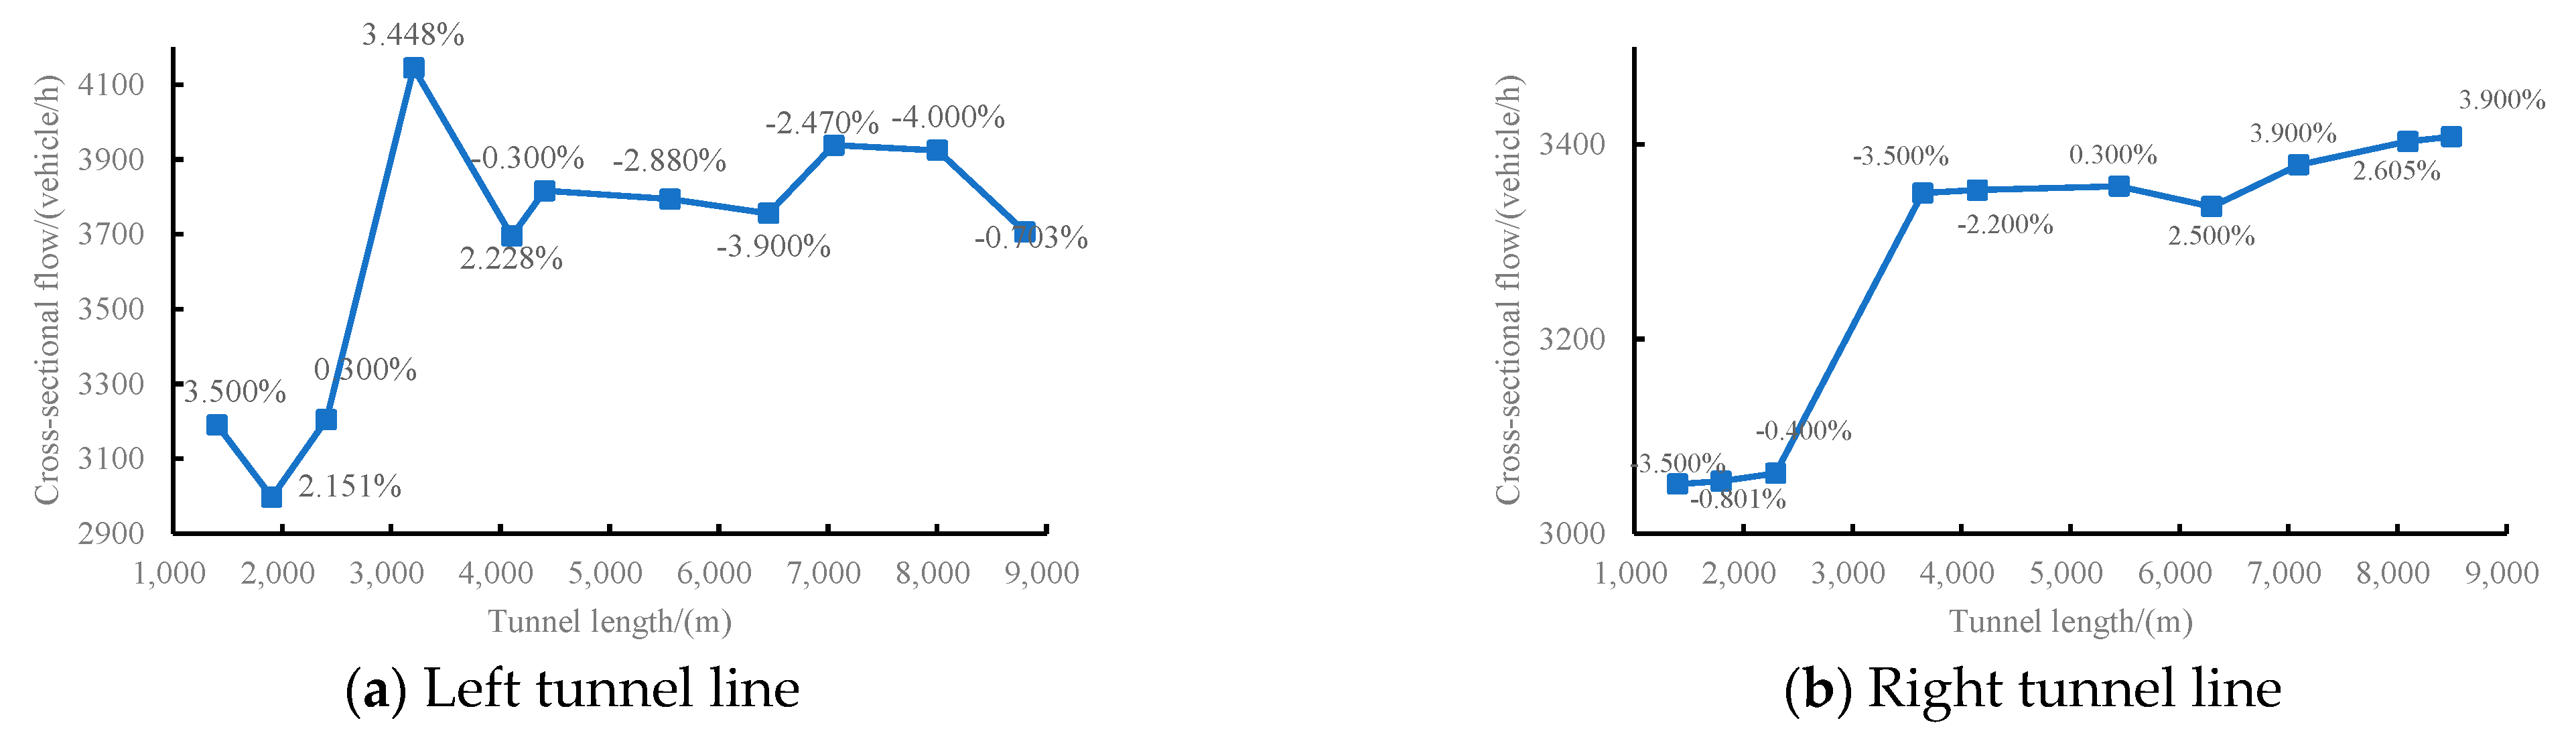
Sustainability 15 07543 g008
Figure 9. Flow statistics of different longitudinal slope sections of the subsea tunnel.
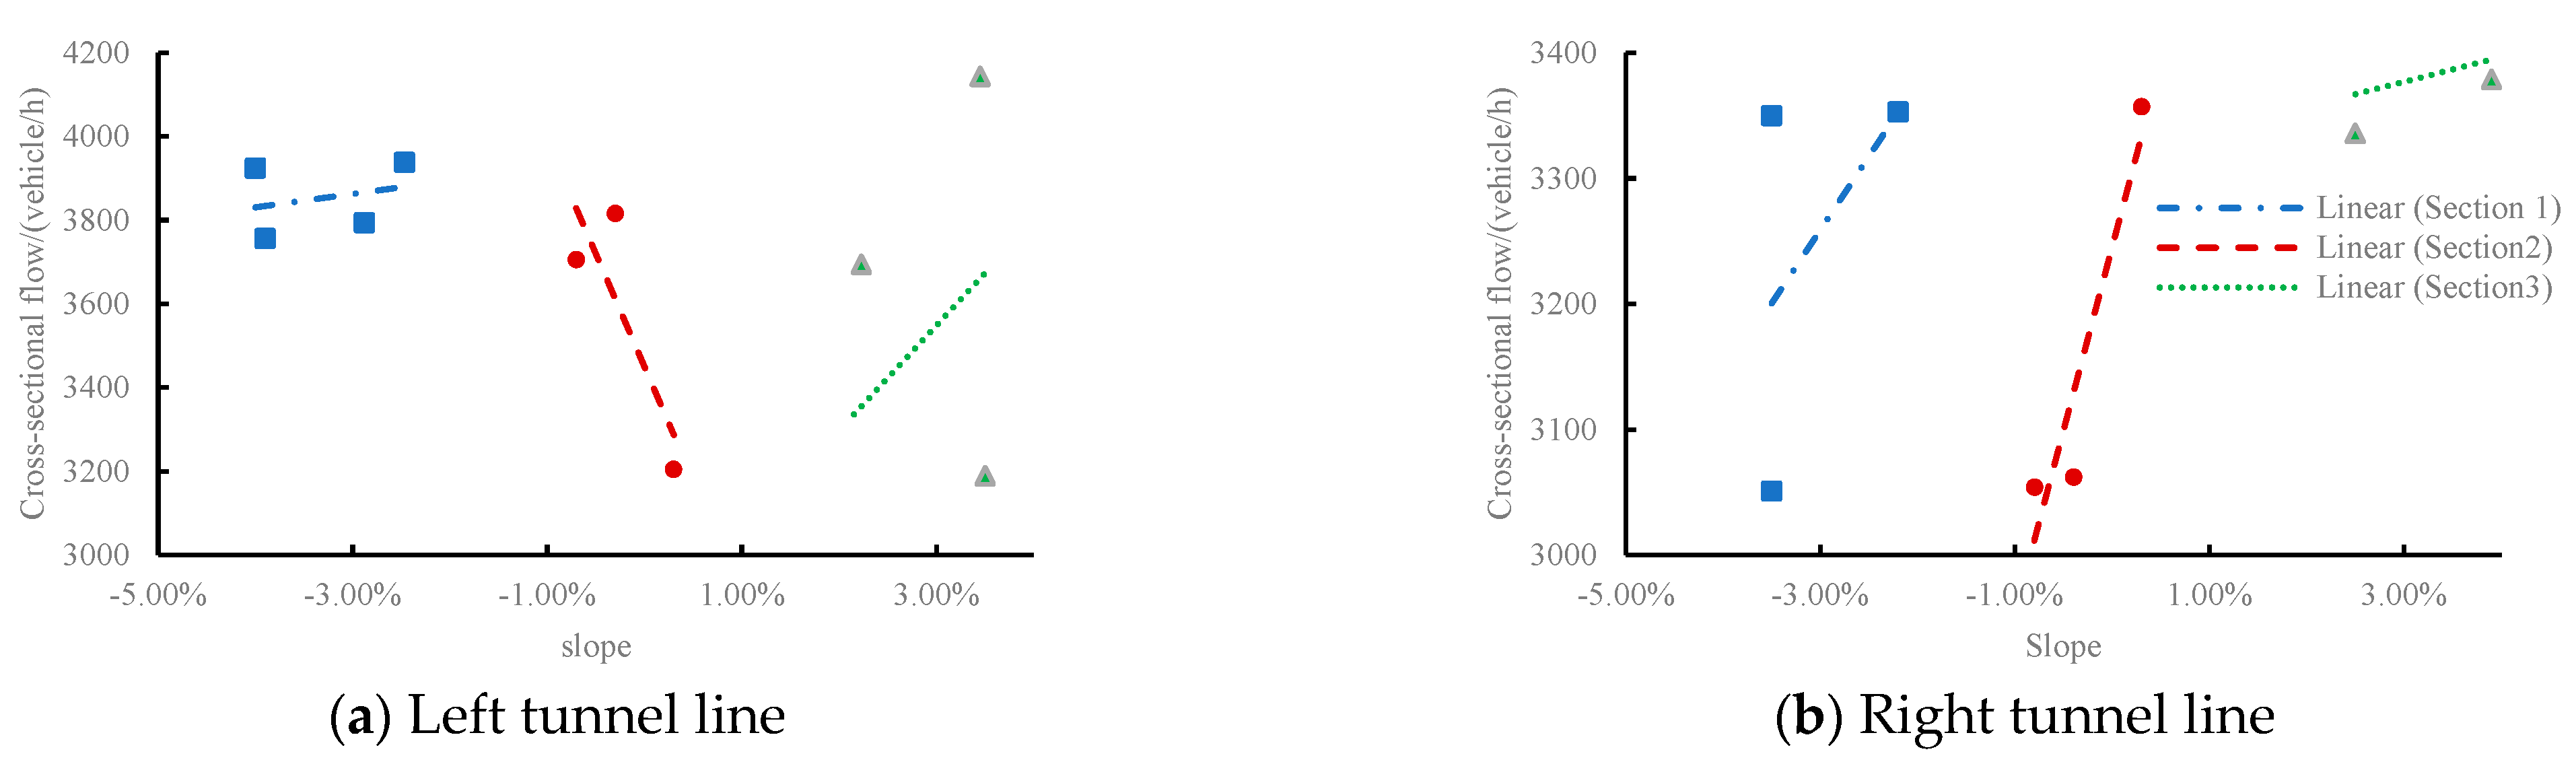
Sustainability 15 07543 g009
Figure 10. Diagram of different slope and section flow of the subsea tunnel.
Sustainability 15 07543 g010
Figure 11. Diagram of different curve radius and section discharge of the subsea tunnel.
Sustainability 15 07543 g011
Figure 12. Cross-sectional hourly flow statistics before and after delineation.
Sustainability 15 07543 g012
Figure 13. Simulation model basic road settings.
Sustainability 15 07543 g013
Figure 14. Jiaozhou Bay Subsea Tunnel simulation model.
Sustainability 15 07543 g014
Figure 15. Vehicle lane change effect.
Sustainability 15 07543 g015
Figure 16. Slope capacity function fitting diagram.
Sustainability 15 07543 g016
Figure 17. Curve radius-capacity function fitting diagram.
Sustainability 15 07543 g017
Figure 18. Statistical chart of traffic capacity corresponding to different marking forms.
Sustainability 15 07543 g018
Figure 19. Comparison Chart of Traffic Capacity.
Sustainability 15 07543 g019
Table 1. Comparison of existing capacity model construction methods.
Theoretical AnalysisData MiningSimulation
Pertinent literature[14,15][16,17,18,19][20,21,22,23]
AdvantageThe calculation formula is easy to deduce and the calculation speed is fast.A large amount of data on tunnel transportation systems can be mined, from which key factors can be extracted, and the corresponding mathematical model can be established to evaluate the traffic capacity.It can take into account the influence of different factors, such as vehicle flow, speed, vehicle type, etc., with high accuracy, and it can simulate the actual operation of the tunnel transportation system.
DeficiencyNot accurate enough, limited by data quality and sample size, not applicable to all types of tunnels, and unable to take into account the complexity and randomness of traffic flow and other factors.It requires a large amount of data support and data preprocessing and analysis. The accuracy of the model is limited by the quality and integrity of the data, and the establishment and maintenance of the model require more time and resources.More data and computing resources are required, and the computational complexity is high, so the parameters and assumptions of the model need to be set in advance.
Table 2. Control mode switch principles.
Road ConditionsTraffic ConditionsTraffic Control Measures
Longitudinal slope gradientTraffic CompositionSpeed limit
Curve radiusLane DistributionTraffic Markings
Number of lanes-Lane Control
Lane width--
Table 3. Judgment matrix of road condition.
Road ConditionsSlopeCurve RadiusNumber of LanesLane WidthWi
Slope12330.4495
Curve radius1/21220.2596
Number of lanes1/31/2120.1707
Lane width1/31/2110.1202
λ max = 4.0716CR = 0.0268 < 0.1
Wi in the table is the relative weights of program level indicators (same below)
Table 4. Judgment matrix of traffic condition.
Traffic ConditionsTraffic CompositionLane DistributionWi
Traffic Composition110.5000
Lane Distribution110.5000
λ max = 2CR = 0 < 0.1
Table 5. Judgment matrix of traffic control mode.
Traffic Control MethodSpeed LimitTraffic MarkingsLane ControlWi
Speed limit11/220.2973
Traffic Markings2130.5390
Lane control1/21/310.1638
λ max = 3.0092CR = 0.0089 < 0.1
Table 6. Judgment matrix of influencing factors of traffic capacity.
Traffic Capacity Influencing FactorsRoad ConditionsTraffic ConditionsTraffic Control ModeWi
Road conditions1220.4905
Traffic conditions1/211/20.1976
Traffic control mode1/2210.3119
λ max = 3.0537CR = 0.0517 < 0.1
Table 7. Weighting of influencing factors on traffic capacity of extra-long subsea tunnels.
Guideline Layer IndicatorsCriterion Level Indicator WeightsProgram Level IndicatorsProgram Level Indicator WeightsOrder
Road conditions0.4905Slope0.22051
Radius of curve0.12733
Number of lanes0.08377
Lane width0.05908
Traffic conditions0.1976Traffic composition0.09884
Lane Distribution0.09885
Traffic control mode0.3119Speed limit0.09276
Traffic Markings0.16812
Lane Control0.05119
Table 8. Data evaluation table.
Starting Stake NumberEnd Stake NumberSlope (%)Curve Radius (m)Number of LanesLane WidthTraffic CompositionLane DistributionSpeed Limit (km/h)Traffic MarkingsLane Control
ZK9 + 174ZK9 + 191−0.703033.5118011
ZK8 + 953ZK9 + 174−0.703200033.5118011
ZK8 + 786ZK8 + 953−4200033.5118011
ZK8 + 509ZK8 + 786−410,00033.5118011
ZK8 + 156ZK8 + 509−4650033.5118011
ZK7 + 770ZK8 + 156−2.47650033.5118011
ZK7 + 020ZK7 + 770−3.9650033.5118011
ZK6 + 917ZK7 + 020−2.88650033.5118011
ZK6 + 255ZK6 + 917−2.8810,00033.5118011
ZK5 + 380ZK6 + 255−0.3-33.5118011
ZK4 + 849ZK5 + 3802.228-33.5118011
ZK4 + 779ZK4 + 8492.228372.52533.5118011
ZK4 + 330ZK4 + 7792.2281982.533.5118011
ZK4 + 260ZK4 + 3302.228372.52533.5118011
ZK3 + 870ZK4 + 2602.228-33.5118011
ZK3 + 553ZK3 + 8703.448-33.5118011
ZK3 + 453ZK3 + 5533.448346.4133.5118011
ZK3 + 055ZK3 + 4533.448120033.5118011
ZK2 + 900ZK3 + 0550.302120043.5118031
ZK2 + 636ZK2 + 9000.302120033.5118011
ZK2 + 536ZK2 + 6360.302346.4333.5118011
ZK2 + 160ZK2 + 5360.302-33.5118011
ZK1 + 755ZK2 + 1602.151-33.5118011
ZK1 + 685ZK1 + 7552.151333.61933.5118011
ZK1 + 410ZK1 + 6852.151159033.5118011
ZK1 + 134ZK1 + 4103.5159033.5118021
ZK1 + 096ZK1 + 1343.5333.61733.5118021
Table 9. Summary of the results of calculating weights by the entropy value method.
ItemInformation Entropy Value eInformation Utility Value dWeighting Factor w
Slope (%)0.8960.1040.3347
Curve radius (m)0.81650.18350.5906
Number of lanes0.99930.00070.0024
Lane width100.00
Traffic composition100.00
Lane distribution100.00
Speed limit (km/h)100.00
Traffic markings0.97750.02250.0723
Lane control100.00
Table 10. Statistical table of marking forms after the second marking of the left line of Jiaozhou Bay Crossing.
Starting Stake NumberEnd Stake NumberSlope (%)Curve Radius (m)Marking FormNumber of Lanes
ZK9 + 174ZK9 + 191−0.7030Solid Line3
ZK8 + 953ZK9 + 174−0.7032000Solid Line
ZK8 + 786ZK8 + 953−42000Solid Line
ZK8 + 509ZK8 + 786−410,000Solid Line
ZK8 + 156ZK8 + 509−46500Solid Line
ZK7 + 770ZK8 + 156−2.476500Solid Line
ZK7 + 020ZK7 + 770−3.96500Solid Line
ZK6 + 917ZK7 + 020−2.886500Solid Line
ZK6 + 255ZK6 + 917−2.8810,000Solid Line
ZK6 + 115ZK6 + 255−0.3-Solid line
ZK5 + 480ZK6 + 115−0.3-Dashed line
ZK5 + 380ZK5 + 480−0.3-Solid Line
ZK4 + 849ZK5 + 3802.228-Solid Line
ZK4 + 779ZK4 + 8492.228372.525Solid Line
ZK4 + 355ZK4 + 7792.2281982.5Solid line
ZK4 + 330ZK4 + 3552.2281982.5Dashed line
ZK4 + 260ZK4 + 3302.228372.525Dashed line
ZK3 + 870ZK4 + 2602.228-dashed line
ZK3 + 705ZK3 + 8703.448-Dashed line
ZK3 + 553ZK3 + 7053.448-solid line
ZK3 + 453ZK3 + 5533.448346.41left dashed and right solid
ZK3 + 055ZK3 + 4533.4481200left dashed right solid
ZK2 + 900ZK3 + 0550.3021200Vehicle convergence out4
ZK2 + 636ZK2 + 9000.3021200Solid line3
ZK2 + 536ZK2 + 6360.302346.43Solid line
ZK2 + 160ZK2 + 5360.302-solid line
ZK1 + 755ZK2 + 1602.151-Solid line
ZK1 + 685ZK1 + 7552.151333.619Solid line
ZK1 + 410ZK1 + 6852.1511590Dashed line
ZK1 + 134ZK1 + 4103.51590Dashed line
ZK1 + 096ZK1 + 1343.5333.617Dashed line
Table 11. Statistical table of the form of the right line marking after the second delineation of the Jiaozhou Bay Crossing.
Starting Stake NumberEnd Stake NumberSlope (%)Curve Radius (m)Marking FormNumber of Lanes
YK1 + 200YK1 + 462−3.510,000Solid Line3
YK1 + 462YK1 + 562−0.80110,000Solid Line
YK1 + 562YK1 + 632−0.801-Solid Line
YK1 + 632YK1 + 835−0.8011000Solid Line
YK1 + 835YK1 + 905−0.801-Solid Line
YK1 + 905YK2 + 100−0.80110,000Solid Line
YK2 + 100YK2 + 214−0.410,000Solid Line
YK2 + 214YK2 + 284−0.4-Solid Line
YK2 + 284YK2 + 553−0.41000Solid Line
YK2 + 553YK2 + 623−0.4-Solid Line
YK2 + 623YK2 + 783−0.410,000Solid Line
YK2 + 783YK2 + 853−0.4-Solid Line
YK2 + 853YK3 + 045−0.41000Solid Line
YK3 + 045YK3 + 162−3.51000Vehicle convergence4
YK3 + 162YK3 + 232−3.5-Solid line3
YK3 + 232YK3 + 541−3.51500Solid line
YK3 + 541YK3 + 611−3.5-Dashed line
YK3 + 611YK3 + 800−3.510,000Dashed line
YK3 + 800YK3 + 980−2.210,000Dashed line
YK3 + 980YK4 + 263−2.210,000solid line
YK4 + 263YK4 + 333−2.2-Solid Line
YK4 + 333YK4 + 796−2.22038Solid Line
YK4 + 796YK4 + 866−2.2-Solid Line
YK4 + 866YK5 + 400−2.210,000Solid Line
YK5 + 400YK5 + 7850.3-Solid line
YK5 + 785YK6 + 2000.3-Dashed line
YK6 + 200YK6 + 9002.5--Dashed line
YK6 + 900YK73.9-Dashed line
YK7YK7 + 7453.94945solid line
YK7 + 745YK7 + 8752.6054945dashed line
YK7 + 875YK8 + 1302.605-dashed line
YK8 + 130YK8 + 6003.9-Dashed line
YK8 + 600YK8 + 7703.9-Solid Line
YK8 + 770YK8 + 9603.92500Solid Line
YK8 + 960YK9 + 085−0.72500Solid Line
YK9 + 085YK9 + 200−0.7-Solid line
Table 12. Simulation model lane change behavior-flow error (left line).
LanesNot SetPath Decision SettingActual
Left lineLeft lane117412621282
Middle Lane115212911342
Right lane1108882928
ErrorLeft lane8.4%1.6%3.3%
Middle lane14.2%3.8%
Right lane19.4%5.0%
Table 13. Simulation model channel change behavior-flow error (right line).
LanesNot SetPath Decision SettingActual
Right lineLeft lane87010051036
Middle Lane115312701230
Right lane129810471080
ErrorLeft lane16.0%3.0%0.7%
Middle lane6.3%3.3%
Right lane20.2%3.1%
Table 14. Parameter sensitivity analysis scheme.
ParametersParameter MeaningDefault ValueRange of ValuesTest Program
Desired speed distribution-20–120Step length 10
CC0Parking Distance1.50.5–2.5Step length 0.5
CC1Headway time distance0.90.7–1.7-
CC2Following variable42–8Step length 2
CC3Threshold for entering the following state−8−10–5-
CC4Negative following threshold−0.350.05–1.05Step length 0.2
CC5Threshold for active following state0.350.7–1.11Step length 0.2
CC6Vehicle speed vibration11.440–20Step length 4
CC7Acceleration vibration amplitude0.250.1–2.1Step length 0.2
CC8Acceleration at stopping3.52–3.5-
CC9Acceleration at vehicle speed of 80 Km/h1.50.5–2Step length 0.5
Safety distance discount factor0.60.1–0.6Step length 0.1
Minimum headroom0.50.3–2.1Step length 0.2
Table 15. Jiaozhou Bay Crossing input data sheet.
CategoryLanesUpstream Flow (Vehicles/h)Downstream Flow (Vehicles/h)Bus Ratio
Huangdao–QingdaoLeft lane12511282-
Middle Lane13871342-
Right lane9299289.29%
Qingdao–HuangdaoLeft lane11291036-
Middle lane11661230-
Right lane106010808.65%
Table 16. Comparison of sensitivity test results for the left lane of the Jiaozhou Bay Crossing.
ParametersMaximum Flow Rate (Vehicles/h)Minimum Flow Rate (Vehicles/h)Flow Differential RatioMaximum Travel Time (s)Minimum Travel Time (s)Trip Time Difference Ratio
Expected speed326332380.77%66.2113.5379.57%
CC0Parking Distance465345901.35%38.4127.1929.21%
CC1Headway time distance3242106467.18%17.8216.258.81%
CC2Following variable4601390215.19%49.4524.6350.19%
CC4&5Threshold value of following state324232420.00%16.3216.310.06%
CC6Vehicle speed vibration324232420.00%16.3216.310.06%
CC7Acceleration vibration amplitude324232420.00%16.3216.310.06%
Safety distance discount factor467145392.83%33.4932.144.03%
Table 17. Comparison of sensitivity test results for the right lane of the Jiaozhou Bay Crossing.
ParametersMaximum Flow Rate (Vehicles/h)Minimum Flow Rate (Vehicles/h)Flow Differential RatioMaximum Travel Time (s)Minimum Travel Time (s)Trip Time Difference Ratio
Expected speed356635440.62%60.2412.9578.50%
CC0Parking Distance530148917.73%23.9422.296.89%
CC1Headway time distance356850285.93%355.5615.0395.77%
CC2Following variable5630374533.48%24.7122.718.09%
CC4&5Threshold value of following state356735660.03%15.1515.120.20%
CC6Vehicle speed vibration356835660.06%15.1415.130.07%
CC7Acceleration vibration amplitude356835660.06%15.1515.120.20%
Safety distance discount factor509350540.77%23.2022.951.08%
Table 18. Tunnel headway values.
Camera NumberHeadway (s)Camera NumberHeadway (s)
v851.56v51.74
v891.60v91.74
v931.70v141.47
v1021.81v271.38
v1111.56v321.41
v1141.44v451.38
v1251.52v541.43
v1341.42v621.54
v1401.61v721.60
v1501.64v761.62
v1581.56--
Table 19. Comparison of simulation data and actual measurement data.
Flow SolutionsActual Flow RateWiedemann 99
(after Optimization)
Wiedemann 99
(Default)
Wiedemann 99
(after Optimization)
Wiedemann 99
(Default)
Scenario 13420326830764.44%10.06%
Program 23265319829762.05%8.85%
Scenario 32914282228463.16%2.33%
Scenario 42871279426332.68%8.29%
Table 20. Traffic capacity under different longitudinal gradients.
Slope (%)0123456−1−2−3−4−5−6
Passage capacity4834477748004722465845674521479848064775479647914893
Table 21. Capacity under different curve radii.
Curve Radius (km)1/rPassing Capacity
04834
100.14795
6.50.1538464764
4.9450.2022244795
2.50.44786
2.0380.4906774763
20.54731
1.98250.5044144769
1.590.6289314806
1.50.6666674775
1.20.8333334741
114722
Table 22. Measured traffic capacity of the Qingdao Jiaozhou Bay Subsea Tunnel.
Left Line (Huangdao–Qingdao)Right Line (Qingdao–Huangdao)
Section Numberi (%)R−1Passage CapacitySection Numberi (%)R−1Passage Capacity
Z1−0.70304716Y1−3.50.14713
Z2−40.54608Y2−0.8010.14762
Z3−40.14668Y3−0.80104772
Z4−40.154653Y4−0.80114735
Z5−2.470.154688Y5−0.80104772
Z6−3.90.154672Y6−0.8010.14785
Z7−2.880.1534704Y7−0.40.14702
Z8−2.880.14712Y8−0.404726
Z9−0.304704Y9−0.414693
Z102.22804622Y10−0.404768
Z112.2280.54704Y11−0.40.14788
Z122.22804584Y12−0.414804
Z132.22804560Y13−3.514609
Z143.44804573Y14−3.504623
Z153.44804572Y15−3.50.674715
Z163.4480.834553Y16−3.504808
Z170.3020.834641Y17−3.50.14791
Z180.30204684Y18−2.20.14777
Z192.1504608Y19−2.204804
Z202.1510.634596Y20−2.20.494804
Z213.50.634620Y21−2.20.14740
Y220.304840
Y232.504772
Y243.904732
Y253.90.24656
Y262.6050.24620
Y272.60504704
Y283.904705
Y293.90.44608
Table 23. Calculation table of nonlinear regression parameters of the Qingdao Jiaozhou Bay Subsea Tunnel.
CategoryEstimated VariablesβEstimated Value95% Confidence Interval
Tunnel left lane (Huangdao–Qingdao)Constants β 0 0.7406(0.733, 0.7481)
Longitudinal slope gradient β 1 −2.4254(−7.124, 2.2728)
Curve radius β 2 −30.8482(−119.426, 57.7291)
Tunnel right lane (Qingdao–Huangdao)Constants β 0 0.7591(0.754, 0.7645)
Longitudinal slope gradient β 1 −5.7040(−9.349, −2.0589)
Curve radius β 2 −50.6497(−111.698, 10.3982)
Table 24. Checklist for mismatch of calculation model of actual traffic capacity of the Qingdao Jiaozhou Bay Subsea Tunnel.
CategorySourceDegree of FreedomSSMSFp
Tunnel Left Line (Huangdao–Qingdao)Error1854,602.83033.495.390.096
Misfit1552,647.73509.85
Pure error31955.2651.72
Tunnel right line (Qingdao–Huangdao)Error2678,428.43016.480.760.701
Misfit1746,219.92718.82
Pure Error932,208.53578.72
Table 25. Data table of traffic capacity corresponding to marking form.
Solid LineDotted LineDifferenceDifference Ratio
Passage capacity46204644240.52%
46084644360.78%
46084620120.26%
45844608240.52%
45604584240.53%
4548454800.00%
45364548120.26%
45364548120.26%
45844596120.26%
46804692120.26%
46564716601.29%
46204656360.78%
45724668962.10%
46444692481.03%
46444740962.07%
Average value46004633.633.60.73%
Table 26. Selection table of instance verification section.
NumberStarting Stake NumberEnd Stake NumberSlope i (%)Curve Radius R (km)R−1Traffic Markings
1ZK8 + 953ZK9 + 174−0.70320000.5000Solid line
2ZK4 + 260ZK4 + 3302.228-0Dashed line
3ZK3 + 705ZK3 + 8703.448-0Dashed line
4ZK1 + 410ZK1 + 6852.15115900.6289dashed line
5YK5 + 785YK6 + 2000.3-0dashed line
6YK6 + 900YK73.9-0.0000dashed line
7YK7 + 745YK7 + 8752.60549450.2022Dashed Line
8YK8 + 770YK8 + 9603.925000.4000solid line
Table 27. Comparison table of traffic capacity of cross-sections verified by example in Jiaozhou Bay.
NumberSlope (%)R−1Traffic MarkingsCalculation of CapacityActual CapacityErrorError Ratio
1−0.7030.50solid line 46494716671.41%
22.2280dashed line46874638−49−1.05%
33.4480dashed line46704529−141−3.10%
42.1510.63dashed line46684596−72−1.56%
50.30dashed line48154840250.51%
63.90dashed line47284798701.45%
72.6050.20dashed Line47664620−146−3.17%
83.90.40solid line47084537−171−3.77%
Disclaimer/Publisher’s Note: The statements, opinions and data contained in all publications are solely those of the individual author(s) and contributor(s) and not of MDPI and/or the editor(s). MDPI and/or the editor(s) disclaim responsibility for any injury to people or property resulting from any ideas, methods, instructions or products referred to in the content.

