
Perceptions and Patterns of Use of Blue Spaces in Selected European Cities: Tartu, Tallinn, Barcelona, Warsaw and Plymouth


Abstract
1. Introduction
2. Urban Green and Blue Infrastructure
2.1. Human Benefits from Interaction with Blue Spaces
2.2. Proximity and Accessibility of Blue Spaces
2.3. Preferences, Perceptions, Use and Place-Based Values in Blue and Green Spaces
- What are the most popular blue spaces among residents of the different case study cities, and what typifies the range of favourite blue spaces in each of the cases according to blue space and water element type?
- Does the distance from home affect the choice of blue spaces to visit?
- What is the role of water, number of facilities, and blue space character in determining the choice of blue spaces?
- Are there differences in visiting distance and preference among gender and age groups?
3. Materials and Methods
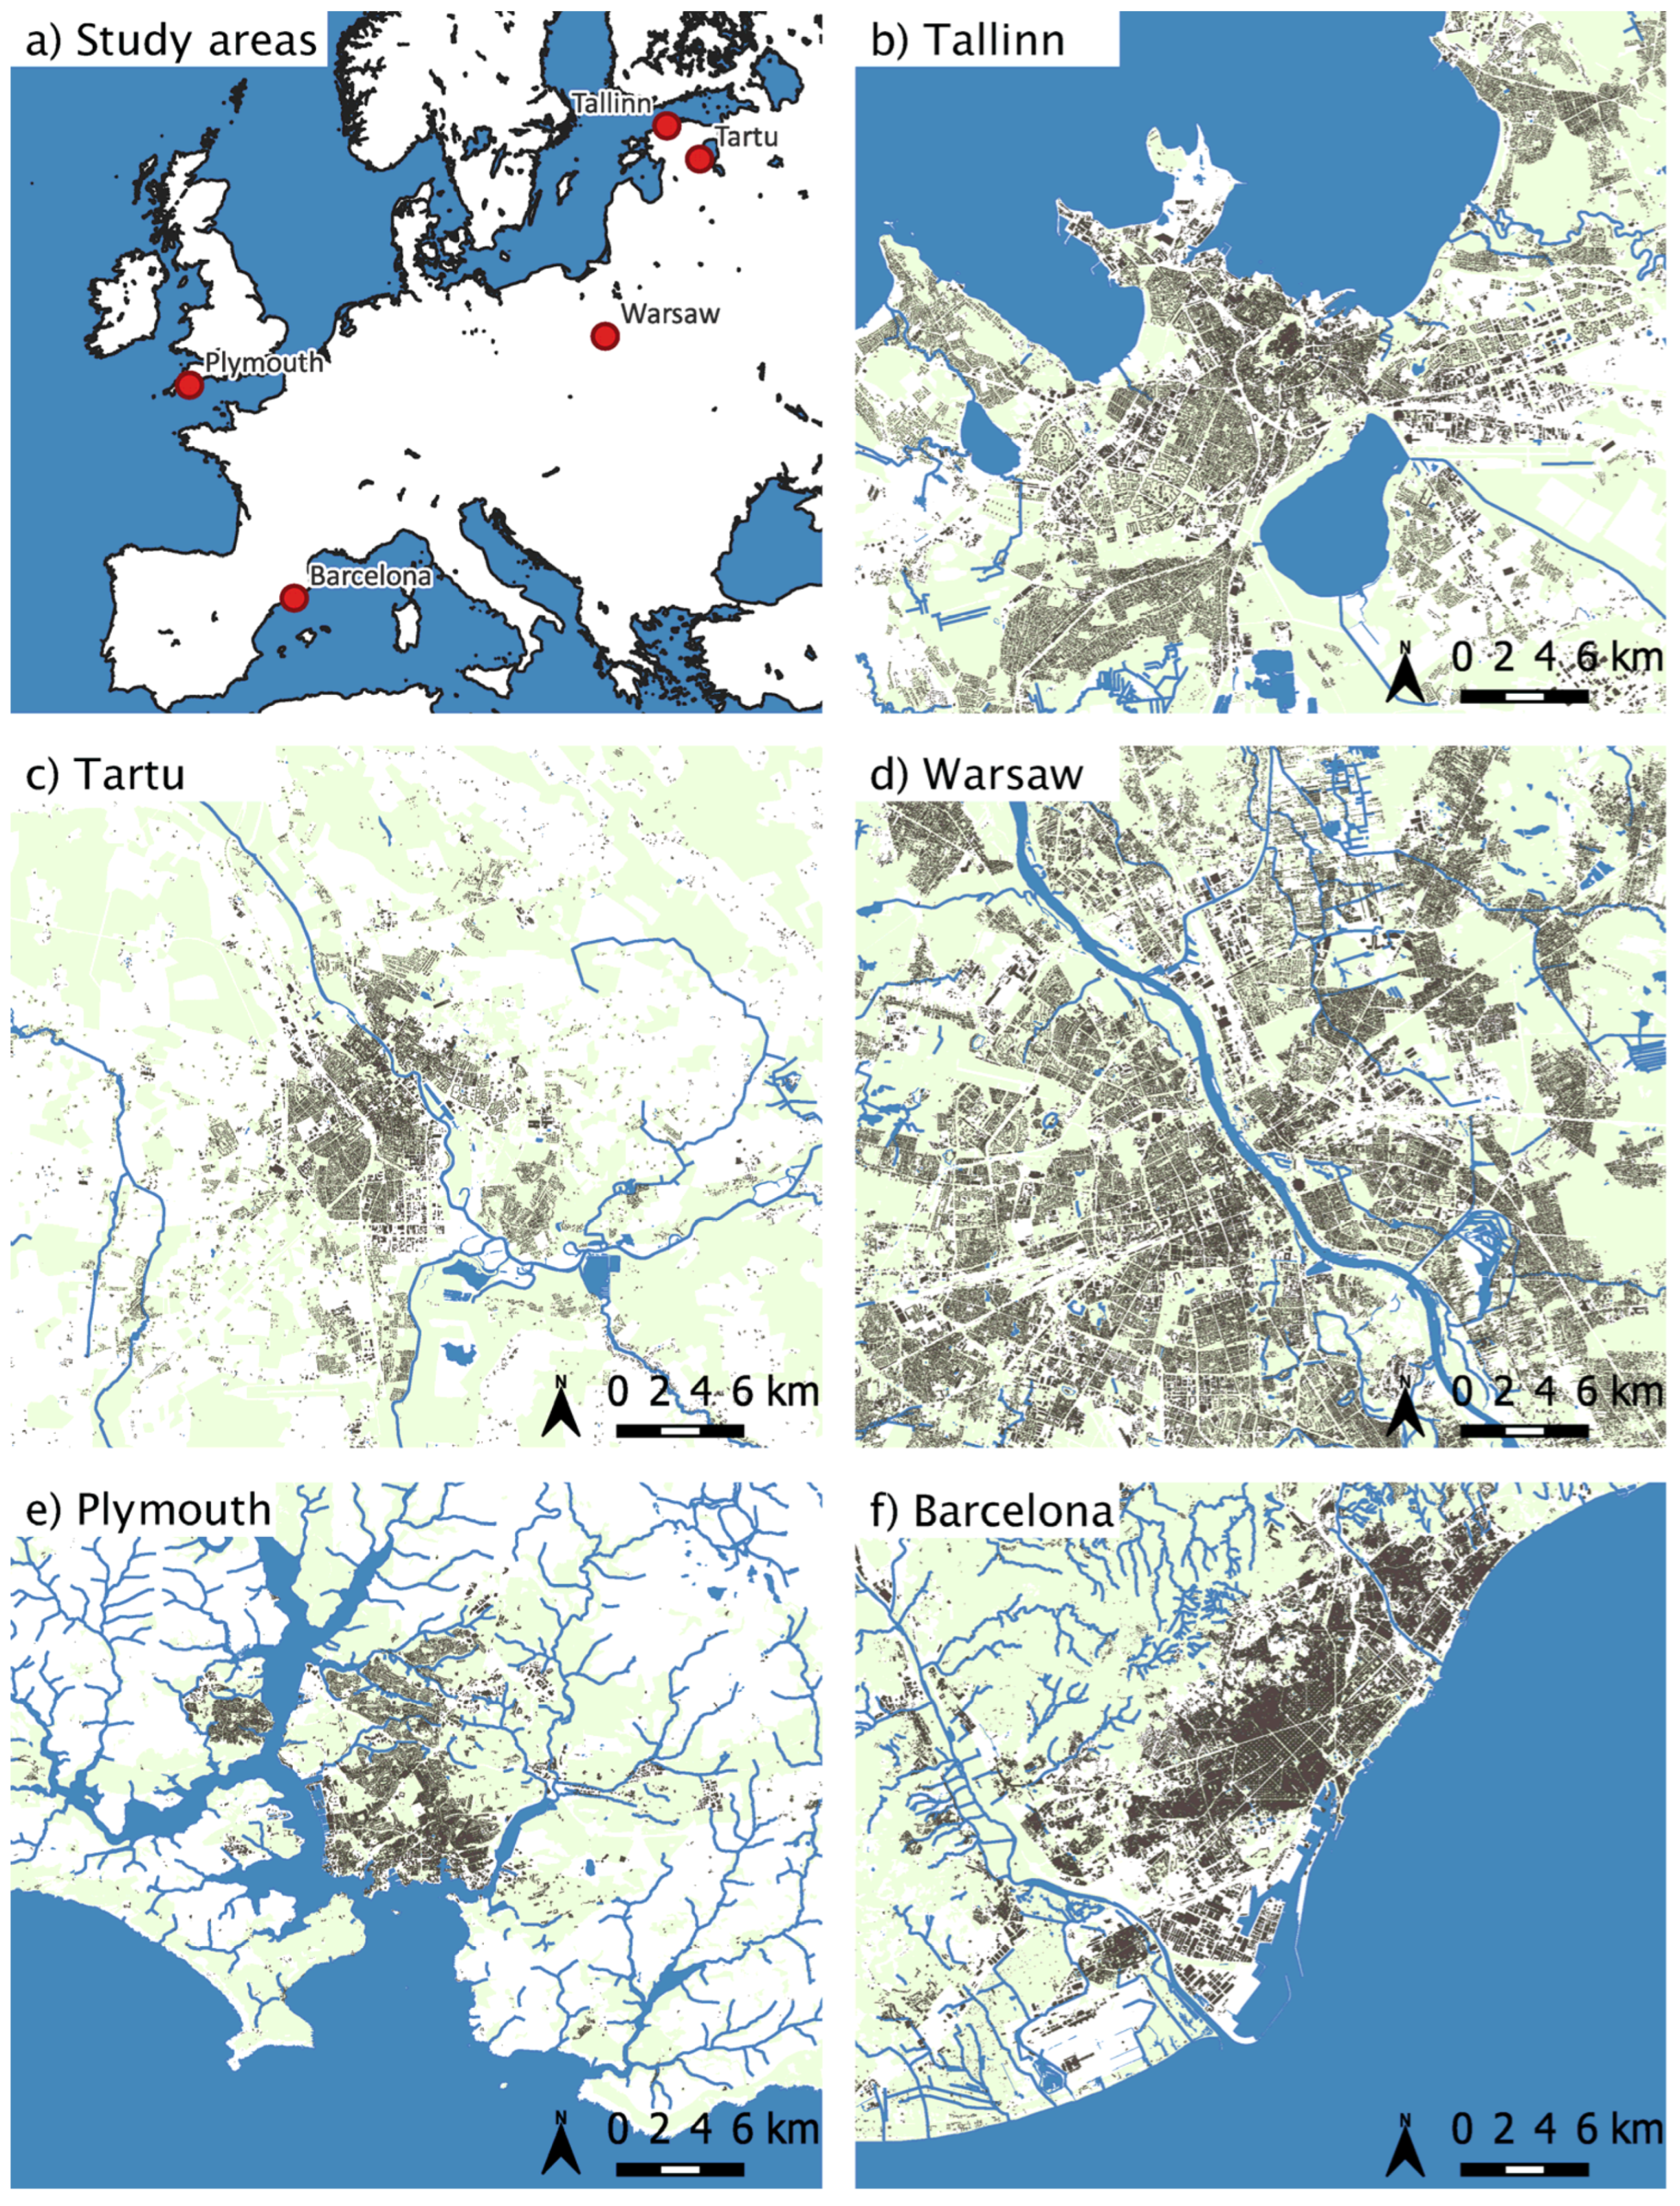
3.1. Research Context—Case Study Areas
3.2. Data Collection and Categorization
3.2.1. Geo-Questionnaire and PPGIS Data Collection
- Mark up to five favorite blue spaces on the map, located in or close to the city;
- Answer an open-ended question: “Why is this place important to you?”
- Rate the importance of water in the overall experience on a scale of 1–5.
- Mark a location close to, but not directly at, the respondents’ home (the closest crossroads or a point within 300 m, so as to avoid the possibility of identifying an individual);
- State their age group (16 years and over) and gender.
3.2.2. Cleaning and Validating the Data
3.2.3. Identification and Description of the Blue Spaces Marked on the Map
- Water body type: ornamental pond or fountain; large natural or manmade lake; wetland; canal or moat; stream or river; sea or ocean
- Blue space type by land cover or land use: harbour, marina, dock, jetty, pier; urban street or square; promenade; meadow and farmland; scrub or reeds; park or garden; woodland; beach; cliffs, rocks, shingle
- Facilities level: 0—not equipped—no equipment apart from the access path; 1—moderately equipped—some equipment, e.g., benches or bins, but insufficient to maximize the potential of the space; 2—well equipped—a full range of facilities to maximize the potential of the space and possibilities for recreation
- Water access: 0—no obvious access to the water; 1—good access due to the natural conditions of the site; 2—excellent access improved by purpose-built structures
- Land access: 0—no paths or narrow dirt paths; 1—gravel or macadam-surfaced paths; 2—paved
3.3. Data Analysis
4. Results
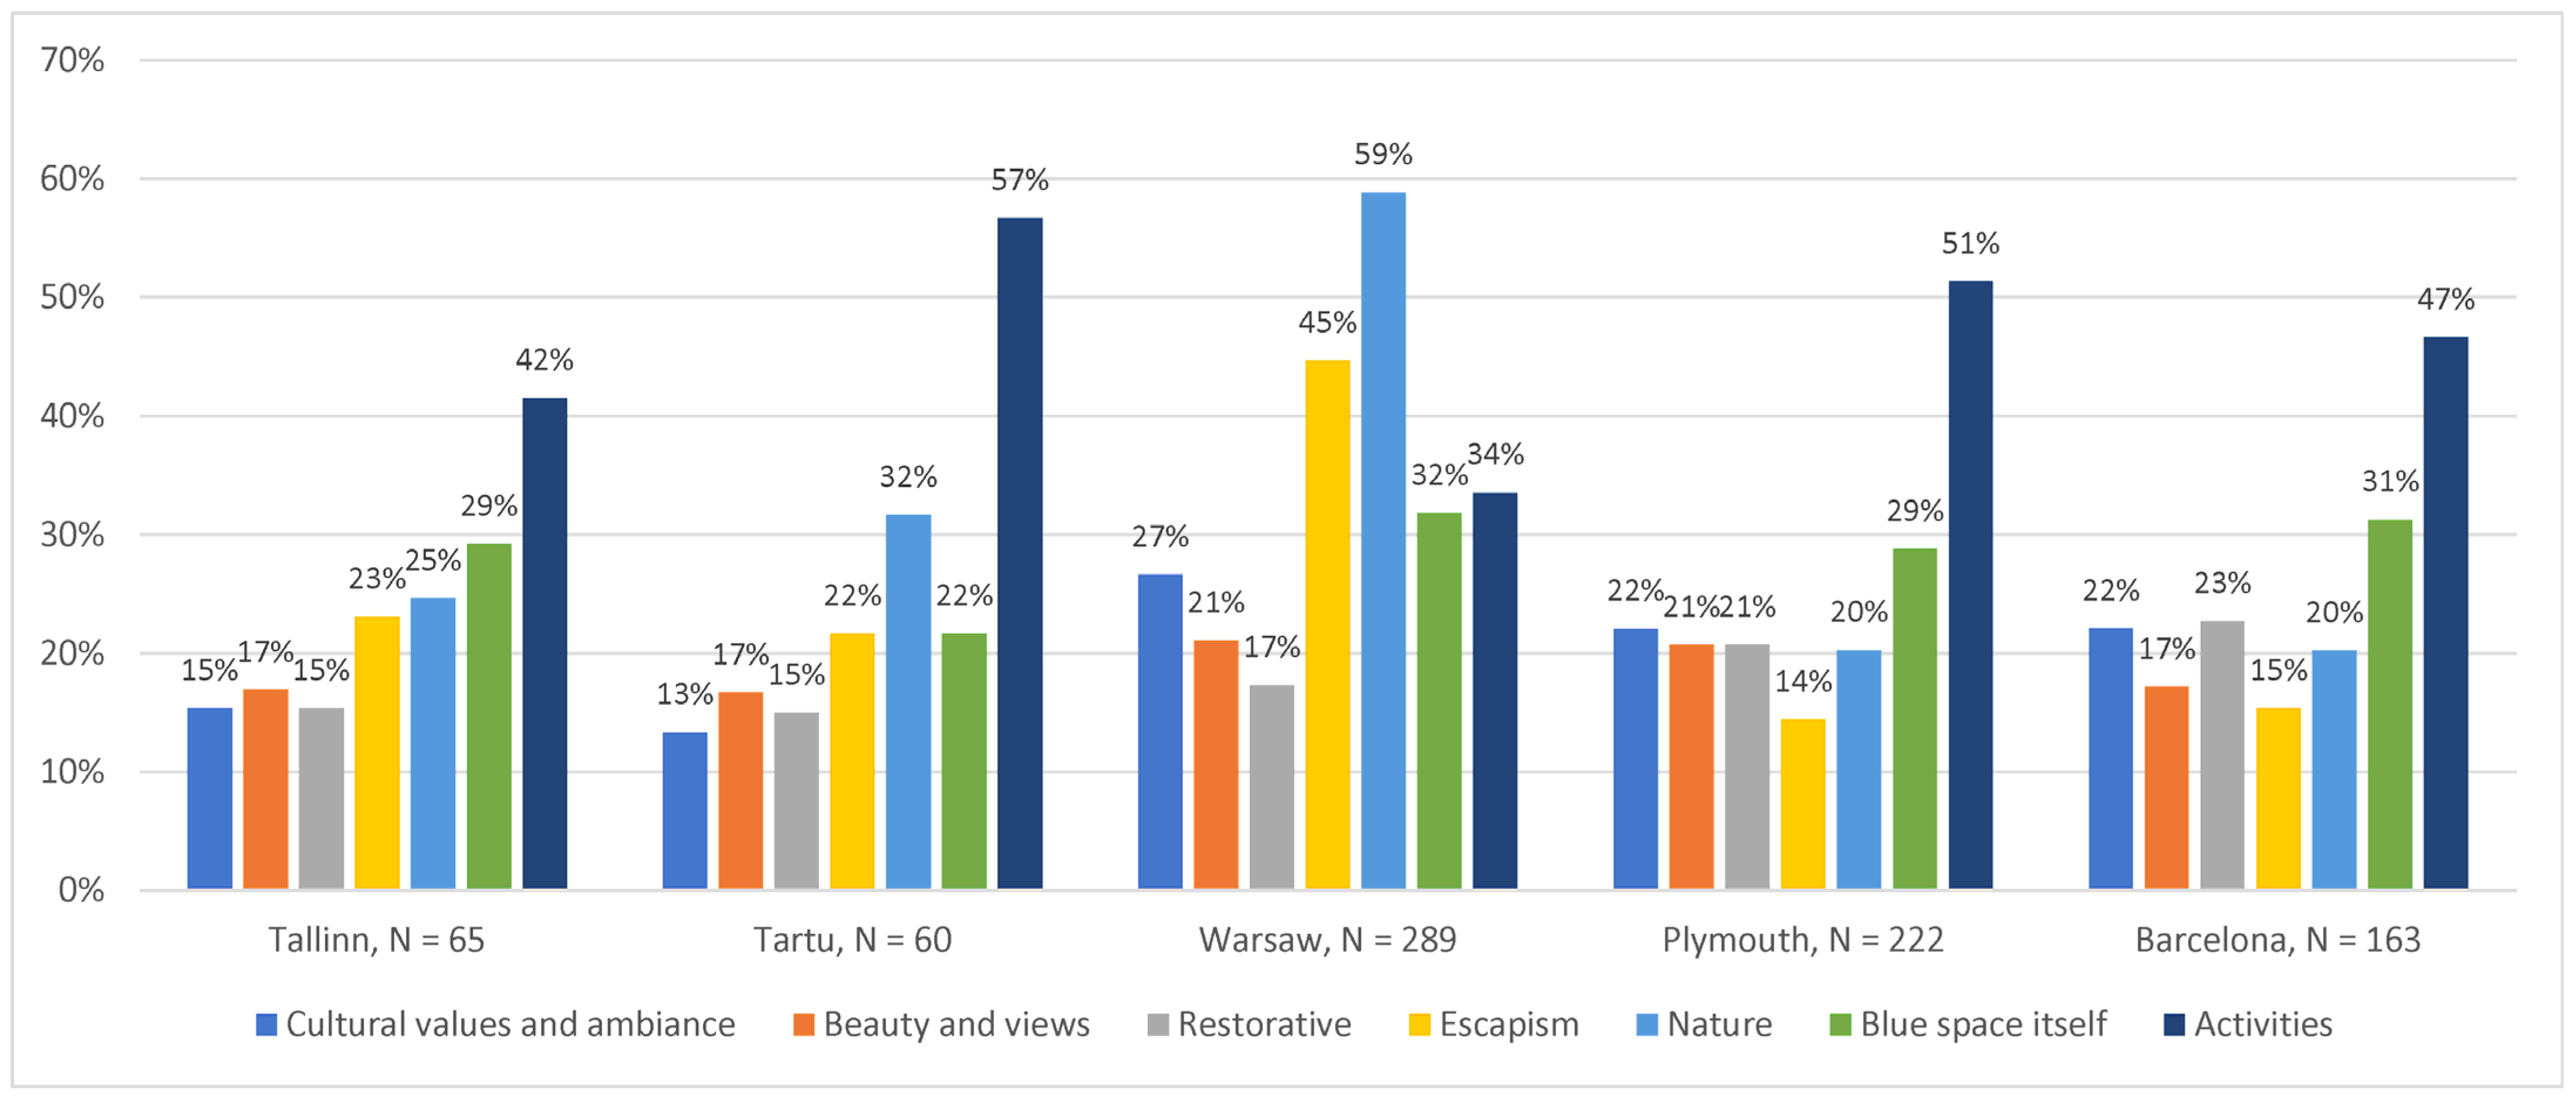
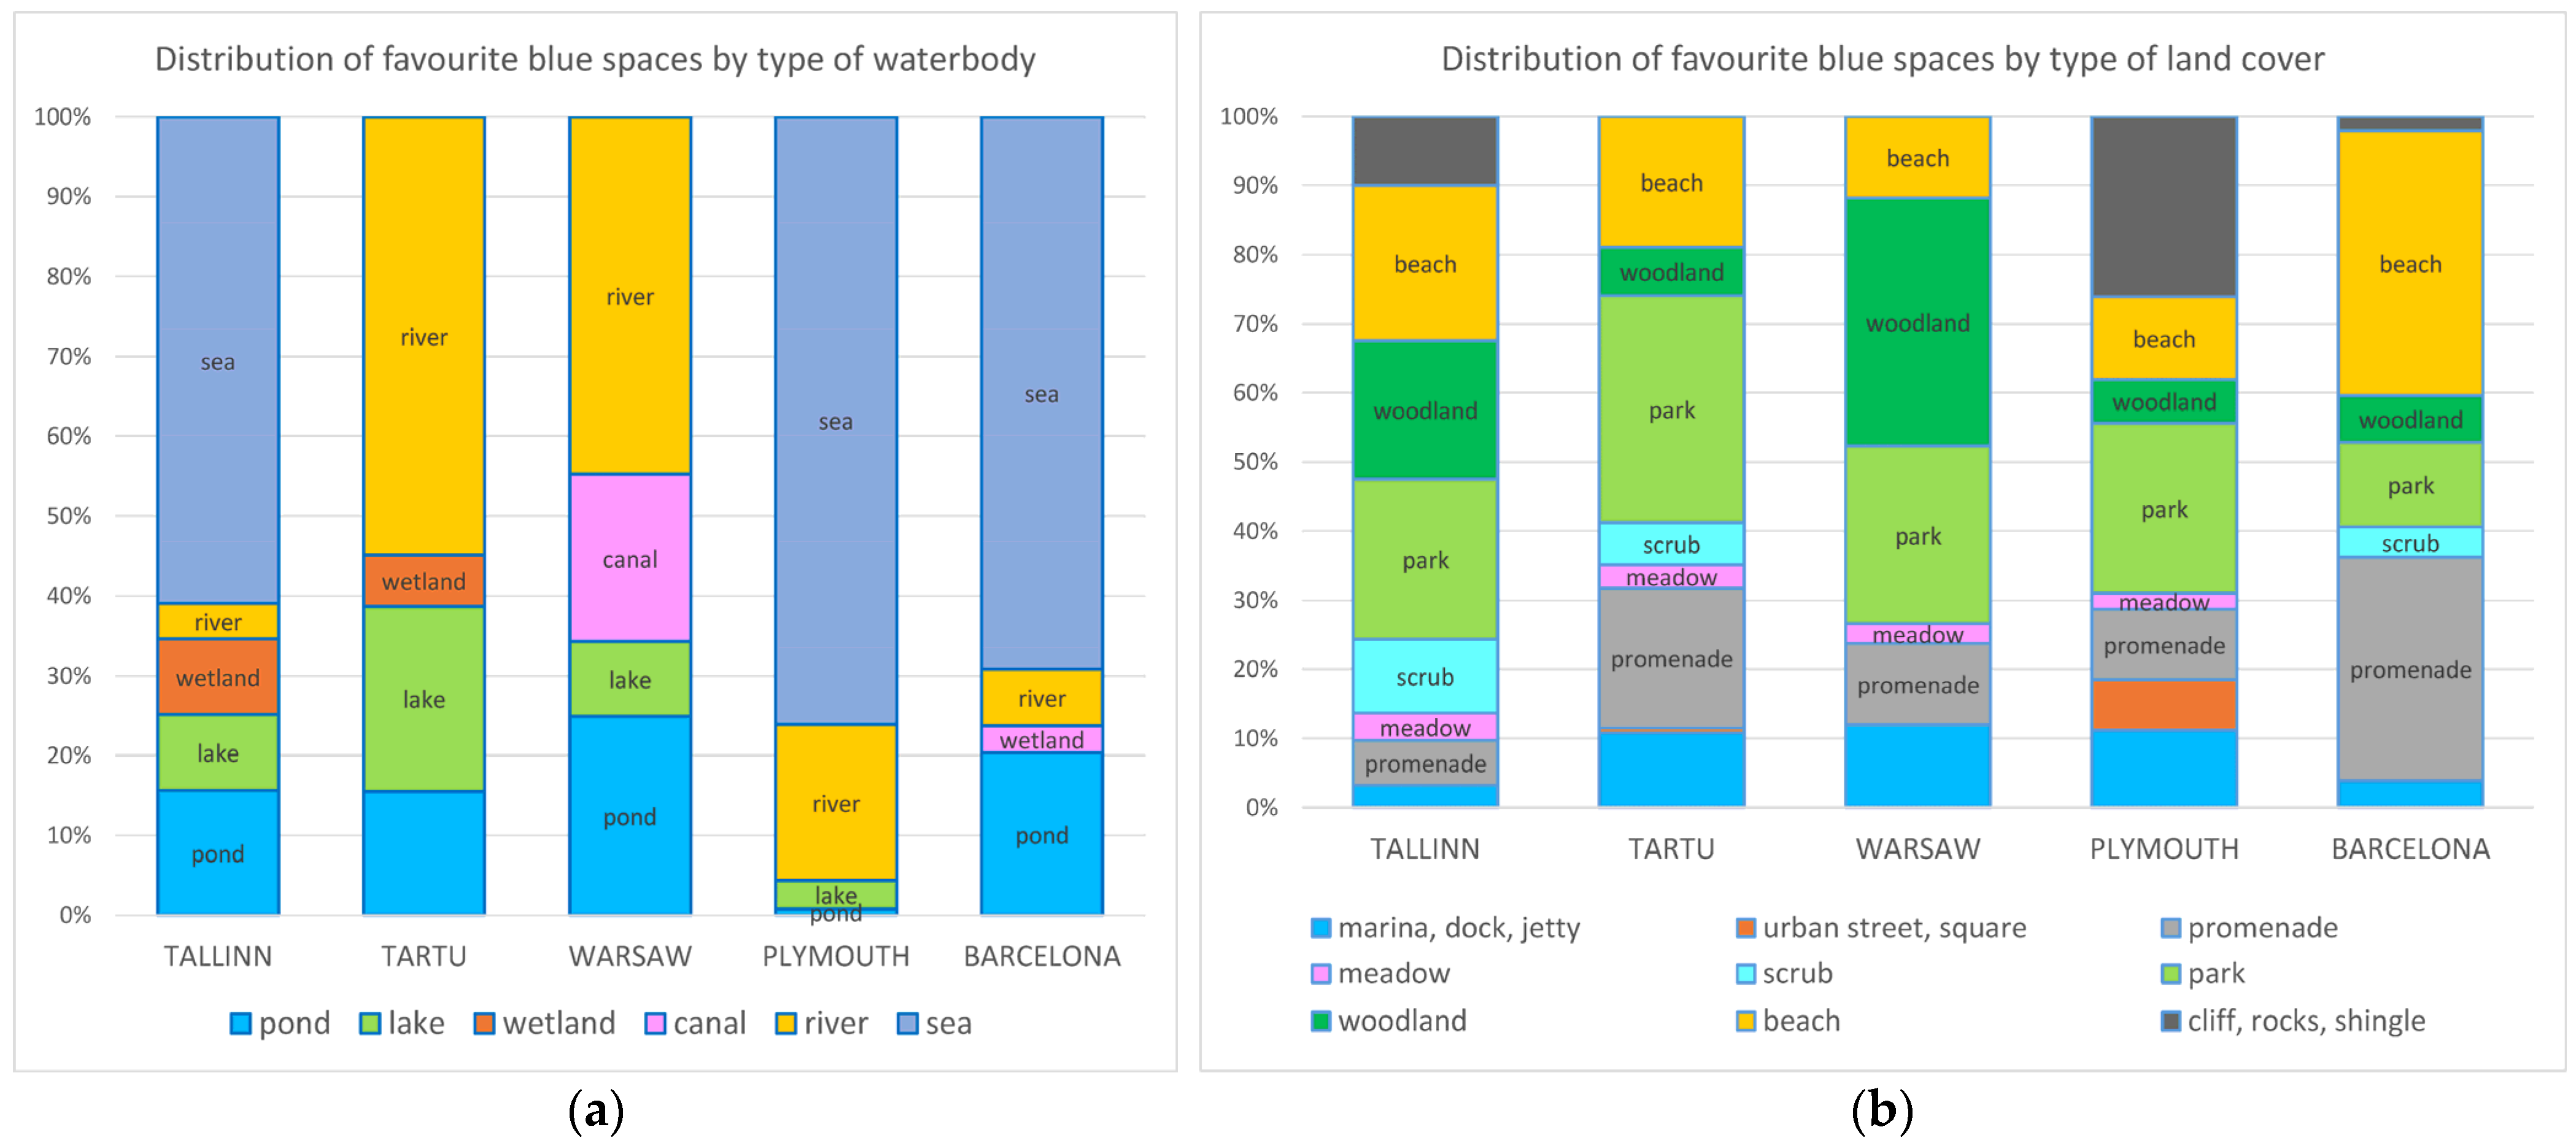
4.1. Exploring Place-Based Values, Blue Spaces and Blue Element Distribution
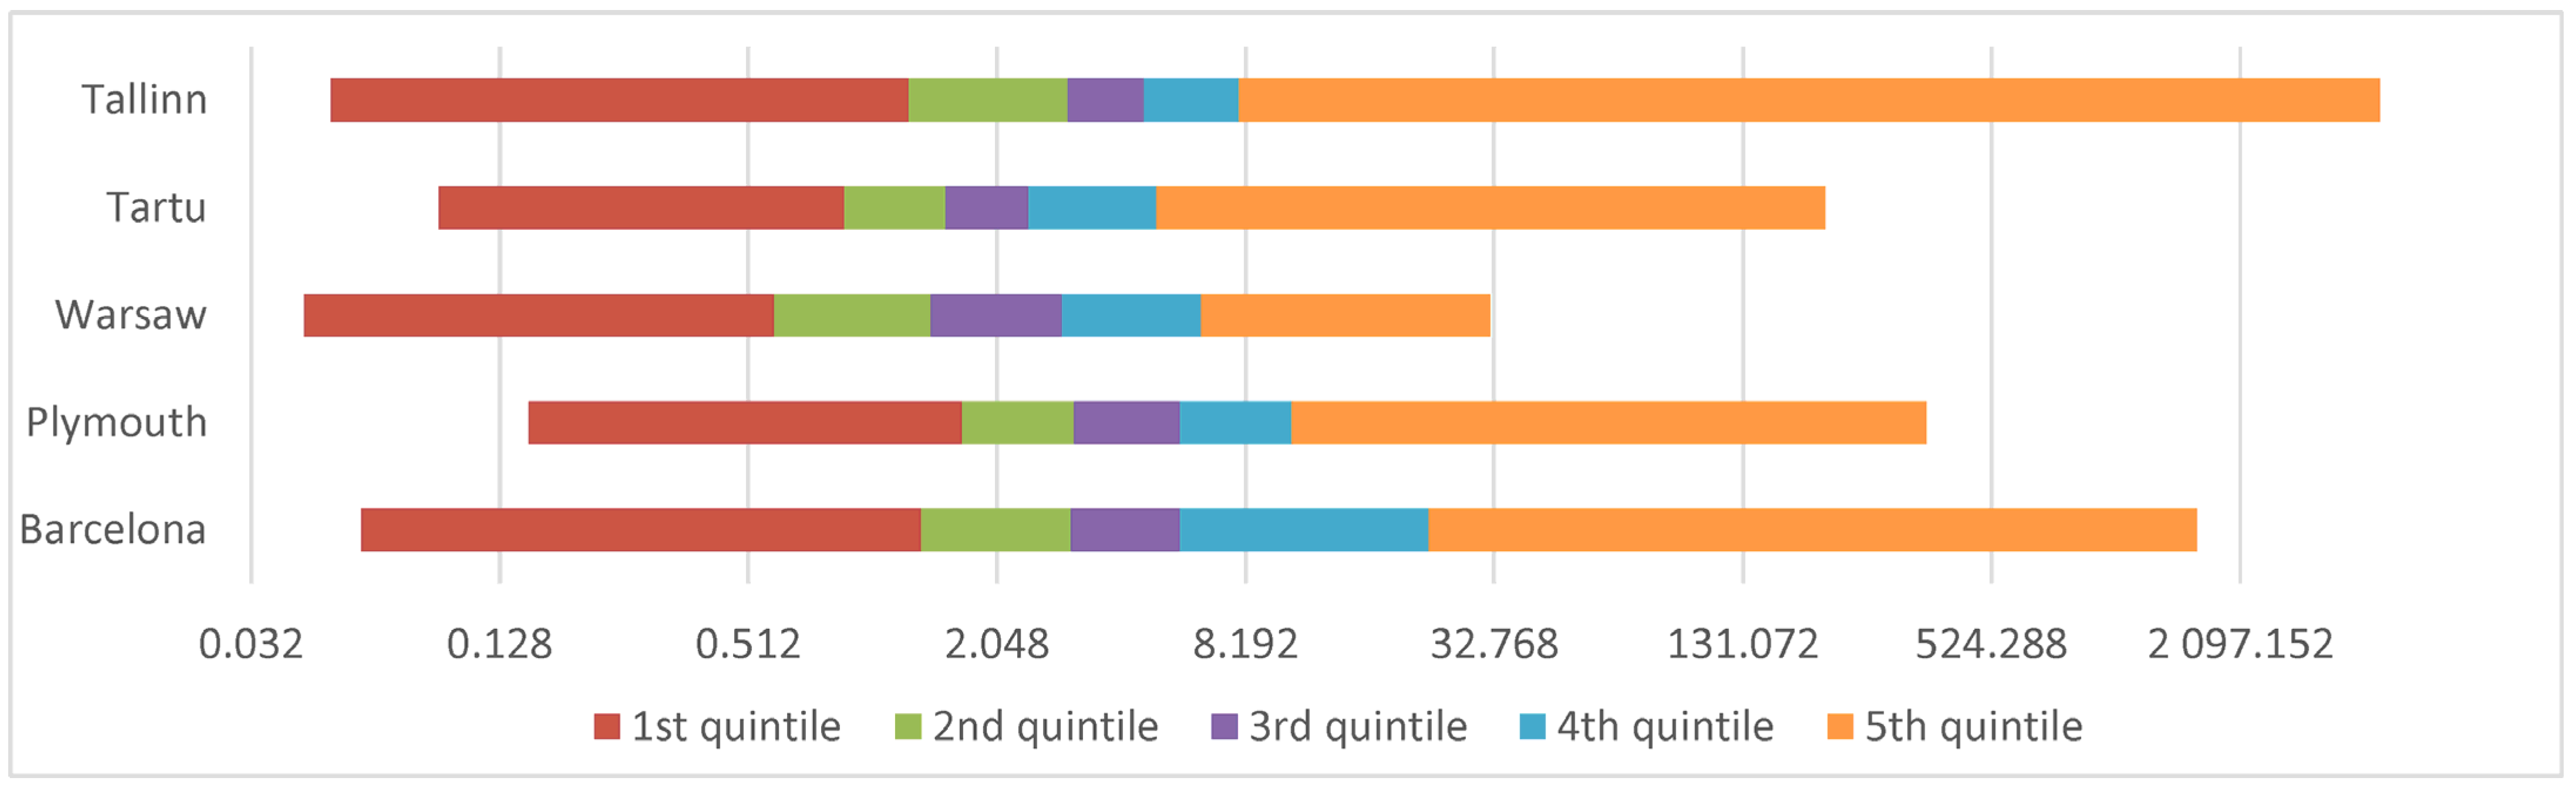
4.2. Pattern of Distances from Home
4.2.1. General Relationships with Distances from Home
4.2.2. General Relationships with Closeness to Home and Other Everyday Places
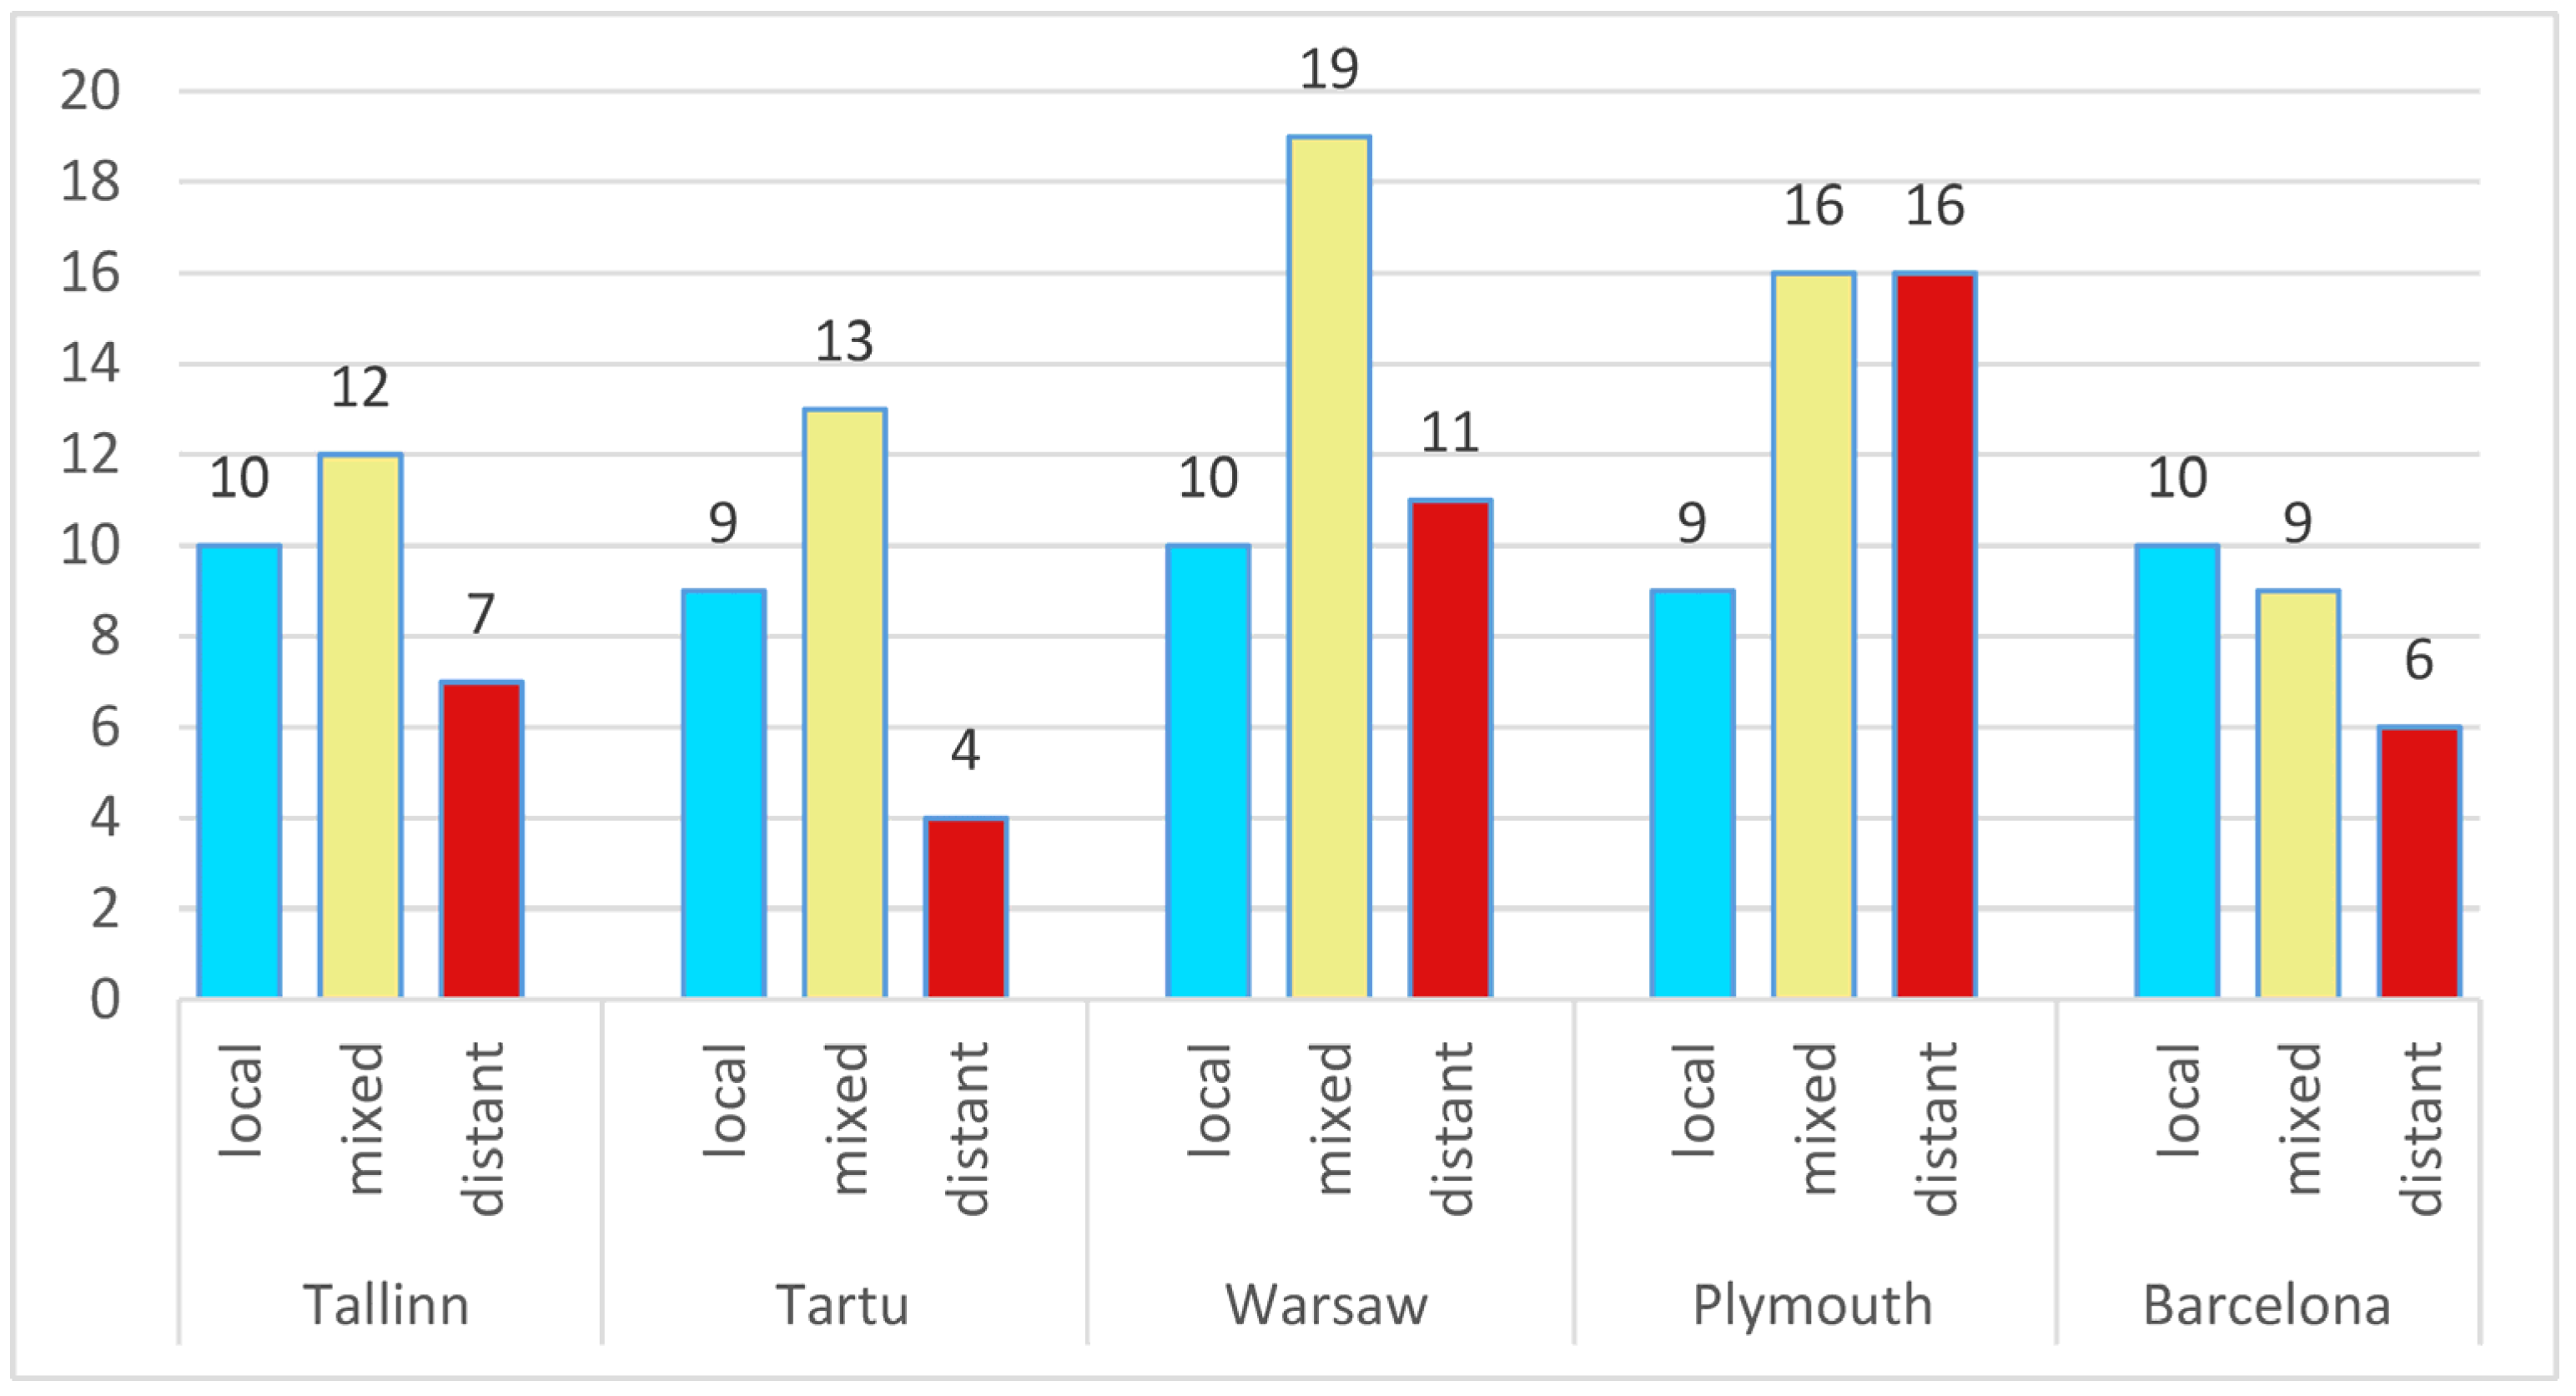
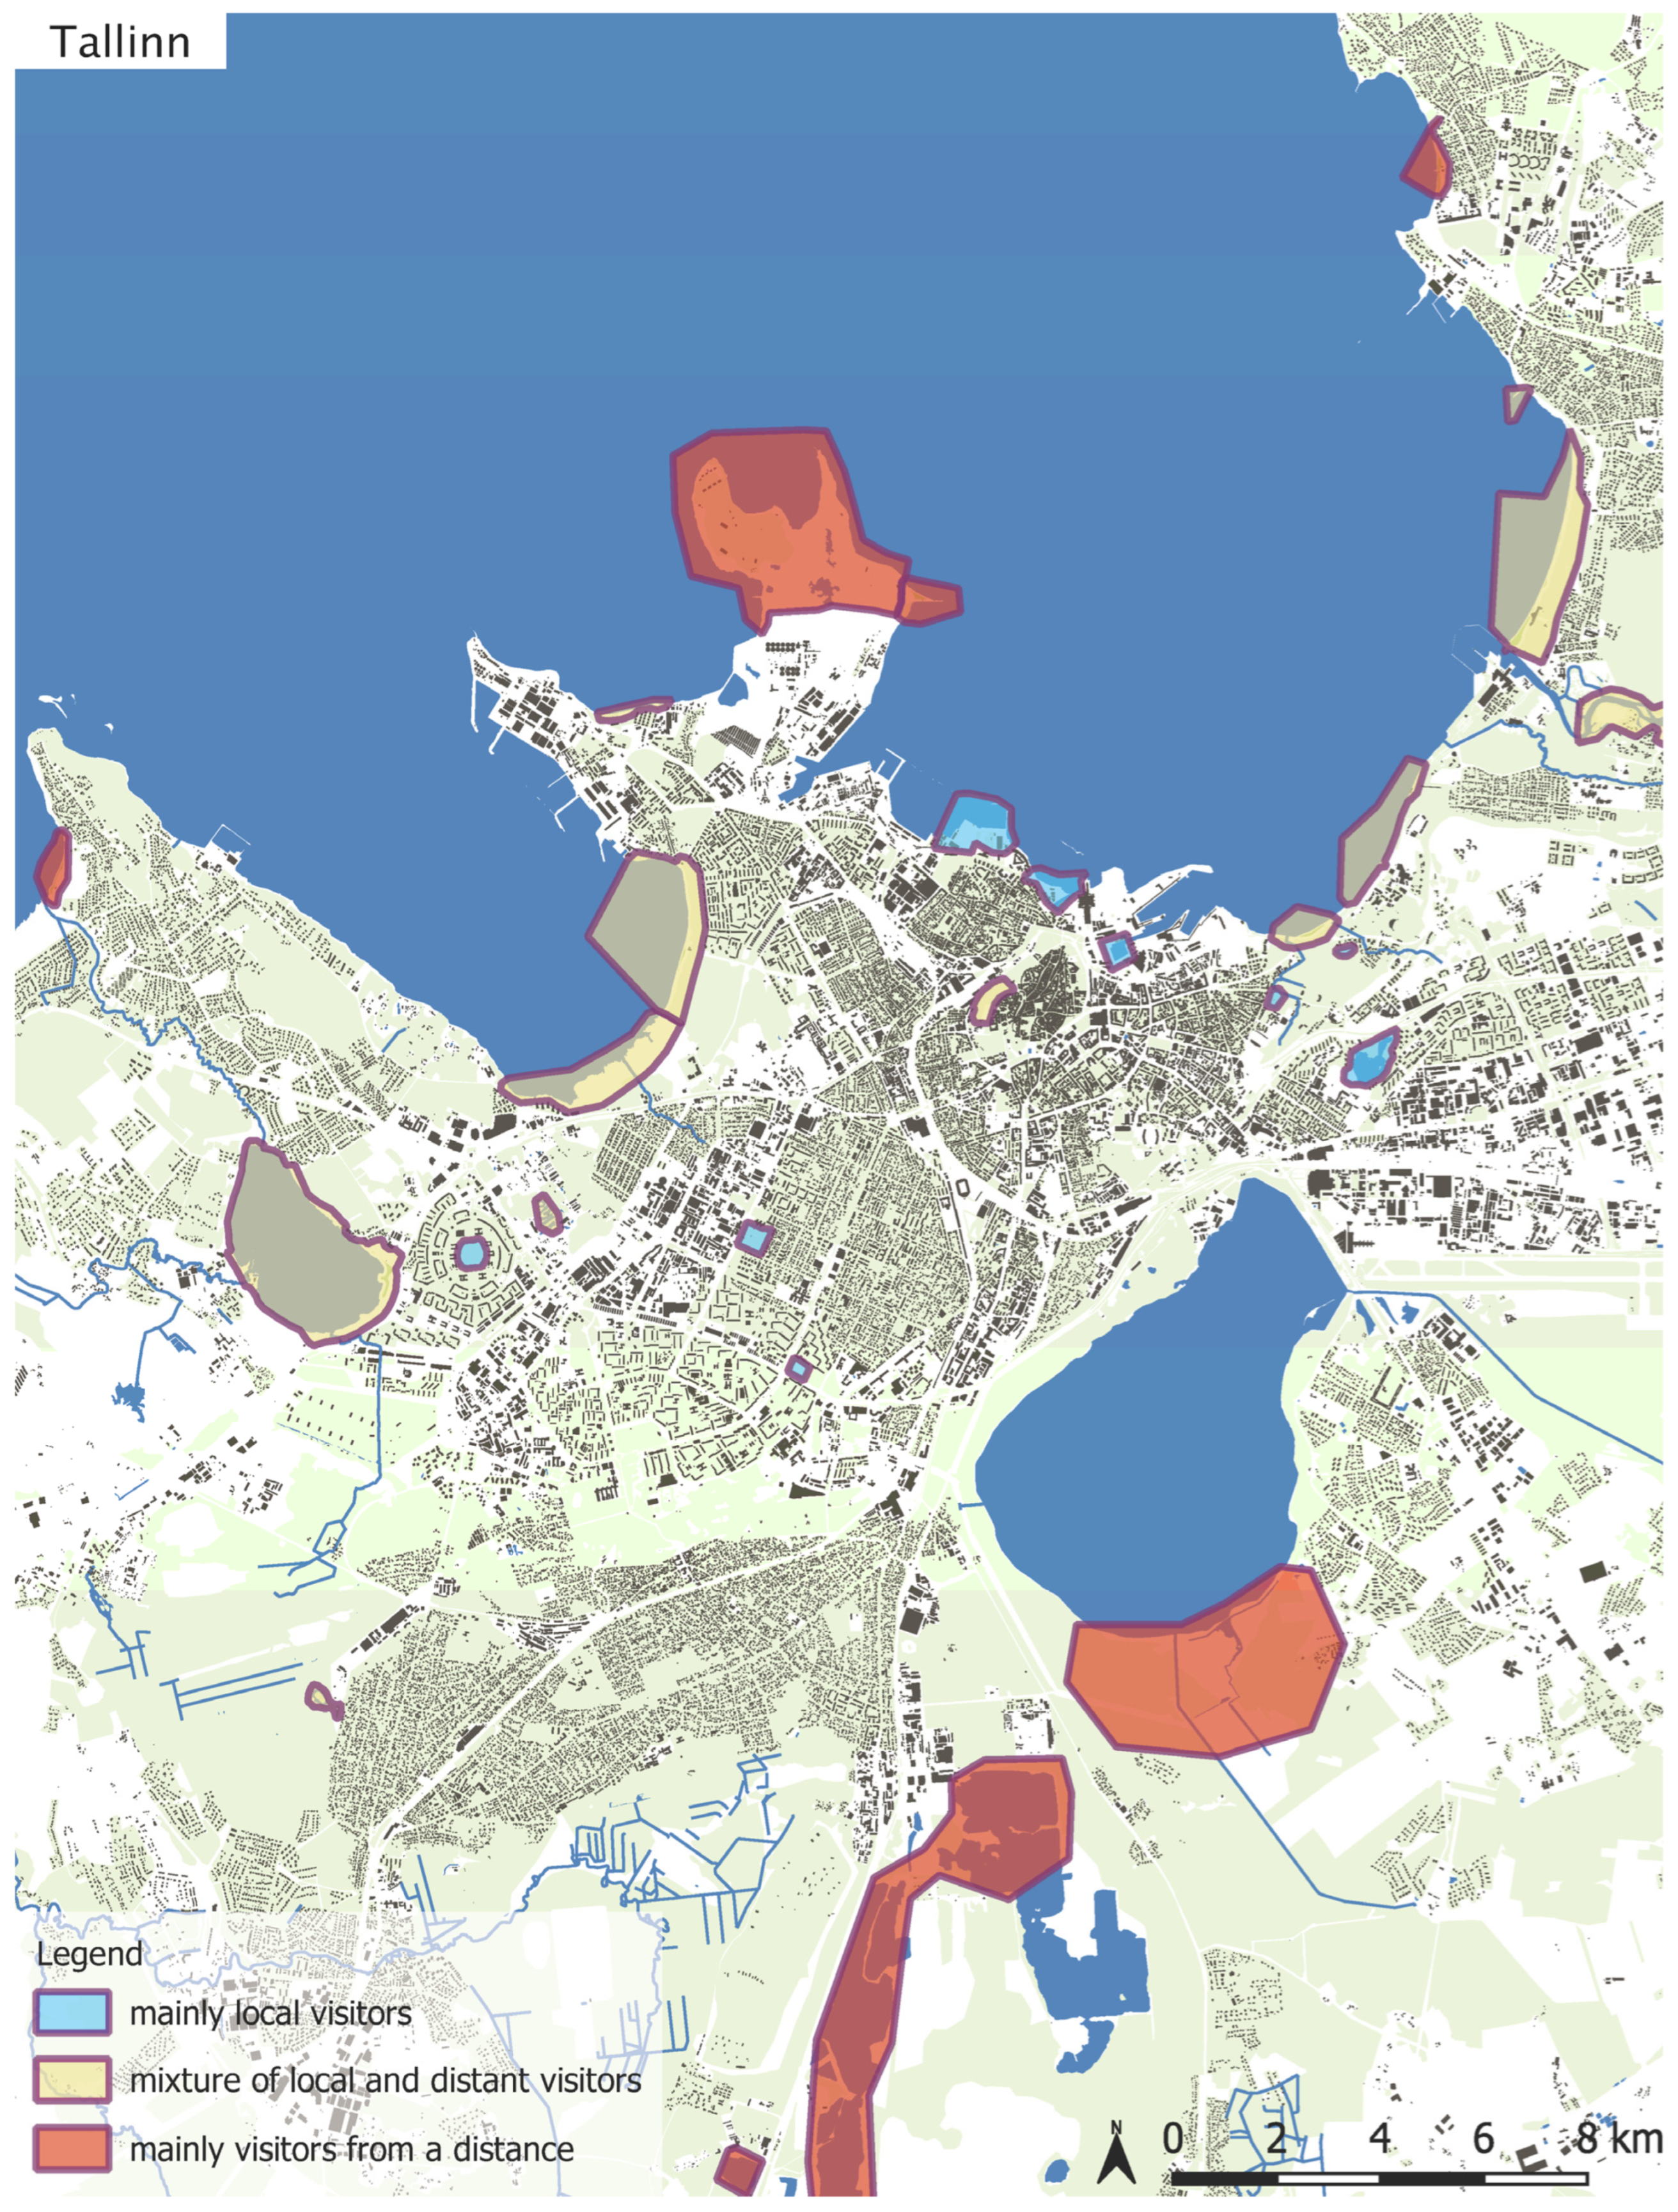
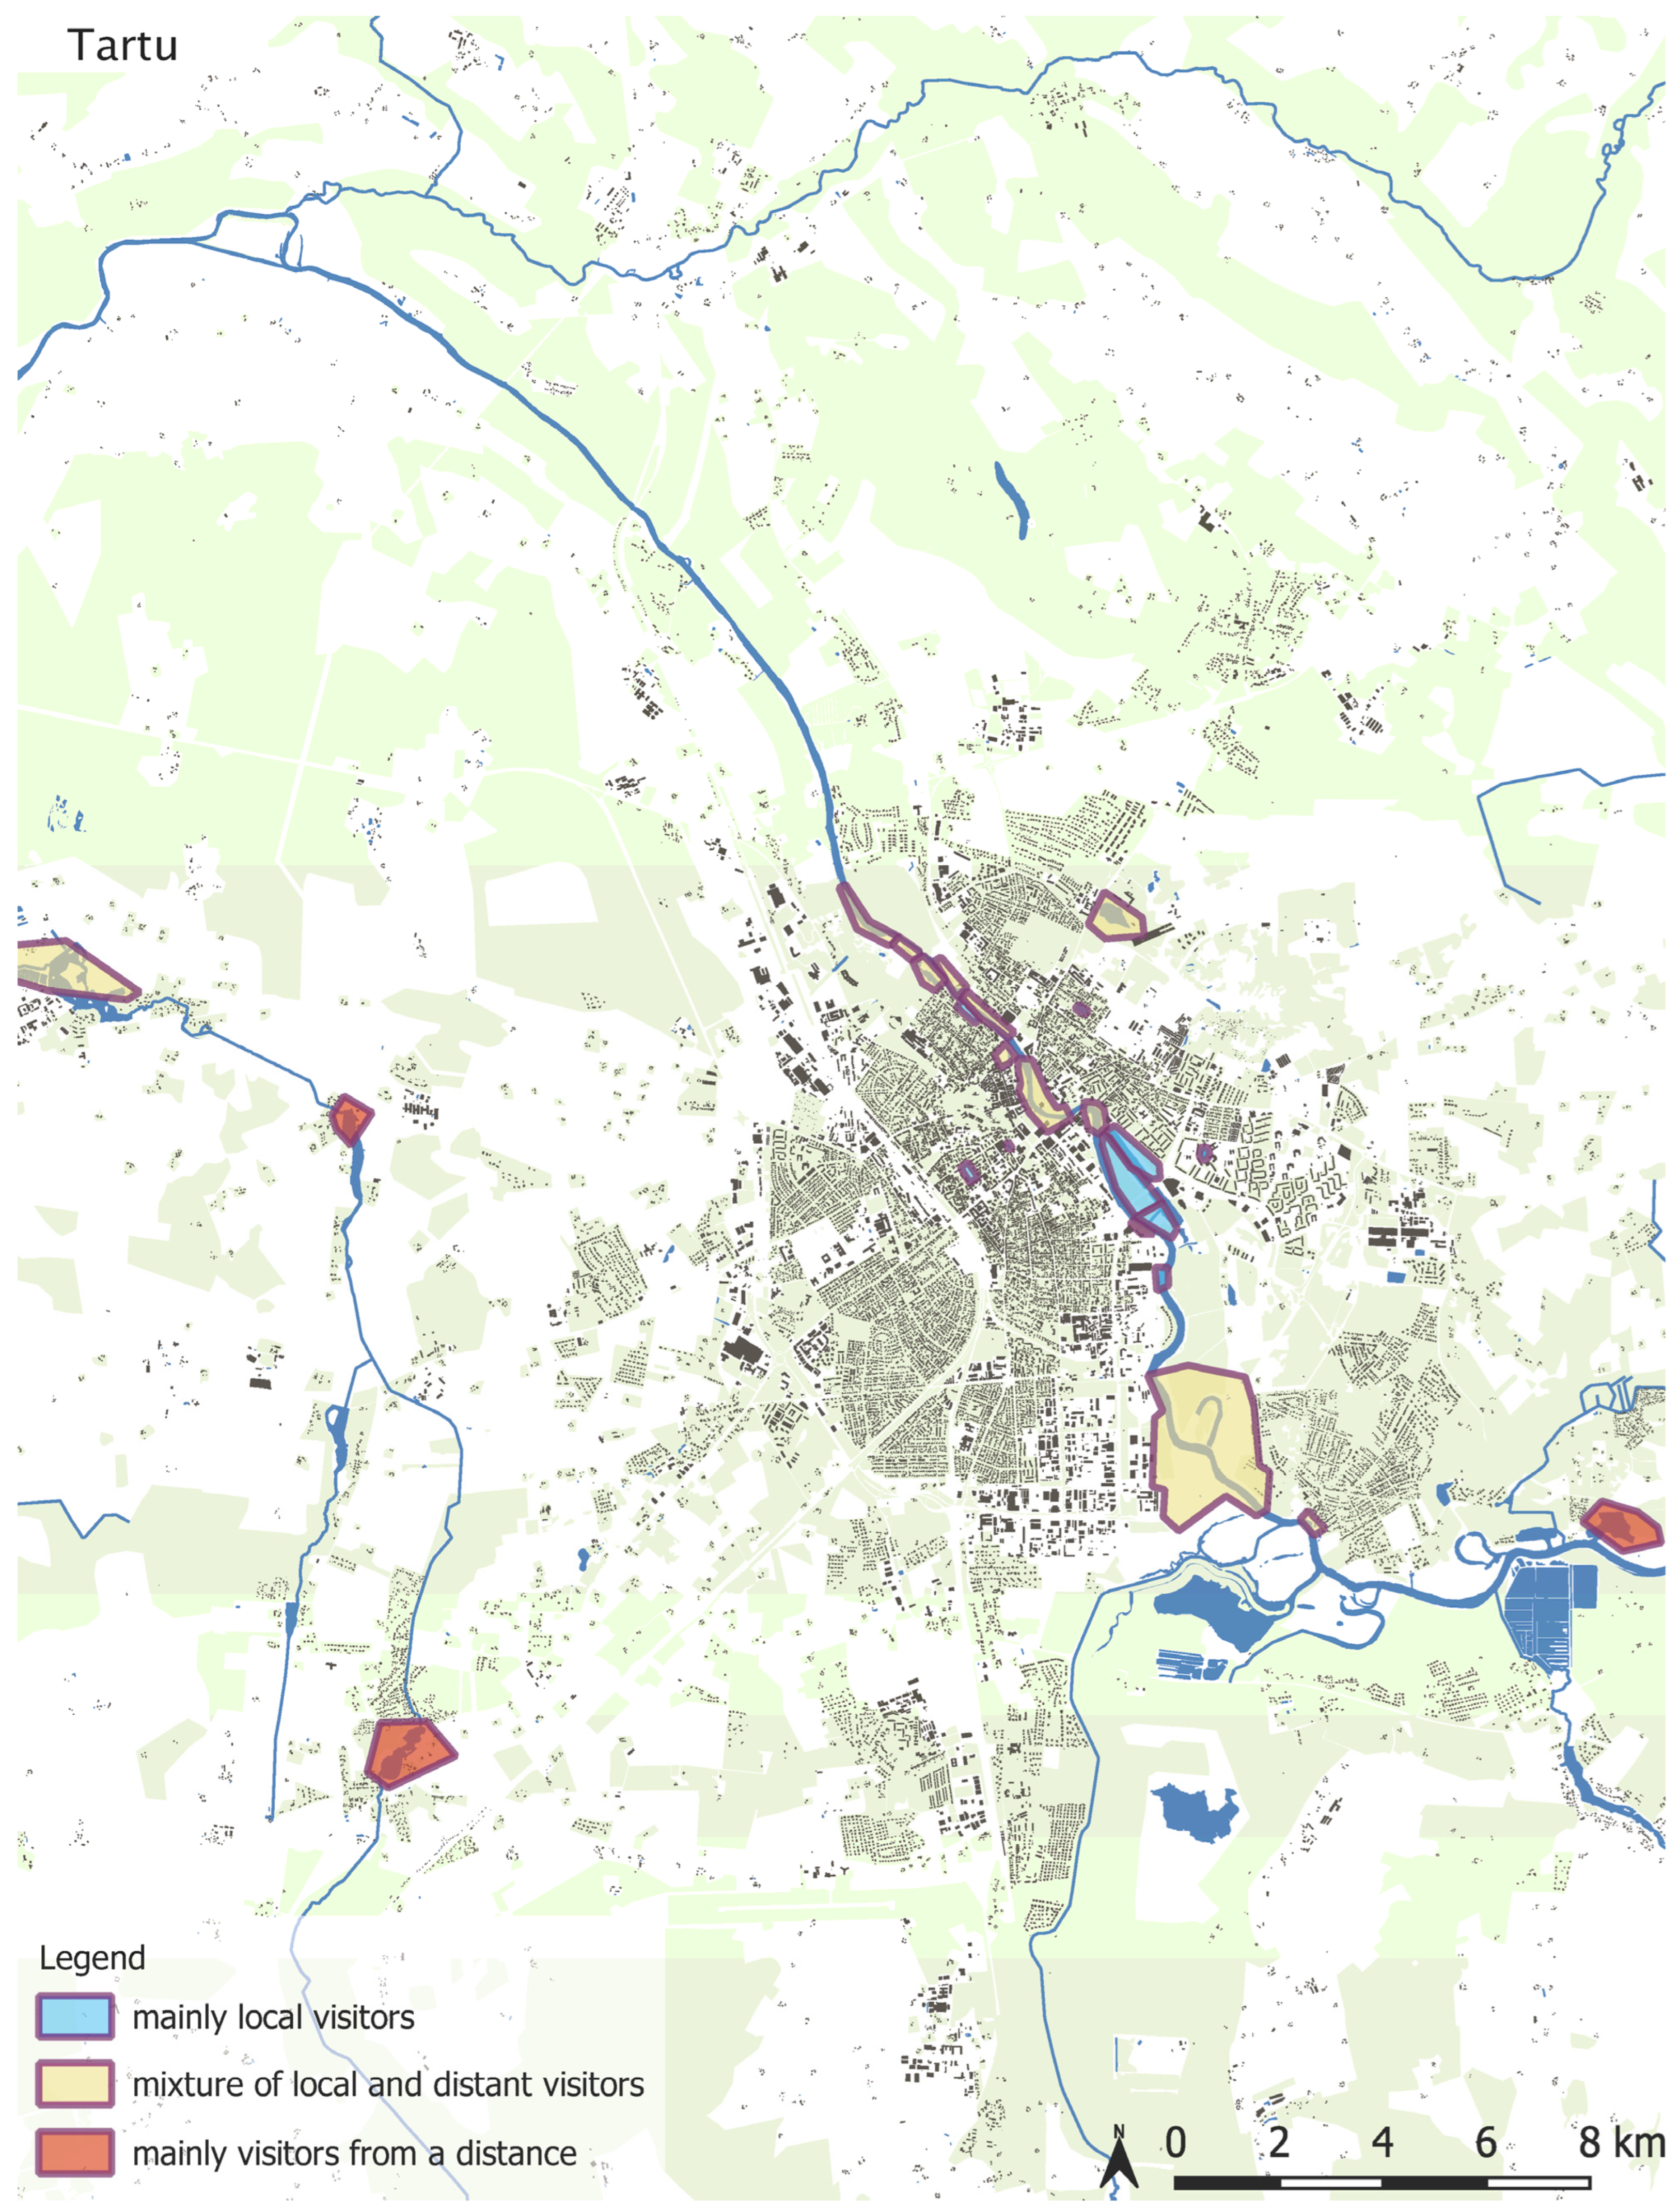
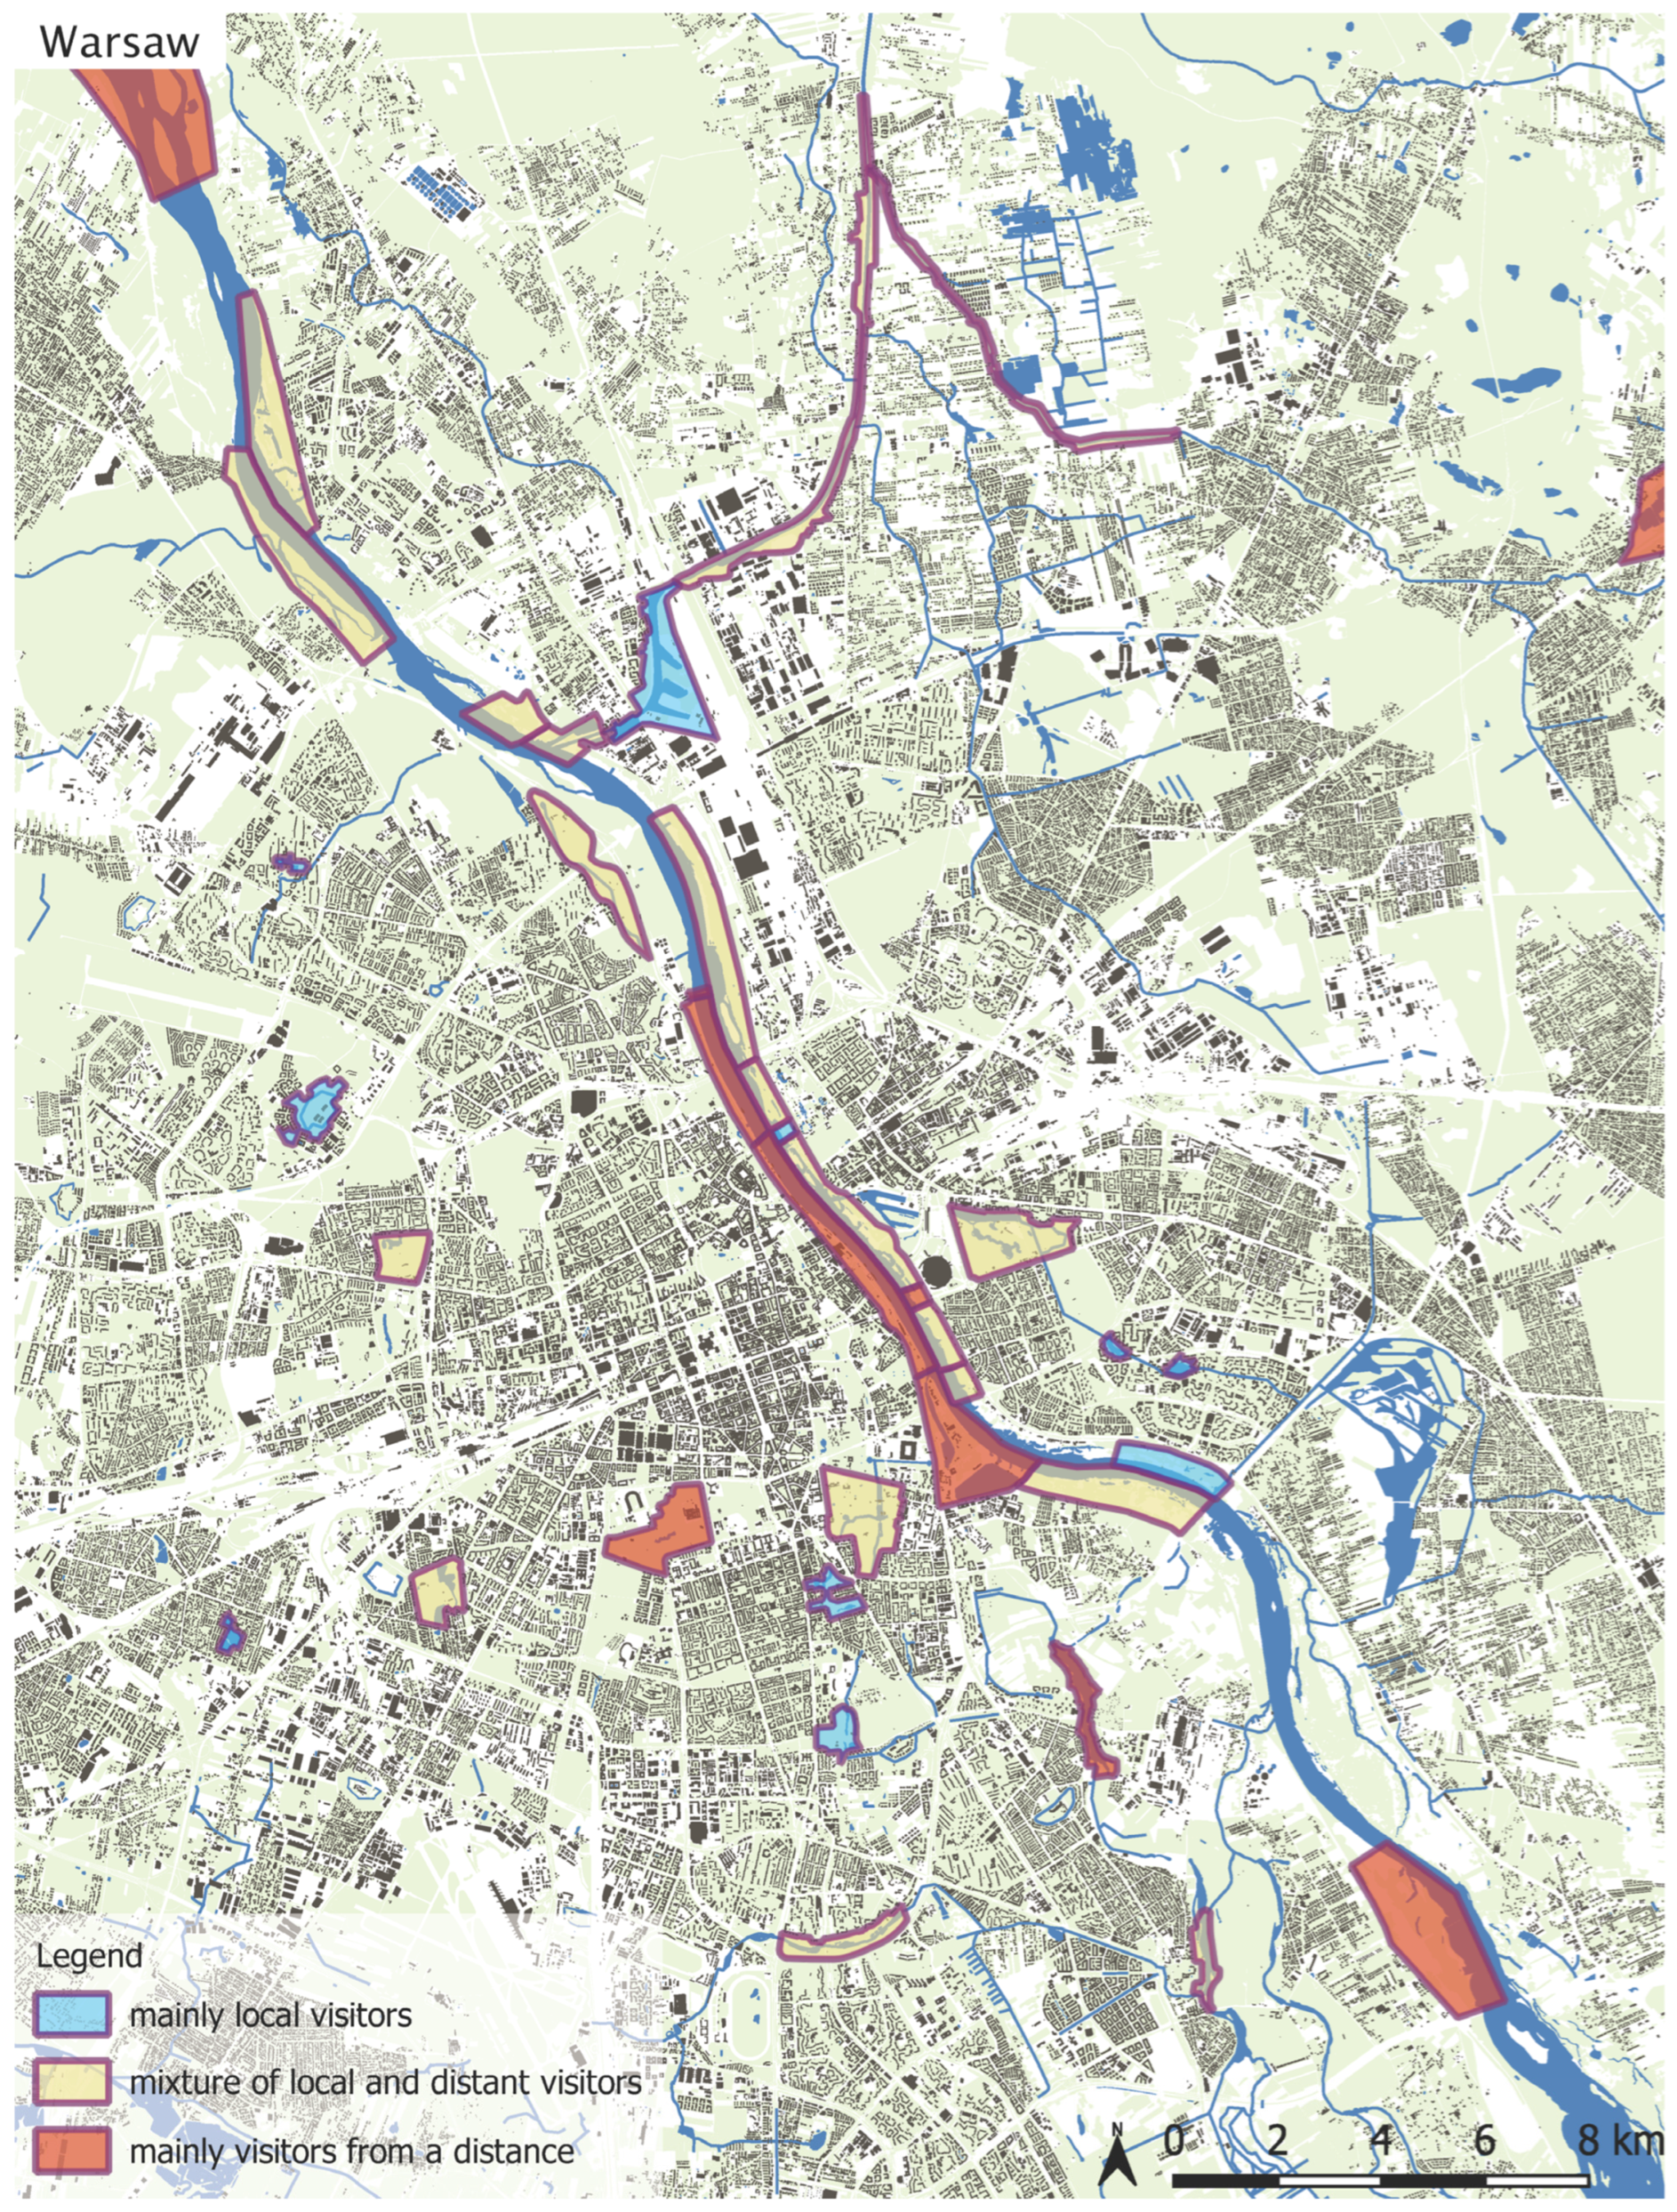
4.2.3. Visitor Catchment and Blue Space Relationships
5. Discussion
6. Conclusions
6.1. Limitations
6.2. Further Research
Supplementary Materials
Author Contributions
Funding
Institutional Review Board Statement
Informed Consent Statement
Data Availability Statement
Acknowledgments
Conflicts of Interest
Appendix A

| Tallinn | Tartu | Warsaw | Plymouth | Barcelona | ||||||
|---|---|---|---|---|---|---|---|---|---|---|
| χ2 | N | χ2 | N | χ2 | N | χ2 | N | χ2 | N | |
| Female (df1) | 1.98 | 350 | 5.63 * | 328 | 0.17 | 291 | 0.14 | 758 | 4.06 * | 477 |
| Age group (df5) | 7.93 b | 350 | 7.18 | 328 | 4.30 | 293 | 18.96 ** b | 758 | 11.40 * | 477 |
| Role of water in overall experience (df4) | 3.64 ª | 288 | 10.67 * ª | 239 | 1.37 ª | 323 | 1.16 ª | 491 | 11.75 * | 231 |
| Cultural values and ambience (df1) | f p = 0.461 | 65 | f p = 1.000 | 60 | 0.755 | 289 | 0.95 | 222 | 2.81 | 163 |
| Beauty and views (df1) | f p = 0.067 | 65 | f p = 0.250 | 60 | 5.492 * | 289 | 1.05 | 222 | 0.33 | 163 |
| Restorative (df1) | f p = 1.000 | 65 | f p = 1.000 | 60 | 3.236 | 289 | 2.95 | 222 | 0.55 | 163 |
| Escapism (df1) | f p = 0.027 * | 65 | f p = 0.070 | 60 | 0.252 | 289 | 0.22 | 222 | 1.24 | 163 |
| Nature (df1) | f p = 0.205 | 65 | f p = 0.202 | 60 | 5.112 * | 289 | 0.05 | 222 | 0.97 | 163 |
| Blue space itself (df1) | 0.87 | 65 | f p = 0.485 | 60 | 5.102 * | 289 | 1.79 | 222 | 1.57 | 163 |
| Activities (df1) | 0.00 | 65 | 0.09 | 60 | 0.187 | 289 | 0.10 | 222 | 0.89 | 163 |
| Facilities level (df2) | 4.84 | 291 | 7.81 * | 279 | 10.11 ** | 353 | 29.50 *** | 571 | 1.81 | 293 |
| Land access level (df2) | 7.90 * | 291 | 5.83 | 279 | 0.54 | 353 | 30.70 *** | 571 | 0.13 | 293 |
| Water access level (df2) | 5.35 | 291 | 2.56 | 279 | 13.17 ** | 353 | 44.01 *** | 571 | 9.23 ** | 293 |
| Marina, dock, jetty (df1) | 7.22 ** | 291 | 3.18 | 279 | 13.51 *** | 353 | 13.90 *** | 571 | 0.07 | 293 |
| Urban street, square (df1) | 0.42 | 279 | 5.22 * | 571 | ||||||
| Promenade (df1) | 0.72 | 291 | 3.02 | 279 | 17.18 *** | 353 | 28.64 *** | 571 | 0.22 | 293 |
| Meadow (df1) | 0.16 | 291 | 0.41 | 279 | 0.51 | 353 | 11.04 *** | 571 | ||
| Scrub (df1) | 0.04 | 291 | 0.64 | 279 | 0.19 | 293 | ||||
| Park (df1) | 3.72 | 291 | 8.06 ** | 279 | 5.28 * | 353 | 10.70 ** | 571 | 11.43 *** | 293 |
| Woodland (df1) | 14.81 *** | 291 | 3.48 | 279 | 4.15 * | 353 | 41.22 *** | 571 | 3.91 * | 293 |
| Beach (df1) | 7.12 ** | 291 | 2.75 | 279 | 3.16 | 353 | 15.30 *** | 571 | 10.30 ** | 293 |
| Cliff, rocks, shingle (df1) | 0.02 | 291 | 2.88 | 571 | 7.52 ** ª | 293 | ||||
| Pond (df1) | 12.88 *** | 291 | 0.87 | 279 | 2.66 | 353 | f p = 0.124 | 571 | 8.49 ** | 293 |
| Lake (df1) | 0.90 | 291 | 1.1 | 279 | 0.11 | 353 | 4.51 * | 571 | ||
| Wetland (df1) | 5.82 ** | 291 | 2.51 | 279 | f p = 0.201 | 293 | ||||
| Canal (df1) | 20.65 *** | 353 | ||||||||
| River (df1) | 0.02 | 291 | 0.09 | 279 | 24.47 *** | 353 | 10.54 ** | 571 | 5.07 * | 293 |
| Sea (df1) | 4.79 * | 291 | 12.78 *** | 571 | 10.37 ** | 293 | ||||
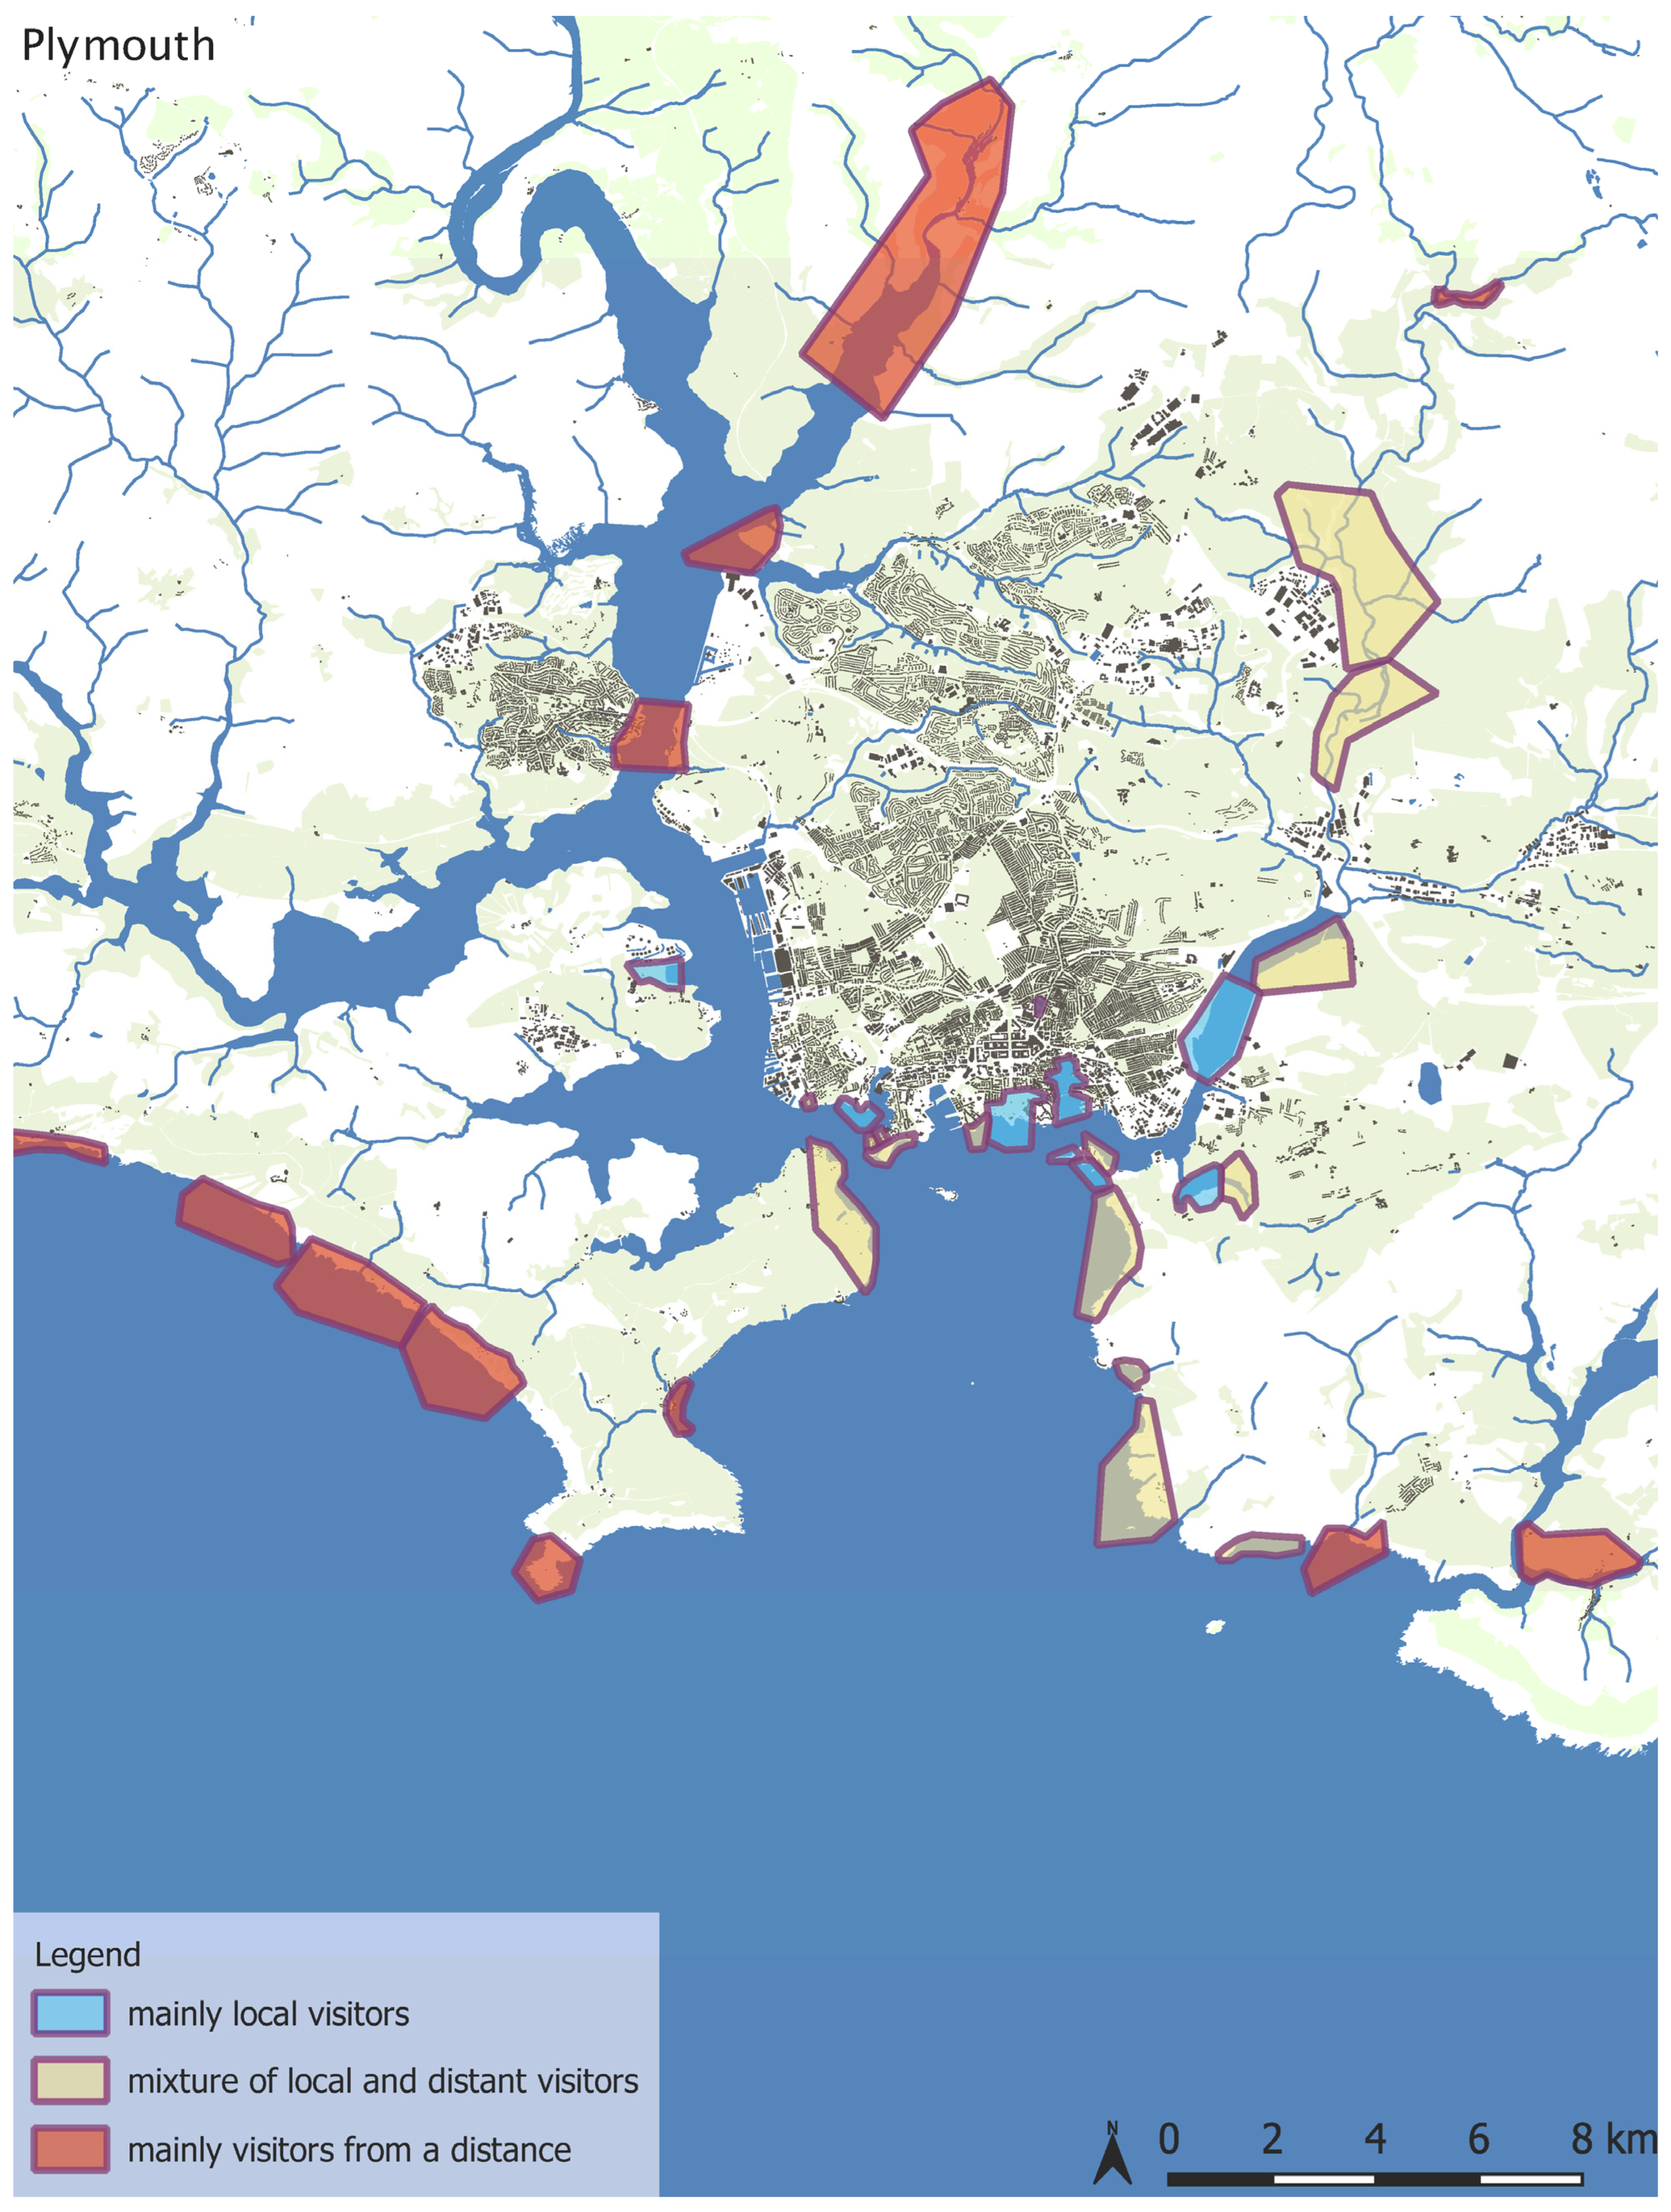
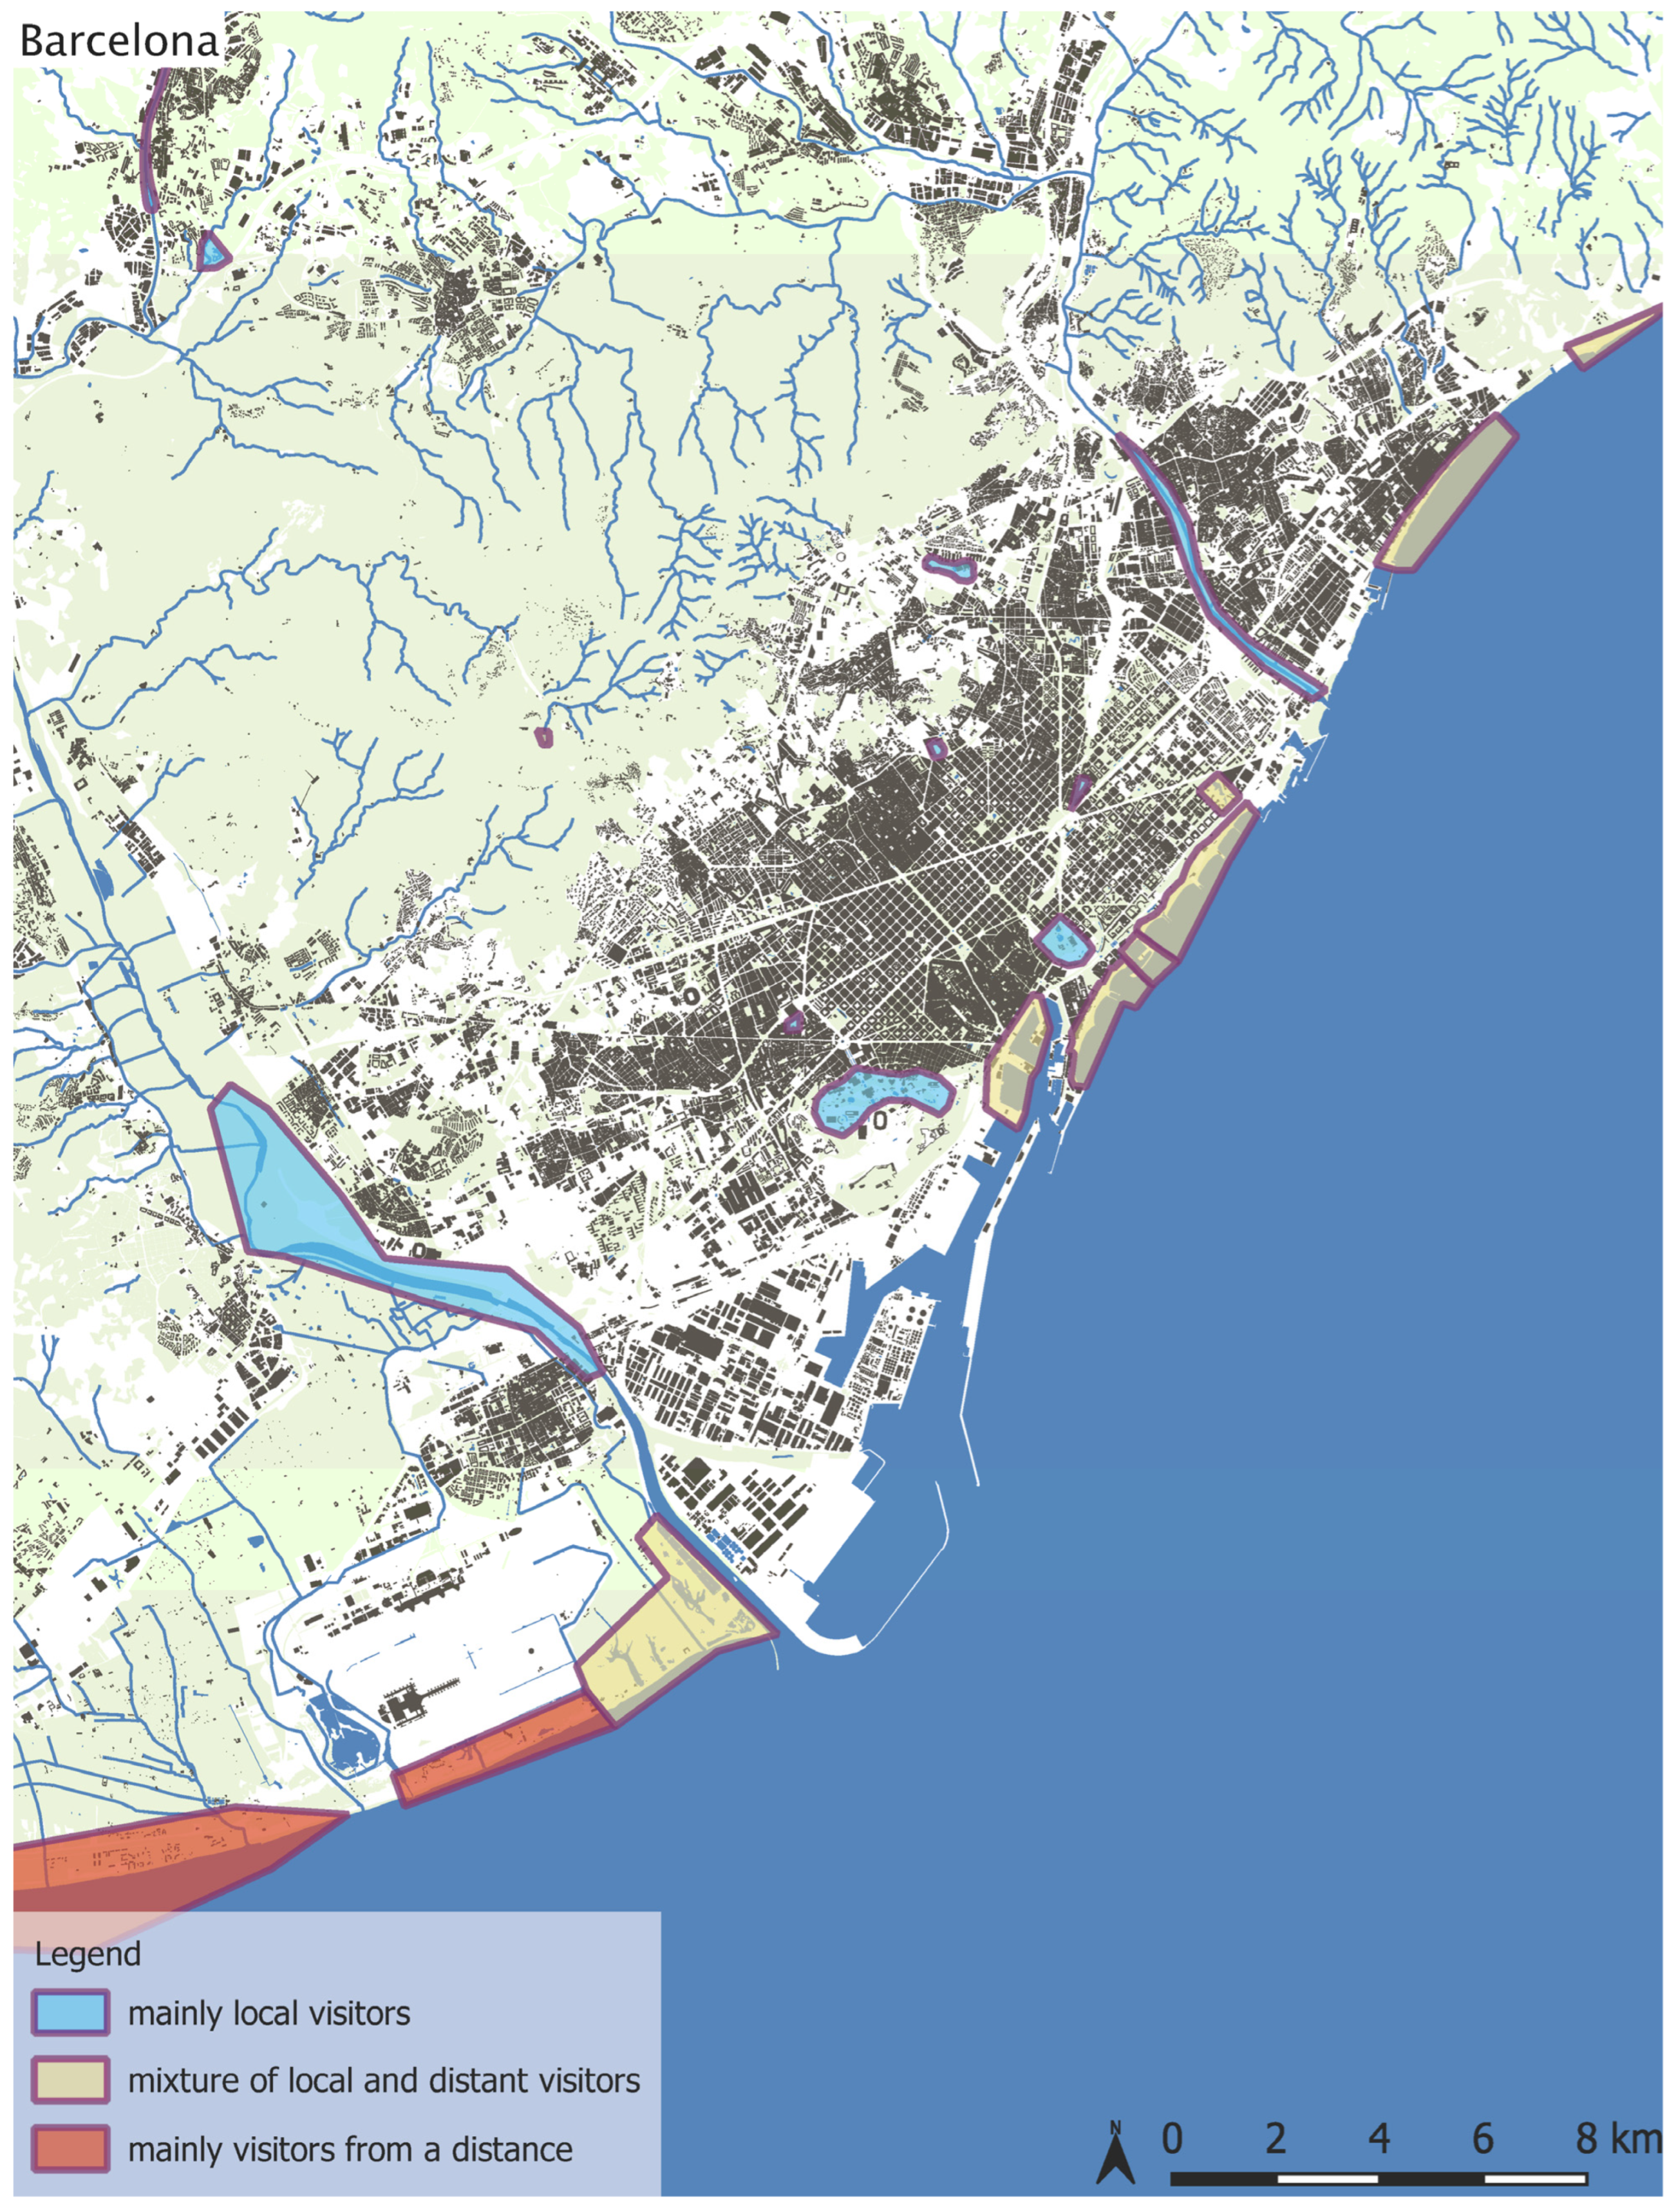
Appendix B. Maps Showing the Distribution of Local, Mixed, and Distant Blue Spaces within Case Study Areas


References
- United Nations. World Urbanization Prospects: The 2018 Revision (ST/ESA/SER.A/420); United Nations: New York, NY, USA, 2019. [Google Scholar]
- United Nations (Ed.) Sustainable Development Challenges; World Economic and Social Survey; United Nations: New York, NY, USA, 2013; ISBN 978-92-1-109167-0. [Google Scholar]
- United Nations. Available online: https://sdgs.un.org/goals (accessed on 19 March 2021).
- IFLA. A Landscape Architecture Guide to the 17 Sustainable Development Goals; IFLA: Hague, The Netherlands, 2022. [Google Scholar]
- Bell, S.; Fleming, L.E.; Grellier, J.; Kuhlmann, F.; Nieuwenhuijsen, M.J.; White, M.P. Urban Blue Spaces: Planning and Design for Water, Health and Well-Being, 1st ed.; Routledge: London, UK, 2021; ISBN 978-0-429-05616-1. [Google Scholar]
- European Commission. The Forms and Functions of Green Infrastructure. Available online: https://ec.europa.eu/environment/nature/ecosystems/benefits/index_en.htm (accessed on 17 March 2021).
- Coutts, C.; Hahn, M. Green Infrastructure, Ecosystem Services, and Human Health. Int. J. Environ. Res. Public Health 2015, 12, 9768–9798. [Google Scholar] [CrossRef] [PubMed]
- Pueffel, C.; Haase, D.; Priess, J.A. Mapping Ecosystem Services on Brownfields in Leipzig, Germany. Ecosystem Services 2018, 30, 73–85. [Google Scholar] [CrossRef]
- Kowarik, I.; Langer, A. Natur-Park Südgelände: Linking Conservation and Recreation in an Abandoned Railyard in Berlin. In Wild Urban Woodlands; Kowarik, I., Körner, S., Eds.; Springer: Berlin/Heidelberg, Germany, 2005; pp. 287–299. ISBN 978-3-540-23912-3. [Google Scholar]
- Ghofrani, Z.; Sposito, V.; Faggian, R. A Comprehensive Review of Blue-Green Infrastructure Concepts. Int. J. Environ. Sustain. 2017, 6, 15–36. [Google Scholar] [CrossRef]
- Iojă, C.I.; Badiu, D.L.; Haase, D.; Hossu, A.C.; Niță, M.R. How about Water? Urban Blue Infrastructure Management in Romania. Cities 2021, 110, 103084. [Google Scholar] [CrossRef]
- Grellier, J.; White, M.P.; Albin, M.; Bell, S.; Elliott, L.R.; Gascón, M.; Gualdi, S.; Mancini, L.; Nieuwenhuijsen, M.J.; Sarigiannis, D.A.; et al. BlueHealth: A Study Programme Protocol for Mapping and Quantifying the Potential Benefits to Public Health and Well-Being from Europe’s Blue Spaces. BMJ Open 2017, 7, e016188. [Google Scholar] [CrossRef] [PubMed]
- Wilczyńska, A.; Myszka, I.; Bell, S.; Slapińska, M.; Janatian, N.; Schwerk, A. Exploring the Spatial Potential of Neglected or Unmanaged Blue Spaces in the City of Warsaw, Poland. Urban For. Urban Green. 2021, 64, 127252. [Google Scholar] [CrossRef]
- Laatikainen, T.; Tenkanen, H.; Kyttä, M.; Toivonen, T. Comparing Conventional and PPGIS Approaches in Measuring Equality of Access to Urban Aquatic Environments. Landsc. Urban Plan. 2015, 144, 22–33. [Google Scholar] [CrossRef]
- Gunawardena, K.R.; Wells, M.J.; Kershaw, T. Utilising Green and Bluespace to Mitigate Urban Heat Island Intensity. Sci. Total Environ. 2017, 584–585, 1040–1055. [Google Scholar] [CrossRef]
- Hartig, T.; Mitchell, R.; de Vries, S.; Frumkin, H. Nature and Health. Annu. Rev. Public Health 2014, 35, 207–228. [Google Scholar] [CrossRef] [PubMed]
- Whitford, V.; Ennos, A.R.; Handley, J.F. “City Form and Natural Process”—Indicators for the Ecological Performance of Urban Areas and Their Application to Merseyside, UK. Landsc. Urban Plan. 2001, 57, 91–103. [Google Scholar] [CrossRef]
- Dietz, M.E. Low Impact Development Practices: A Review of Current Research and Recommendations for Future Directions. Water Air Soil Pollut. 2007, 186, 351–363. [Google Scholar] [CrossRef]
- European Commission. Available online: https://ec.europa.eu/info/research-and-innovation/research-area/environment/nature-based-solutions_en (accessed on 22 March 2021).
- Haase, D. Reflections about Blue Ecosystem Services in Cities. Sustain. Water Qual. Ecol. 2015, 5, 77–83. [Google Scholar] [CrossRef]
- Nguyen, T.T.; Ngo, H.H.; Guo, W.; Wang, X.C.; Ren, N.; Li, G.; Ding, J.; Liang, H. Implementation of a Specific Urban Water Management—Sponge City. Sci. Total Environ. 2019, 652, 147–162. [Google Scholar] [CrossRef]
- Kellert, S.R.; Wilson, E.O. The Biophilia Hypothesis; Island Press: Washington, DC, USA, 1993. [Google Scholar]
- Mitchell, R. Is Physical Activity in Natural Environments Better for Mental Health than Physical Activity in Other Environments? Soc. Sci. Med. 2013, 91, 130–134. [Google Scholar] [CrossRef]
- de Vries, S.; van Dillen, S.M.E.; Groenewegen, P.P.; Spreeuwenberg, P. Streetscape Greenery and Health: Stress, Social Cohesion and Physical Activity as Mediators. Soc. Sci. Med. 2013, 94, 26–33. [Google Scholar] [CrossRef]
- Kaplan, R.; Kaplan, S. The Experience of Nature: A Psychological Perspective; Cambridge University Press: Cambridge, UK, 1989. [Google Scholar]
- White, M.P.; Elliott, L.R.; Grellier, J.; Economou, T.; Bell, S.; Bratman, G.N.; Cirach, M.; Gascon, M.; Lima, M.L.; Lõhmus, M.; et al. Associations between Green/Blue Spaces and Mental Health across 18 Countries. Sci. Rep. 2021, 11, 8903. [Google Scholar] [CrossRef] [PubMed]
- Knopf, R. Human Behavior, Cognition, and Affect in the Natural Environment. In Handbook of Environmental Psychology; Stokols, D., Altman, I., Eds.; Wiley: New York, NY, USA, 1987; pp. 783–825. [Google Scholar]
- Plieninger, T.; Dijks, S.; Oteros-Rozas, E.; Bieling, C. Assessing, Mapping, and Quantifying Cultural Ecosystem Services at Community Level. Land Use Policy 2013, 33, 118–129. [Google Scholar] [CrossRef]
- Vierikko, K.; Niemelä, J. Bottom-up Thinking—Identifying Socio-Cultural Values of Ecosystem Services in Local Blue–Green Infrastructure Planning in Helsinki, Finland. Land Use Policy 2016, 50, 537–547. [Google Scholar] [CrossRef]
- White, M.P.; Elliott, L.R.; Gascon, M.; Roberts, B.; Fleming, L.E. Blue Space, Health and Well-Being: A Narrative Overview and Synthesis of Potential Benefits. Environ. Res. 2020, 191, 110169. [Google Scholar] [CrossRef]
- Beute, F.; Davies, Z.; de Vries, S.; Glanville, J.; Keune, H.; Lammel, A.; Marselle, M.; O’Brien, L.; Olszewska-Guizzo, A.; Remmen, R.; et al. Types and Characteristics of Urban and Peri-Urban Blue Spaces Having an Impact on Human Mental Health and Wellbeing: A Systematic Review; Report Prepared by an EKLIPSE Expert Working Group; UK Centre for Ecology & Hydrology: Wallingford, UK, 2020; p. 58. [Google Scholar]
- Gascon, M.; Zijlema, W.; Vert, C.; White, M.P.; Nieuwenhuijsen, M.J. Outdoor Blue Spaces, Human Health and Well-Being: A Systematic Review of Quantitative Studies. Int. J. Hyg. Environ. Health 2017, 220, 1207–1221. [Google Scholar] [CrossRef]
- White, M.P.; Alcock, I.; Wheeler, B.W.; Depledge, M.H. Coastal Proximity, Health and Well-Being: Results from a Longitudinal Panel Survey. Health Place 2013, 23, 97–103. [Google Scholar] [CrossRef] [PubMed]
- Kupryś-Lipińska, I.; Kuna, P.; Wagner, I. Water in the Urban Space and the Health of Residents. In Woda w Mieście; Sustainable Development Applications; Fundacja Sendzimira: Kraków, Poland, 2014; Volume 5, p. 57. [Google Scholar]
- Takano, T.; Nakamura, K.; Watanabe, M. Urban Residential Environments and Senior Citizens’ Longevity in Megacity Areas: The Importance of Walkable Green Spaces. J. Epidemiol. Community Health 2002, 56, 913–918. [Google Scholar] [CrossRef]
- Wheeler, B.W.; White, M.; Stahl-Timmins, W.; Depledge, M.H. Does Living by the Coast Improve Health and Wellbeing? Health Place 2012, 18, 1198–1201. [Google Scholar] [CrossRef] [PubMed]
- Börger, T.; Campbell, D.; White, M.P.; Elliott, L.R.; Fleming, L.E.; Garrett, J.K.; Hattam, C.; Hynes, S.; Lankia, T.; Taylor, T. The Value of Blue-Space Recreation and Perceived Water Quality across Europe: A Contingent Behaviour Study. Sci. Total Environ. 2021, 771, 145597. [Google Scholar] [CrossRef] [PubMed]
- Dean, A.J.; Ross, H.; Roiko, A.; Fielding, K.S.; Saeck, E.; Johnston, K.; Beatson, A.; Udy, J.; Maxwell, P. Beyond Proximity: How Subjective Perceptions of Enablers and Constraints Influence Patterns of Blue Space Recreation. Landsc. Urban Plan. 2022, 228, 104557. [Google Scholar] [CrossRef]
- Hillsdon, M.; Panter, J.; Foster, C.; Jones, A. The Relationship between Access and Quality of Urban Green Space with Population Physical Activity. Public Health 2006, 120, 1127–1132. [Google Scholar] [CrossRef]
- Bahrini, F.; Bell, S.; Mokhtarzadeh, S. The Relationship between the Distribution and Use Patterns of Parks and Their Spatial Accessibility at the City Level: A Case Study from Tehran, Iran. Urban For. Urban Green. 2017, 27, 332–342. [Google Scholar] [CrossRef]
- Bijker, R.A.; Sijtsma, F.J. A Portfolio of Natural Places: Using a Participatory GIS Tool to Compare the Appreciation and Use of Green Spaces inside and Outside Urban Areas by Urban Residents. Landsc. Urban Plan. 2017, 158, 155–165. [Google Scholar] [CrossRef]
- Terkenli, T.S.; Bell, S.; Tošković, O.; Dubljević-Tomićević, J.; Panagopoulos, T.; Straupe, I.; Kristianova, K.; Straigyte, L.; O’Brien, L.; Živojinović, I. Tourist Perceptions and Uses of Urban Green Infrastructure: An Exploratory Cross-Cultural Investigation. Urban For. Urban Green. 2020, 49, 126624. [Google Scholar] [CrossRef]
- Giles-Corti, B.; Broomhall, M.H.; Knuiman, M.; Collins, C.; Douglas, K.; Ng, K.; Lange, A.; Donovan, R.J. Increasing Walking: How Important Is Distance to, Attractiveness, and Size of Public Open Space? Am. J. Prev. Med. 2005, 28, 169–176. [Google Scholar] [CrossRef]
- Giles-Corti, B.; Donovan, R.J. Relative Influences of Individual, Social Environmental, and Physical Environmental Correlates of Walking. Am. J. Public Health 2003, 93, 1583–1589. [Google Scholar] [CrossRef] [PubMed]
- Giles-Corti, B.; Donovan, R.J. The Relative Influence of Individual, Social and Physical Environment Determinants of Physical Activity. Soc. Sci. Med. 2002, 54, 1793–1812. [Google Scholar] [CrossRef] [PubMed]
- Heinen, E.; van Wee, B.; Maat, K. Commuting by Bicycle: An Overview of the Literature. Transp. Rev. 2010, 30, 59–96. [Google Scholar] [CrossRef]
- Finlay, J.; Franke, T.; McKay, H.; Sims-Gould, J. Therapeutic Landscapes and Wellbeing in Later Life: Impacts of Blue and Green Spaces for Older Adults. Health Place 2015, 34, 97–106. [Google Scholar] [CrossRef] [PubMed]
- Völker, S.; Kistemann, T. The Impact of Blue Space on Human Health and Well-Being—Salutogenetic Health Effects of Inland Surface Waters: A Review. Int. J. Hyg. Environ. Health 2011, 214, 449–460. [Google Scholar] [PubMed]
- Korpela, K.; Hartig, T. Restorative qualities of favorite places. J. Environ. Psychol. 1996, 16, 221–233. [Google Scholar] [CrossRef]
- White, M.P.; Weeks, A.; Hooper, T.; Bleakley, L.; Cracknell, D.; Lovell, R.; Jefferson, R.L. Marine Wildlife as an Important Component of Coastal Visits: The Role of Perceived Biodiversity and Species Behaviour. Mar. Policy 2017, 78, 80–89. [Google Scholar] [CrossRef]
- Ode Sang, Å.; Knez, I.; Gunnarsson, B.; Hedblom, M. The Effects of Naturalness, Gender, and Age on How Urban Green Space Is Perceived and Used. Urban For. Urban Green. 2016, 18, 268–276. [Google Scholar] [CrossRef]
- Korpilo, S.; Kaaronen, R.O.; Olafsson, A.S.; Raymond, C.M. Public Participation GIS Can Help Assess Multiple Dimensions of Environmental Justice in Urban Green and Blue Space Planning. Appl. Geogr. 2022, 148, 102794. [Google Scholar] [CrossRef]
- Kuo, M.; Bacaicoa, M.; Sullivan, W. Transforming Inner-City LandscapesTrees, Sense of Safety, and Preference. Environ. Behav. 1998, 30, 28–59. [Google Scholar] [CrossRef]
- Unt, A.-L.; Bell, S. The Impact of Small-Scale Design Interventions on the Behaviour Patterns of the Users of an Urban Wasteland. Urban For. Urban Green. 2014, 13, 121–135. [Google Scholar] [CrossRef]
- Vert, C.; Carrasco-Turigas, G.; Zijlema, W.; Espinosa, A.; Cano-Riu, L.; Elliott, L.R.; Litt, J.; Nieuwenhuijsen, M.J.; Gascon, M. Impact of a Riverside Accessibility Intervention on Use, Physical Activity, and Wellbeing: A Mixed Methods Pre-Post Evaluation. Landsc. Urban Plan. 2019, 190, 103611. [Google Scholar] [CrossRef]
- Pietrzyk-Kaszyńska, A.; Czepkiewicz, M.; Kronenberg, J. Eliciting Non-Monetary Values of Formal and Informal Urban Green Spaces Using Public Participation GIS. Landsc. Urban Plan. 2017, 160, 85–95. [Google Scholar] [CrossRef]
- Gascon, M.; Triguero-Mas, M.; Martínez, D.; Dadvand, P.; Forns, J.; Plasència, A.; Nieuwenhuijsen, M. Mental Health Benefits of Long-Term Exposure to Residential Green and Blue Spaces: A Systematic Review. Int. J. Environ. Res. Public Health 2015, 12, 4354–4379. [Google Scholar] [CrossRef] [PubMed]
- Vassiljev, P.; Vert, C.; Bell, S. Observing Behaviour for Site Planning and Design. In Urban Blue Spaces: Planning and Design for Water, Health and Well-Being; Bell, S., Fleming, L.E., Grellier, J., Kuhlmann, F., Nieuwenhuijsen, M.J., White, M.P., Eds.; Routledge: London, UK, 2021; ISBN 978-0-429-05616-1. [Google Scholar]
- Elliott, L.R.; White, M.P.; Grellier, J.; Rees, S.E.; Waters, R.D.; Fleming, L.E. Recreational Visits to Marine and Coastal Environments in England: Where, What, Who, Why, and When? Mar. Policy 2018, 97, 305–314. [Google Scholar] [CrossRef]
- Völker, S.; Kistemann, T. Developing the Urban Blue: Comparative Health Responses to Blue and Green Urban Open Spaces in Germany. Health Place 2015, 35, 196–205. [Google Scholar] [CrossRef] [PubMed]
- Vassiljev, P.; Bell, S.; Balicka, J.; Amrita, U.A.A. Urban Blue Acupuncture: An Experiment on Preferences for Design Options Using Virtual Models. Sustainability 2020, 12, 10656. [Google Scholar] [CrossRef]
- Mishra, H.S.; Bell, S.; Roberts, B.R.; White, M.P. Theory-Based Design for Promoting Positive Behaviours in an Urban Blue Space: Pre-and-Post Observations of a Community Co-Created Intervention in Plymouth, United Kingdom. Landsc. Urban Plan. 2023, 233, 104708. [Google Scholar] [CrossRef]
- Vacht, P.; Koff, T.; Plüschke-Altof, B.; Müüripeal, A. Ecosystem Services of Tallinn City: Achievements and Challenges. Dyn. Environ. 2018, 42, 328–341. [Google Scholar] [CrossRef]
- Łepkowski, M. Informal Green Areas of Warsaw. The Aesthetics of the Undesigned Landscape. Ph.D. Thesis, Warsaw University of Life Sciences, Warsaw, Poland, 2022. [Google Scholar] [CrossRef]
- Pawlak, J.; Teisseyre-Sierpińska, M.; Zakrzewska, E.; Badałow, G.; Pietrusiewicz, W.; Cieszewska, A.; Kaliszuk, E.; Salwicka, J.; Szablowska, K.; Szulczewska, B.; et al. Eco-Physiographic Study for the Study of Conditions and Directions of Spatial Development of the City of Warsaw; Office of the Chief Architect of the City Municipal Office of Spatial Planning and Development Strategy of Warsaw: Warsaw, Poland, 2006; pp. 9–39. [Google Scholar]
- Piwowarski, M. ”Ścieżka Jak Ścieżka” (“the Path Like a Path”). Autoportret. Pismo o dobrej przestrzeni 2015, 2. Available online: https://www.autoportret.pl/artykuly/sciezka-jak-sciezka/ (accessed on 26 April 2023).
- Wojnowska-Heciak, M. Green areas along rivers’ frontline. Case studies Budapest, Prague and Warsaw. Chall. Mod. Technol. 2016, 7, 46–53. [Google Scholar]
- Duda-Gromada, K. Tereny nad Wisłą w Warszawie jako miejsce spotkań (w opinii mieszkańców wybranych osiedli). Pr. Geogr. 2017, zeszyt 152, 67–81. [Google Scholar] [CrossRef]
- Bird, E.C.F. Coastal Geomorphology: An Introduction, 2nd ed.; John Wiley and Sons Ltd.: West Sussex, UK, 2008; ISBN 978-0-470-51729-1. [Google Scholar]
- Plymouth’s Green Space Strategy 2008–2023; Plymouth City Council: Plymouth, UK, 2009.
- Blue Health. 2020. Available online: https://bluehealth2020.eu/resources/future-bluehealth-plymouth/ (accessed on 26 December 2022).
- Data Plymouth. Available online: http://www.dataplymouth.co.uk/datasets (accessed on 26 December 2022).
- Barcelona City. Available online: https://www.barcelona.cat/en/coneixbcn/pics/la-llera-del-riu-besos_99400387431.html (accessed on 22 December 2022).
- Catalunya. Available online: https://www.catalunya.com/llobregat-river-park-17-16003-508?language=en (accessed on 22 December 2022).
- Guillen, J.; Garcia-Olivares, A.; Ojeda, E.; Osorio, A.; Chic, O.; González, R. Long-Term Quantification of Beach Users Using Video Monitoring. J. Coast. Res. 2009, 24, 1612–1619. [Google Scholar] [CrossRef]
- World Health Organization. Available online: https://www.who.int/news-room/feature-stories/detail/barcelona-using-urban-design-to-improve-urban-health (accessed on 26 December 2022).
- Schmidt-Thome, K.; Wallin, S.; Laatikainen, T.; Kangasoja, J.; Kyttä, M. Exploring the Use of PPGIS in Self-Organizing Urban Development: Case SoftGIS in Pacific Beach. J. Community Inform. 2014, 10, 131–144. [Google Scholar] [CrossRef]
- Brown, G.; Kyttä, M. Key Issues and Research Priorities for Public Participation GIS (PPGIS): A Synthesis Based on Empirical Research. Appl. Geogr. 2014, 46, 122–136. [Google Scholar] [CrossRef]
- Fagerholm, N.; Martín-López, B.; Torralba, M.; Oteros-Rozas, E.; Lechner, A.; Bieling, C.; Olafsson, A.; Albert, C.; Raymond, C.; Garcia-Martin, M.; et al. Perceived Contributions of Multifunctional Landscapes to Human Well-being: Evidence from 13 European Sites. People Nat. 2020, 2, 217–234. [Google Scholar] [CrossRef]
- Mapptionnaire. Available online: https://maptionnaire.com (accessed on 29 December 2022).
- Heksagon. Available online: https://heksagon.org/geoankieta/ (accessed on 29 December 2022).
- Fagerholm, N.; Raymond, C.M.; Olafsson, A.S.; Brown, G.; Rinne, T.; Hasanzadeh, K.; Broberg, A.; Kyttä, M. A Methodological Framework for Analysis of Participatory Mapping Data in Research, Planning, and Management. Int. J. Geogr. Inf. Sci. 2021, 35, 1848–1875. [Google Scholar] [CrossRef]


| Tallinn | Tartu | Warsaw | Plymouth | Barcelona | |
|---|---|---|---|---|---|
| 1st quintile | 0.05–1.25 | 0.09–0.88 | 0.04–0.59 | 0.15–1.69 | 0.06–1.34 |
| 2nd quintile | 1.25–3.03 | 0.88–1.53 | 0.59–1.41 | 1.69–3.14 | 1.34–3.09 |
| 3rd quintile | 3.03–4.66 | 1.53–2.45 | 1.41–2.94 | 3.14–5.68 | 3.09–5.68 |
| 4th quintile | 4.66–7.90 | 2.45–4.98 | 2.94–6.39 | 5.68–10.59 | 5.68–22.7 |
| 5th quintile | 7.90–4569.53 | 4.98–207.21 | 6.39–32.05 | 10.59–36.45 | 22.69–1647.91 |
| Mean distance | 21.026 | 9.057 | 3.868 | 11.057 | 27.287 |
| Median distance | 3.679 | 1.882 | 2.083 | 4.033 | 4.486 |
| n | 347 | 326 | 319 | 735 | 482 |
| N | 376 | 336 | 454 | 833 | 488 |
| Tallinn | Tartu | Warsaw | Plymouth | Barcelona | ||||||
|---|---|---|---|---|---|---|---|---|---|---|
| r or τb | N | r or τb | N | r or τb | N | r or τb | N | r or τb | N | |
| Female (r) | 0.02 | 347 | 0.03 | 326 | −0.04 | 217 | −0.02 | 735 | 0.03 | 476 |
| Age group (τb) | 0.12 ** | 347 | 0.07 | 326 | −0.04 | 218 | 0.05 | 735 | 0 | 476 |
| Role of water in overall experience (τb) | 0.09 | 285 | 0.11 * | 237 | 0.04 | 235 | 0.03 | 477 | 0.23 *** | 231 |
| Cultural values and ambience (r) | 0.23 | 62 | 0.09 | 58 | 0.15 * | 208 | 0.17 * | 199 | 0.21 ** | 162 |
| Beauty and views (r) | 0.14 | 62 | −0.08 | 58 | 0.00 | 208 | −0.07 | 199 | −0.04 | 162 |
| Restorativeness (r) | −0.07 | 62 | 0.21 | 58 | −0.05 | 208 | −0.06 | 199 | 0.15 | 162 |
| Escapism (r) | 0.12 | 62 | 0.26 | 58 | −0.11 | 208 | 0.04 | 199 | −0.05 | 162 |
| Nature (r) | −0.10 | 62 | 0.03 | 58 | −0.17 * | 208 | 0.02 | 199 | −0.05 | 162 |
| Blue space itself (r) | −0.13 | 62 | −0.16 | 58 | 0.01 | 208 | 0.02 | 199 | −0.06 | 162 |
| Activities (r) | −0.14 | 62 | −0.05 | 58 | 0.22 ** | 208 | −0.05 | 199 | −0.11 | 162 |
| Facilities level (τb) | −0.05 | 289 | −0.06 | 277 | 0.27 *** | 249 | −0.22 *** | 554 | 0.02 | 292 |
| Land access level (τb) | −0.18 *** | 289 | −0.16 *** | 277 | −0.07 | 249 | −0.22 *** | 554 | −0.04 | 292 |
| Water access level (τb) | 0.05 | 289 | 0.07 | 277 | 0.28 *** | 249 | −0.18 *** | 554 | −0.10 * | 292 |
| Marina, dock, jetty (r) | −0.13 * | 289 | 0.12 * | 277 | −0.21 ** | 249 | −0.04 | 554 | −0.08 | 292 |
| Urban street, square (r) | −0.05 | 277 | −0.04 | 554 | ||||||
| Promenade (r) | 0 | 289 | −0.06 | 277 | 0.28 *** | 249 | −0.09 * | 554 | −0.21 *** | 292 |
| Meadow (r) | 0.05 | 289 | 0 | 277 | −0.04 | 249 | 0.03 | 554 | ||
| Scrub (r) | −0.06 | 289 | 0.02 | 277 | −0.03 | 292 | ||||
| Park (r) | −0.18 ** | 289 | −0.15 * | 277 | −0.22 *** | 249 | −0.03 | 554 | −0.19 *** | 292 |
| Woodland (r) | 0.31 *** | 289 | 0.18 ** | 277 | −0.04 | 249 | 0.07 | 554 | 0.37 *** | 292 |
| Beach (r) | 0.19 ** | 289 | 0.10 | 277 | 0.28 *** | 249 | 0.04 | 554 | 0.23 *** | 292 |
| Cliff, rocks, shingle (r) | −0.04 | 289 | 0.04 | 554 | 0.76 *** | 292 | ||||
| Pond (r) | −0.20 *** | 289 | −0.06 | 277 | −0.13 * | 249 | −0.03 | 554 | −0.18 *** | 292 |
| Lake (r) | 0.08 | 289 | 0.11 | 277 | 0.16 * | 249 | 0.06 | 554 | ||
| Wetland (r) | 0.07 | 289 | 0.05 | 277 | 0.04 | 292 | ||||
| Canal (r) | −0.28 *** | 249 | ||||||||
| River (r) | 0.01 | 289 | −0.06 | 277 | 0.26 *** | 249 | 0 | 554 | −0.11 | 292 |
| Sea (r) | 0.09 | 289 | −0.02 | 554 | 0.20 *** | 292 | ||||
| Variable | level | Tallinn | Tartu | Warsaw | Plymouth | Barcelona | |||||
|---|---|---|---|---|---|---|---|---|---|---|---|
| Distant | Close | Distant | Close | Distant | Close | Distant | Close | Distant | Close | ||
| Female (d) | 1 | −2.37 * | 2.37 * | −2.02 * | 2.02 * | ||||||
| Age group | 1 | −3.05 * | 3.05 * | 0.40 | −0.40 | ||||||
| 2 | −0.58 | 0.58 | 0.14 | −0.14 | |||||||
| 3 | 3.26 * | −3.26 * | 0.21 | −0.21 | |||||||
| 4 | −0.01 | 0.01 | −2.48 * | 2.48 * | |||||||
| 5 | −0.71 | 0.71 | 2.52 * | −2.52 * | |||||||
| 6 | −1.33 | 1.33 | −0.43 | 0.43 | |||||||
| 7 | −0.20 | 0.20 | |||||||||
| Role of water in the overall experience | 1 | −0.86 | 0.86 | ||||||||
| 2 | −2.68 * | 2.68 * | |||||||||
| 3 | 0.94 | −0.94 | |||||||||
| 4 | −0.95 | 0.95 | |||||||||
| 5 | 2.48 * | −2.48 * | |||||||||
| Cultural values and ambience (d) | 1 | ||||||||||
| Beauty and views (d) | 1 | 2.34 * | −2.34 * | ||||||||
| Restorative (d) | 1 | ||||||||||
| Escapism (d) | 1 | 2.34 * | −2.34 * | ||||||||
| Nature (d) | 1 | −2.26 * | 2.26 * | ||||||||
| Blue space itself (d) | 1 | 2.26 * | −2.26 * | ||||||||
| Activities (d) | 1 | ||||||||||
| Facilities level | 0 | −1.45 | 1.45 | −2.59 * | 2.59 * | 4.32 * | −4.32 * | ||||
| 1 | 2.65 * | −2.65 * | −1.01 | 1.01 | 2.32 * | −2.32 * | |||||
| 2 | −1.65 | 1.65 | 3.09 * | −3.09 * | −5.00 * | 5.00 * | |||||
| Land access level | 0 | 1.98 * | −1.98 * | 1.94 | −1.94 | ||||||
| 1 | 1.59 | −1.59 | 4.97 * | −4.97 * | |||||||
| 2 | −2.79 * | 2.79 * | −5.51 * | 5.51 * | |||||||
| Water access level | 0 | −1.73 | 1.73 | −0.17 | .17 | −1.51 | 1.51 | ||||
| 1 | −1.58 | 1.58 | 6.45 * | −6.45 * | 3.02 * | −3.02 * | |||||
| 2 | 3.61 * | −3.61 * | −6.04 * | 6.04 * | −2.25 * | 2.25 * | |||||
| Marina, dock, jetty (d) | 1 | −2.69 * | 2.69 * | −3.68 * | 3.68 * | −3.73 * | 3.73 * | ||||
| Urban street, square (d) | 1 | −2.28 * | 2.28 * | ||||||||
| Promenade (d) | 1 | 4.14 * | −4.14 * | −5.35 * | 5.35 * | ||||||
| Meadow (d) | 1 | 3.32 * | −3.32 * | ||||||||
| Scrub (d) | 1 | ||||||||||
| Park (d) | 1 | −2.84 * | 2.84 * | −2.30 * | 2.30 * | −3.27 * | 3.27 * | −3.38 * | 3.38 * | ||
| Woodland (d) | 1 | 3.85 * | −3.85 * | −2.04 * | 2.04 * | 6.42 * | −6.42 * | 1.98 * | −1.98 * | ||
| Beach (d) | 1 | 2.67 | −2.67 * | 3.91 * | −3.91 * | 3.21 * | −3.21 * | ||||
| Cliff, rocks, shingle (d) | 1 | 2.74 * | −2.74 * | ||||||||
| Pond (d) | 1 | −3.59 * | 3.59 * | −2.91 * | 2.91 * | ||||||
| Lake (d) | 1 | 2.12 * | −2.12 * | ||||||||
| Wetland (d) | 1 | 2.41 * | −2.41 * | ||||||||
| Canal (d) | 1 | −4.54 * | 4.54 * | ||||||||
| River (d) | 1 | 4.95 * | −4.95 * | 3.25 * | −3.25 * | −2.25 * | 2.25 * | ||||
| Sea (d) | 1 | 2.19 * | −2.19 * | −3.58 * | 3.58 * | 3.22 * | −3.22 * | ||||
| Tallinn | Tartu | Warsaw | Plymouth | Barcelona | ||||||
|---|---|---|---|---|---|---|---|---|---|---|
| τb | N | τb | N | τb | N | τb | N | τb | N | |
| Female | 0.04 | 310 | 0.02 | 282 | 0.08 | 222 | −0.03 | 615 | 0.01 | 291 |
| Age group | 0.04 | 310 | 0.03 | 282 | −0.08 | 223 | 0.09 * | 615 | 0.04 | 291 |
| Role of Water in the overall experience | 0.19 ** | 245 | 0.12 | 204 | −0.05 | 259 | 0.06 | 421 | 0.38 *** | 152 |
| Cultural values and ambience | −0.08 | 58 | −0.18 | 55 | 0.08 | 224 | 0.05 | 173 | 0.10 | 103 |
| Beauty and views | 0.12 | 58 | 0.03 | 55 | 0.09 | 224 | 0.04 | 173 | 0.00 | 103 |
| Restorative | −0.020 | 58 | 0.20 | 55 | −0.05 | 224 | −0.05 | 173 | 0.17 | 103 |
| Escapism | 0.36 ** | 58 | 0.24 | 55 | −0.11 | 224 | −0.05 | 173 | 0.24 * | 103 |
| Nature | 0.18 | 58 | 0.23 | 55 | −0.14 * | 224 | −0.10 | 173 | 0.14 | 103 |
| Blue space itself | −0.01 | 58 | 0.03 | 55 | −0.00 | 224 | 0.02 | 173 | 0.29 ** | 103 |
| Activities | −0.01 | 58 | 0.02 | 55 | 0.18 ** | 224 | 0.07 | 173 | −0.03 | 103 |
| Tallinn | Tartu | Warsaw | Plymouth | Barcelona | ||||||
|---|---|---|---|---|---|---|---|---|---|---|
| τb | N | τb | N | τb | N | τb | N | τb | N | |
| Facilities level | −0.19 | 29 | −0.01 | 26 | 0.00 | 40 | −0.31 * | 41 | 0.05 | 25 |
| Land access level | −0.22 | 29 | −0.16 | 26 | −0.03 | 40 | −0.23 | 41 | 0.05 | 25 |
| Water access level | 0.18 | 29 | 0.30 | 26 | 0.36 * | 40 | −0.07 | 41 | 0.06 | 25 |
| Marina, dock, jetty | −0.31 | 29 | 0.16 | 26 | −0.01 | 40 | −0.03 | 41 | 0.08 | 25 |
| Urban street, square | −0.24 | 26 | 0.15 | 41 | ||||||
| Promenade | 0.06 | 29 | −0.01 | 26 | 0.29 | 40 | −0.42 ** | 41 | 0.15 | 25 |
| Meadow | 0.05 | 29 | −0.06 | 26 | −0.01 | 40 | 0.13 | 41 | ||
| Scrub | 0.04 | 29 | −0.06 | 26 | −0.22 | 25 | ||||
| Park | −0.25 | 29 | −0.24 | 26 | −0.43 ** | 40 | −0.35 * | 41 | −0.61 ** | 25 |
| Woodland | 0.46 * | 29 | 0.38 * | 26 | 0.23 | 40 | 0.27 | 41 | 0.10 | 25 |
| Beach | 0.46 ** | 29 | 0.25 | 26 | 0.33 * | 40 | 0.28 | 41 | 0.74 *** | 25 |
| Cliff, rocks, shingle | 0.05 | 29 | 0.17 | 41 | 0.49 * | 25 | ||||
| Pond | −0.40 * | 29 | −0.32 | 26 | −0.31 * | 40 | −0.22 | 41 | −0.57 ** | 25 |
| Lake | 0.17 | 29 | 0.27 | 26 | 0.21 | 40 | 0.09 | 41 | ||
| Wetland | 0.32 | 29 | 0.10 | 26 | 0.06 | 25 | ||||
| Canal | −0.21 | 40 | ||||||||
| River | −0.13 | 29 | −0.10 | 26 | 0.30 | 40 | 0.06 | 41 | −0.39 * | 25 |
| Sea | 0.22 | 29 | −0.03 | 41 | 0.77 *** | 25 | ||||
Disclaimer/Publisher’s Note: The statements, opinions and data contained in all publications are solely those of the individual author(s) and contributor(s) and not of MDPI and/or the editor(s). MDPI and/or the editor(s) disclaim responsibility for any injury to people or property resulting from any ideas, methods, instructions or products referred to in the content. |
© 2023 by the authors. Licensee MDPI, Basel, Switzerland. This article is an open access article distributed under the terms and conditions of the Creative Commons Attribution (CC BY) license (https://creativecommons.org/licenses/by/4.0/).
Share and Cite
Wilczyńska, A.; Niin, G.; Vassiljev, P.; Myszka, I.; Bell, S. Perceptions and Patterns of Use of Blue Spaces in Selected European Cities: Tartu, Tallinn, Barcelona, Warsaw and Plymouth. Sustainability 2023, 15, 7392. https://doi.org/10.3390/su15097392
Wilczyńska A, Niin G, Vassiljev P, Myszka I, Bell S. Perceptions and Patterns of Use of Blue Spaces in Selected European Cities: Tartu, Tallinn, Barcelona, Warsaw and Plymouth. Sustainability. 2023; 15(9):7392. https://doi.org/10.3390/su15097392
Chicago/Turabian StyleWilczyńska, Anna, Gloria Niin, Peeter Vassiljev, Izabela Myszka, and Simon Bell. 2023. "Perceptions and Patterns of Use of Blue Spaces in Selected European Cities: Tartu, Tallinn, Barcelona, Warsaw and Plymouth" Sustainability 15, no. 9: 7392. https://doi.org/10.3390/su15097392
APA StyleWilczyńska, A., Niin, G., Vassiljev, P., Myszka, I., & Bell, S. (2023). Perceptions and Patterns of Use of Blue Spaces in Selected European Cities: Tartu, Tallinn, Barcelona, Warsaw and Plymouth. Sustainability, 15(9), 7392. https://doi.org/10.3390/su15097392