Article

Study on Inhibition Range of Liquefaction of Saturated Sand by Load Using a Shaking Table Test

1
School of Civil Engineering, Hebei University of Engineering, Handan 056038, China
2
Geotechnical Institute, School of Civil Engineering, Tianjin University, Tianjin 300000, China
3
Beijing Institute of Survey and Design Co., Ltd., Beijing 100038, China
*
Author to whom correspondence should be addressed.
Sustainability 2023, 15(9), 7294; https://doi.org/10.3390/su15097294
Submission received: 13 March 2023 / Revised: 19 April 2023 / Accepted: 24 April 2023 / Published: 27 April 2023
(This article belongs to the Special Issue Sustainable Geotechnical Treatment Technology)

Abstract

:
As a novel, renewable, and efficient source of energy, offshore wind power has attracted many scholars across the globe. Studies show that offshore wind power significantly enhances the liquefaction resistance of marine saturated sand foundations exposed to seismic waves as loads. In the present study, a series of shaking table tests were conducted to study the load-induced enhancement of the liquefaction resistance of the sand. To this end, the excess pore pressures of soil mass at different buried depths were monitored in real time and the variations were analyzed. Moreover, a liquefaction constant was proposed and its influencing range was quantified. The obtained results demonstrated that load inhibits sand liquefaction at the near-end area, while it facilitates sand liquefaction at the far-end area. It is found that in soil under load at a buried depth of zero to two times the diameter, the liquefaction resistance increases linearly with the load value. Furthermore, the range of vertical inhibition and the lateral load wall end is 2.55 times and 2.36 times greater than the load diameter, respectively. The present study provides a basis to study the load-induced inhibition range of sand liquefaction, which is of significant importance for the development and optimization of offshore wind farms.

1. Introduction

As a novel, renewable, and efficient source of energy with superior characteristics, offshore wind power has attracted scholars across the world [1,2,3]. Aiming to reduce emissions and approaching carbon neutrality, the development of offshore wind power is of socioeconomic significance [4]. Considering the requirements of the 14th Five-Year Plan (2021–2025), this is especially more pronounced in China. Studies show that China is rich in offshore wind energy resources, with an estimated power of 750 million kilowatts. However, the offshore environment has complex hydrogeological conditions and is prone to earthquakes. Various cyclic loads can easily induce sand liquefaction [5]. Under these conditions, the liquefaction phenomenon frequently occurs in saturated sand [6,7], resulting in the instability of the upper wind power load [8]. The upper load is transferred to the foundation through offshore wind power load, affecting the liquefaction resistance of the saturated sand foundation [9]. Considering the impact of loads on the liquefaction resistance of the foundation, this parameter should be considered in the design and construction of offshore wind powerplants, which can effectively enhance the safety and reliability of offshore construction, thereby generating great social and economic benefits. By studying offshore wind power as a load to suppress sand liquefaction, it can effectively promote the safe and rapid development of offshore wind power technology. As a representative clean and renewable energy source, the stability and safety of offshore wind power under earthquakes can effectively promote the development of the energy industry in the field of sustainable development.
It Is worth noting that the liquefaction resistance of sand foundation is affected by numerous factors, including the compactness and structural characteristics [10], initial stress [11], wave-induced vibrations (which are affected by the form, frequency, and loading time of waves) [12], and sand saturation [13,14,15]. Considering the importance of the issue, numerous investigations have been carried out in this regard. For instance, Reddy Nerusupalli Dinesh Kumar [16], Zeybek Abdülhakim [17], and Frid Vladimir [18] proposed theories to obtain the properties of liquefied soil mass and analyzed the correlation between consolidation and rigidity. The proposed theories covered the affecting parameters such as compactness, degree of consolidation, and dynamic load [18]. It was found that the sand content has a great impact on the acoustic behavior of the front and back of liquefaction points [16,17,19]. Zeng [20], Heng [21], and Xenaki [22] performed experiments using multifunctional static and dynamic hydraulic shear instruments and developed a linear monotonic correlation between fine contents and pore pressure, and a nonlinear monotonic correlation between clay content and pore pressure [20,21,22,23]. Guo [24], He [25], and Yang [26] investigated the influences of initial consolidation ratio and consolidation stress on the sand strength and liquefaction of sand foundations [24,25,26]. Although remarkable achievements have been made, the influences of sand foundation properties on the liquefaction resistance cannot directly explain the influence of upper loads such as construction and wind power on the liquefaction resistance of soil mass.
Huang, Bian, and Chen [27,28] conducted experiments and studied the influence of the load of the wind turbine tower on the liquefaction of the gravel sand. The obtained empirical results demonstrated that cyclic loading should be considered in designs and the implicit model of the soil mass that simulates the cyclic loading path is not an appropriate method to analyze interactions between the foundation and soil mass [29]. Accordingly, performing an accurate loading analysis is of significant importance to prevent load liquefaction. Cai [30] and Pang [31] investigated the stability of the wind farm foundation under load using various methods. It should be indicated that the impacts of load on the sand liquefaction phenomenon have been rarely studied [30,31]. In this regard, Lian [32] and Li [33] studied the impact of the bucket foundation on the liquefaction of sand foundations to prevent the occurrence of this destructive phenomenon [32,33]. However, the numerical simulations and centrifuge experiments carried out in these studies did not cover seismic loadings of waves, and no improvement was reported for liquefaction resistance. Ma et al. [34] performed numerical simulations to study the impacts of load on the liquefaction resistance of the sand. It should be indicated that shaking table tests have been rarely conducted to investigate the influence of multiple loads on sand liquefaction.
In summary, most studies investigating the effects of load on the liquefaction resistance of sand adopt quantitative methods. The main objective of the present study was to carry out large-scale shaking table tests to analyze excess pore pressures of soil mass at different buried depths under different vibration waves in real time. In this regard, the liquefaction of sand foundations under vibration waves was also investigated. Analyzing different responses, the intention was to study the liquefaction resistance of sand foundations under different loads.

2. Shaking Table Tests

2.1. Preparation of the Test Setup

2.1.1. Saturated Foundation and Preparation Thereof

The test material is the sand foundation. The test background is the offshore wind power foundation constructed in the sea area near Fujian, China. The foundation weight is used as the load to study the inhibition range of sand foundation liquefaction. In this regard, standard Fujian sand was used to simulate the marine sand environment. Table 1 and Figure 1 show the physical parameters and the gradation curve of the test material, respectively.
In order to determine the saturation level Sr of the sand foundation, a saturation test was carried out before each experiment and accordingly, it was found that the Sr was 0.9. A pluviation method was used to construct the foundation. The falling distance was 40 cm. Based on the anti-seepage design of the model shear box, the saturation device was designed at the bottom of the model box. Due to the capillary action, deaired water entered the sand foundation evenly and quickly. The standard saturation level of the undisturbed sand foundation was prepared by undrained saturation [35,36,37]. Figure 2 and Figure 3 show the preparation process and the saturation device, respectively [38,39,40].

2.1.2. Experimental Setup

The test device mainly consists of a shaking table, a model box, and a loading device. The shaking table is a 3.03   m × 3.03   m one-way hydraulic shaking table. The input acceleration was set to 0.2 g. A rigid laminated shear box was adopted to eliminate the boundary effects in the model. The box has a square frame with 11 layers, an inner side length of 1.2 m, and an outer length of 1.4 m. Six 12 mm diameter hard rubber rods with the same width as the frame were used as flexible bearings between each layer of the frame to reduce the friction between the frames. The model box in Figure 4 shows that the bottom was sealed with plain concrete.
The test scale is 1:100. A scaled composite loading device was constructed to simulate the foundation of the cap-pile structure. The composite device consisted of 1 barrel load, 2 round cap plates, 10 square cap plates, and 4 bolts (piles). Figure 5 shows the isometric model and configuration of the composite loading device.

2.2. Experimental Scheme

In the present study, experiments were carried out to study the impact of load on the liquefaction resistance of the sand. In this regard, the influences of load value and the loading wave were analyzed.
(1)
Designing the load value: During the experiments, the load value was limited to 50% of the ultimate bearing capacity. Moreover, experiments with 20%, 30%, 40%, and 50% of the ultimate bearing capacity were conducted, and no-load tests were carried out as the control test. The bearing capacity can be calculated using the following expression (1):
P u = C N c s c d c i c g c b c + q N q s q d q i q g q b q + 1 2 τ B N τ s τ d τ i τ g τ b τ
The obtained results from Equation (1) are listed in Table 2.
(2)
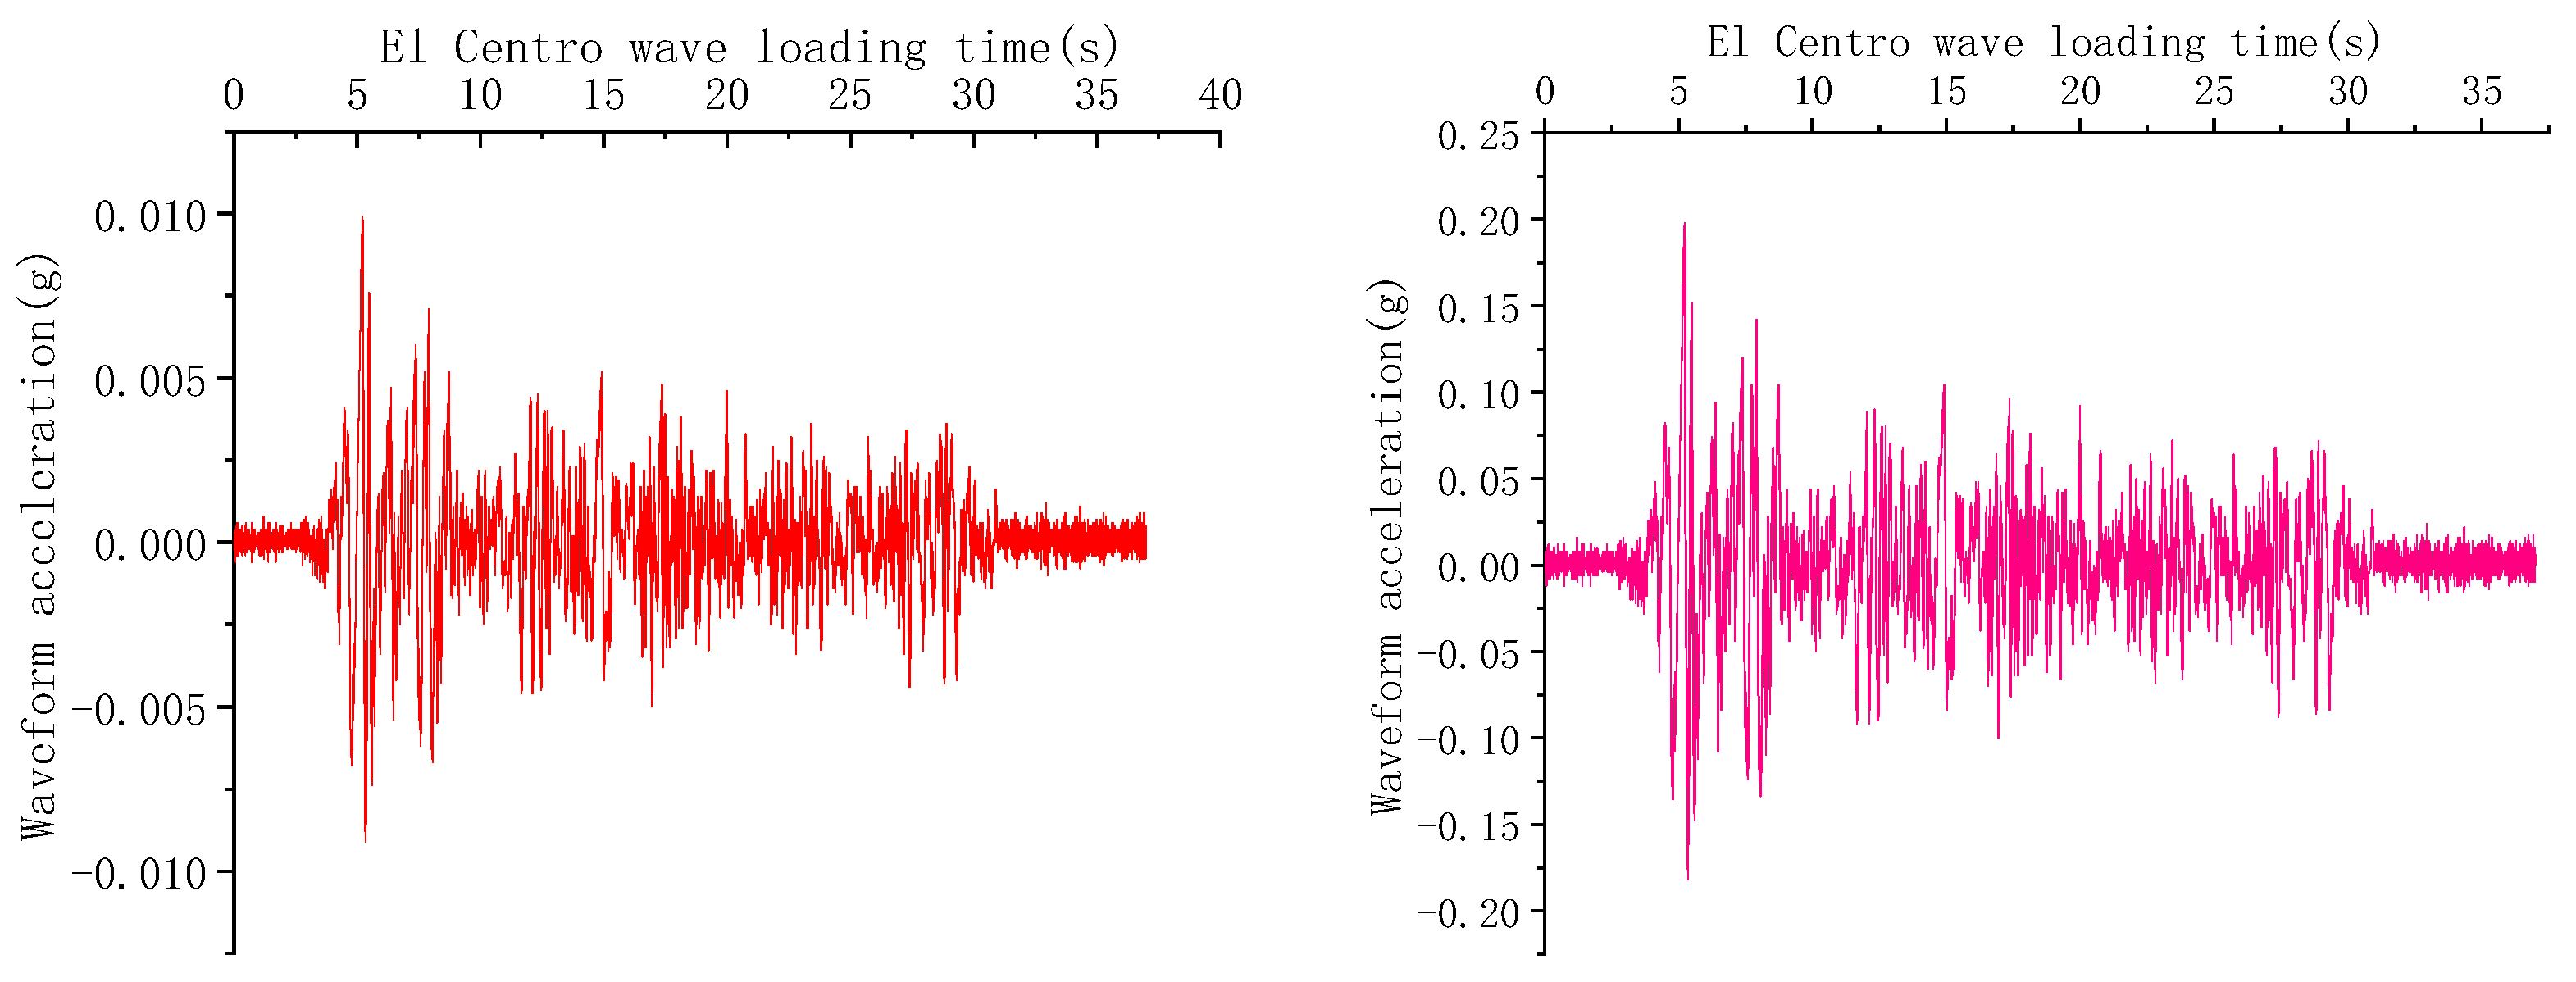
Designing the loading wave: In the present study, an El Centro wave and small-amplitude white noise were used to reduce the influence of noise of the shaking table on the results. The damping ratio and natural vibration frequency of the model box and sand foundation were determined via a small-amplitude white noise loading test, and the resonance between the box and foundation was eliminated. After the dissipation of excess pore pressure, the El Centro wave test was carried out. In order to ensure the test accuracy, the sand was unloaded and replaced after each load test. Figure 6 illustrates the input wave of the shaking table.

2.3. Monitoring Scheme

The excess pore pressures of soil at different buried depths were monitored in real time. Then, real-time data were collected and transformed using a dynamic data acquisition instrument (Donghua 64-channel DH5921) with a frequency of 200 Hz.
The lower load diameter was defined as R0, and the approximate influence range had a diameter of 2R0 [18]. Accordingly, sensors were installed inside a circle with a diameter of 2R0 with the load center as the origin. To analyze the influence of load on the liquefaction resistance of sand, the spacing between sensors was set beyond this range. Figure 7 shows the layout of pore pressure sensors.

3. Excess Pore Pressure Ratio Response of the Load-Sand Foundation

Based on the measured excess pore pressures of the foundation soil at different buried depths and the calculated excess pore pressure ratio using Equation (2), foundation liquefaction was analyzed under different loads. The excess pore pressure ratio is defined in the form below:
η = Δ P W δ V
where η is the excess pore pressure ratio of the monitoring point, Δ P W is the excess pore pressure at a specific buried depth, and δ V is the sum of the effective stress of the foundation and load-induced additional stress reflecting the effective stress acting on the foundation.
According to the results of Seed’s simplified method, when the excess pore pressure ratio is less than one, the occurrence of liquefaction of sand foundation is positively correlated with the excess pore pressure ratio. Accordingly, the influence of load on the liquefaction of sand foundation can be obtained by comparing the excess pore pressure ratios of soil at different buried depths under no load conditions and those under different loads.
Figure 8 shows that excess pore pressure ratios of soil are consistent at different buried depths and monitoring positions.
Figure 8a indicates that the applied load drastically inhibits the liquefaction of soil beneath the load foundation and the inhibiting effect is independent of the load. Nevertheless, considering the influence of the load value on the excess pore pressure ratio, liquefaction is prone to occur at this point. Figure 8b shows that as the buried depth increases, load still inhibits liquefaction effects, which linearly increase with the increasing load. It is worth noting that such an impact is less significant than that in Figure 8a, but it can still effectively constrain liquefaction. However, the inhibition effect disappears in the late stage of the test with 20% of the ultimate bearing capacity. This may be attributed to the effect of the bucket skirt on the soil mass at this buried depth. This is because the applied load and the excess pore pressure ratio are not large enough to initiate liquefaction in the foundation. Consequently, it can be ignored in the experiments. Figure 8c shows that as the buried depth reaches 0.45, the inhibiting effect is still remarkable, and the abnormal excess pore pressure ratio disappears under the load with 20% of the ultimate bearing capacity. Moreover, it is observed that the inhibiting effect and the load value still have a quasi-linear correlation. Figure 8m shows the excess pore pressure ratio when the buried exceeds twice the load foundation diameter. In this case, the inhibiting effect of load on soil is much weaker than that of the case with two times the foundation diameter, and the quasi-linear relation between the inhibiting effect and the load value no longer exists.
Figure 8 reveals the inhibiting effects at different positions depending on the horizontal distance and the buried depth. Figure 8d shows that as the load value increases, the development of excess pore pressure ratio of sand foundation at monitoring point #5 is rapidly inhibited. At 20% of the ultimate bearing capacity, there is an obvious accumulation and dissipation of excess pore pressure ratio. However, when the load value exceeds 30%, the excess pore pressure ratio develops constantly and the influence of the load value disappears.
Figure 8d also indicates that at monitoring point 5#, the development of excess pore pressure ratio is rapidly constrained with an increasing load value. At 20% of the ultimate bearing capacity, there is still noticeable development and dissipation of the excess pore pressure ratio. However, when the load value exceeds 30%, the excess pore pressure ratio becomes steady and the impact of load value is negligible. Furthermore, Figure 8e shows that at monitoring point 7#, as the horizontal distance increases, the load-induced inhibition effect on excess pore pressure ratio no longer exists, and the enhancement effect appears independent of the load value. Figure 8f shows that when both the buried depth and the horizontal distance increase, monitoring point #9 has significantly less inhibition on sand liquefaction than monitoring point #5. Moreover, under 20% of the ultimate bearing capacity, the inhibiting effects of monitoring points 3# and #9 are the same. The comparison of the results in Figure 8 shows that the impact of load on excess pore pressure ratio during liquefaction of sand foundation is consistent and the quasi-linear relation at monitoring points #9 and #3 is consistent. Nevertheless, the inhibition effects of load completely disappear at monitoring points #7 and #11, and the enhancement effect of load on excess pore pressure ratio approaches 1, reflecting drastic liquefaction and severe structural damage to soil mass under load. Figure 8h–j shows that as the buried depth and horizontal distance increase continuously, the inhibiting effect weakens, while the impact of load on the excess pore pressure ratio does not change significantly. Under these conditions, it is inferred that the inhibition effect of load on the liquefaction of sand foundation takes place. When the variation is within the range, the load can effectively inhibit the liquefaction of the sand foundation, while there is no such effect in the outside area. Additionally, an uncontrollable excess pore pressure ratio appears at these monitoring points under 20% of the ultimate bearing capacity. The comparison shows that in the no-influence boundary range, a load with a small value slightly decreases the excess pore pressure ratio during the vibration of the sand foundation, but then it becomes out of control. Figure 8k,l show that the distance between the monitoring point and the load center is more than twice the load diameter. It is observed that the inhibition effect of load on the excess pore pressure ratio of sand foundation completely disappears, and the quasi-linear relationship with an excess pore pressure ratio no longer exists.
Figure 8 reveals that there is a nonlinear correlation between the inhibition effect of load on the liquefaction of soil mass at different buried depths under earthquake and load. Meanwhile, there is a quasi-linear correlation between the soil mass buried directly below load and load, and the inhibition of soil mass in other lateral positions is positively correlated with the increase in the load value. Moreover, as the buried depth and horizontal distance from the load center increase, the corresponding inhibition effect decreases gradually, thereby enhancing the liquefaction effect. In the transition from the inhibition effect to the enhancement effect, there is a threshold where the load does not affect the liquefaction of the sand foundation.

4. Analysis of Excess Pore Pressure Ratio

According to discussions in the foregoing sections, load changes the excess pore pressure ratio of sand foundation under an earthquake. To analyze the load-induced inhibition range of liquefaction of sand foundation, excess pore pressure ratios of different monitoring points under different loads were compared with those under no load condition. To this end, variations in the excess pore pressure ratio under different loads are calculated and analyzed. In this regard, the liquefaction load constant Y is defined as follows:
Y = η l o a d η s e l f η s e l f
where η l o a d denotes the excess pore pressure ratio of soil at a specific buried depth exposed to seismic wave under load and η s e l f denotes the excess pore pressure ratio of soil mass at the buried depth exposed to seismic waves with no load condition (natural state). The liquefaction load constant is a parameter that describes the excess pore pressure ratio of soil mass at a specific buried depth under load. A positive indicates that the liquefaction resistance of soil mass is enhanced, while a negative indicates that the liquefaction resistance is degraded.
Figure 9 indicates that liquefaction load constants are positive at monitoring points #1, #2, #3, #5, #9, and #23, indicating enhanced liquefaction resistance in these parts. On the other hand, the liquefaction load constants are negative at monitoring points #7, #11, #13, #17, #19, and #22, indicating degraded liquefaction resistance in these parts. Meanwhile, the liquefaction load constant is zero at monitoring point #15, indicating that the liquefaction resistance does not change in this part. According to the liquefaction load constant, the load impact on sand foundation liquefaction resistance can be presented by the primary peak of vibration, which occurs 5 s after the start of loading. A three-dimensional meshing process was performed to obtain liquefaction load constants of the sand foundation at different monitoring points, buried depths, and horizontal distances from the load center, and a 3D model was obtained accordingly.
Figure 10 shows that the anti-liquefaction performance enhancement area is the internal area of the contour line, and the anti-liquefaction performance suppression area is the external area of the contour line. Contour lines indicate areas with no influence, and the outside area is the area highly prone to the liquefaction of sand foundation. The inhibition area of foundation liquefaction right below the load can reach a depth of 0.765 m, which is 2.55 times the load diameter. In the lower part of the load, the enhancement in liquefaction resistance of lateral soil mass increases significantly near the bucket skirt, reaching a depth of 0.71 m. The maximum and minimum range is 2.36 times and 1.33 times the load diameter, respectively. Moreover, it is found that liquefaction of sand foundation promotes in large areas of the outer region, indicating that the load inhibits sand liquefaction at the near end and facilitates sand liquefaction at the far end.
For the sustainable development of energy, clean and renewable energy has great energy advantages, but as a new energy industry, its corresponding safety, stability and durability greatly restrict the speed of its development. In this paper, by researching the range of the load-inhibiting liquefaction of sand foundations, and analyzing and comparing the excess of pore pressure and pore pressure ratios in sand foundations under earthquake action, the structural stability of offshore sand foundations after offshore wind power construction is revealed, and the range of the load-inhibiting liquefaction of sand is quantitatively evaluated, which effectively reveals the safety of offshore wind power after construction. This provides a design basis for the construction of offshore wind power in the future and, to a certain extent, promotes the rapid progress of offshore wind power technology as a new and sustainable energy technology.

5. Conclusions

In the present study, the impact of load on the inhibition range of liquefaction of saturated sand was investigated experimentally and numerically using shaking table tests and numerical simulations. Areas with changes in liquefaction resistance of saturated sand foundation during the earthquake were identified, and the liquefaction load constant was defined to explain the areas with liquefaction inhibition of sand foundation by the load. Based on the obtained results and performed analyses, the main conclusions can be summarized as follows:
(1)
For liquefaction of sand foundation under load, the excess pore pressure ratio changes differently for different buried depths and horizontal distances from the load center. There is a linear correlation between load and excess pore pressure ratio in the range within twice the load diameter right below the load.
(2)
The impact of load on the liquefaction of sand foundation is inhibition at the near end, while it significantly facilitates soil liquefaction at the far end.
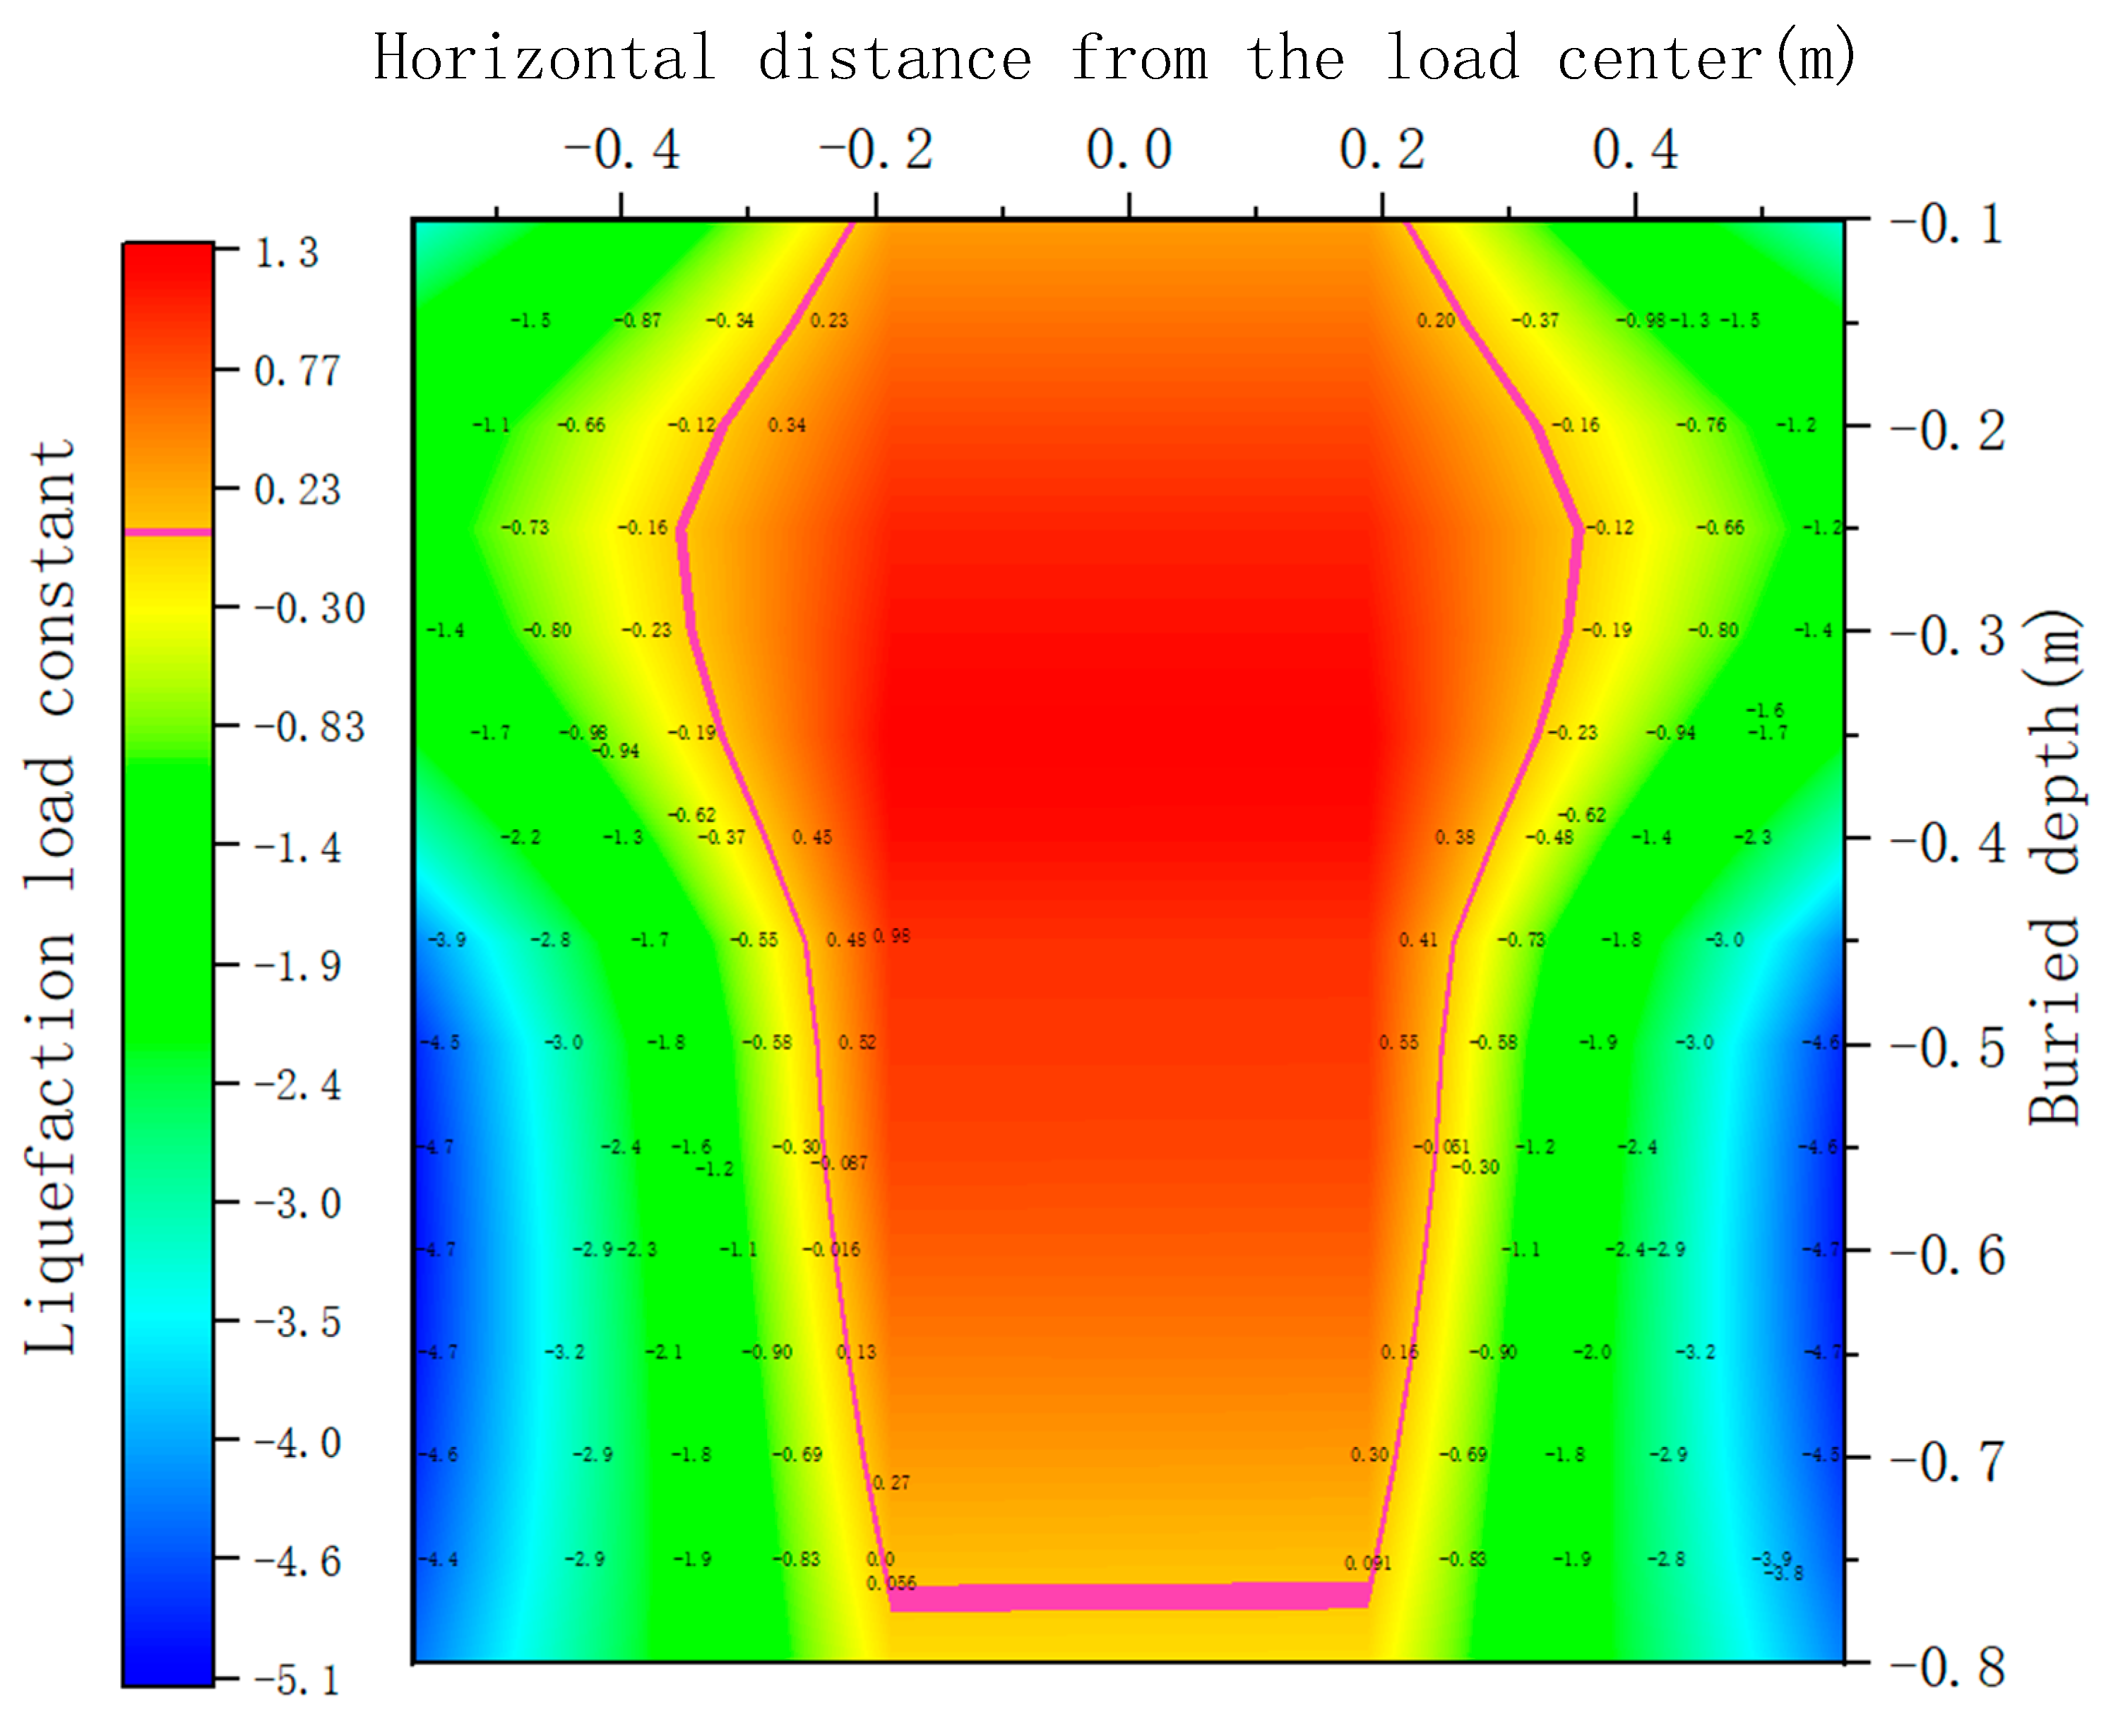
(3)
The quantitative calculation of the inhibition range based on the liquefaction load constant reveals that the inhibiting effect gradually converges with increasing buried depth and horizontal distance from the load center. The horizontal convergence rate is 1.08~1.92 times the vertical convergence rate. While the inhibition range expands near the load wall, the vertical inhibition range is 2.55 times the load diameter, and the lateral load wall end range is 2.36 times the load diameter.

Author Contributions

Conceptualization, X.W. and H.R.; methodology, X.W. and R.L.; software, H.R. and Y.J.; validation, R.L., H.R. and Z.L.; formal analysis, K.L.; investigation, X.W.; resources, K.L.; data curation, H.R.; writing—original draft preparation, L.D. and H.R.; writing—review and editing, R.L. and L.L.; visualization, Y.J.; supervision, Z.L.; project administration, X.W.; funding acquisition, X.W. All authors have read and agreed to the published version of the manuscript.

Funding

This research was funded by National Natural Science Foundation of China (U21A20164), the National Science Fund for Distinguished Young Scholars of China (51825904), National Natural Science Foundation of China (51708525).

Institutional Review Board Statement

Not applicable.

Informed Consent Statement

Not applicable.

Data Availability Statement

The data used to support the findings of this study are available from the corresponding author upon request.

Conflicts of Interest

The authors declare no conflict of interest.

References

  1. Jost, K.; Xydis, G. The offshore wind acceleration in the U.S. Atlantic Coast and the 30GW by 2030 offshore wind target. Proc. Inst. Civ. Eng. -Energy 2023. [Google Scholar] [CrossRef]
  2. Jåstad, E.O.; Bolkesjø, T.F. Offshore wind power market values in the North Sea—A probabilistic approach. Energy 2023, 267, 126594. [Google Scholar] [CrossRef]
  3. Joalland, O.; Mahieu, P.A. Developing large-scale offshore wind power programs: A choice experiment analysis in France. Ecol. Econ. 2023, 204, 107683. [Google Scholar] [CrossRef]
  4. Luo, D. Development status and countermeasures of offshore wind power in China. Hydropower New Energy 2022, 36, 76–78. (In Chinese) [Google Scholar]
  5. Assessment of the loading waveform on the cyclic liquefaction resistance with Hostun 31 sand. SDEE 2021, 150, 106919.
  6. Zeybek, A.; Eyin, M. Experimental study on liquefaction characteristics of saturated sands mixed with fly ash and tire crumb rubber. Sustainability 2023, 15, 2960. [Google Scholar] [CrossRef]
  7. Rani, C.S.; Ram Babu, T.S.; Donavalli, J. Analysis of liquefaction potential of soils in guntur region (CRDA). IOP Conf. Ser. Earth Environ. Sci. 2023, 1130, 012037. [Google Scholar] [CrossRef]
  8. Liam Finn, W.D.; Bransby, P.L.; Pickering, D.J. Effect of strain history on liquefaction of sand. J. Soil Mech. Found. Div. 1970, 96, 1917–1934. [Google Scholar] [CrossRef]
  9. Li, J. Comparative Study on Anti-Liquefaction Performance of Sand Foundation of Offshore Wind Turbine Single Cylinder Foundation and Composite Cylinder Foundation. Master’s Thesis, Tianjin University, Tianjin, China, 2020. (In Chinese). [Google Scholar]
  10. Wang, B.; Zen, K.; Chen, G.Q.; Zhang, Y.B.; Kasama, K. Excess pore pressure dissipation and solidification after liquefaction of saturated sand deposits. Soil Dyn. Earthq. Eng. 2013, 49, 157–164. [Google Scholar] [CrossRef]
  11. Ishihara, K.; Tatsuoka, F.; Yasuda, S. Undrained deformation and liquefaction of sand under cyclic stress. Soils Found. 1975, 15, 28–44. [Google Scholar] [CrossRef]
  12. Seed, H.B.; Lee, K.L. Liquefaction of saturated sands during cyclic loading. J. Soil Mech. Found. Div. 1966, 92, 105–134. [Google Scholar] [CrossRef]
  13. Xie, D.Y. Soil Dynamics; Higher Education Press: Beijing, China, 2011; pp. 188–193. (In Chinese) [Google Scholar]
  14. Xie, D.Y. Some problems on liquefaction of saturated sand. J. Geotech. Eng. 1992, 3, 90–98. (In Chinese) [Google Scholar]
  15. Zhang, J.; Wu, H.; Tang, W. Review of research on the characteristics of sand liquefaction under shaking table test. Sichuan Build. Mater. 2019, 45, 102–104. (In Chinese) [Google Scholar]
  16. Reddy, N.D.K.; Gupta, A.K.; Sahu, A.K. A novel soil liquefaction prediction model with intellectual feature extraction and classification. Adv. Eng. Softw. 2022, 173, 103233. [Google Scholar] [CrossRef]
  17. Zeybek, A.; Madabhushi, G.S.P. Assessment of soil parameters during post-liquefaction reconsolidation of loose sand. Soil Dyn. Earthq. Eng. 2023, 164, 107611. [Google Scholar] [CrossRef]
  18. Junichi, K.; Akira, O. Effects of different consolidation conditions on liquefaction resistance and small strain quasi-elastic deformation properties of sands containing fines. Soils Found. 2001, 41, 53–62. [Google Scholar]
  19. Frid, V.; Shulov, S. Acoustic emission induced by sand liquefaction during vibration loading. Sci. Rep. 2022, 12, 16881. [Google Scholar] [CrossRef]
  20. Zeng, C.N.; Liu, H.L.; Chen, Y.M. Test study on influence of fine particle content on dynamic pore water pressure development mode of silt. Rock Soil Mech. 2008, 29, 2193–2198. (In Chinese) [Google Scholar]
  21. Heng, C.Y.; He, M.C. Experimental study of liquefaction-resistant characteristics of clayey sand. J. Eng. Geol. 2001, 9, 339–345. (In Chinese) [Google Scholar]
  22. Xenaki, V.C.; Athanasopoulos, G.A. Liquefaction resistance of sand-silt mixtures: An experimental investigation of the effect of fines. Soil Dyn. Earthq. Eng. 2003, 23, 1–12. [Google Scholar] [CrossRef]
  23. Anderson, D.J.; Franke, K.W.; Kayen, R.E.; Dashti, S.; Badanagki, M. The over-prediction of seismically induced soil liquefaction during the 2016 Kumamoto, Japan earthquake sequence. Geosciences 2022, 13, 7. [Google Scholar] [CrossRef]
  24. Guo, Y.; He, L. The influences of the vibration frequencies on liquefaction strength of saturated sands. J. Disaster Prev. Mitig. Eng. 2009, 29, 618–623. (In Chinese) [Google Scholar]
  25. Guo, Y.; Luan, M.T.; He, Y.; Xu, C.S. Effect of variation of principal stress orientation during cyclic loading on undrained dynamic behavior of saturated loose sands. Chin. J. Geotech. Eng. 2005, 27, 403–409. (In Chinese) [Google Scholar]
  26. Shen, Y.; Zhang, P.J.; Yan, J.; Liu, H.L.; Zhang, C. Collapse characteristics and unified pore water pressure model of slightly-anisotropically consolidated dense silt under principal stress axis rotation. Rock Soil Mech. 2012, 33, 2561–2568. (In Chinese) [Google Scholar]
  27. Huang, M.; Bian, X.; Chen, Y.; Wang, R.; Gu, X.; Zhou, Y. Soil dynamics and geotechnical earthquake engineering. J. Civ. Eng. 2020, 53, 64–86. (In Chinese) [Google Scholar]
  28. Ishac, M.F.; Heidebrecht, A.C. Energy dissipation and seismic liquefaction in sands. Earthq. Eng. Struct. Dyn. 1982, 10, 59–68. [Google Scholar] [CrossRef]
  29. Mele, L.; Lirer, S.; Flora, A. Liquefaction triggering of non-saturated sandy soils. Géotechnique Lett. 2022, 13, 35–40. [Google Scholar] [CrossRef]
  30. Cai, Z. Study on Stability of Bucket Foundation of Offshore Wind Turbine. Master’s Thesis, Tianjin University, Tianjin, China, 2012. [Google Scholar]
  31. Pang, W. Structural Performance Analysis of Offshore Wind Power Generation. Master’s Thesis, Harbin Engineering University, Harbin, China, 2010. [Google Scholar]
  32. Liu, R.; Li, C.; Lian, J.; Ma, P. Centrifugal shaking table test on dynamic response of bucket foundation-sandy soil foundation. Geotech. Eng. 2020, 42, 817–826. (In Chinese) [Google Scholar]
  33. Li, J. Comparative Study on Liquefaction Resistance of Sand Foundation with Single and Composite Bucket Foundations for Offshore Wind Power. Master’s Thesis, Tianjin University, Tianjin, China, 2020. [Google Scholar]
  34. Ma, W. Research on the Mechanism and Law of Seismic Liquefaction of Saturated Fine Sand by Load Inhibition. Master’s Thesis, Hebei University of Engineering, Handan, China, 2022. [Google Scholar]
  35. El-Sekelly, W.; Dobry, R.; Abdoun, T. Assessment of state-of-practice use of field liquefaction charts at low and high overburden using centrifuge experiments. Eng. Geol. 2023, 312, 10692. [Google Scholar] [CrossRef]
  36. Nguyen, H.B.K.; Rahman, M.M.; Karim, M.R. An Investigation of instability on constant shear drained (CSD) path under the CSSM framework: A DEM study. Geosciences 2022, 12, 449. [Google Scholar] [CrossRef]
  37. Astutik, S.; Aprilina, A.N. The liquifaction modeling to analysis of soil structure composition. J. Phys. Conf. Ser. 2022, 2392, 012026. [Google Scholar] [CrossRef]
  38. Fang, H. Development and Performance Evaluation of Curtain Sand Rain Device for Centrifugal Test. Master’s Thesis, Institute of Engineering Mechanics, China Earthquake Administration, Harbin, China, 2019. [Google Scholar]
  39. Fang, H.; Duan, X.; Wang, Y.; Wang, H.; Yuan, X.; Wang, T. Research and prospect on the preparation technology of centrifugal model sand rain method. World Earthq. Eng. 2018, 34, 60–66. (In Chinese) [Google Scholar]
  40. Cheng, P.; Wang, Y.; Li, X.; Kong, L.; Wang, Y. Study on the influencing factors and uniformity of triaxial sand samples prepared by sand rain method. J. Yangtze River Acad. Sci. 2016, 33, 79–83+92. (In Chinese) [Google Scholar]
Figure 1. Gradation curve of standard Fujian sand.
Sustainability 15 07294 g001
Figure 2. Preparation of sand foundation using the sand rain method.
Sustainability 15 07294 g002
Figure 3. Saturation device.
Sustainability 15 07294 g003
Figure 4. Configuration of the laminated ring shear box.
Sustainability 15 07294 g004
Figure 5. Composite loading device.
Sustainability 15 07294 g005
Figure 6. Output waveform of the shaking table.
Sustainability 15 07294 g006
Figure 7. Layout of excess pore pressure sensors.
Sustainability 15 07294 g007
Figure 8. Excess pore pressure ratio of soil at different buried depths. (a) Monitoring point 1, (b) monitoring point 2, (c) monitoring point 3, (d) monitoring point 5, (e) monitoring point 7, (f) monitoring point 9, (g) monitoring point 11, (h) monitoring point 13, (i) monitoring point 17, (j) monitoring point 15, (k) monitoring point 19, (l) monitoring point 22, (m) monitoring point 23.
Sustainability 15 07294 g008aSustainability 15 07294 g008bSustainability 15 07294 g008c
Figure 9. Variations of excess pore pressure ratio under different loads.
Sustainability 15 07294 g009
Figure 10. Contour of calculation range of sand liquefaction under load inhibition.
Sustainability 15 07294 g010
Table 1. Physical parameters of standard Fujian sand.
Cohesion (kPa)Void RatioSaturated Density (kg·m−3)Dry Density (kg·m−3)Relative Density (%)Water Content (%)Internal Friction Angle (°)pH
00.7919201478520.23306.9
Table 2. Results of the bearing capacity of the test foundation.
Ultimate Bearing Capacity (kPa)Ultimate Bearing Capacity (kN)20% of the Ultimate Bearing Capacity (kN)30% of the Ultimate Bearing Capacity (kN)40% of the Ultimate Bearing Capacity (kN)50% of the Ultimate Bearing Capacity (kN)
159.5511.272.2543.3814.5085.635
Disclaimer/Publisher’s Note: The statements, opinions and data contained in all publications are solely those of the individual author(s) and contributor(s) and not of MDPI and/or the editor(s). MDPI and/or the editor(s) disclaim responsibility for any injury to people or property resulting from any ideas, methods, instructions or products referred to in the content.

