Article

Distribution Patterns and Driving Factors of the Phytoplankton Community in the Middle Reaches of the Yarlung Zangbo River

1
Center for Carbon Neutrality in the Earth’s Third Pole, Tibet University, Lhasa 850000, China
2
Laboratory of Wetland and Catchments Ecology in Tibetan Plateau, School of Ecology and Environment, Tibet University, Lhasa 850000, China
*
Author to whom correspondence should be addressed.
Sustainability 2023, 15(9), 7162; https://doi.org/10.3390/su15097162
Submission received: 13 March 2023 / Revised: 15 April 2023 / Accepted: 23 April 2023 / Published: 25 April 2023

Abstract

:
The middle reaches of the Yarlung Zangbo River are a hot zone of the Alpine Water System and its ecological environment is diverse but vulnerable. We systematically examined and detailed the phytoplankton community’s composition, spatial-temporal dynamics, and driving factors in this area. A total of 224 samples from 28 sampling sites across wet and dry seasons were analyzed. The results showed that: (1) the community structure of the main stream is more complex and stable than that of the tributaries; (2) the number of species, average cell abundance, and average biomass in the main stream were higher than those in the tributaries; (3) TN, TUR, WT, and pH were the main influencing factors for the difference in the phytoplankton community’s structure between the main stream and the tributaries; (4) the phytoplankton community had a closer structure, higher connectivity, stronger resistance to environmental disturbance, and higher stability in the main stream, while those in the tributaries had higher interspecific synergy; and (5) the phytoplankton community’s assembly process in the main stream was mainly influenced by random processes and was mainly driven by dispersal limitation in the middle reaches of the Yarlung Zangbo River.

1. Introduction

Phytoplankton belong to eukaryotic micro-organisms in water bodies which are composed of diatoms, cyanobacteria, green algae, naked algae, etc., and are important components of rivers and lakes [1,2,3,4]. As an important primary producer, it plays an important role in the material cycle and energy flow of the aquatic ecosystem. Its community characteristics can respond quickly to changes in water environmental quality [5,6,7] and directly to changes in nutrient level and are often used as indicator organisms and the basis for water quality assessments [8,9]. Therefore, the study of phytoplankton provides useful information for monitoring water quality [10,11] and important materials for exploring the origin and evolution of micro-organisms.
As the “third pole of the Earth”, the Qinghai–Tibet Plateau has attracted extensive attention from international scholars who study biological origins, evolution, flora, and migration because of its unique geographical climate [12]. The wide area of the Yarlung Zangbo River valley has a high average elevation, long sunshine time, and low temperature. It is the highest area in the biodiversity of the Qinghai–Tibet plateau, with a vulnerable ecological environment. The Yarlung Zangbo River has great significance in the study of the plateau’s climate and the ecological environment of its special geographical location. The study of phytoplankton distribution patterns in the middle reaches of the Yarlung Zangbo River plays an important part in the management of the whole basin’s aquatic ecosystem and the protection of its biodiversity. However, at present, studies on the phytoplankton community in the middle reaches of the Yarlung Zangbo River mainly focus on the major tributaries [13,14,15,16], and there are no reports on the distribution patterns of the phytoplankton community in the main stream and tributaries of the region.
In this study, we examined the phytoplankton species’ composition and community features in the Yarlung Zangbo River’s middle reaches, analyzed the drivers of the phytoplankton community’s building process, and explored the phytoplankton species’ diversity and ecology value. This study provides a scientific basis for the conservation of biodiversity and ecological research on the Qinghai–Tibet Plateau and the optimal management of the water ecosystem on the Qinghai–Tibet Plateau.

2. Materials and Methods

2.1. Survey of Study Area and Layout of Sampling Points

The Yarlung Zangbo River’s source is the Jama Yangzong Glacier at the northern foot of the Himalayas, and its basin is located between the Gangdise and Nianqing Tanggula Mountains and the Himalayan mountains [17]. It is the highest river in the world with the largest elevation difference. The ecological and geographical environments of different reaches are obviously different, and the total length of the river in China is 2057 km. The basin ranges from 28°00′ to 31°16′ north latitude and 82°00′ to 97°07′ east longitude [18], and the average altitude is over 3000 m.
The river is divided according to the topographic characteristics and climate types of the basin: Lazi-pai Town is in the middle reaches of the basin, with a length of about 1293 km and a basin area of 165,000 km2. The two banks of the river are dominated by floodplains, and the annual average precipitation ranges from 300 mm to 600 mm, with a plateau temperate semi-arid climate [19,20].
According to the layout principle of the surface water quality monitoring section and the natural environment state of the middle reaches of the Yarlung Zangbo River, a total of 28 sampling points were set up in the middle reaches of the Yarlung Zangbo River (Figure 1, Table 1, Supplementary Materials Figure S1, Table S1), including 11 sampling points of the main stream and 17 sampling points of the tributaries. The longitude and latitude of each sampling point were recorded by a GPS instrument. Phytoplankton samples were collected in July 2021 (wet season) and October 2021 (dry season), and the physicochemical factors of the water were measured.

2.2. Sample Collection and Processing

Phytoplankton samples were collected and identified according to the methods specified in the Freshwater Plankton Research Methods [21]. For the qualitative characterization, the samples were collected by plankton net with a pore size of 10 μm 0.5 m below the surface of the water body in a “∞” shape (8–10 min). The collected filtrate samples were stored in a 4% formaldehyde solution. The samples were pretreated in the room and sealed into thin slices. An OLYMPUS CKX53 inverted fluorescence microscope was used for species identification. Phytoplankton identification was based on classical literature [22,23,24]. For the quantitative characterization, a 1 L mixed water sample was collected from 0–0.5 m below the surface of the water body and immediately fixed with Luger’s reagent. The sample was brought back to the laboratory for precipitation for 48 h and concentrated to 50 mL. The 0.1 mL concentrated solution was then transferred to a 0.1 mL counting plate and the entire slide was counted at 10 × 40 magnification, with each sample counted 2–3 times. The phytoplankton abundance was converted into biomass (fresh weight) using an appropriate volume formula, and its specific gravity was assumed to be 1.0, that is, the biomass is the phytoplankton abundance multiplied by the average wet weight of the respective volume [25,26,27].
A HI98195 high-precision portable multi-parameter comprehensive water quality tester (HANNA, Woonsocket, Italy) was used for the determination of water pH (pH), conductivity (EC), salinity (Salt), water temperature (WT), and water velocity (V) using an FP-111 direct reading type current meter (Global Water, Phoenix, AZ, USA). The dissolved oxygen (DO) was measured by a HI98193 microcomputer dissolved oxygen tester (HANNA, Woonsocket, Italy), the ammonia nitrogen (NH3-N) was measured by salicylic acid spectrophotometry, and the turbidity (TUR) was measured by a HI98703 microcomputer multi-range turbidity tester (HANNA, Woonsocket, Italy); three parallel tests were carried out, respectively. Water samples were collected, stored, and transported in strict accordance with GB3838-2002 Quality Standards for Surface Water Environment, and sent to the qualified testing company for the determination of total phosphorus (TP), total nitrogen (TN), nitrate nitrogen (NO3-N), and dichromate index (COD).

2.3. Data Processing and Analysis

The main diversity indices were the Margalef richness index (d) [28], the Simpson dominance index (DS) [29], the Shannon–Wiener diversity index (H′) [30], and the Pielou Evenness index (J) [31]. These four indices were used to calculate phytoplankton biodiversity in the middle reaches of the Yarlung Zangbo River. The calculation formula is as follows:
d = S 1 ln N
D s = 1 i = 1 S ( P i ) 2
H = i = 1 S P i × ln P i
J = H / I n S
where S is the number of species at the sampling point; N is the cell abundance of all phytoplankton at the sampling site; and Pi is the proportion of individuals of type i.
The differences between the 12 water environmental factors in the main stream and tributaries of the middle reaches of the Yarlung Zangbo River were analyzed. Besides pH, the data were normalized to the logarithm and used for the t-test. The Wilcoxon rank-sum test was performed after calculating the α diversity index of phytoplankton communities in different reaches of the middle reaches of the Yarlung Zangbo River. Spearman’s correlation analysis was performed on the phytoplankton’s α diversity index and water environmental factors in the middle reaches of the Yarlung Zangbo River. A Mantel test analysis was conducted on the phytoplankton species (S), cell abundance (A), and biomass (B) in the middle reaches of the Yarlung Zangbo River with significant differences compared to water environmental factors. The neutral community model was used to predict the relationship between the occurrence frequency of the phytoplankton community and its cell abundance.
The ArcMap 10.8 software was used to draw maps, the Excel 2016 software was used to calculate phytoplankton species, cell abundance, and biomass, and the OriginPro 2019 software was used to map the community structure. The ggplot2 package in R software (version 3.4.2) was used to draw boxplots of water environmental factors. The α diversity index was calculated using R software. Principal Coordinate analysis (PCoA) and Similarity analysis (ANOSIM) were used to calculate the Bray–Curtis distance and draw the ranking map by using the package of R and ggplot2. The heatmap package of R software was used to draw the correlation heatmap. The Spearman correlation among phytoplankton was calculated by the Hmisc package of R software to construct the co-occurrence network, which was visualized in Gephi (version 0.9.2). The neutral community model was visualized using the minpack.lm package in R software.

3. Results

3.1. Difference Analysis of Water Environmental Factors in Different River Reaches

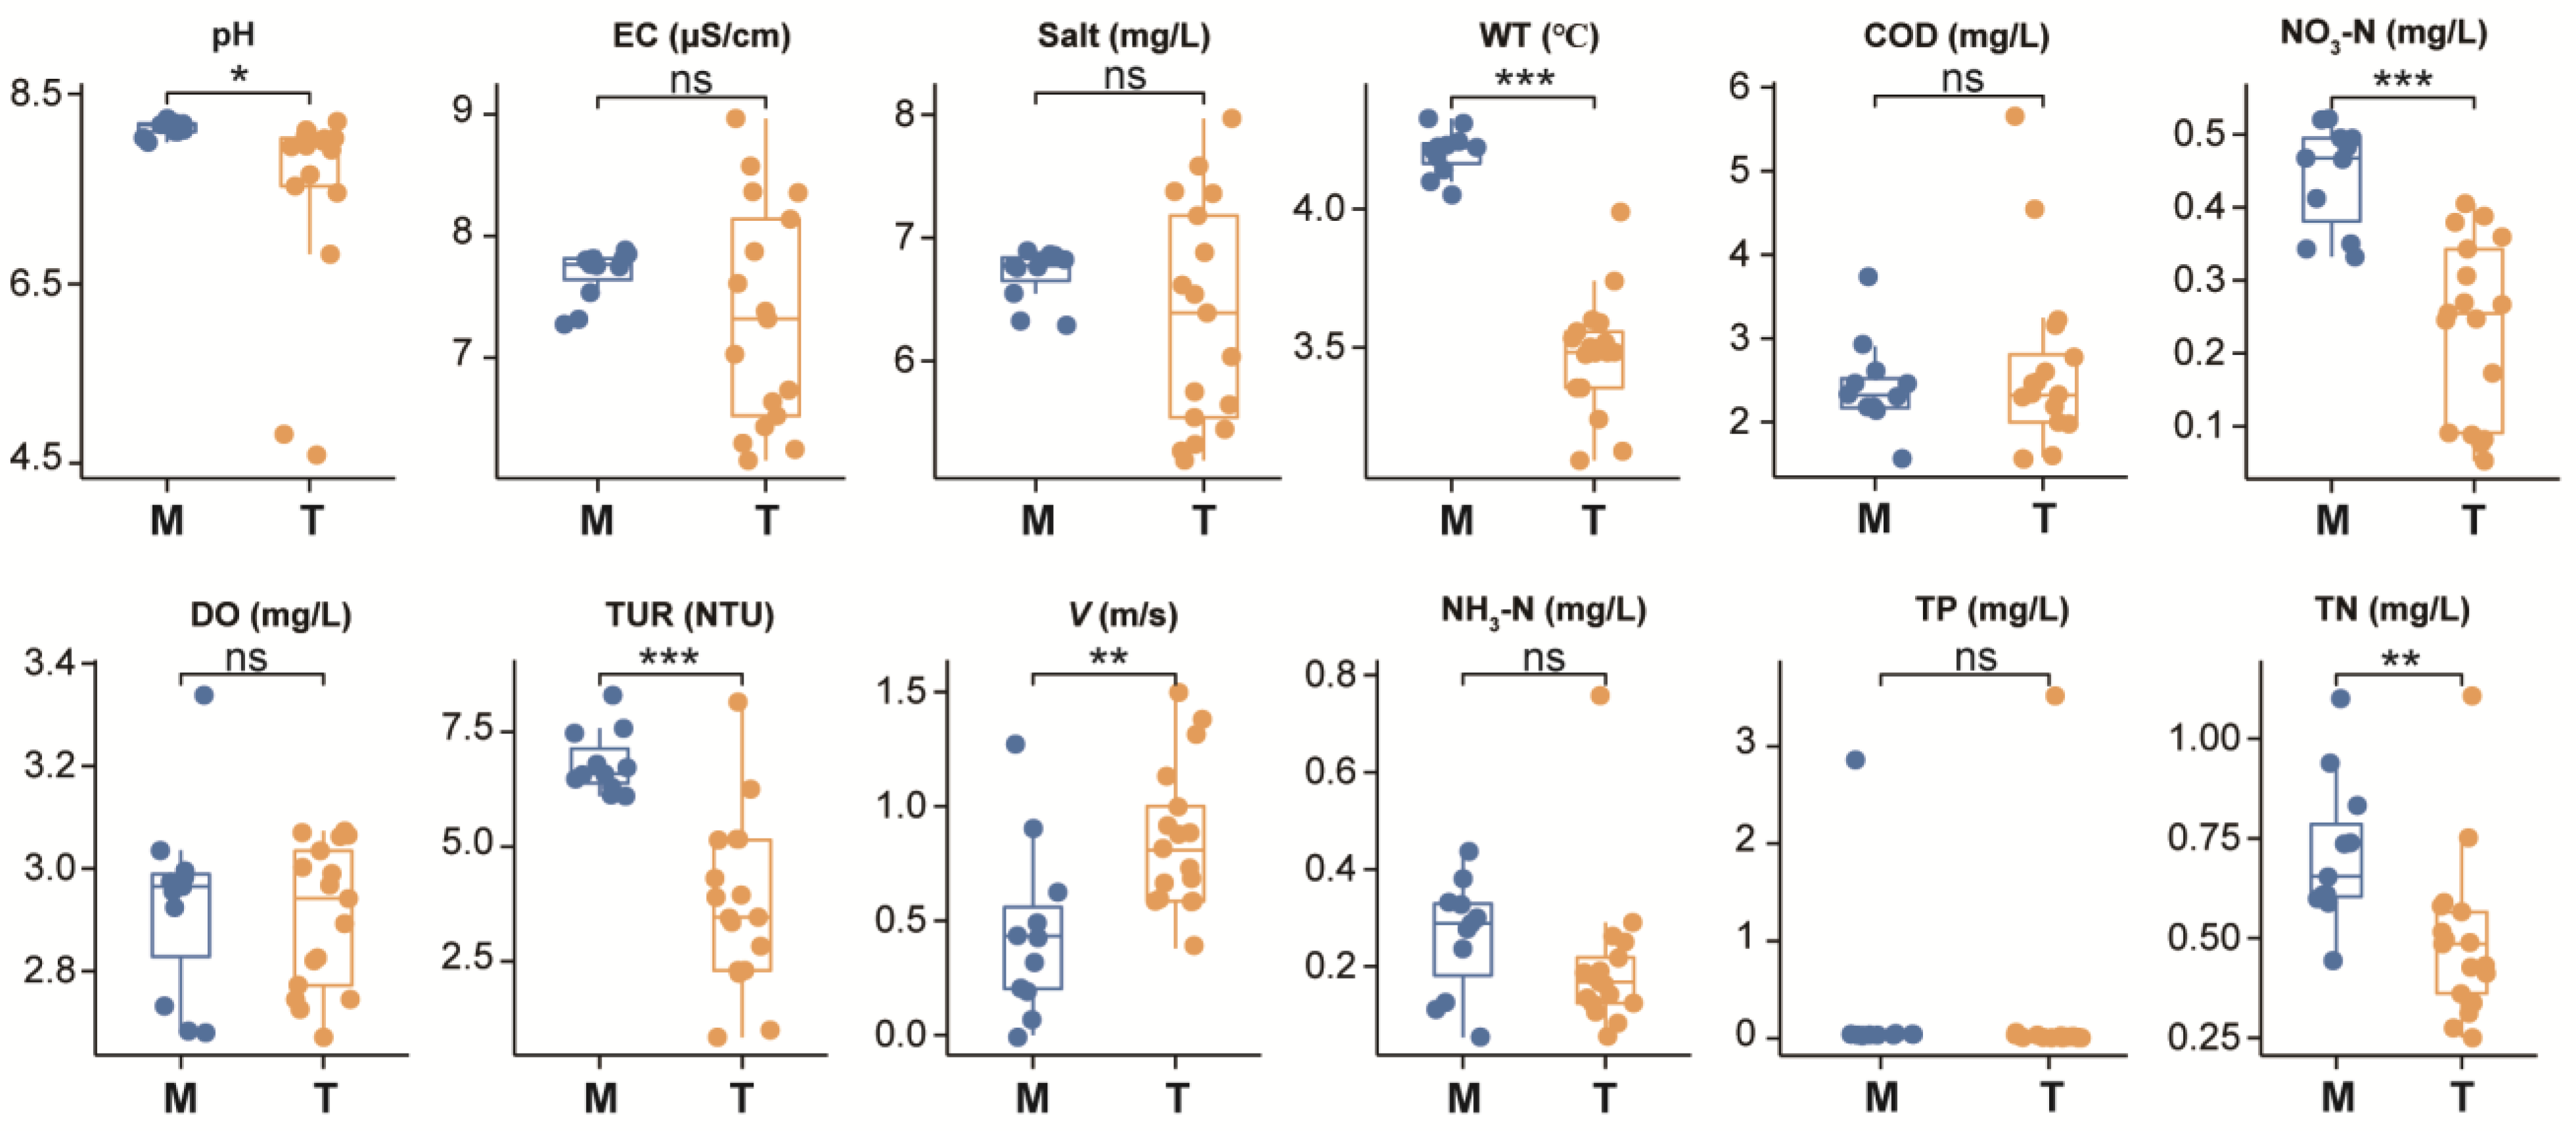
As shown in Figure 2, the pH of the main stream (8.31) was significantly higher than that of the tributaries (7.61). WT of the main stream (17.47 °C) was significantly higher than that of the tributary (10.25 °C). The NO3-N of the main stream (0.36 mg·L−1) was significantly higher than that of the tributary stream (0.18 mg·L−1). The TUR of the main stream (126.09 NTU) was significantly higher than that of the tributary (32.86 NTU). V of the main stream (0.41 m·s−1) was significantly lower than that of the tributary (0.86 m·s−1). TN in the main stream (0.65 mg·L−1) was significantly higher than that in the tributary stream (0.42 mg·L−1). Other water environmental factors, including EC, Salt, COD, DO, NH3-N, and TP, were not different in the main and tributary streams.

3.2. Spatio-Temporal Distribution Patterns of Phytoplankton Communities

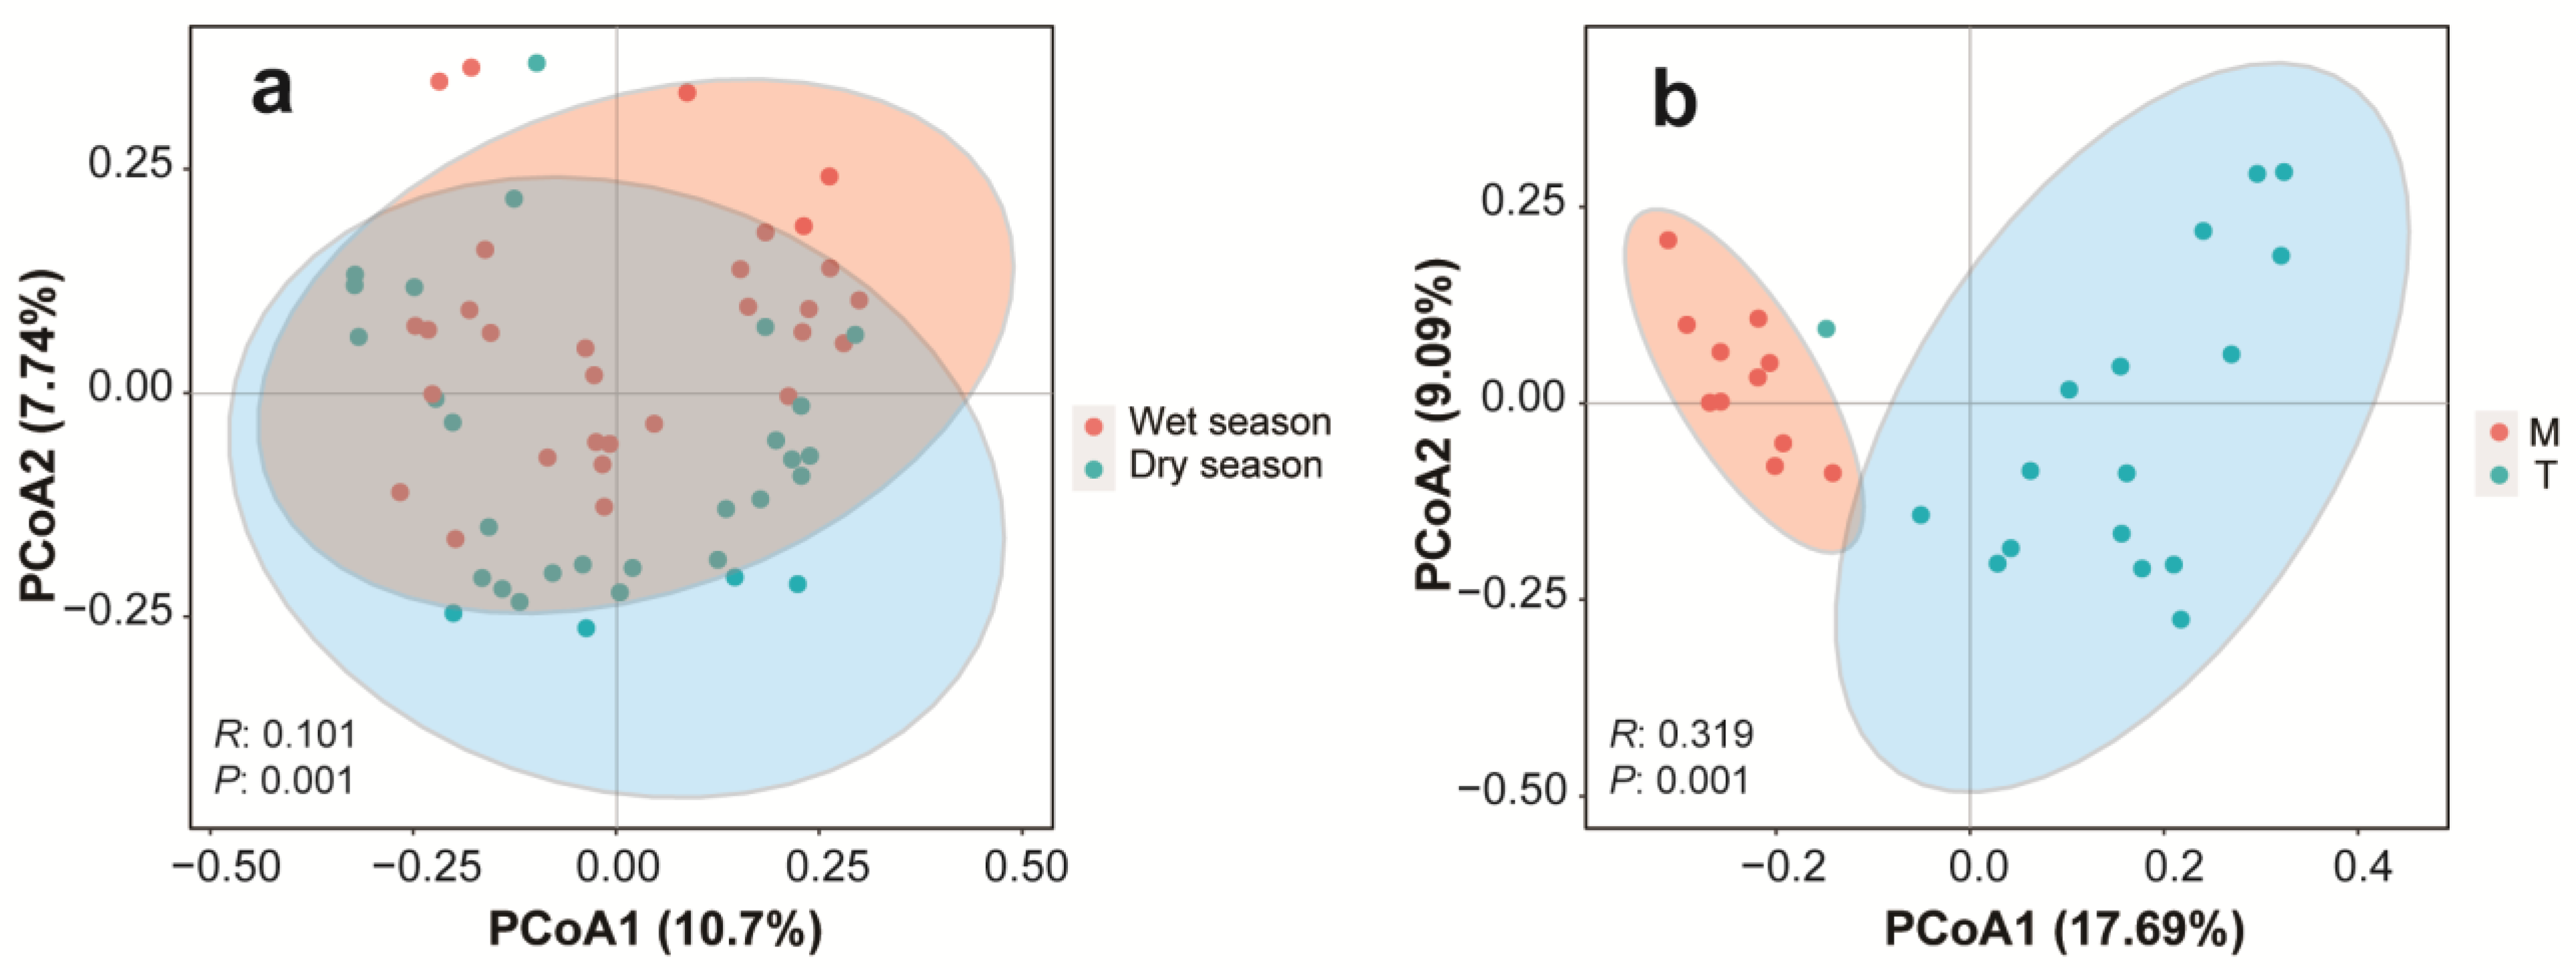
From the perspective of the two hydrological periods, the overlap degree of phytoplankton community clusters in the wet season and the dry season was high at the 95% confidence interval (Figure 3a), indicating the high similarity of phytoplankton communities between the wet and dry seasons. From the different river reaches, the phytoplankton communities in the tributaries and the main stream could be clearly separated, and there was only a small overlap area of phytoplankton community clusters in the 95% confidence interval (Figure 3b). The results of ANOSIM showed that the phytoplankton communities in the main stream and the tributaries were significantly different.

3.3. Differences in Alpha Diversity of Phytoplankton Communities

As shown in Figure 4, the Simpson dominance index of the main stream (0.94) was higher than that of the tributary stream (0.92), and there was no significant difference. The Shannon–Wiener diversity index in the main stream (3.89) was significantly higher than that in the tributary stream (3.46). The Margalef richness index of the main stream (8.16) was significantly higher than that of the branch stream (4.99). The Pielou evenness index of the main stream (0.83) was smaller than that of the tributaries (0.87), and there was no significant difference.

3.4. Characteristics of the Phytoplankton Community’s Structure

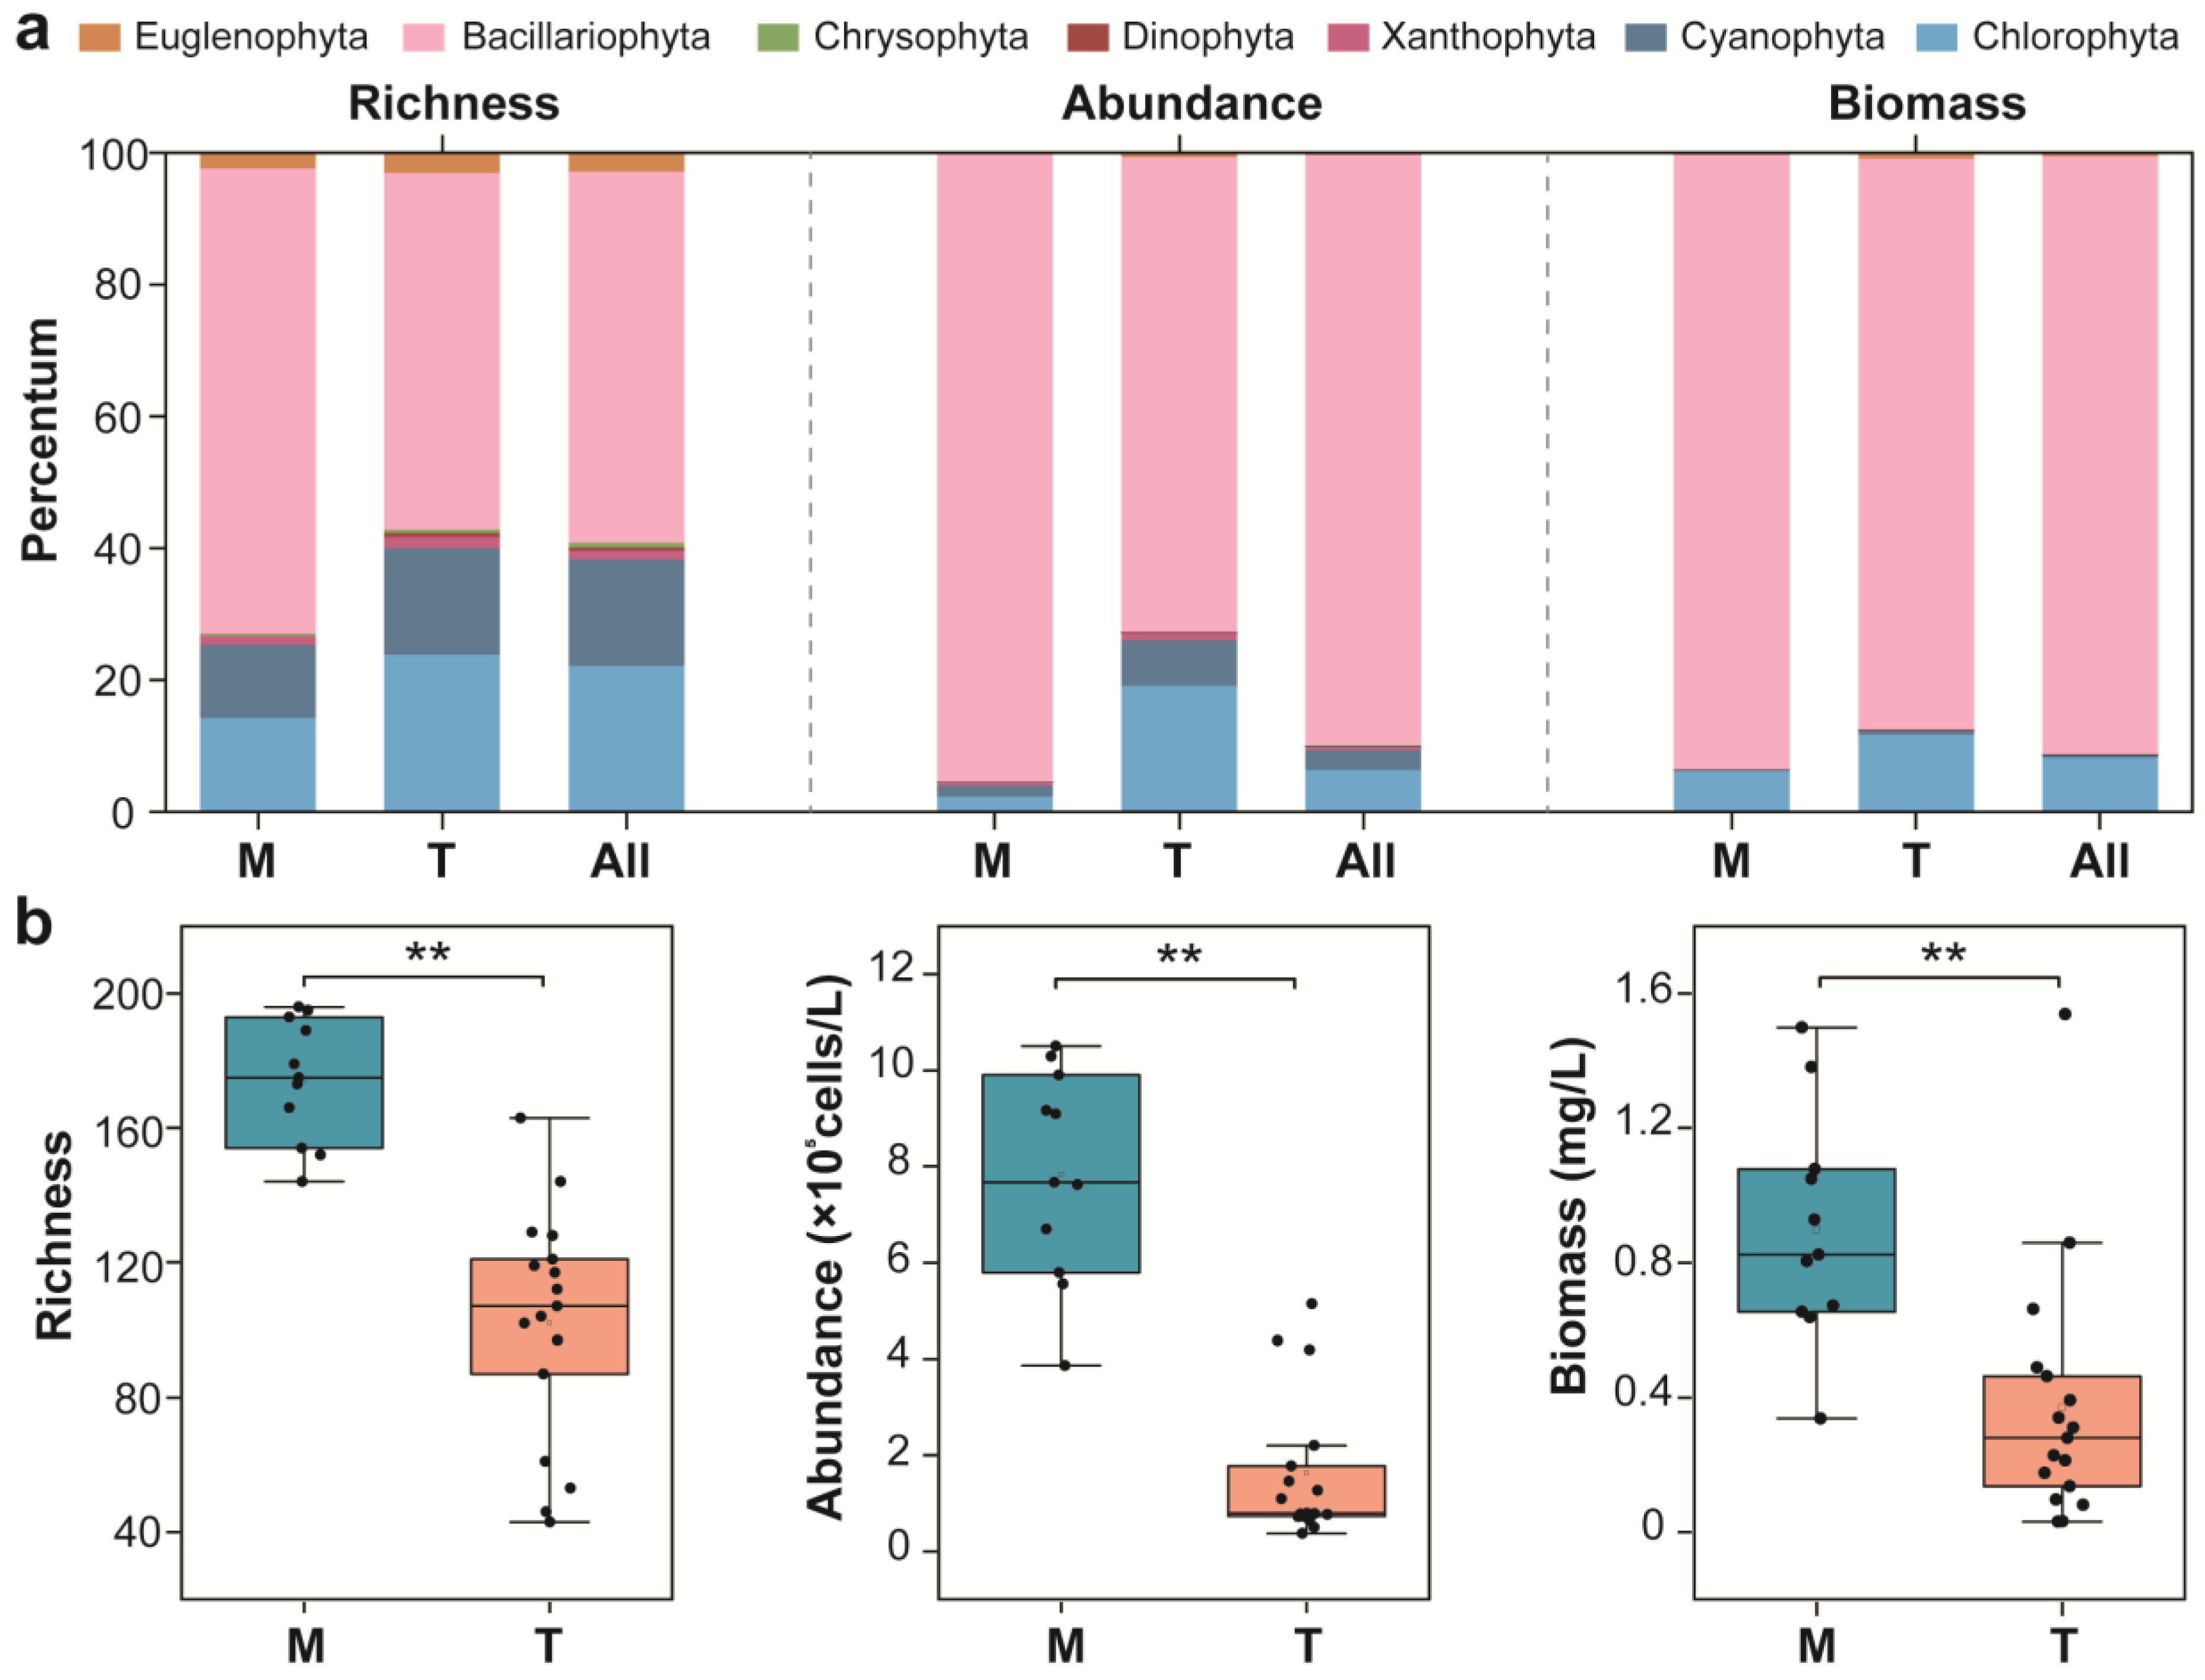
A total of 140 genera of phytoplankton were identified, belonging to 7 phyla, 11 classes, 24 orders, and 47 families, and the overall community characteristics were Bacillariophyta, Chlorophyta, and Cyanophyta (Figure 5a). A total of 99 genera of phytoplankton were identified in the main stream, belonging to 6 phyla, 8 classes, 20 orders, and 38 families. Bacillariophyta accounted for 70.67%, Chlorophyta 14.32%, Cyanophyta 11.09%, and other phyla 3.92%. A total of 123 genera of phytoplankton were identified in the tributaries, belonging to 7 phyla, 10 classes, 23 orders, and 46 families. Bacillariophyta accounted for 54.24%, Chlorophyta for 23.94%, Cyanophyta for 16.10%, and other phyla for 5.72%. The average cell abundance in the main stream of the middle of the Yarlung Zangbo River was 7.83 × 10⁵ cells·L−1 and was 1.62 × 10⁵ cells·L−1 in the tributaries. Bacillariophyta was dominant in the cell abundance in both main stream and tributaries, followed by Chlorophyta and Cyanophyta, and the percentage of other species was small. The average biomass of the main stream in the middle reaches of the Yarlung Zangbo River was 0.897 mg·L−1, and the average biomass of the tributaries was 0.372 mg·L−1. The biomass of diatoms was higher than that of other species in both the main stream and tributaries. The Wilcoxon rank-sum test was performed for phytoplankton community parameters in the main stream and tributaries (Figure 5b), and there were significant differences in species number, cell abundance, and biomass.

3.5. Co-Occurrence Network of the Phytoplankton Community

Phytoplankton species with an annual occurrence frequency greater than 0.1 were screened to analyze the co-occurrence network of the phytoplankton community (Figure 6). The topological parameters of the co-occurrence network were shown in Table 2. The average degree of the main stream (19.375) > tributaries (9.512) > All (5.722); the density of the main stream (0.060) > tributaries (0.029) > All (0.017). The modularity coefficient of the network of the main stream (1.145) > tributaries (0.661) > All (0.493). The average clustering coefficient of the main stream (0.377) < tributary (0.5527) < All (0.658). The average path length of the main stream (2.588) < tributary (3.869) < full reach (4.648).

3.6. Environmental Factors Drive Diversity and Composition of the Phytoplankton Community

As shown in Figure 7, there was no significant correlation between the α diversity index and water environmental factors in the main stream. The Tributary Simpson dominance index was negatively correlated with TUR, while the Pielou evenness index and the Shannon–Wiener diversity index were positively correlated with WT. From the whole reach, the Margalef richness index was significantly positively correlated with NO3-N, TN, TUR, WT, and pH, and negatively correlated with V. The Simpson dominance index and the Shannon–Wiener diversity index were positively correlated with pH. The Simpson dominance index was positively correlated with WT.
As shown in Figure 8, from the perspective of the main flow, the cell abundance was correlated with WT, TUR, and NO3-N, and the biomass was correlated with TUR. From the tributaries, NO3-N was negatively correlated with pH and V and positively correlated with TUR. There was no significant correlation between species number, cell abundance, biomass, and physicochemical indexes. In general, the number of species was significantly correlated with WT and NO3-N, and pH and TN. Cell abundance was significantly correlated with WT and NO3-N, and pH, TUR, V, and TN. Biomass was correlated with WT.

3.7. The Dispersal Limitation Effect on the Phytoplankton Community’s Assembly Processes

As shown in Figure 9, the occurrence frequency of the species was mostly within the 95% confidence interval of the neutral community model. The neutral community model successfully estimated most of the relationships between the occurrence frequency of phytoplankton species and changes in their cell abundance. There was a high interpretation rate (R2) in the main stream, tributaries, and the whole reach, indicating that the stochastic process had a strong driving effect on the phytoplankton community’s assembly in different habitats, and the interpretation rate of the main stream (0.843) > the whole reach (0.795) > the tributaries (0.756). Nm, the product of metacommunity size (N) and mobility (m), quantifies an estimate of dispersal between communities, determining the correlation between occurrence frequency and regional relative abundance. The Nm value of the phytoplankton community in the main stream (Nm = 148) > the whole reach (Nm = 65) > tributaries (Nm = 46), indicating that the driving force of diffusion restriction on phytoplankton community construction was higher in the main stream than in the tributaries.

4. Discussion

4.1. Phytoplankton Community Diversity and Its Driving Factors

In the middle reaches of the Yarlung Zangbo River, the Simpson dominance index, the Shannon–Wiener diversity index, and the Margalef richness index of the main stream were higher than those of the tributaries. The Shannon–Wiener diversity index and the Margalef richness index were statistically significantly different for the main stream and the tributaries, indicating that the phytoplankton community’s structure in the main stream was more complex and stable than that in the tributaries [32,33], which was consistent with the research results of Yangling Qiu et al. [34]. This may be due to the low flow rate of the main stream, which can provide a relatively stable living space for phytoplankton, and the species can fully optimize the resources. Compared with the main stream, the tributaries provide fewer resources and space for phytoplankton due to their high flow velocity and low runoff. The population size is affected by the intensification of interspecific and intraspecific competition, which causes the main stream to be relatively rich in species composition. The Spearman correlation coefficient results showed that the Margalef richness index was significantly positively correlated with NO3-N, TN, and WT, and significantly negatively correlated with V, indicating that the Margalef richness index was affected by multiple water environmental factors. When combined with the Mantel correlation analysis (Figure 8), these water environmental factors were significantly correlated with species number and cell abundance, which may be because nutrients such as NO3-N and TN can provide nitrogen for the metabolism of phytoplankton, and the increase in concentrations of NO3-N and TN in water can provide sufficient nutrients for phytoplankton. A higher WT enhances the absorption rate of nutrients by phytoplankton and promotes the propagation of the phytoplankton population. The Shannon–Wiener diversity index was significantly positively correlated with pH. Diatoms have strong adaptability in alkaline water environments, and the diatom species are the most abundant in this basin. The increase in pH in water may lead to the mass multiplication of diatoms, resulting in an increase in community diversity. The Simpson dominance index was extremely significantly positively correlated with WT. When combined with the Mantel correlation analysis, the water temperature was significantly correlated with species number and cell abundance, indicating that water temperature was the main water environmental factor indirectly affecting the dominant taxa in water.

4.2. The Characteristics and Driving Factors of the Phytoplankton Community’s Structure

The species composition, cell abundance, and biomass of the phytoplankton community in the middle reaches of the Yarlung Zangbo River were statistically analyzed. The diatom phyla were dominant. The Yarlung Zangbo River is a plateau river with an average altitude above 3000 m. The altitude gradient is negatively correlated with the water temperature of the river. The water temperature of the Yarlung Zangbo River is lower than that of the altitude region. WT was an important driving force of phytoplankton metabolism, including photosynthesis, nutrient absorption, cell division, and proliferation [35,36]. The average water temperature in the study area was low (13.08 °C). The results of the Mantel correlation analysis showed that the number of phytoplankton species, cell abundance, and biomass were significantly correlated with WT. Diatoms have strong adaptability to the environment of low water temperatures and alkaline environments, have a wide ecological range, and are more restricted to water environmental factors than other algae [37,38]. The previous study of the Lhasa River suggested that Bacillariophyta are closely related to the cell density and pH of the dominant species. As well as the Lhasa River [39], diatoms exhibit a greater percentage of cell abundance and biomass in the main stream of the Yarlung Zangbo River middle reaches. At the same time, the mean pH of the main stream (8.31) was significantly higher than that of the tributaries (7.61). The Mantel correlation analysis showed that the number of phytoplankton species and the average cell abundance were significantly correlated with pH, indicating that pH was also an important driving factor affecting the distribution of diatoms in the middle reaches of the Yarlung Zangbo River.
The average abundance of phytoplankton cells in the main stream was significantly higher than that in the tributaries. Studies have found that the flow velocity and size of the river discharge will affect the phytoplankton community’s structure [40]. The flow velocity of the main stream of the middle reaches of the Yarlung Zangbo River is lower than that of the tributaries, and the difference is significant. The main stream can provide a relatively stable living space for phytoplankton. Compared with the main stream, the tributaries provide fewer resources and space for phytoplankton due to their high flow velocity and low runoff. Therefore, the interspecific and intraspecific competition is intensified, and the cell abundance of species is affected accordingly. The phytoplankton community’s composition and species distribution are greatly affected by pH, which can directly affect the physiological and biochemical activities of phytoplankton itself, and can also act on algae together with other physical and chemical factors in water [41,42]. In this study, the mean pH of the main stream is greater than that of the tributaries. Cell abundance was significantly correlated with pH, indicating that pH was one of the influencing factors for the difference in phytoplankton cell abundance in the middle reaches of the Yarlung Zangbo River. Altitude can indirectly affect the river ecosystem by influencing environmental factors such as temperature, illumination, and precipitation in a region [43]. In the study area, the average altitude of the tributary (3650 m) is higher than that of the main stream (3133 m), and the river has a longer freezing period, so the water temperature is also lower than that of the main stream. In this study, the average phytoplankton biomass was higher than tributaries. The Mantel correlation analysis showed that phytoplankton biomass was significantly correlated with WT. These results indicated that altitude indirectly affected phytoplankton biomass in the middle reaches of the Yarlung Zangbo River by influencing water temperature, velocity, and nutrients. In general, the phytoplankton structure in the middle reaches of the Yarlung Zangbo River is affected by water temperature, velocity, pH, and other factors. The differences in geographical factors and water environment directly or indirectly drive the survival and reproduction of the phytoplankton community, forming the unique community structure characteristics of the main and tributaries of the middle reaches of the Yarlung Zangbo River.

4.3. Co-Occurrence Patterns and Driving Factors in Phytoplankton Communities

There are interactions among various organisms in the community, such as symbiosis, cooperation, competition, and predation, which determine the mode of biological coexistence [44]. The Microbial symbiosis model is an important tool to evaluate the function of microbial communities. It can reveal the potential interactions between micro-organisms [45] and is widely used to study the coexistence between micro-organisms in natural environments [46]. The results of community co-occurrence network analysis showed that the degree of association among phytoplankton in tributaries was greater than that in the main stream and much greater than that in the whole watershed, indicating that the community’s complexity of phytoplankton in tributaries was lower, and the interaction between phytoplankton was simpler or the niche overlap was lower. In this study, the tributaries had low nitrogen, phosphorus, and organic matter contents, resulting in a low nutrient concentration environment, which may be the main factor causing the simple phytoplankton community in the tributaries, while the main stream was relatively rich in nutrients, which may lead to more complex interactions, high niche overlap, and tight network structure. The network with higher connectivity responds more quickly to environmental disturbances [47,48,49]. The connectivity of the phytoplankton community in the main stream is higher than that of tributaries (Figure 6), indicating that the phytoplankton community in the main stream is more stable, and responds more quickly to environmental disturbances. In the co-occurrence network, the positive and negative correlations of edges between two nodes represent the reciprocal and competitive relationship between connected species, respectively. The positive correlations between network nodes (Figure 6) suggest a synergistic relationship between species, and organisms from the same group often have antagonistic effects due to the competition for resources [50,51]. The positive correlation ratio of tributaries was higher than that in the main stream, suggesting a higher synergistic effect of the phytoplankton community in the tributaries, which dominated the phytoplankton community. It may be due to the high altitude, high velocity, and low water temperature of the tributaries, and the synergistic effect among species was stronger than the competition effect in the more extreme habitats.
According to the analysis of the neutral community model, there was a high R2 matter in the main stream, tributaries, or the whole river reach. R2 represents the reproducibility of fit in the neutral community model. The value of R2 in the neutral model indicated the stochastic (more) or deterministic (less) process affected community construction [52]. The results (Figure 9) showed that the stochastic processes played important roles in the formation of phytoplankton community assembly in the main stream of the middle reaches of the Yarlung Zangbo River, especially in the main stream. Nm is used for estimating the dispersal between communities and determining the correlation between occurrence frequency and regional relative abundance [53]. The Nm value was highest in the main stream, followed by that in the whole reach, and lowest in tributaries, indicating that the construction of the phytoplankton community in the main stream was mainly driven by diffusion restriction. There were more co-occurrence relationships among species in the main stream phytoplankton community, indicating that the balance between species selection and dispersal mediated the coexistence of species in the phytoplankton community.

5. Conclusions

This study investigated the biogeographic dynamics of the phytoplankton community in the middle reaches of the Yarlung Zangbo River. The results show that the Shannon–Wiener diversity index and the Margalef richness index of the main stream were higher than those of the tributaries. The community structure of the main stream was more complex and stable than that of the tributaries. Total nitrogen, turbidity, water temperature, and pH were the main environmental factors affecting the diversity of the phytoplankton community. The average cell abundance and biomass of phytoplankton in the main stream were higher than those in the tributaries. Water temperature, pH, turbidity, and velocity were the main influencing factors for the difference in phytoplankton community structure between the main stream and tributaries. The phytoplankton community in the main stream had a close structure, high connectivity, more rapid response to environmental disturbance, and higher stability. The interspecific synergism of the phytoplankton community in the tributaries was higher than that in the main stream. The random process played a greater role in the phytoplankton community’s construction in the main stream than in the tributaries, and the phytoplankton community’s construction process in the main stream was mainly driven by diffusion restriction.

Supplementary Materials

The following supporting information can be downloaded at: https://www.mdpi.com/article/10.3390/su15097162/s1, Figure S1: Habitat information from 28 sampling sites in the middle reaches of Yarlung Zangbo River; Table S1: Habitat information of sampling sites in the middle reaches of the Yarlung Zangbo River; Table S2: Characteristics of water environmental factors in the middle reaches of Yarlung Zangbo River; Table S3: List of phytoplankton in the middle Yarlung Zangbo River.

Author Contributions

Conceptualization, Q.Y. and S.Y.; methodology, S.B.; software, S.B.; validation, P.Z., Q.Y. and H.L.; formal analysis, X.C.; investigation, X.L.; resources, S.B.; data curation, X.L.; writing—original draft preparation, X.L.; writing—review and editing, S.B.; visualization, H.L.; supervision, X.L.; project administration, S.B.; funding acquisition, S.B. All authors have read and agreed to the published version of the manuscript.

Funding

This work was supported by the National Natural Science Foundation of China (32070418) and the 2021 Special Funds for the Basic Research and Development Program in the Central Nonprofit Research Institutes of China (Tibetan Finance, Science and Education Guidance [2021] No. 1).

Institutional Review Board Statement

Not applicable.

Informed Consent Statement

Not applicable.

Data Availability Statement

Not applicable.

Conflicts of Interest

The authors declare no conflict of interest.

References

  1. Salmaso, N.; Naselli, F.L.; Padisák, J. Impairing the largest and most productive forest on our planet: How do human activities impact phytoplankton. Hydrobiologia 2012, 698, 375–384. [Google Scholar] [CrossRef]
  2. Ishida, K.N. Seasonal distribution of photosynthetically active phytoplankton using pulse amplitude modulated fluorometry in the large monomictic Lake Biwa, Japan. J. Plankton Res. 2008, 30, 1169–1177. [Google Scholar]
  3. Jiang, Y.; Xu, H.L.; Zhu, M.Z. Use of planktonic protists for assessing water quality in Jiaozhou Bay, northern China. Protistology 2012, 7, 34–41. [Google Scholar]
  4. Filker, S.; Sommaruga, R.; Vila, I.; Stoeck, T. Microbial eukaryote plankton communities of high-mountain lakes from three continents exhibit strong biogeographic patterns. Mol. Ecol. 2016, 25, 2286–2301. [Google Scholar] [CrossRef]
  5. Jia, H.Y.; Xu, J.F.; Lei, J.S. Relationship of community structure of phytoplankton and environmental factors in Danjiangkou Reservoir bay. Yangtze River 2019, 50, 52–58. [Google Scholar]
  6. Torremorell, A.; Llames, M.E.; Pérez, G.L.; Escaray, R.; Bustingorry, J.; Zagarese, H. Annual patterns of phytoplankton density and primary production in a large, shallow lake: The central role of light. Freshw. Biol. 2009, 54, 437–449. [Google Scholar] [CrossRef]
  7. Shen, W.F. Planktonic Algal Science; Science Press: Beijing, China, 1999. [Google Scholar]
  8. Guo, K.; Wu, N.C.; Wang, C.; Yang, D.G.; He, Y.F.; Luo, J.B.; Chai, Y.; Duan, M.; Huang, X.F.; Riis, T. Trait dependent roles of environmental factors, spatial processes and grazing pressure on lake phytoplankton metacommunity. Ecol. Indic. 2019, 103, 312–320. [Google Scholar] [CrossRef]
  9. Cheng, R.; Chen, H.X.; Qi, C.; Hou, F.; Cao, X.X.; Zheng, X.; Zeng, F.G.; Li, Z.H. Characteristics of plankton community structure in Shahe Reservoir of the North Canal. Acta Sci. Circumstantiae 2021, 41, 239–246. [Google Scholar]
  10. Yang, M.; Zhang, S.; Liu, S.R. Phytoplankton community structure and water quality assessment in Jialing River after the impoundment of Caojie Reservoir. Environ. Sci. 2015, 36, 2480–2486. [Google Scholar]
  11. Xu, Z.; Chen, X.H.; Shen, G.X.; Zhu, Y.; Qian, X.Y.; Zhang, X.L.; Zhang, W.; Hu, S.Q.; Bai, Y.J. Spatial and Temporal Variation of Phytoplankton Community Structure and Its Influencing Factors in Shanghai River Channels. Environ. Sci. 2020, 41, 3621–3628. [Google Scholar]
  12. Zhong, X.H.; Liu, S.Z.; Wang, X.D.; Zhu, W.Z.; Li, X.M.; Yang, L. A Research on the Protection and Construction of the State Ecological Safe Shelter Zone on the Tibet Plateau. J. Mt. Sci. 2006, 24, 129–136. [Google Scholar]
  13. Jun, S.; Wang, D.B.; Zhou, J.H.; Bai, X.Y.; Bai, K. Community structures of phytoplankton and its relationship with environmental factors in the Lhasa River. Acta Ecol. Sin. 2019, 39, 787–798. [Google Scholar]
  14. Ba, S.; Yang, X.L.; Huang, X.; Gui, Q. Phytoplankton community characteristics and water quality evaluation in the lower reaches of Lhasa River in spring and summer. Res. Plateau Sci. 2017, 1, 25–38. [Google Scholar]
  15. Liu, H.P.; Ye, S.W.; Yang, X.F.; Zhang, L.S.; Zhong, G.H.; Li, Z.J. Spatial-temporal dynamics of aquatic organism community and their relationships to environment in Niyang River, Tibet: 1. Phytoplankton. J. Lake Sci. 2013, 25, 695–706. [Google Scholar]
  16. Pei, G.F.; Cao, J.X.; Liu, G.X. Diversity of phytoplankton community in different reaches of Niyang River. Resour. Environ. Yangtze Basin 2012, 21, 24–29. [Google Scholar]
  17. Zhang, R.; Xu, Z.X.; Liu, X.W.; Liu, J.T.; Bai, J.R. Spatiotemporal Characteristics of Land Use/Cover Change for the Yarlung Zangbo River Basin from 1980 to 2015. China Rural. Water Hydropower 2019, 3, 106–111. [Google Scholar]
  18. Guan, Z.H.; Chen, C.Y. Tibetan Rivers and Lakes; Science Press: Beijing, China, 1984. [Google Scholar]
  19. Wang, S.; Wang, S.S.; Fan, F.L. Change patterns of NDVl (1985–2018) in the Yarlung Zangbo River Basin of China based on time series segmentation algorithm. Acta Ecol. Sin. 2020, 40, 6863–6871. [Google Scholar]
  20. Liu, H.; Li, X.Y.; Yao, Z.Y. Rainfall erosivity in Yarlung Zangbo River Basin during 1961–2015. J. Desert Res. 2019, 39, 166–176. [Google Scholar]
  21. Zhang, Z.S.; Huang, X.F. Research Methods of Freshwater Plankton; Science Press: Beijing, China, 1991. [Google Scholar]
  22. Chi, N.W. Atlas of Bacillariophyta in Tibet; Tibet People’s Publishing House: Lhasa, China, 1990. [Google Scholar]
  23. Zhu, H.Z.; Chen, J.Y. Diatoms of Tibet, China; Science Press: Beijing, China, 2000. [Google Scholar]
  24. Hu, H.J.; Wei, Y.X. The Freshwater Algae of China—Systematics, Taxonomy and Ecology; Science Press: Beijing, China, 2006. [Google Scholar]
  25. Sun, J.; Liu, D.Y. Geometric models for calculating cell biovolume and surface area for phytoplankton. J. Plankton Res. 2003, 25, 1331–1346. [Google Scholar] [CrossRef]
  26. Hillebrand, H.; Dürselen, C.D.; Kirschtel, D.; Pollingher, U.; Zohary, T. Biovolume calculation for pelagic and benthic microalgae. J. Phycol. 1999, 35, 403–424. [Google Scholar] [CrossRef]
  27. Kremer, C.T.; Gillette, J.P.; Rudstam, L.G.; Brettum, P.; Ptacnik, R. A compendium of cell and natural unit biovolumes for >1200 freshwater phytoplankton species. Ecology 2014, 95, 2984. [Google Scholar] [CrossRef]
  28. Margalef, R. Perspectives in ecological theory. Oikos 1969, 20, 571. [Google Scholar] [CrossRef]
  29. Simpson, E.H. Measurement of Diversity. Nature 1949, 163, 688. [Google Scholar] [CrossRef]
  30. Shannon, C.E.; Weaver, W.; Wiener, N. The mathematical theory of communication. Phys. Today 1950, 3, 31–32. [Google Scholar] [CrossRef]
  31. Pielou, E.C. The measurement of diversity in different types of biological collections. J. Theor. Biol. 1966, 13, 131–144. [Google Scholar] [CrossRef]
  32. Li, Y.R.; Ma, J.; Qiu, X.C. Species Diversity of Phytoplankton Community in the Lakes in Ningxia Taiyangshan National Wetland Park. Wetl. Sci. 2021, 19, 375–383. [Google Scholar]
  33. Tang, Y.; Zheng, Y.H.; Liu, J.H.; Fu, M.; Wu, R.H.; Feng, X.W. Analysis on community structure and diversity of phytoplankton in the middle and lower reaches of the Hengjiang River in spring. Freshw. Fish. 2016, 46, 51–58. [Google Scholar]
  34. Qiu, Y.L.; Lin, Y.Q.; Liu, J.J.; Tang, L.; Guan, T.S.; Chen, Q.W.; Chen, K.; Wang, L. The biodiversity assessment of phytoplankton community in summer within main stream and tributary of Huaihe River. Acta Sci. Circumstantiae 2018, 38, 1665–1672. [Google Scholar]
  35. Yan, G.H.; Yin, X.Y.; Wang, X.; Wang, L.Q.; Li, Y.J.; Li, H.; Chen, W. Effects of environmental factors on phytoplankton community composition in the three mouths of the Yangtze River and west Dongting Lake. China Environ. Sci. 2019, 39, 2532–2540. [Google Scholar]
  36. Li, J.L.; Zheng, B.H.; Liu, L.S.; Tang, J.L. Phytoplankton Community Structure in the Yangtze River Estuary and Its Relation to Environmental Factors. Res. Environ. Sci. 2013, 26, 403–409. [Google Scholar]
  37. Mi, W.M.; Shi, J.Q.; Yang, Y.J.; Yang, S.Q.; He, S.H.; Wu, Z.X. Changes in epilithic algae community and its relationship with environmental factors in the Meixi River, a tributary of the Three Gorges Reservoir. Environ. Sci. 2020, 41, 1636–1647. [Google Scholar]
  38. Li, Y.M.; Zhao, Q.; Feng, G.P.; Liu, H.M.; Wang, Y.F. The diatom assemblages and their response to different environments of Baiyangdian Lake, China. Acta Ecol. Sin. 2010, 30, 4559–4570. [Google Scholar]
  39. Wei, J.W.; Li, H.R.; Wang, X.Z.; Qi, W.H.; Wang, Y.; Zhao, B.J.; Tan, X.; Zhang, Q.F. Structure Characteristics and Driving Variables of Epilithic Algae Community in Lhasa River Basin of Qinghai-Tibet Plateau. Environ. Sci. 2021, 42, 1879–1888. [Google Scholar]
  40. Myrstener, M.; Rocher-Ros, G.; Burrows, R.M.; Bergström, A.-K.; Giesler, R.; Sponseller, R.A. Persistent nitrogen limitation of stream biofilm communities along climate gradients in the Arctic. Glob. Chang. Biol. 2018, 24, 3680–3691. [Google Scholar] [CrossRef]
  41. Wang, X.; Liu, L.S.; Li, L.; Zhou, J.; Wang, Y.; Xia, F.; Xia, Y. Correlation analysis of algae composition and environmental factors in Jingpo Lake. China Environ. Sci. 2015, 35, 3403–3413. [Google Scholar]
  42. Schneider, S.C.; Kahlert, M.; Kelly, M.G. Interactions between pH and nutrients on benthic algae in streams and consequences for ecological status assessment and species richness patterns. Sci. Total Environ. 2013, 444, 73–84. [Google Scholar] [CrossRef]
  43. Tonkin, J.D.; Shah, R.D.T.; Shah, D.N.; Hoppeler, F.; Jähnig, S.C.; Pauls, S.U. Metacommunity structuring in Himalayan streams over large elevational gradients: The role of dispersal routes and niche characteristics. J. Biogeogr. 2017, 44, 62–74. [Google Scholar] [CrossRef]
  44. Liu, L.M.; Chen, H.H.; Liu, M.; Yang, J.R.; Xiao, P.; Wilkinson, D.M.; Yang, J. Response of the eukaryotic plankton community to the cyanobacterial biomass cycle over 6 years in two subtropical reservoirs. ISME J. 2019, 13, 2196–2208. [Google Scholar] [CrossRef]
  45. Morris, L.A.; Voolstra, C.R.; Quigley, K.M.; Bourne, D.G.; Bay, L.K. Nutrient availability and metabolism affect the stability of coral-Symbiodiniaceae symbioses. Trends Microbiol. 2019, 27, 678–689. [Google Scholar] [CrossRef]
  46. Proulx, S.R.; Promislow, D.E.L.; Phillips, P.C. Network thinking in ecology and evolution. Trends Ecol. Evol. 2005, 20, 345–353. [Google Scholar] [CrossRef]
  47. Deng, Y.; Jiang, Y.H.; Yang, Y.F.; He, Z.L.; Luo, F.; Zhou, J.Z. Molecular ecological network analyses. BMC Bioinform. 2012, 13, 113. [Google Scholar] [CrossRef]
  48. Zhou, J.Z.; Deng, Y.; Luo, F.; He, Z.L.; Tu, Q.C.; Zhi, X.Y. Functional molecular ecological networks. mBio 2010, 1, e00169-10. [Google Scholar] [CrossRef]
  49. Zhang, B.G.; Zhang, J.; Liu, Y.; Shi, P.; Wei, G.H. Co-occurrence patterns of soybean rhizosphere microbiome at a continental scale. Soil Biol. Biochem. 2018, 118, 178–186. [Google Scholar] [CrossRef]
  50. Yang, Q.; Zhang, P.; An, R.Z.; Qiao, N.Q.; Da, Z.; Sang, B. Spatial and temporal distribution patterns and driving mechanisms of ciliate communities in the midstream and downstream reaches of the Lhasa River. Biodivers. Sci. 2022, 30, 136–150. [Google Scholar] [CrossRef]
  51. Selbmann, L.; Egidi, E.; Isola, D.; Onofri, S.; Zucconi, L.; de Hoog, G.S.; Chinaglia, S.; Testa, L.; Tosi, S.; Balestrazzi, A.; et al. Biodiversity, evolution and adaptation of fungi in extreme environments. Plant Biosyst. 2013, 147, 237–246. [Google Scholar] [CrossRef]
  52. Chen, W.D.; Ren, K.X.; Isabwe, A.; Chen, H.H.; Liu, M.; Yang, J. Correction to: Stochastic processes shape microeukaryotic community assembly in a subtropical river across wet and dry seasons. Microbiome 2019, 7, 148. [Google Scholar] [CrossRef]
  53. Sloan, W.T.; Lunn, M.; Woodcock, S.; Head, I.M.; Nee, S.; Curtis, T.P. Quantifying the roles of immigration and chance in shaping prokaryote community structure. Environ. Microbiol. 2006, 8, 732–740. [Google Scholar] [CrossRef]
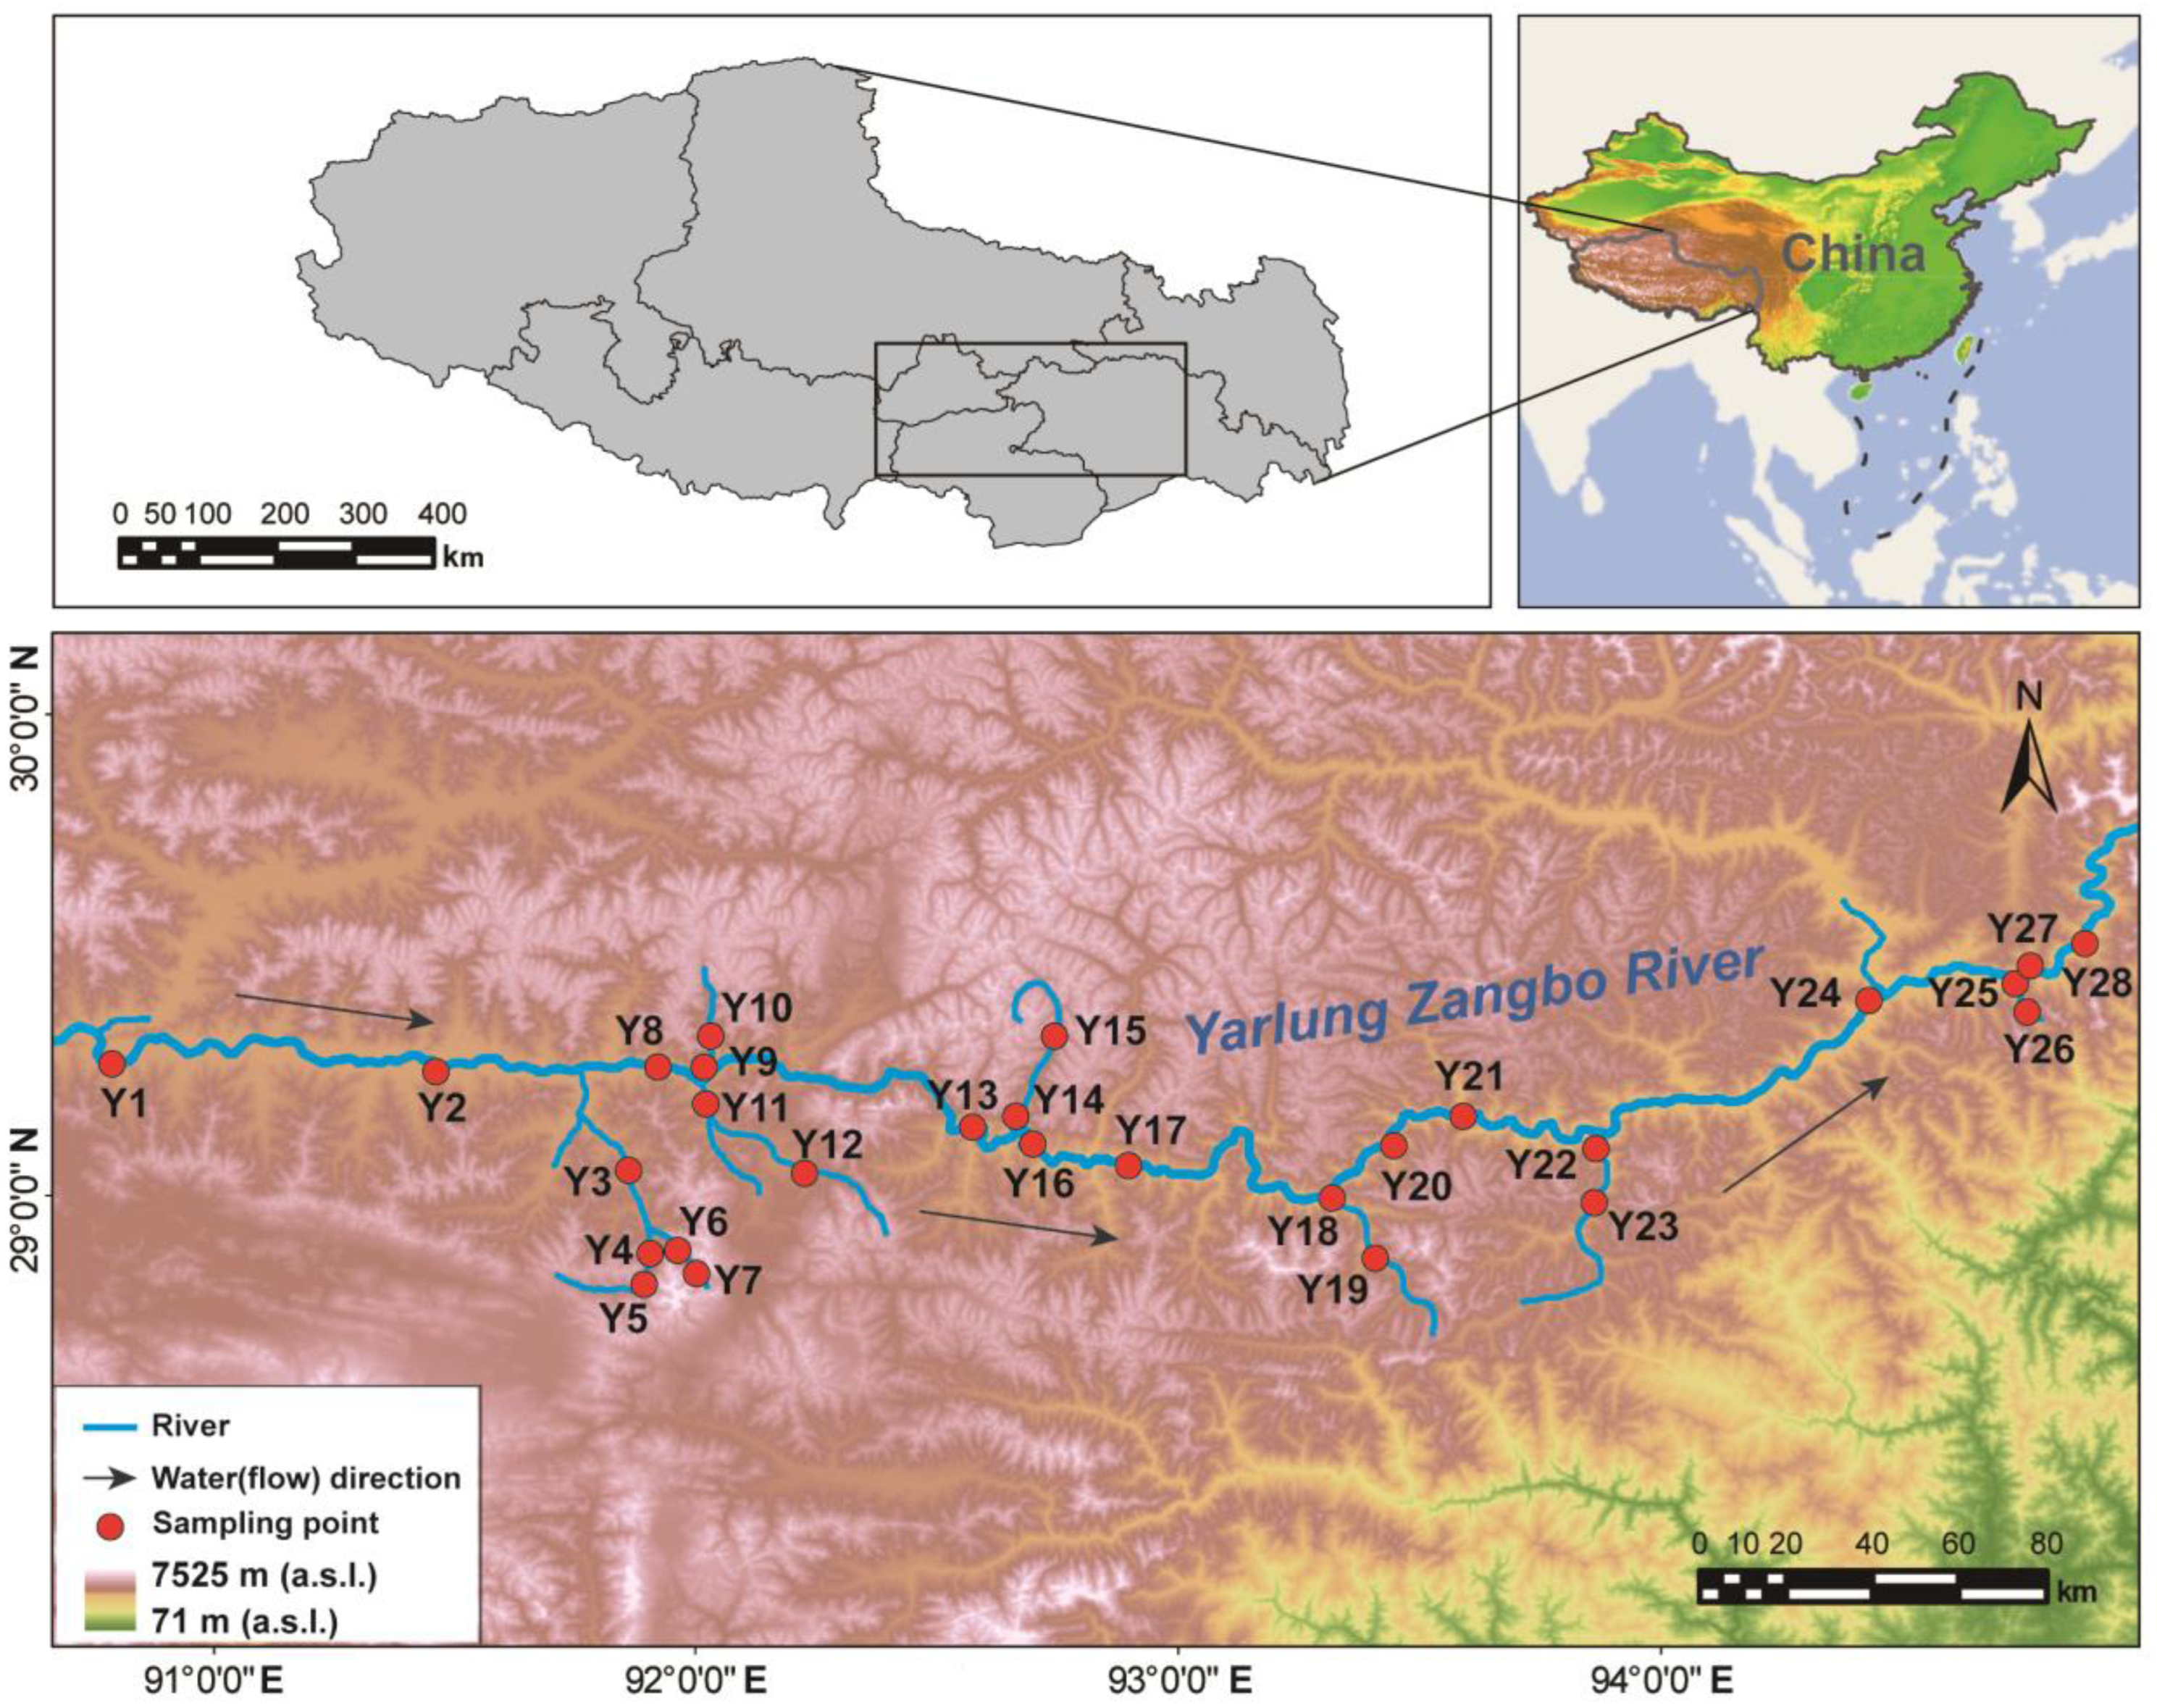
Figure 1. The setting of sampling points in the middle reaches of the Yarlung Zangbo River.
Sustainability 15 07162 g001
Figure 2. Difference analysis of water environmental factors in different reaches of the Yarlung Zangbo River (* p < 0.05; ** p < 0.01; *** p < 0.001, t-test). (M) main stream. (T) tributary.
Sustainability 15 07162 g002
Figure 3. Similarity analysis of the phytoplankton community in the middle reaches of the Yarlung Zangbo River. (a) Similarity of phytoplankton communities in different hydrological periods. (b) Similarity of phytoplankton communities in different river reaches. (M) main stream. (T) tributary.
Sustainability 15 07162 g003
Figure 4. Diversity index of the phytoplankton community in different reaches of the middle reaches of the Yarlung Zangbo River (** p < 0.01; *** p < 0.001, Wilcoxon rank-sum test). (M) main stream. (T) tributary.
Sustainability 15 07162 g004
Figure 5. Phytoplankton community structure in different reaches of the middle reaches of the Yarlung Zangbo River. (a) Species composition, cell abundance, and percentage of biomass of phytoplankton in different river reaches. (b) Differences in phytoplankton species composition, cell abundance, and biomass in different river segments (** p < 0.01, Wilcoxon rank-sum test). (M) main stream. (T) tributary. (All) the whole basin of the river.
Sustainability 15 07162 g005
Figure 6. Species co-occurrence network of the phytoplankton community in different reaches of the middle reaches of the Yarlung Zangbo River (the node represents species and the size represents annual occurrence frequency). (M) main stream. (T) tributary. (All) the whole basin of the river.
Sustainability 15 07162 g006
Figure 7. Correlation analysis between the phytoplankton community’s diversity index and water environmental factors in the middle reaches of the Yarlung Zangbo River (* p < 0.05; ** p < 0.01, Spearman). (M) main stream. (T) tributary. (All) the whole basin of the river.
Sustainability 15 07162 g007
Figure 8. Mantel test analysis between the phytoplankton community’s characteristics and water environmental factors in the middle reaches of the Yarlung Zangbo River (* p < 0.05; ** p < 0.01; *** p < 0.001, Spearman). (M) main stream. (T) tributary. (All) the whole basin of the river.
Sustainability 15 07162 g008
Figure 9. Neutral phytoplankton community model in different reaches of the middle reaches of the Yarlung Zangbo River. (M) main stream. (T) tributary. (All) the whole basin of the river.
Sustainability 15 07162 g009
Table 1. Information on sampling points in the middle reaches of the Yarlung Zangbo River.
NumberTypeLongitudeLatitudeAltitude (m)Depth of Water (cm)Velocity of Flow (m/s)
Y1main stream90°47′26.88″29°16′35.76″3537.058.00.1
Y2main stream91°27′47.16″29°15′46.08″3527.070.00.4
Y3tributary91°51′42.48″29°3′25.56″3714.069.00.7
Y4tributary91°54′29.52″28°52′57.36″4113.041.00.6
Y5tributary91°53′37.68″28°49′14.16″4505.055.01.1
Y6tributary91°57′5.04″28°53′30.12″4221.037.01.7
Y7tributary92°0′12.96″28°50′33.36″4740.039.00.4
Y8main stream91°55′21″29°16′15.96″3510.030.00.2
Y9tributary92°1′25.68″29°11′38.04″3571.045.00.6
Y10tributary92°13′41.88″29°3′4.32″3880.036.01.3
Y11tributary92°1′13.8″29°15′26.64″3513.025.00.4
Y12tributary92°2′37.32″29°20′11.04″3752.034.00.7
Y13main stream92°34′29.28″29°8′52.08″3166.047.01.9
Y14tributary92°40′0.84″29°10′2.64″3369.060.01.9
Y15tributary92°44′47.76″29°20′4.2″4137.070.00.5
Y16main stream92°42′7.92″29°6′36.36″3116.050.00.2
Y17main stream92°53′52.44″29°3′57.24″3076.070.00.6
Y18tributary93°19′15.96″28°59′57.12″3012.041.01.6
Y19tributary93°24′36″28°52′33.24″3479.037.01.0
Y20main stream93°26′54.96″29°6′23.76″2945.050.00.7
Y21main stream93°35′40.92″29°10′5.16″2934.050.00.1
Y22tributary93°52′10.92″29°6′3.6″2956.040.01.0
Y23tributary93°51′54.72″28°59′18.24″3203.050.03.1
Y24main stream94°26′4.56″29°24′33.48″2896.050.00.1
Y25tributary94°43′32.52″29°26′36.96″2914.045.01.2
Y26tributary94°44′24″29°25′13.08″2986.040.00.7
Y27main stream94°44′41.28″29°27′19.8″2886.040.00.2
Y28main stream94°52′53.76″29°31′32.88″2874.043.00.1
Table 2. Topological characteristics of the phytoplankton community’s co-occurrence network.
ParameterMain StreamTributaryAll
Number of nodes323324345
The number of connections31291541987
Average degree19.3759.5125.722
Average weighting degree6.5488.2046.383
Proportion of positive correlation (%)69.9397.6699.7
Proportion of negative correlation (%)30.072.340.30
The density of figure0.060.0290.017
Coefficient of modularity1.1450.6610.493
Average clustering coefficient0.3770.5270.658
Average path length2.5883.8694.648
Disclaimer/Publisher’s Note: The statements, opinions and data contained in all publications are solely those of the individual author(s) and contributor(s) and not of MDPI and/or the editor(s). MDPI and/or the editor(s) disclaim responsibility for any injury to people or property resulting from any ideas, methods, instructions or products referred to in the content.