Abstract
The continuous accumulation of tailings in tailings reservoirs not only causes environmental pollution but may also cause geological disasters. The paste-filling mining method is an effective way to address the accumulation of tailings, and it is necessary to study the flow characteristics of the pipeline transportation process—a core process of this method. However, limited by factors such as test conditions, equipment, and cost, the research in this field mainly focuses on the flow performance of conveying materials and the influence of single conveying conditions on the resistance of filling pipelines. The pipeline transportation of paste is a systematic project, and its pipeline transportation characteristics are not only determined by the characteristics of the slurry itself but also related to the geometric characteristics of the pipeline. In this study, an orthogonal test and numerical simulation were used to study the influence of five parameters—i.e., the filling gradient, the curvature radius of the elbow, the inner diameter of the pipeline, the paste flow rate, and the paste concentration—on pipeline transportation characteristics, and they were sorted according to their levels of influence. The results show that, during the pipeline transportation process, the slurry concentration has the greatest influence on the resistance loss and the maximum wall shear stress of the pipeline, and the slurry flow rate has the greatest influence on the maximum flow rate at the elbow. The numerical simulation results were compared and analyzed using rheological theory. The maximum difference rate was 11%, and the average difference rate was 6%. Numerical simulation results indicate that the pipe wall near the outer diameter side of the inlet section and the center of the elbow section wears easily during the paste-conveying process. The results enrich the theory of paste pipeline transportation, improve the understanding of the influence of various parameters on paste transportation characteristics, and provide a reference for paste pipeline design.
1. Introduction
In traditional mining methods (open-field method, caving method, etc.), a special tailings pond accumulation concentrator needs to be built for discharged tailings from the surface subsidence above the mined-out area [1,2,3]. Excessive accumulation of tailings will not only cause serious damage to the ecological environment around the tailings reservoir but may also cause debris flow and dam breaking of the tailings reservoir [4,5]. Compared with other mining methods, the backfill mining method can effectively solve the environmental problems caused by goaf collapse and the accumulation of tailings [6]. In the backfill mining method, a cementing agent and water are used to convert the tailings discharged from the concentrator into a backfill slurry to fill the goaf formed by mining activities [7]. After condensation, the backfill slurry forms a solid structure with a certain strength in the goaf, effectively limiting the deformation of the goaf [8,9]. This not only reduces the stock of tailings in the tailings pond but also prevents the surface subsidence caused by the deformation of the goaf and, to a certain extent, alleviates the pressure on the environment caused by human mining activities [10].
Pipeline transportation is the main way to transport the filling slurry from the surface to the goaf. A safe, stable, and efficient operation is the premise for the normal production of a mine. For this reason, some scholars have focused on the problem of pipeline transportation in mines around the world and explained in detail the necessity of studying this problem [11]. When investigating the composite filling material, the rheological properties of the material have been studied in depth [12,13]. Some scholars have found that the rheological behavior of the filling slurry is related to the evolution of its mesoscopic structure [14,15], and the evolution process of slurry’s microstructure under shear action has been investigated using environmental electron scanning microscopy (ESEM) and computer image processing [16,17]. Some studies have shown that the solid particles in the filling slurry undergo shear-induced migration under the action of shear stress [18,19].
When filling slurry is being transported from the ground to the goaf, the pipeline transportation resistance is the main factor influencing the transportation state of the filling slurry [20]. The mechanism and law of filling pipeline transportation resistance have become a topic of focus in filling mining research. According to M. Mooney and other scholars, during pipeline transportation, there is wall-slip behavior [21,22,23], which greatly reduces the resistance that the paste faces during transportation [24]. Chen et al. studied the influence of paste concentration, total tailings content, and other factors on pipeline transportation resistance using L-tube tests and loop tests [25,26,27].
Due to the complexity of the filling slurry flowing in the pipeline, according to the results of existing research, the transportation parameters are mainly determined using the following three methods:
- On the basis of a large number of field test data, and combined with the corresponding fluid mechanics theory, the empirical formula of transportation resistance is obtained through the combination of practical experience and theoretical derivation. Then, the transportation parameters are determined using the empirical formula.
- On the basis of the Bingham model, the transportation parameters are determined by rheological theory and experiments.
- With the semi-industrial loop pipe test of slurry transportation carried out, the transportation parameters are determined through calculation and analysis of the test results.
However, considering the diverse mine conditions, the complex theoretical calculations, and the costly semi-industrial tests, the above three methods for determining pipe flow transportation parameters have certain limitations. The emergence of computational fluid dynamics has solved the above limitations to a certain extent [28]. Today, with the continuous updating and development of computational fluid dynamics software, it has become common to use this software to simulate the flow process of filling slurry in pipelines for studying the law of slurry pipeline transportation [29]. FLUENT is used to identify the part of the pipeline that will easily wear during the paste transportation process [30,31], the flow effects of different cementitious slurry materials in the transportation pipeline [32], and the transportation state of the slurry in the elbow [33]. Cheng et al. used COMSOL Multiphysics to study the rheological properties and wall-slip characteristics of waste rock–tailings cemented paste during pipeline transportation [34] and established a paste–pipeline resistance calculation model with time and temperature effects [35]. Chen et al. studied the optimization of pipeline transportation parameters by combining the L-tube test and the numerical simulation of two-phase flow [36].
The research results of the scholars above show that the characteristics of the transported slurry, such as rheological properties and slurry concentration, are crucial for determining the pipeline transportation parameters. However, in the filling mining method, the pipeline transportation process of the slurry is a systematic project. The transportation characteristics of the pipeline are determined not only by the characteristics of the transported slurry, but also by the geometric state of the filling pipeline (e.g., filling gradient, elbow curvature radius, inner diameter of the pipeline), slurry transportation speed, and other factors. Therefore, in this paper, computational fluid dynamics software is used to simulate the transportation of filling slurry in a pipeline. The orthogonal test principle is used to comprehensively analyze the influence of five parameters—i.e., the filling gradient, the curvature radius of the bend pipe, the inner diameter of the pipe, the paste flow rate, and the paste concentration—on the resistance loss along the pipeline, the maximum wall shear stress of the pipeline, and the maximum flow rate at the bend pipe during the pipeline transportation process. The results of the numerical simulation are verified and analyzed using the theoretical calculation method, and the optimal transportation scheme is obtained according to the numerical simulation results, providing a theoretical reference for the design of a mine’s paste-filling pipeline.
2. Materials and Methods
2.1. Project Overview
Huangjindong Mine is an old mine with 100 years of mining history. The vein is of good quality and high value. At present, it has a comprehensive production capacity of 2000 t/d. However, the upward-stratified dry-filling method used in the actual mining has safety, economic, and technical problems—for example, high resource loss rate and low production efficiency, and the fact that the tailings storage capacity will soon be exhausted. In view of these problems faced by the mine, the authority of the coal mine decided to replace dry filling with unclassified tailings-paste backfill. The improved filling process is shown in Figure 1. A slurry pump pumps the low-concentration tailings discharged from the beneficiation plant to the thickener, where the tailings are flocculated with a flocculant. The high-concentration full-tailed mortar obtained after flocculation sedimentation and the cementation powder stored in the cementitious material warehouse are properly mixed in the mixing barrel to prepare a qualified paste-filling slurry, which is transported to the underground goaf through the pipeline.
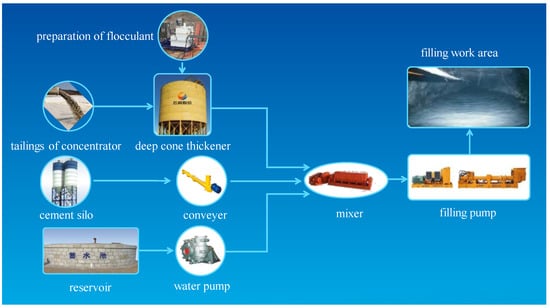
Figure 1.
The entire tailings paste-filling process flow.
2.2. Materials
The low-concentration (25–30%) full tailings slurry used in this test was taken from the Huangjindong concentrator, as shown in Figure 2. Laboratory tests helped to determine the physical properties and the chemical composition of the whole tailings. The particle size composition of the gold mine tailings was analyzed using a BT-9300ST laser particle size analyzer, and the results are shown in Figure 3. Table 1 presents the physical properties, while Figure 4 shows the chemical compositions.
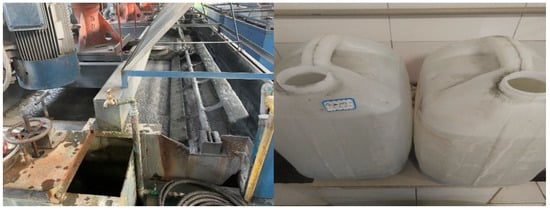
Figure 2.
The whole tail slurry sampling process.
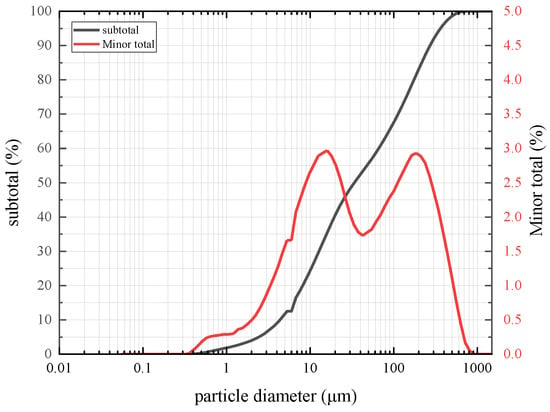
Figure 3.
Grading curve of the particle size of whole tailings.

Table 1.
Physical and mechanical properties of tailings in the Huangjindong gold mine.
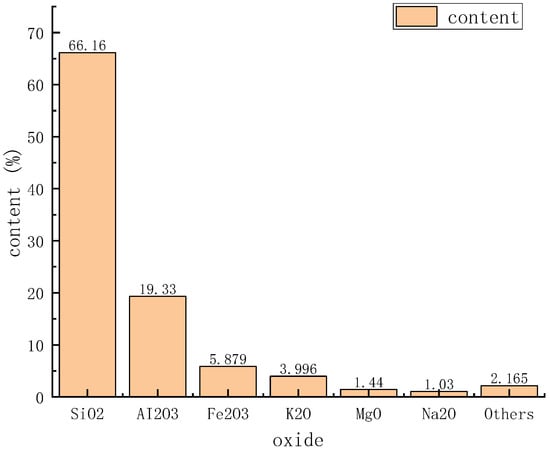
Figure 4.
Chemical composition diagram of tailings.
The cementing powder used in the test was a slag-based cementitious material prepared by grinding the slag produced during the smelting of pig iron or other metals and adding an alkali activator. Table 2 presents the composition and ratio of the raw materials.

Table 2.
Composition and ratio of the new type of cementing powder.
3. Paste Rheological Parameter Test Experiment
Rheology refers to the study of the flow of fluids and the science of deformation. The research results have a certain reference value for the design of a paste pipeline transportation process. Some rheological parameters can also judge the fluidity of a paste to a certain extent. According to the actual situation of the mine, paste slurry with a cement–sand ratio of 1:6 was selected as the test object, and the viscosity and yield stress of different concentrations of paste were tested.
3.1. Test Instruments and Methods
As shown in Figure 5, an Anton Paar rotary rheometer was used to measure the rheological parameters of the test slurry. The test process was as follows:
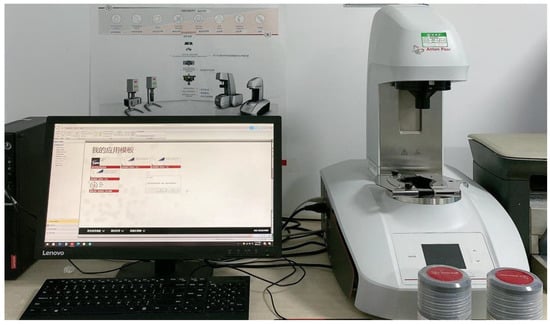
Figure 5.
Antoinette rotary rheometer.
(1) At the beginning of the test, the prepared high-concentration cemented tailings filling slurry was poured into a beaker, and the beaker was placed on an MC72 rheological operating table. The buckle was tightened to fix the beaker and prevent it from rotating with the rotor of the rheometer. The rotation was completed in 180 s.
(2) Using the RheoWin software interface, the rheometer’s rotor rotation was set, and the data were transmitted in real time. The computer saved the data measured in the experiment, and the data analysis was completed later using RheoWin software.
(3) After each test of the filling slurry sample, the rotor of the rheometer was cleaned to prevent any change in the concentration of the slurry to be tested due to an increase in water or slurry aggregates, as such changes would cause the experimental data to deviate.
3.2. Measurement Results
The results of the rheological parameters of the selected filling slurry are shown in Table 3. According to the data in Table 3, the yield stress and plastic viscosity of the slurry increased with the increase in its concentration.

Table 3.
Rheological parameters test results.
4. Numerical Simulation and Results of Paste Pipeline Transportation
4.1. Scheme of the Numerical Simulation
In this paper, the orthogonal test method is used to simulate the pipeline transportation of paste slurry with a cement–sand ratio of 1:6. In the simulation scheme, five influencing factors are included: filling gradient, elbow curvature radius, the inner diameter of the pipeline, slurry flow rate, and paste concentration. Four levels are set for each factor. The numerical value of each level design is shown in Table 4, and the orthogonal table of the numerical simulation scheme is shown in Table 5. The letters A, B, C, D, and E represent the filling gradient, the curvature radius of the bend pipe, the inner diameter of the pipe, the slurry flow rate, and the slurry concentration, respectively, and the numbers 1-4 represent the levels of each factor.

Table 4.
Orthogonal test scheme.

Table 5.
Orthogonal table of numerical simulation schemes.
4.1.1. Numerical Simulation Parameter Calculation
Before the numerical simulation, the material property parameters of the paste slurry should be calculated and measured, and the simulated pipeline transportation parameters should be reasonably verified. The numerical simulation parameters are summarized in Table 6. The process of calculation and verification is as follows:

Table 6.
Numerical simulation parameters.
- (1)
- Generalized Reynolds number
ρ is the density of the filling slurry (kg/m3);
V is the flow rate of the filling slurry (m/s);
D is the inner diameter of the filling pipeline (m);
μe is the effective viscosity of the filling slurry (Pa·s).
The generalized Reynolds number is an important parameter to distinguish the flow state of slurry. According to previous research, during pipeline transportation, when the generalized Reynolds number is less than 2300, the slurry shows laminar flow; when the Reynolds number is between 2300 and 4000, the slurry displays excessive flow; and when the Reynolds number is greater than 4000, the slurry shows turbulent flow. According to Formula (1), the slurry flow state under 16 schemes is laminar flow.
- (2)
- Physical property parameters of slurry
The physical parameters of the slurry mainly include density and concentration. In this study, slurry with a cement–sand ratio of 1:6 and concentrations of 56%, 58%, 60%, and 62% was numerically simulated. The density and concentration parameters are shown in Table 5.
- (3)
- Rheological parameters of slurry
The rheological parameters used in numerical simulation include slurry viscosity and yield stress. The rheometer determines the apparent viscosity of the slurry by measuring the shear stress and the velocity gradient of the slurry. However, when analyzing the flow of a non-Newtonian fluid in a pipeline, it is easier to measure the flow rate and the pressure drop of the slurry than the shear stress and the velocity gradient of the slurry. The viscosity related to the slurry flow rate and the pressure drop is the effective viscosity of the slurry. Therefore, the apparent viscosity of the slurry obtained using the indoor rheological test is transformed into the effective viscosity of the slurry. According to the Bingham effective viscosity formula (Formula (2)) in the literature [10], the apparent viscosity is the test value.
where:
is the effective viscosity (Pa.s);
is the apparent viscosity (Pa.s).
The parameter values used in the numerical simulation are shown in Table 6.
4.1.2. Pipeline Model
In this study, the numerical simulation method was used to study the gravity flow transportation of the Huajiawan pit mouth section of Huangjindong Mine. The surface filling borehole of the Huajiawan pit mouth is +209 m ~ −20 m, and the pipeline length is 230 m. According to the Reynolds number similarity criterion, when slurry flows in the pipeline, if the Reynolds number is kept consistent, the simulation results will not be changed when the model is similarly treated. Therefore, when modeling, the field filling pipeline can be simplified to an L-shaped pipeline, and the vertical pipeline length can be reduced 10-fold, to 23 m. To keep consistent with the pipeline lying in the filling site, the vertical pipe section was fixed at 23 m during modeling, and the filling double line was changed by changing the horizontal pipe section. One of the scheme pipeline model diagrams is shown below Figure 6.
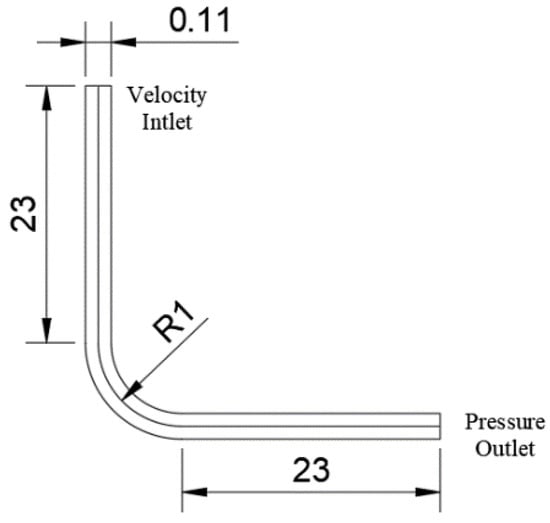
Figure 6.
Schematic diagram of the pipeline model.
4.2. Numerical Simulation Results
The resistance loss im (Pa/m) is defined as the ratio of the pressure difference at both ends of the pipeline to the length of the pipeline, and the calculation formula is Formula (3). The length of the pipeline, the inlet pressure, and the outlet pressure of the pipeline obtained with numerical simulation can be substituted into Formula (3) to determine the resistance loss of the filling slurry flowing through the filling pipeline. The calculation results are summarized in Table 7 and Figure 7.
where:
is the total pressure difference between the inlet and the outlet of the pipeline (Pa);
L is the total length of the pipeline (m).
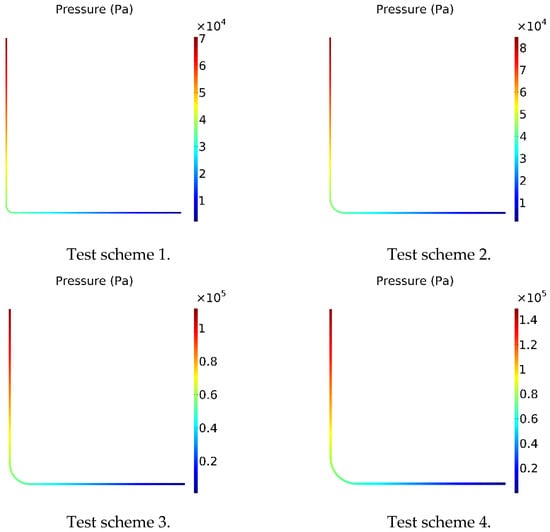
Figure 7.
Part of the numerical simulation results diagram.

Table 7.
Results of pipe resistance loss along the path under each simulation scheme.
Table 7.
Results of pipe resistance loss along the path under each simulation scheme.
| Test Scheme | Column Number | Maximum Wall Shear Stress (Pa) | Maximum Velocity at the Bend Pipe (m/s) | Resistance Loss of the Pipeline (Pa/m) | ||||
|---|---|---|---|---|---|---|---|---|
| A | B | C | D | E | ||||
| 1 | 1 | 1 | 1 | 1 | 1 | 228 | 2.57 | 2992 |
| 2 | 1 | 2 | 2 | 2 | 2 | 283 | 2.83 | 4303 |
| 3 | 1 | 3 | 3 | 3 | 3 | 530 | 3.04 | 5537 |
| 4 | 1 | 4 | 4 | 4 | 4 | 687 | 3.36 | 7399 |
| 5 | 2 | 1 | 2 | 3 | 4 | 557 | 3.11 | 8960 |
| 6 | 2 | 2 | 1 | 4 | 3 | 407 | 3.37 | 7857 |
| 7 | 2 | 3 | 4 | 1 | 2 | 279 | 2.51 | 2894 |
| 8 | 2 | 4 | 3 | 2 | 1 | 166 | 2.75 | 2533 |
| 9 | 3 | 1 | 3 | 4 | 2 | 349 | 2.43 | 3632 |
| 10 | 3 | 2 | 4 | 3 | 1 | 251 | 3.03 | 2159 |
| 11 | 3 | 3 | 1 | 2 | 4 | 548 | 2.81 | 11034 |
| 12 | 3 | 4 | 2 | 1 | 3 | 315 | 2.46 | 5934 |
| 13 | 4 | 1 | 4 | 2 | 3 | 354 | 2.76 | 4202 |
| 14 | 4 | 2 | 3 | 1 | 4 | 451 | 2.47 | 7113 |
| 15 | 4 | 3 | 2 | 4 | 1 | 273 | 3.35 | 3349 |
| 16 | 4 | 4 | 1 | 3 | 2 | 306 | 3.16 | 5456 |
5. Analysis and Discussion
5.1. Analysis of Factors Influencing Paste Flow Characteristics
5.1.1. Analysis of the Influence of the Resistance Loss of the Pipeline
The degrees of influence of the filling gradient, the elbow curvature radius r, the inner diameter d of the pipeline, the slurry flow velocity v, and the slurry concentration on the resistance loss along the pipeline are different. To identify the main factors influencing the resistance loss along the pipeline, the range analysis of each factor was carried out on the resistance loss im obtained from 16 groups of numerical simulation schemes. Table 8 and Figure 8 presents the results. Through the curve fitting of the average values of the resistance loss along the way at different levels obtained in the range analysis, the relationship between the average resistance loss along the way under each factor was determined (see Table 9).

Table 8.
Range analysis results of each parameter.
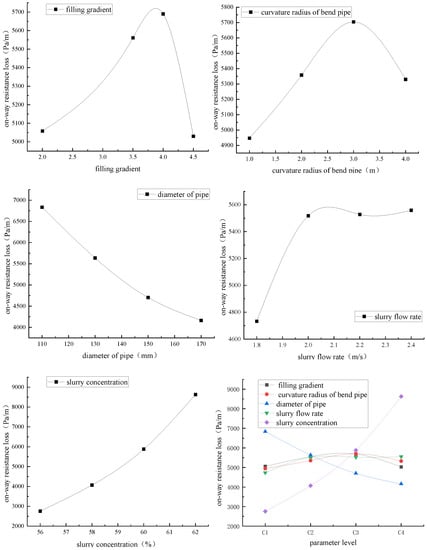
Figure 8.
The influence of each parameter on the resistance loss of the pipeline.

Table 9.
Fitting relationships between different influencing factors and drag loss along the path.
The results of extreme analysis show the following:
- (1)
- The influence of various factors on the resistance loss along the pipeline
The values of extreme difference in the filling gradient, the elbow curvature radius R, the inner diameter d of the pipe, the flow velocity v, and the slurry concentration are 660, 757, 2671, 826, and 5868, respectively. The larger the extreme difference, the greater the influence of the factor on the resistance loss along the pipeline. Therefore, the influence of each parameter on the resistance loss along the pipeline, in reducing order, is as follows: slurry concentration > the inner diameter of the pipeline > flow rate > filling gradient > elbow curvature radius.
- (2)
- The influence of the filling gradient
With the increase in the filling gradient, the resistance loss along the way changes into an exponential function, and an inflection point appears when the filling gradient is 4. When the filling gradient is between 2 and 4, the resistance loss increases with the increase in the filling gradient. When the filling gradient is between 4 and 4.5, the resistance loss decreases with the increase in the filling gradient, because when the filling gradient exceeds 4, the total resistance of the pipeline exceeds the gravity of the paste itself, and the paste cannot be transported by gravity. Therefore, to fill the stope when the filling gradient is greater than 4, pump-filling must be carried out.
- (3)
- The influence of the elbow curvature radius
Due to the complexity of underground mining conditions, when the filling pipeline is arranged, an elbow is often used to splice the pipeline. Therefore, the influence of the geometric shape of the elbow on the resistance loss along the way is also particularly important. According to the results of the numerical simulations, the resistance loss along the elbow also changes exponentially with the increase in the curvature radius of the elbow, and the inflection point appears when the curvature radius of the elbow is 3 m. When the curvature radius of the elbow is between 1 m and 3 m, the resistance loss will increase with the increase in the curvature radius. When the curvature radius of the elbow is between 3 m and 4 m, the resistance loss will decrease with the increase in the curvature radius. This is because when the radius of curvature increases, the circumference of the bend increases, and the contact force line between the slurry and the pipe wall increases, increasing the resistance along the pipeline. However, as the radius of curvature increases, the slurry velocity gradient decreases, reducing the resistance along the pipeline. According to the results of the numerical simulations, when the curvature radius of the elbow is 1 m, the resistance loss along the path is the smallest.
- (4)
- The influence of the inner diameter of the pipe
There is a negative correlation between the inner diameter d of the pipeline and the resistance loss along the pipeline. The resistance loss along the pipeline decreases with the increase in the inner diameter d of the pipeline. When the inner diameter d of the pipeline is between 110 mm and 150 mm, with the increase in the inner diameter of the pipeline, the reduction rate of the resistance loss along the pipeline is greater. When the inner diameter d of the pipeline is between 150 mm and 170 mm, the reduction rate of the resistance loss along the pipeline is relatively flat.
- (5)
- The influence of flow velocity
The relationship between the flow velocity v and the resistance loss along the pipeline is an exponential function. When the flow rate is 1.8 m/s ~ 2.0 m/s, the increase in the resistance loss along the way is larger, and when the flow rate is 2.0 m/s ~ 2.4 m/s, the increase in the resistance loss along the way is significantly reduced.
- (6)
- The influence of slurry concentration
The slurry concentration c is positively correlated with the resistance loss along the pipeline. As the slurry concentration c increases, the yield stress and the plastic viscosity of the slurry increase, leading to an increase in resistance loss along the pipeline. When the slurry concentration is between 56% and 58%, the increase in resistance loss along the pipeline is small. When the concentration is between 58% and 62%, the increase in resistance loss along the pipeline is greater.
The correlation coefficients of the fitting curves of each parameter are greater than 0.95, indicating that the error of predicting the slurry transportation characteristic values with these curves is small. Therefore, these parameter fitting models can provide a reference for the selection of filling slurry pipeline transportation parameters.
5.1.2. Maximum Wall Shear Stress of the Pipeline
The wall shear stress of the pipeline is the shear stress generated by the paste on the wall interface when it is moving along the pipeline, and the wall shear stress of the pipeline can reflect the wear rate of the paste on the pipe wall from the side. Therefore, the degree of wear of the pipeline can be analyzed by studying the wall shear stress of the pipeline. When the wall stress concentration and part of the shear stress are large, the wear of the pipeline will be more serious. At this time, it is necessary to thicken the pipe wall or optimize the wear resistance of the pipe wall material. Range analysis can be used to analyze the influence of each parameter on the maximum wall shear stress of the pipeline. The range analysis results of each parameter are shown in Figure 9 and Table 10.
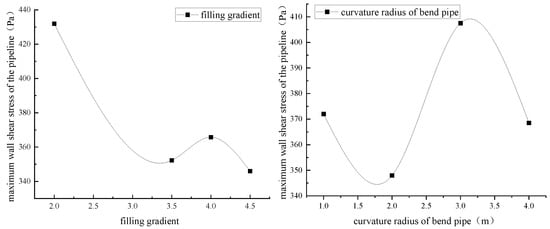
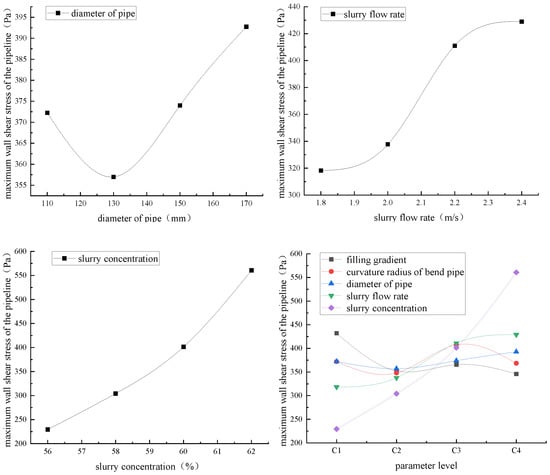
Figure 9.
The influence of various parameters on the maximum wall shear stress of the pipeline.

Table 10.
Range analysis results of each parameter of the maximum wall shear stress.
The results of the range analysis show the following:
- (1)
- The influence of various factors on the maximum wall shear stress of the pipeline
The range values of the filling times, the elbow curvature radius R, the inner diameter d of the pipe, the flow velocity v, and the slurry concentration are 86, 59.5, 35.75, 110.75, and 331.25, respectively. The degree of influence of each parameter on the maximum wall shear stress of the pipeline is relatively small. The influence of each parameter on the maximum wall shear stress of the pipeline, in reducing order, is as follows: slurry concentration > flow velocity > filling gradient > elbow curvature radius > the inner diameter of the pipe. The slurry concentration has the greatest influence on the maximum wall shear stress of the pipeline, while the pipe’s inner diameter has the least influence on it.
- (2)
- The influence of the filling gradient on the maximum wall shear stress of the pipeline
When the filling gradient is less than 3.5, the maximum wall shear stress of the pipeline decreases with the increase in the filling gradient. When the filling gradient exceeds 3.5, the maximum wall shear stress of the pipeline fluctuates with the increase in the filling gradient. When the gradient increases from 3.5 to 4, the maximum wall shear stress increases with the increase in the filling line, and when it increases from 4 to 4.5, the opposite is true.
- (3)
- The influence of the curvature radius on the maximum wall shear stress of the pipe
The maximum wall shear stress of the pipe fluctuates with the change in the curvature radius of the elbow. When the curvature radius of the elbow increases from 1 m to 2 m, the maximum wall shear stress decreases. When the curvature radius of the elbow increases from 2 m to 3 m, the maximum wall shear stress increases. However, when the curvature radius of the elbow increases from 3 m to 4 m, the maximum wall shear stress decreases.
- (4)
- The influence of the inner diameter of the pipe on the maximum wall shear stress of the pipe
When the inner diameter d of the pipe is less than 130 mm, the maximum wall shear stress of the pipe is negatively correlated with it. However, when the inner diameter d of the pipe is greater than 130 mm, the maximum wall shear stress of the pipe increases with the increase in the pipe’s inner diameter d.
- (5)
- The influence of flow velocity on the maximum wall shear stress of the pipe
There is a positive correlation between the maximum wall shear stress of the pipe and the flow velocity v. When the flow rate is 1.8–2.0 m/s or 2.2–2.4 m/s, the maximum wall shear stress growth rate is relatively small.
- (6)
- The influence of slurry concentration on the maximum wall shear stress of the pipeline
The slurry concentration c is approximately proportional to the maximum wall shear stress of the pipeline. The maximum wall shear stress of the pipeline increases with the increase in the slurry concentration c. When the slurry concentration is between 56% and 58%, the maximum wall shear stress of the pipe increases slightly.
The slurry concentration has the greatest influence on the maximum wall shear stress of the pipeline, while the pipe’s inner diameter has the least influence on it. The optimal wall shear stress parameter combination is that the filling gradient is 4.5, the curvature radius of the elbow is 1 m to 2.5 m, the pipe’s inner diameter is 110 mm to 150 mm, the slurry flow rate is 1.8 m/s, and the slurry concentration is 56–58%.
5.1.3. Maximum Velocity at Elbow
Statistics of the field situation of paste pipeline transportation indicate that the wear of the outer wall of the elbow of the transportation pipeline is often larger. This is not only because the shear stress of the transportation pipeline at the elbow is larger, but also because when the paste passes through the elbow, its speed and direction change, leading to a greater impulse at the elbow, because of which the elbow wall has greater wear. When the geometry of the elbow is fixed, according to the engineering practice experience, the maximum flow velocity at the elbow is positively correlated with the wear rate at the pipe wall. Through the range analysis of the maximum velocity results at the elbow under each scheme, the degree of influence of the five pipeline parameters on it and the optimal parameter combination range can be obtained. The range analysis results of each parameter are shown in Table 11.

Table 11.
Range analysis results of each parameter of the maximum velocity at elbow.
Analysis of Figure 10 shows the following:
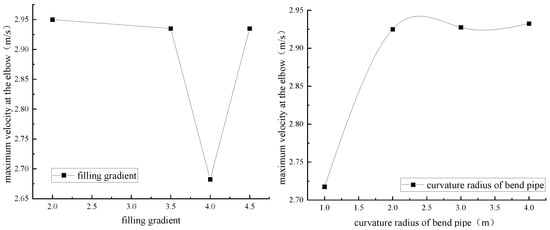
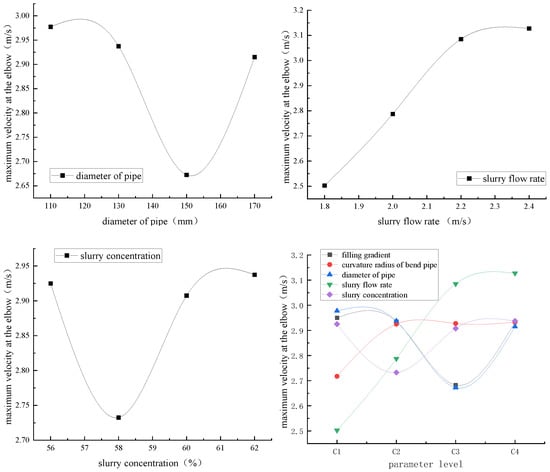
Figure 10.
The influence of each parameter on the maximum flow velocity at the elbow.
- (1)
- The influence of various factors on the maximum velocity at the elbow
The range values of the filling gradient, the elbow curvature radius R, the inner diameter d of the pipe, the flow velocity v, and the slurry concentration are 0.2675, 0.215, 0.305, 0.625, and 0.205, respectively. The flow velocity has the greatest influence on the maximum flow velocity at the elbow. There are no significant differences in the influence of the other parameters on the maximum flow velocity at the elbow. The order of influence is as follows: flow velocity > the inner diameter of the pipe > filling gradient > elbow curvature radius > slurry concentration.
- (2)
- The influence of the filling gradient on the maximum flow velocity at the elbow
When the filling gradient is less than 3.5, any change in the filling gradient has little effect on the maximum flow velocity at the elbow. As the filling gradient increases from 3.5 to 4, the maximum flow velocity at the elbow decreases. However, when the filling gradient increases from 4 to 4.5, the maximum flow velocity at the elbow increases.
- (3)
- The influence of the elbow curvature radius on the maximum flow velocity at the elbow
When the curvature radius of the elbow increases from 1 m to 2 m, the maximum velocity at the elbow increases. When the curvature radius of the elbow exceeds 2 m, the increase in the maximum velocity curvature radius at the elbow has a gentle effect on the maximum velocity at the elbow.
- (4)
- The influence of the pipe’s inner diameter on the maximum flow velocity at the elbow
When the inner diameter of the pipeline is less than 120 mm, the influence of the inner diameter of the pipeline on the maximum velocity at the bend is small. When the inner diameter of the pipeline increases from 120 mm to 150 mm, the maximum velocity at the bend decreases. However, when the inner diameter of the pipeline increases from 150 mm to 170 mm, the change trend of the maximum velocity at the bend is the opposite.
- (5)
- The influence of flow velocity on the maximum flow velocity at the elbow
When the flow velocity v is less than 2.2 m/s, the pipe flow velocity is approximately proportional to the maximum flow velocity at the elbow, and the growth rate is relatively fast. When the flow rate is greater than 2.2 m/s, the maximum flow rate at the elbow gradually slows down with the increase in the flow rate.
- (6)
- The influence of slurry concentration on the maximum velocity at the elbow
When the slurry concentration is between 56% and 58%, the maximum velocity at the bend decreases with the increase in the concentration. When the slurry concentration exceeds 58%, the maximum velocity at the bend increases with the increase in the slurry concentration. However, when the slurry concentration exceeds 60%, the maximum velocity at the bend increases, and the rate of increase in the maximum wall shear stress of the pipe decreases.
When the filling gradient is 4, the curvature radius of the elbow is 1 m, the pipe’s inner diameter is between 140 mm and 160 mm, the slurry flow rate is 1.8 m/s, the slurry concentration is 58%, and the maximum flow rate at the elbow of the filling slurry has less erosion influence on the pipe wall.
5.2. Calculation and Analysis of Resistance Loss along the Way, Based on Rheological Theory
Engineering practice shows that the paste can generally be regarded as a Bingham fluid, and its constitutive relation expression is as shown in Formula (4).
where:
τ is the shear stress when the paste flows (Pa);
τ0 is the initial shear stress required for the paste to flow (Pa);
η is the plastic viscosity of the paste (Pa·s);
dv/dy is the shear rate of paste flow (s−1).
On the basis of the theory of non-Newtonian fluid mechanics, assuming the idealized laminar flow of the paste in the pipe, a simple force analysis of the paste flow in the pipe is carried out, as shown in Figure 11.

Figure 11.
Analysis diagram of motion force in the paste pipeline.
Taking a micro-element cylinder of length L and radius r, according to the mechanical equilibrium equation:
That is:
Taking a cylinder of radius r and length L, the pressure loss in the pipe is still regarded as the shear stress on the cylindrical surface. Then, Formula (7) can be obtained and simplified into Formula (8):
Formula (8) and Formula (6) can be combined to obtain Formula (9):
Formula (4) can be substituted into Formula (8) to obtain Formula (10):
The distribution function of the flow velocity in the tube can be obtained by integrating Formula (10) into R:
When the paste flows in the pipeline, the boundary conditions r = R and V = 0 are set. The average flow velocity V of the paste pipeline transportation process can be obtained according to the Buckingham formula (Formula (12)).
where:
τw is the shear stress generated when the paste flows through the pipe wall (Pa);
τ0 is the initial shear stress required for the paste to flow (Pa);
D is the inner diameter of the pipe (m);
V is the average velocity of the paste pipeline transportation process (m/s).
Since (τ0/τw)4 is a high-order term, the value is small and can be ignored. Formula (12) can be simplified to obtain Formula (13):
Finally, the calculation Formula (14) of the resistance loss along the paste pipeline can be obtained by combining Formula (13) and Formula (8):
According to Formula (14), the inner diameter of the pipeline, slurry flow rate, yield stress, and plastic viscosity parameters of the 16 schemes are used in the calculation, and the theoretical value of the resistance loss along the paste pipeline transportation can be obtained. The resistance loss determined using numerical simulations was compared and analyzed, as shown in Table 12 and Figure 11.

Table 12.
Comparison of resistance loss values between theoretical calculation and numerical simulation.
It can be seen from Table 12 and Figure 12 that the maximum difference rate between the numerical simulation value and the theoretical calculation value is 11%, and the average difference rate is only 6%. Therefore, the resistance loss value along the path through the numerical simulation calculation is essentially consistent with the theoretical calculation value, verifying the rationality and accuracy of the numerical simulation calculation results.
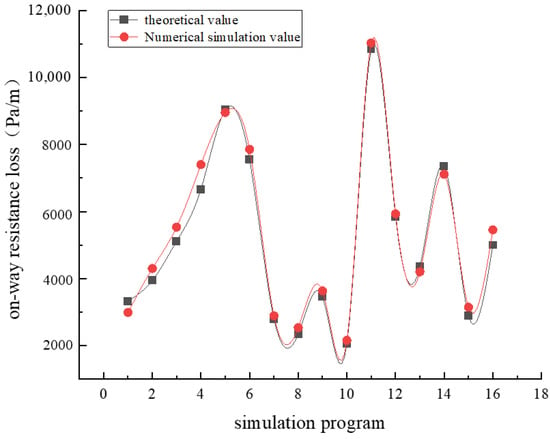
Figure 12.
Comparison diagram of resistance loss values between theoretical calculation and numerical simulation.
5.3. Discussion on the Comprehensive Optimal Transportation Scheme
5.3.1. Parameter Combination of the Comprehensive Optimal Scheme
Table 13 summarizes the optimal parameter combination ranges, with the resistance loss along the pipeline, the maximum wall shear stress of the pipeline, and the maximum flow velocity at the elbow as the discriminant factors. Although the maximum flow velocity at the elbow and the maximum wall shear stress of the pipeline are the discriminant factors when the filling times are 4 and 4.5, the combination results are better. However, the resistance along the pipeline is too high for the slurry to achieve gravity-assisted transport. When the filling line is 2 and the flow rate is 1.8 m/s, there are two relatively better solutions. However, compared with the flow rate of 2.0 m/s, the lower flow rate is more likely to cause the paste to accumulate in the pipeline and block it. Therefore, the filling line is 2, the curvature radius of the elbow is 1 m, the inner diameter of the pipe is 150 mm, the slurry flow rate is 2.0 m/s, and the slurry concentration is 58%.

Table 13.
Optimal parameter combinations under different discriminant factors.
5.3.2. Pressure Analysis in the Pipeline
According to the Bernoulli equation, the pressure of the paste in the pipeline can be divided into static pressure and dynamic pressure. The static pressure is generated by the gravitational potential energy of the paste itself and is proportional to the density of the paste and the height difference between the position and the horizontal liquid level. The dynamic pressure is generated by the flow rate of the paste during the movement and is proportional to the square of the flow rate when the paste moves in the pipeline. The following shows the total pressure and the dynamic pressure in the pipeline when the comprehensive optimal scheme parameter combination is two times the filling line, the curvature radius of the elbow is 1 m, the inner diameter of the pipeline is 150 mm, the slurry flow rate is 2.0 m/s, and the slurry concentration is 58%.
It can be seen from Figure 13, Figure 14 and Figure 15 that the total pressure at the inlet of the pipeline is 163,678 Pa, the total pressure at the outlet of the pipeline is 25 Pa, the resistance loss of the whole pipeline is 163,653 Pa, and the resistance along the pipeline is 3556 Pa/m. The gravitational potential energy of the paste was calculated using Formula (15) and found to be 357,485.4 Pa, which is much larger than the resistance loss of the whole pipeline under this scheme. Therefore, paste self-flow transportation can be achieved.
where:
ρ is the density of the paste (1586 kg/m3) when the paste slurry concentration is 58%;
g is the acceleration due to gravity (9.8 m/s2);
h is the height of the vertical section of the pipeline (23 m).
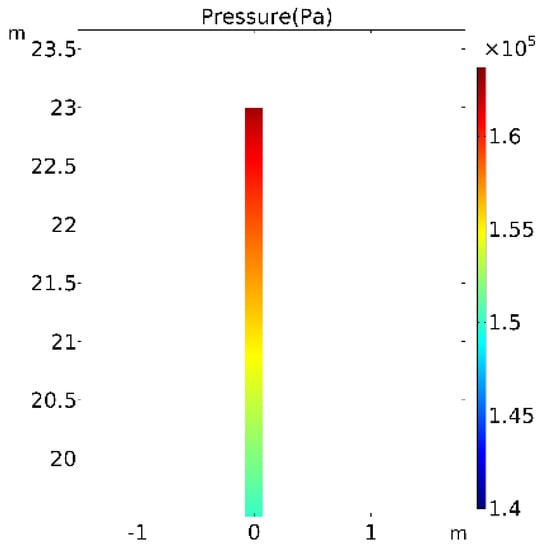
Figure 13.
Total pressure distribution at the inlet section of the pipeline.
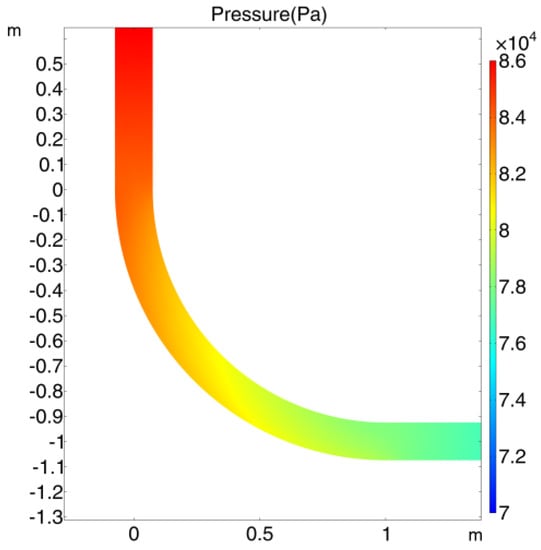
Figure 14.
Total pressure distribution of the pipe bend section.
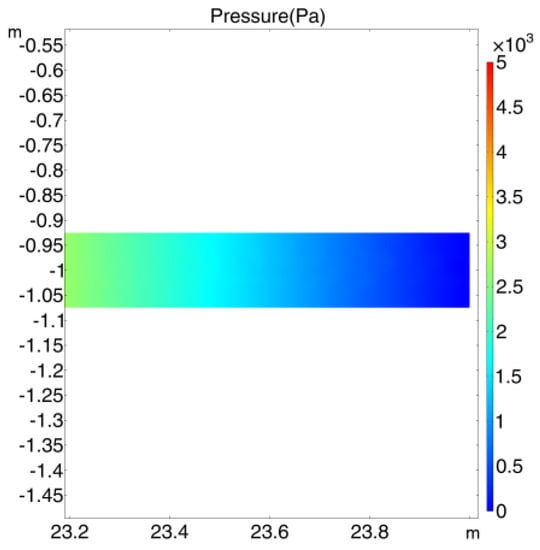
Figure 15.
Total pressure distribution at the outlet section of the pipeline.
It can be seen from Figure 16, Figure 17 and Figure 18 that the dynamic pressure in the initial section of the pipeline’s inlet is small, but as the gravitational potential energy gradually transforms into kinetic energy, the velocity of the paste gradually increases, as does the dynamic pressure. The paste continues to flow downward, and the “boundary effect” begins to take form at the pipe wall. The dynamic pressure value at the pipe wall decreases rapidly to zero, and high dynamic pressure concentration occurs at the center of the pipe. When the paste flows through the elbow, the dynamic pressure around the inner diameter side of the elbow is small, and the high-dynamic-pressure area is mainly concentrated in the lower half of the center of the elbow section near the outer diameter side of the elbow. Therefore, in engineering practice, the outer diameter side of the elbow section of the filling pipeline tends to be seriously worn.
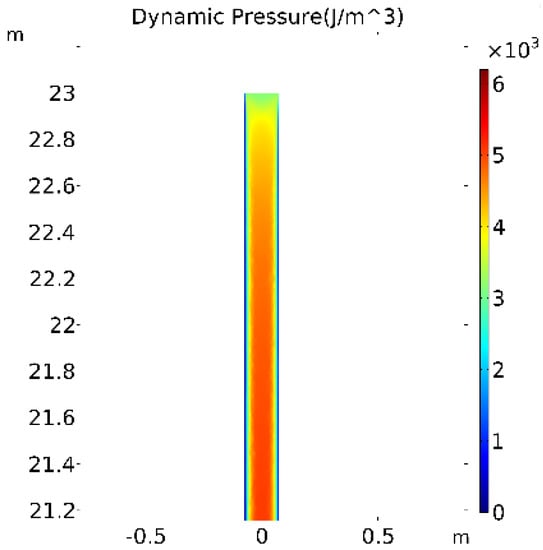
Figure 16.
Dynamic pressure distribution at the inlet section of the pipeline.
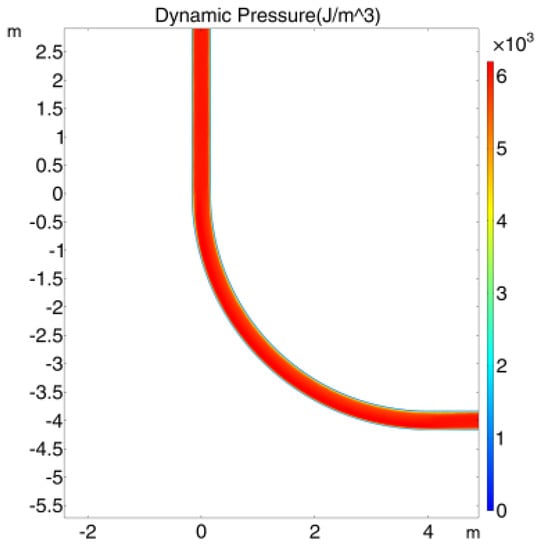
Figure 17.
Dynamic pressure distribution in the pipe bend section.
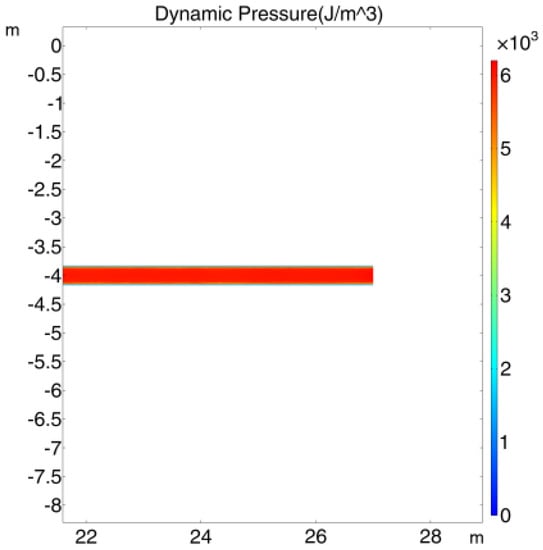
Figure 18.
Dynamic pressure distribution at the outlet section of the pipeline.
5.3.3. Flow Velocity Analysis of the Elbow
The flow velocity diagram of the bend section (Figure 19) shows that the velocity of the paste at the entrance of the bend is roughly axisymmetric and circular in distribution. The high-velocity area is mainly concentrated in the central area of the circle, and the velocity decreases gradually from the center to the outer wall. In the middle section and at the outlet section of the elbow, the high-velocity area (velocity > 2.3 m/s) in the pipeline gradually moves to the outside of the pipeline, the high-velocity area is convex on the left and concave on the right, and the inner outer wall of the pipeline forms a crescent-shaped low-velocity area (velocity < 0.4 m/s), while the velocity on the outer wall of the elbow is no longer zero. From the left outer wall of the pipeline to the right outer wall of the pipeline, the flow rate of the paste first increases and then decreases. Nearly half of the paste in the pipe section is in a high-flow-rate area, with a flow rate greater than 2.2 m/s, and it is mainly concentrated in the outer half of the elbow center. Therefore, when the filling pipe elbow is being processed, it should be ensured that the outer wall of the elbow (left) is thick or wear-resistant.
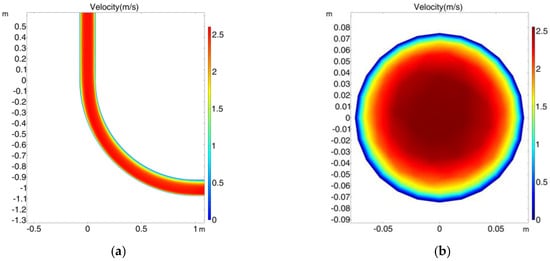
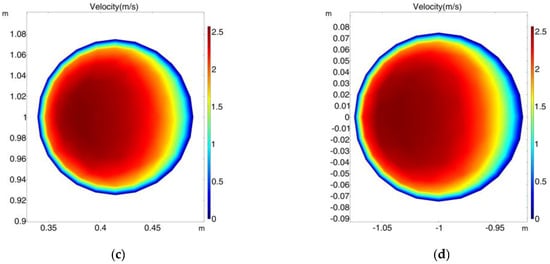
Figure 19.
Velocity distribution at the elbow: (a) Axial distribution of flow velocity in the bend pipe section. (b) Radial distribution of flow velocity at the beginning. (c) Radial distribution of flow velocity at the center. (d) Radial distribution of velocity at the end.
5.3.4. Pipe Wall Shear Stress Analysis
The shear stress of the pipe wall can reflect the degree of wear of the pipe from the side. By analyzing the shear stress that the pipe wall in different parts of the pipeline is likely to face, these parts can be reinforced in advance to avoid serious wear. The distribution of wall shear stress at the inlet, on the bend, and at the outlet of the pipe is shown in Figure 20, Figure 21 and Figure 22, respectively.
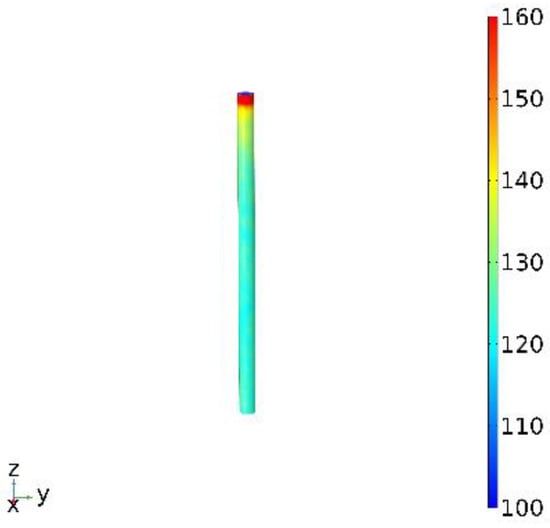
Figure 20.
Shear stress(N/m2) distribution at the inlet wall.
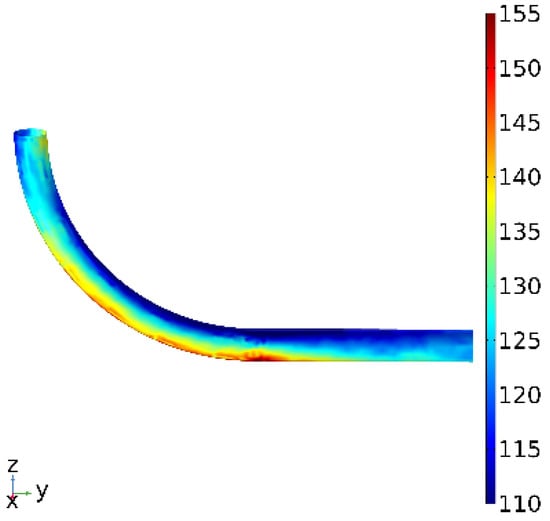
Figure 21.
Shear stress(N/m2) distribution on the bend wall.
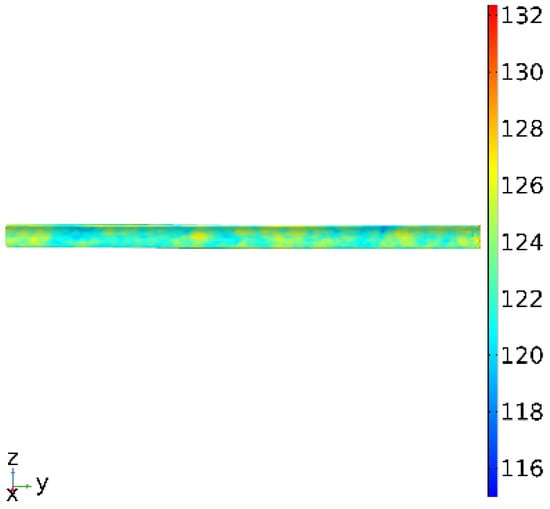
Figure 22.
Shear stress(N/m2) distribution at the end of the bend section.
As the paste enters the inlet of the pipe, the shear stress on the pipe wall in this area changes greatly due to the poor stability, abrasion, and the jet effect of the slurry. Then, as the flow state of the paste stabilizes, the shear stress on the pipe wall gradually reduces and becomes essentially constant. When the paste moves to the elbow, due to the change in the movement direction of the paste, the local shear stress gradually increases and the shear stress is no longer evenly distributed. The larger-shear-stress area is mainly distributed in the lower part of the elbow wall, and the maximum wall shear stress increases to 371 Pa. There is also a large area of local shear stress at the connection between the elbow section and the horizontal section of the pipeline. When the paste enters the horizontal pipeline, the movement of the paste gradually stabilizes, and the wall shear stress returns to a small and uniform state again. The shear stress at the outlet is 97.8 Pa. Due to the large wall shear stress at the inlet and bend of the pipeline, the pipeline wear at these locations is more serious in engineering practice. It is necessary to thicken the pipelines at these two locations to ensure the safe and efficient transportation of slurry.
6. Conclusions
(1) The numerical simulation results of the pipeline paste transportation process show that the order of the influence of each parameter on the resistance loss along the pipeline is slurry concentration > the inner diameter of the pipe > flow rate > filling gradient > elbow curvature radius, the order of the influence of each parameter on the maximum wall shear stress of the pipe wall is slurry concentration > flow rate > filling gradient > elbow curvature radius > the inner diameter of the pipe, and the order of influence of each parameter on the maximum flow velocity at the elbow is slurry inlet velocity > the inner diameter of the pipe > filling gradient > elbow curvature radius > slurry concentration.
(2) On the basis of the theory of paste rheology, the resistance loss along the pipeline under 16 working conditions in numerical simulations was calculated, and the theoretical calculation results were compared with the numerical simulation results. The maximum difference rate was found to be 11%, and the average difference rate was 6%. It is feasible to use computational fluid dynamics software as a research tool to simulate the paste transportation process.
(3) Combined with the actual situation of the mine, considering the resistance loss along the pipeline, the maximum wall shear stress of the pipeline, and the maximum flow rate at the elbow, the optimal scheme obtained was as follows: filling double line 2, an elbow curvature radius of 1 m, an inner diameter of the pipeline of 150 mm, a slurry flow rate of 2.0 m/s, and a slurry concentration of 58%. The results of the analysis of the optimal scheme show that the wear of the pipe wall at the entrance of the pipeline and the center of the elbow section near the outer diameter side is more serious during the paste-conveying process. Therefore, the two pipe walls need to be thickened or made wear-resistant.
(4) Due to the large amount of paste required for the industrial testing of paste-filling pipeline ring transportation, the inability to reuse the paste, the complex pipeline disassembly and assembly, the single test parameters, and the low repeatability, the study of the complex transportation characteristics of paste via a pipeline is difficult. In this work, the effects of filling times, the curvature radius of the elbow, the inner diameter of the pipeline, the paste flow rate, and the paste concentration on the flow characteristics of paste in pipeline transportation were studied using an orthogonal test and numerical simulation, which can provide a reference for the design of a filling pipeline in engineering practice.
Author Contributions
Conceptualization, X.W. and W.W.; methodology, X.W.; software, Y.L.; validation, R.G.; formal analysis, X.W.; investigation, X.T.; resources, Z.L.; data curation, Y.L.; writing—original draft preparation, Z.L.; writing—review and editing, X.W.; visualization, R.G.; supervision, Z.L.; project administration, X.T.; funding acquisition, W.W. All authors have read and agreed to the published version of the manuscript.
Funding
The work of this study was funded by the National Natural Science Foundation of China (Grant No. 52274194) and the Natural Science Foundation of Hunan Province of China (Grant No. 2021JJ30265).
Institutional Review Board Statement
Not applicable.
Informed Consent Statement
Not applicable.
Data Availability Statement
The data in this article are raw data.
Conflicts of Interest
The authors declare no conflict of interest.
References
- Mei-Feng, C.; Ding-Long, X.; Fen-Hua, R. Current status and development strategy of metal mines. Chin. J. Eng. 2019, 41, 417–426. [Google Scholar] [CrossRef]
- Ming-gao, Q.; Jia-Lin, X. Concept and Technical Framework of Sustainable Mining. J. China Univ. Min. Technol. 2011, 13, 1–7. [Google Scholar]
- He-Ping, X. Research review of the state key research development program of China:Deep rock mechanics and mining theory. J. China Coal Soc. 2019, 44, 1283–1305. [Google Scholar] [CrossRef]
- Xin-Ming, W.; De-Sheng, G.; Qin-Li, Z. Filling Theory and Pipeline Transportation Technology in Deep Mine; Central South University Press: Changsha, China, 2010. [Google Scholar]
- Ai-Xiang, W.; Hong-Jiang, W. Theory and Technology of Paste Backfill in Metal Mines; Science Press: Beijing, China, 2015. [Google Scholar]
- Qi, C.; Tang, X.; Dong, X.; Chen, Q.; Fourie, A.; Liu, E. Towards Intelligent Mining for Backfill: A genetic programming-based method for strength forecasting of cemented paste backfill. Miner. Eng. 2019, 133, 69–79. [Google Scholar] [CrossRef]
- Sivakugan, N.; Rankine, K.; Rankine, R. Geotechnical Aspects of Hydraulic Filling of Australian Underground Mine Stopes. In Ground Improvement Case Histories; Elsevier: Amsterdam, The Netherlands, 2015; pp. 83–109. [Google Scholar]
- Ding, Z.; Liu, P.; Cui, P.; Hong, C. Strength Development and Environmental Assessment of Full Tailings Filling Materials with Various Water-to-Binder Ratios. Metals 2023, 13, 122. [Google Scholar] [CrossRef]
- Khayrutdinov, A.M.; Kongar-Syuryun, C.; Kowalik, T.; Faradzhov, V. Improvement of the backfilling characteristics by activation of halite waste for non-waste geotechnology. IOP Conf. Ser. Mater. Sci. Eng. 2020, 867, 012018. [Google Scholar] [CrossRef]
- Ai-xiang, W.; Hong-jiang, W.; Sheng-hua, Y. Conception of in-situ fluidization mining for deep metal mines. J. Min. Sci. Technol. 2021, 6, 255–260. [Google Scholar] [CrossRef]
- Huizhen, D.; Nuraini Abdul, A.; Helmi Zulhaidi Mohd, S.; Kamarul Arifin, A. Pipeline Transportation Characteristics of Different Cementing Materials in CPB Slurry. J. Adv. Res. Fluid Mech. Therm. Sci. 2022, 97, 136–148. [Google Scholar] [CrossRef]
- Kongar-Syuryun, C.; Aleksakhin, A.; Khayrutdinov, A.; Tyulyaeva, Y. Research of rheological characteristics of the mixture as a way to create a new backfill material with specified characteristics. Mater. Today Proc. 2021, 38, 2052–2054. [Google Scholar] [CrossRef]
- Adigamov, A.; Rybak, J.; Golovin, K.; Kopylov, A. Mechanization of stowing mix transportation, increasing its efficiency and quality of the created mass. Transp. Res. Procedia 2021, 57, 9–16. [Google Scholar] [CrossRef]
- Zhou, K.-P.; Gao, R.; Gao, F. Particle Flow Characteristics and Transportation Optimization of Superfine Unclassified Backfilling. Minerals 2017, 7, 6. [Google Scholar] [CrossRef]
- Ren, W.; Gao, R.; Zhang, Y.; Hou, M. Rheological Properties of Ultra-Fine Tailings Cemented Paste Backfill under Ultrasonic Wave Action. Minerals 2021, 11, 718. [Google Scholar] [CrossRef]
- Xiao-Hui, L. Macro-micro analysis and test method of rheological behavior of paste tailings. Met Mine 2018, 5, 7–11. [Google Scholar] [CrossRef]
- Xiao-Hui, L. Study on Rheological Behavior and Pipe Flow Resistance of Paste Backfill. Ph.D. Thesis, University of Science and Technology Beijing, Beijing, China, 2015. [Google Scholar]
- Ovarlez, G.; Bertrand, F.; Coussot, P.; Chateau, X. Shear-induced sedimentation in yield stress fluids. J. Non-Newton. Fluid Mech. 2012, 177, 19–28. [Google Scholar] [CrossRef]
- Pullum, L.; Boger, D.V.; Sofra, F. Hydraulic Mineral Waste Transport and Storage. Annu. Rev. Fluid Mech. 2018, 58, 157–158. [Google Scholar] [CrossRef]
- Gao, R.; Zhou, K.; Zhou, Y.; Yang, C. Research on the fluid characteristics of cemented backfill pipeline transportation of mineral processing tailings. Alex. Eng. J. 2020, 59, 4409–4426. [Google Scholar] [CrossRef]
- Jana, S.C.; Kapoor, B.; Acrivos, A. Apparent wall slip velocity coefficients in concentrated suspensions of noncolloidal particles. J. Rheol. 1995, 39, 1123–1132. [Google Scholar] [CrossRef]
- Kefayati, G.H.R. Double-diffusive natural convection and entropy generation of Bingham fluid in an inclined cavity. Int. J. Heat Mass Transf. 2018, 116, 762–812. [Google Scholar] [CrossRef]
- Gulmus, S.A.; Yilmazer, U.J.J.o.A.P.S. Effect of volume fraction and particle size on wall slip in flow of polymeric suspensions. J. Appl. Polym. Sci. 2010, 98, 439–448. [Google Scholar] [CrossRef]
- Bing-Heng, Y.; Cui-Ping, L.; Ai-Xiang, W. Analysis on influencing factors of coarse particles migration in pipeline transportation of paste slurry. Chin. J. Nonferrous Met. 2018, 28, 2143–2153. [Google Scholar] [CrossRef]
- Qin-rui, C.; Hong-jiang, W.; Ai-xiang, W. Experimental study on hydraulic gradient of paste slurry by L-pipe. J. Wuhan Univ. Technol. 2011, 33, 5. [Google Scholar]
- Ji-Wei, B.; Qin-Li, Z.; Hao, W. Pipeline hydraulic gradient model of paste-like based on L-pipe experiments. J. China Univ. Min. Technol. 2019, 48, 23–28. [Google Scholar] [CrossRef]
- Chen, Q.; Zhang, Q.; Wang, X.; Xiao, C.; Hu, Q. A hydraulic gradient model of paste-like crude tailings backfill slurry transported by a pipeline system. Environ. Earth Sci. 2016, 75, 1–9. [Google Scholar] [CrossRef]
- Dong, H.; Abdul Aziz, N.; Zulhaidi Mohd Shafri, H.; Arifin Bin Ahmad, K. Computational fluid dynamics study on cemented paste backfill slurry: Review. Constr. Build. Mater. 2023, 369, 130558. [Google Scholar] [CrossRef]
- Liu, L.; Fang, Z.; Qi, C.; Zhang, B.; Guo, L.; Song, K.I.I.L. Numerical study on the pipe flow characteristics of the cemented paste backfill slurry considering hydration effects. Powder Technol. 2019, 343, 454–464. [Google Scholar] [CrossRef]
- Xie, D.; Wu, Y.; Zhang, Z.; Wang, T.; Chen, P.; Cui, Y.; Li, C.; Feng, S. Numerical Simulation of Elbow Erosion in Liquid-Solid Two-Phase Flow. IOP Conf. Ser. Mater. Sci. Eng. 2020, 740, 012169. [Google Scholar] [CrossRef]
- Wu, B.; Wang, X.; Liu, X.; Xu, G.; Zhu, S. Numerical simulation of erosion and fatigue failure the coal gangue paste filling caused to pumping pipes. Eng. Fail. Anal. 2022, 134, 106081. [Google Scholar] [CrossRef]
- Liu, L.; Fang, Z.; Wang, M.; Qi, C.; Zhao, Y.; Huan, C. Experimental and numerical study on rheological properties of ice-containing cement paste backfill slurry. Powder Technol. 2020, 370, 206–214. [Google Scholar] [CrossRef]
- Dong, H.; Aziz, N.A.; Shafri, H.Z.M.; Ahmad, K.A.B. Numerical Study on Transportation of Cemented Paste Backfill Slurry in Bend Pipe. Processes 2022, 10, 1454. [Google Scholar] [CrossRef]
- Cheng, H.; Wu, S.; Li, H.; Zhang, X. Influence of time and temperature on rheology and flow performance of cemented paste backfill. Constr. Build. Mater. 2020, 231, 117117. [Google Scholar] [CrossRef]
- Hai-Yong, C. Characteristics of Rheological Parameters and Pipe Resistance Under the Time-Temperature Effect. Ph.D. Thesis, University of Science and Technology Beijing, Beijing, China, 2018. [Google Scholar]
- Qiu-Song, C.; Qin-Ling, Z.; Xin-Ming, W. Pipeline hydraulic gradient model of paste-like unclassidied tailings backfill slurry. J. China Univ. Min. Technol. 2016, 45, 901–906. [Google Scholar] [CrossRef]
Disclaimer/Publisher’s Note: The statements, opinions and data contained in all publications are solely those of the individual author(s) and contributor(s) and not of MDPI and/or the editor(s). MDPI and/or the editor(s) disclaim responsibility for any injury to people or property resulting from any ideas, methods, instructions or products referred to in the content. |
© 2023 by the authors. Licensee MDPI, Basel, Switzerland. This article is an open access article distributed under the terms and conditions of the Creative Commons Attribution (CC BY) license (https://creativecommons.org/licenses/by/4.0/).