Article

Carbon Footprint Analysis of Ice Cream Production

by
Magdalena Wróbel-Jędrzejewska
* and
Elżbieta Polak
Prof. Wacław Dąbrowski Institute of Agriculture and Food Biotechnology—National Research Institute, Department of Refrigeration Technology and Technique in Lodz, 02-532 Warsaw, Poland
*
Author to whom correspondence should be addressed.
Sustainability 2023, 15(8), 6887; https://doi.org/10.3390/su15086887
Submission received: 23 February 2023 / Revised: 17 April 2023 / Accepted: 18 April 2023 / Published: 19 April 2023

Abstract

:
Nowadays, a noticeable trend in society is the search for more and more healthy food products. This is also reflected in the interest in plant-based ingredients replacing animal ones, which are more caloric, difficult to digest, and have more negative environmental impact. The purpose of this study was to determine the carbon footprint (CF) of technological process of ice cream, made with traditional ingredients as well as with fat and sugar substitute ingredients, under laboratory and handcraft conditions. Process-line portable metering was designed and implemented. Emission and production data were recorded for different ice blends; at a laboratory-scale, the determined technological process, CFtech, of traditional ice cream was 0.360 and for ice cream with substitutes 0.385 kg CO2/kg product. The pasteurization process accounted for the largest share in CFtech of ice cream with different contents of substitutes. Under handicraft conditions, the CFtech of traditional ice cream as well as ice cream with fat and sugar substitutes were 0.253 and 0.248 kg CO2/kg product, respectively. In contrast, for standard a handcraft, CF was the lowest at 0.234 kg CO2/kg product. CFtech of laboratory-scale ice cream production is larger than for handcraft production. Pasteurization along with homogenization and ripening accounted for the largest share of CO2 emissions.

1. Introduction

Consumers, often referred to as “eco-consumers”, are more consciously and willingly choosing food products that meet environmental requirements. Purchases of products with labels containing so-called eco-labels, i.e., information on their environmental impact, are steadily increasing [1,2]. Growing consumer interest in environmental issues may have the effect of limiting access to markets for countries whose food products lack information on GHG emissions associated with their manufacture and distribution. Determining GHG emissions from manufacturing processes and labeling products on this basis is a new instrument for supply chain management.
Sustainability requires the effort of acquiring raw materials from plant and animal origins, process them, and distributing finished food products not only with the overarching goal of ensuring adequate food quality and health safety [3], but also to systematically identify and monitor key environmental aspects throughout the food chain [4]. Many companies, especially large multinationals operating in the global market, use the principles of eco-audits, eco-mobility, and eco-design [5], including the standardized Life Cycle Assessment (LCA) method, looking for material and technological solutions that show the least harmful environmental impacts [6]. This is an important part of both the image and competitive strategy of agri-food companies [7]. Within the literature on the subject, one can find that LCA has been used to evaluate the environmental sustainability of the ice cream supply chain, data have been sourced from manufacturers and literature [8,9]. It was assumed that raw milk processing and ice cream manufacturing take place in the same industrial facility and are distributed from the manufacturer directly to the retailer [10]. On this basis the environmental impacts of ice cream have been calculated [11].
Efficiency, in the use of energy and natural resources in the economy, is an important factor affecting production costs, corporate profits, product competitiveness, and the social cost of livelihood and living standards of citizens. As a consequence of inefficient energy consumption [12], increased consumption of energy resources and environmental pollution problems are being observed [13,14].
The criteria that now guide the consumer in choosing food are primarily sensory qualities and health safety [15]. At the same time, there is a growing number of people choosing products whose production meets environmental requirements [16]. The carbon footprint (CF) can be used to assess such impacts in food production and distribution [17,18]. The CF is an estimated value of the amount of greenhouse gas (GHG) emissions emitted into the atmosphere over the life cycle of a product, process, or technology, expressed in CO2 equivalents in kg. CF analysis considers emissions: direct and indirect [19,20]. CF can have a variety of applications, including:
  • To inform consumers about GHG emissions associated with product manufacturing.
  • To develop and apply strategies to manage GHG emissions at various stages of the product life cycle.
  • To monitor progress in reducing GHG emissions over time.
  • To assist consumers in choosing products with the least impact on climate change [21,22].
Some large food manufacturers have already launched a process of publicly communicating the environmental footprints of their products (e.g., Danone, Nestlé, Unilever, and Granarolo). Environmental information about a product’s CF is based on LCA testing procedures [23,24]. Guidelines for its preparation are contained in the ISO 14025 technical report [25]. Establishing an environmental declaration includes: preparation of the declaration; verification of assessment methods; and certification [26].
The agri-food industry generates an environmental footprint which is a tool for determining the environmental impact of a product or process. It provides a uniform standard to measure the environmental performance of a production process [27]. In addition, it allows for comparison with other entities to assess the environmental impact of different processes. The idea of an environmental footprint is part of environmental protection and resource efficiency efforts [28]. In addition, there are environmental benefits associated with green products, reduced resource consumption, improved environmental performance, implementation of pro-environmental solutions, or benefits to businesses from the introduction of sustainable production principles [29].
A committee of the European Parliament, on the basis of the ENVI (Environment, Public Health and Food Safety) document, is developing a new EU action plan for a closed-loop economy that is based on preventing waste, reducing energy, and resource consumption. One of the objectives is to design product (including food) manufacturing in a way that reduces waste, and pollution and protects human health. The document requires the adoption of specific, science-based targets for the consumption of production materials and CF, taking into account the entire life cycle of individual products including food. The ENVI document will require manufacturers to provide information on CF, i.e., its environmental impact from GHG emissions on food packaging. This would mean that another additional element would have to be included on the label and would force manufacturers to take steps toward more sustainable and nature-friendly production [30].
The need for widespread implementation of the principles of so-called sustainable development into the economic and social reality around should be considered an accomplished fact. The pursuit of a lifestyle of health and sustainability in society (LOHAS = Lifestyle of Health and Sustainability) is the motivation for a variety of activities. In the area of sourcing raw materials, processing, distribution, and consumption of food, among other things, tools for comprehensive pro-environmental assessment are being reached, with methods such as ecoaudits, eco-mobility, LCA analysis, and, more recently, the calculation of global CF. At all stages of the farm-to-table chain, this innovative approach can be used to describe the environmental impact of individual processes or identify areas in need of protection [31] as well as to raise awareness of the food consumer and show the individual’s role in these activities [32,33].
One indicator that assesses the environmental impact of agri-food technology is CF [34,35,36] and is expressed in tons of carbon dioxide equivalent. It allows us to compare different GHG emissions with each other. We can determine CF for people, products, services, stores, workplaces, cities, and even entire countries [37]. The European Commission plans to introduce new food labeling [38]. The label is to be based on assessing the environmental impact of a product’s life cycle by determining its CF in order to promote a green economy. With the planned introduction of mandatory food labeling, which determines a product’s environmental impact, companies will have to conduct audits, internally and among their suppliers, to assess how environmentally friendly their products are [39].
The food market is one of the most innovative segments of the economy [40]. The challenge for food manufacturers and for science is to design and produce functional foods that, in addition to their nutritional function, exert an additional beneficial effect on the human body. Frequently used functional additional ingredients are prebiotics [41]. Natural prebiotics, such as inulin and oligosaccharides, are becoming increasingly popular. Inulin is a natural prebiotic—it improves the body’s immunity, lowers cholesterol, and triglyceride levels in the blood [42]. It regulates the digestive system, counteracting inflammation, ulcers, and cancer. It lowers post-meal glycemia and facilitates weight loss. It also improves mineral absorption. Due to its physico-chemical properties, inulin is used in food products mainly as a fat substitute and to reduce caloric value [43]. Oligofructose exhibits prebiotic properties and stimulates the development of beneficial intestinal bacterial flora. It protects against the development of intestinal cancers [44]. It has a positive effect on the skeletal system, as it improves calcium absorption from the gastrointestinal tract by creating an acidic environment by lactobacilli and acetic bacteria which promotes calcium absorption precisely. It also supports the functioning of the immune system. The substance facilitates the absorption of many minerals, such as iron, copper, magnesium, and zinc [45]. There is an increase in consumer awareness regarding the relationship between food, nutrition, and health, which, for many food manufacturing companies, provides a rationale for marketing products with special health-promoting, functional, or nutritionally enhanced properties. Frozen dairy products are part of this trend. They can represent a proposal for categorized personalized foods [46]. For years, ice cream has been one of the most popular dairy dessert products. In the first half of 2019, ice cream consumption in Poland amounted to almost 115 million liters. The global production of ice cream is growing every year, and consumers are expecting new proposals on the market [47].
Ice cream is a food product that requires refrigeration temperatures to be maintained throughout its life cycle. It is stored at constant temperatures (−18 °C) and consumed frozen. Maintaining a continuous cold chain for this type of product is necessary and closely related to energy expenditures [48]. Production processes are associated with negative environmental impacts [49,50]. Taking measures to improve it can be done through environmental analysis (considering indicators such as CF). Aiming to reduce emissions and negative impacts of activities throughout the production chain must be done in cooperation with suppliers and other business partners. In the literature one can find works on the subject of ice cream production containing fat and sugar substitutes. Abdeldaiema et al. [51] conducted research on ice cream supplemented with roasted and grilled corn powders. They evaluated the effects of replacing milk fat on ice cream characteristics. The physicochemical properties of vegan ice cream produced with fresh and dried walnut milk were analyzed by Bekiroglu et al. [52]. Genovese et al. [53] focused their attention on the health benefits and sensory implications on functional ice cream with substitution of fat and sugar. The properties of ice cream enrichment with high pressure homogenized hazelnut milk were the basis of research of Atalar et al. [54]. Narala et al. in their works [55,56] analyzed the role of inulin as a prebiotic and a fat replacer when added to vegan ice cream. Pontonio et al. [57] carried out research on the design and characterization of a plant-based ice cream, with a special consideration towards the structural and technological characteristics. However, all mentioned authors did not focus on CF calculations and the environmental impact of ice cream production. Determining the CF of a specific technology and, based on this, carrying out actions to reduce GHG is a conscious reduction of emissions contributing to environmental protection.
The description of commercial products by means of the CF indicator has recently been reached also by large retail chains, interested in emphasizing the connection of their activities with the concept of sustainability and educating consumers for organic and healthy food [58,59]. Thus, whenever new product technologies are developed, a CF analysis should be done already at the stage of testing it. Therefore, the proposed research addresses this need. The aim of this research was to determine the influence of ice cream manufacturing technology on rational energy management in order to create standards for new plant-based products. Activities were undertaken to determine the CF of technology involved in the production of traditional ice cream as well as ice creams with fat and sugar substitutes.
The scope of the work included the analysis of ice cream production technology in the context of developing a methodology for CF analysis. Under laboratory conditions, the technological process consisted of the pasteurization of ice cream mixture, homogenization and molding of ice cream prepared according to various recipes, while under artisanal conditions it included: pasteurization of ice cream mixture along with simultaneous homogenization and ripening, freezing and aeration in a miller, freezing in a blast freezer. After characterizing the technological process under actual operating conditions, the measurement range for CF was determined. The issue analysis approach was presented as a research method. The mass balance of components used in production, based on the selected technology, was analyzed. A method for counting CF was developed. Portable metering of the process line was designed and implemented. Then, energy consumption was measured over time under actual production conditions, its volume and the number of production cycles at each stage were recorded. On this basis CF was calculated. After the results were provided, they were discussed and conclusions were presented.

2. Methodology and Scope of the Study

2.1. Research Material

Ice cream samples were prepared using the following ingredients: milk powder, sugar, milk fat, stabilizers, and emulsifiers, as well as inulin, oligofructose, and a sweetener containing steviol glycosides. A reference sample was also prepared and designated as variant “0”. The research work was carried out in order to determine the composition of the ice cream mixture obtaining the most favorable technological and organoleptic parameters. Inulin and oligofructose were chosen as replacements for fat and sugar because of their properties.

2.2. Preparation of Mixtures and Ice Masses under Laboratory Conditions

Under laboratory conditions, ice cream was prepared according to 7 recipes (Table 1). The technological process involved pasteurization of the ice cream mixture, prepared according to the developed recipes, heated for 15 min in a water bath until it reached a temperature of 85 ± 1 °C and fat was gradually added. After this time, the mixture was cooled to 70 ± 1 °C and homogenized in a laboratory homogenizer at 14,000 rpm for 15 min (variant F), 5 min (variant F1), and 25 min (variant F2). The next step was a 24-h maturation under refrigeration at 4 ± 1 °C. In the next step, the mixture was cooled to 4 ± 1 °C and left at this temperature to mature for 20 h using slow agitation. The mixture was then subjected to the aeration and freezing process in a device made by Unold. The temperature of the ice mass immediately after preparation was about −5 ± 1 °C. The resulting ice mass was dispensed into packs, forming 150 g samples, and tempered at −30 ± 2 °C. In a similar way, ice cream was prepared according to the recipe with traditional ingredients as well as sugar and fat substitutes. Product recipe understood as a method of preparation is a manufacturer confidentiality. The granular ingredients (weighed according to the recipe) were mixed and combined with water. The recipe was based on the use of substitutes: inulin, for example, instead of fat, or steviol glycosides instead of sugars, which is unique, both in the overall ice cream market and its vegan segment.

2.3. Preparation of Ice Cream Mixes and Masses under Artisanal Production Conditions

A study of production CF based on 3 recipes named respectively: I—handcrafted ice cream (according to Primulator’s recipe); II—traditional dairy ice cream (according to IBPRS-PIB recipe); and III—ice cream with substitutes: sugar and fat (according to IBPRS-PIB recipe).
The machinery park for handcraft scale ice cream production was provided by Primulator. Each technological process of ice cream production according to the selected recipes (composition of each recipe—Table 2) included the following stages: pasteurization of the prepared ice cream mixture (heated to 85 ± 1 °C, fat was added gradually, 15 min with stirring) together with simultaneous homogenization and ripening (4 ± 1 °C and left at this temperature to ripen for 20 h), the mixture was then subjected to freezing and aeration in a miller (ice cream molding) from which the ice cream mass came out at −8 ± 1 °C. This process took about 15 min. The finished ice cream was placed in a shock freezer (referred to in the study as a “shocker”) at −39 °C for 10 min.

2.4. Study of the Carbon Footprint of Ice Cream Technology

The scope of work included the following stages:
  • Analysis of technologies for the manufacturing of traditional ice cream and ice cream with fat and sugar substitutes in the context of the development of CF methodologies and preparation of unit process diagrams in the production cycle for ice cream production technologies.
  • Development of a methodology for estimating the CF of ice cream production for selected technologies within the selected research scope.
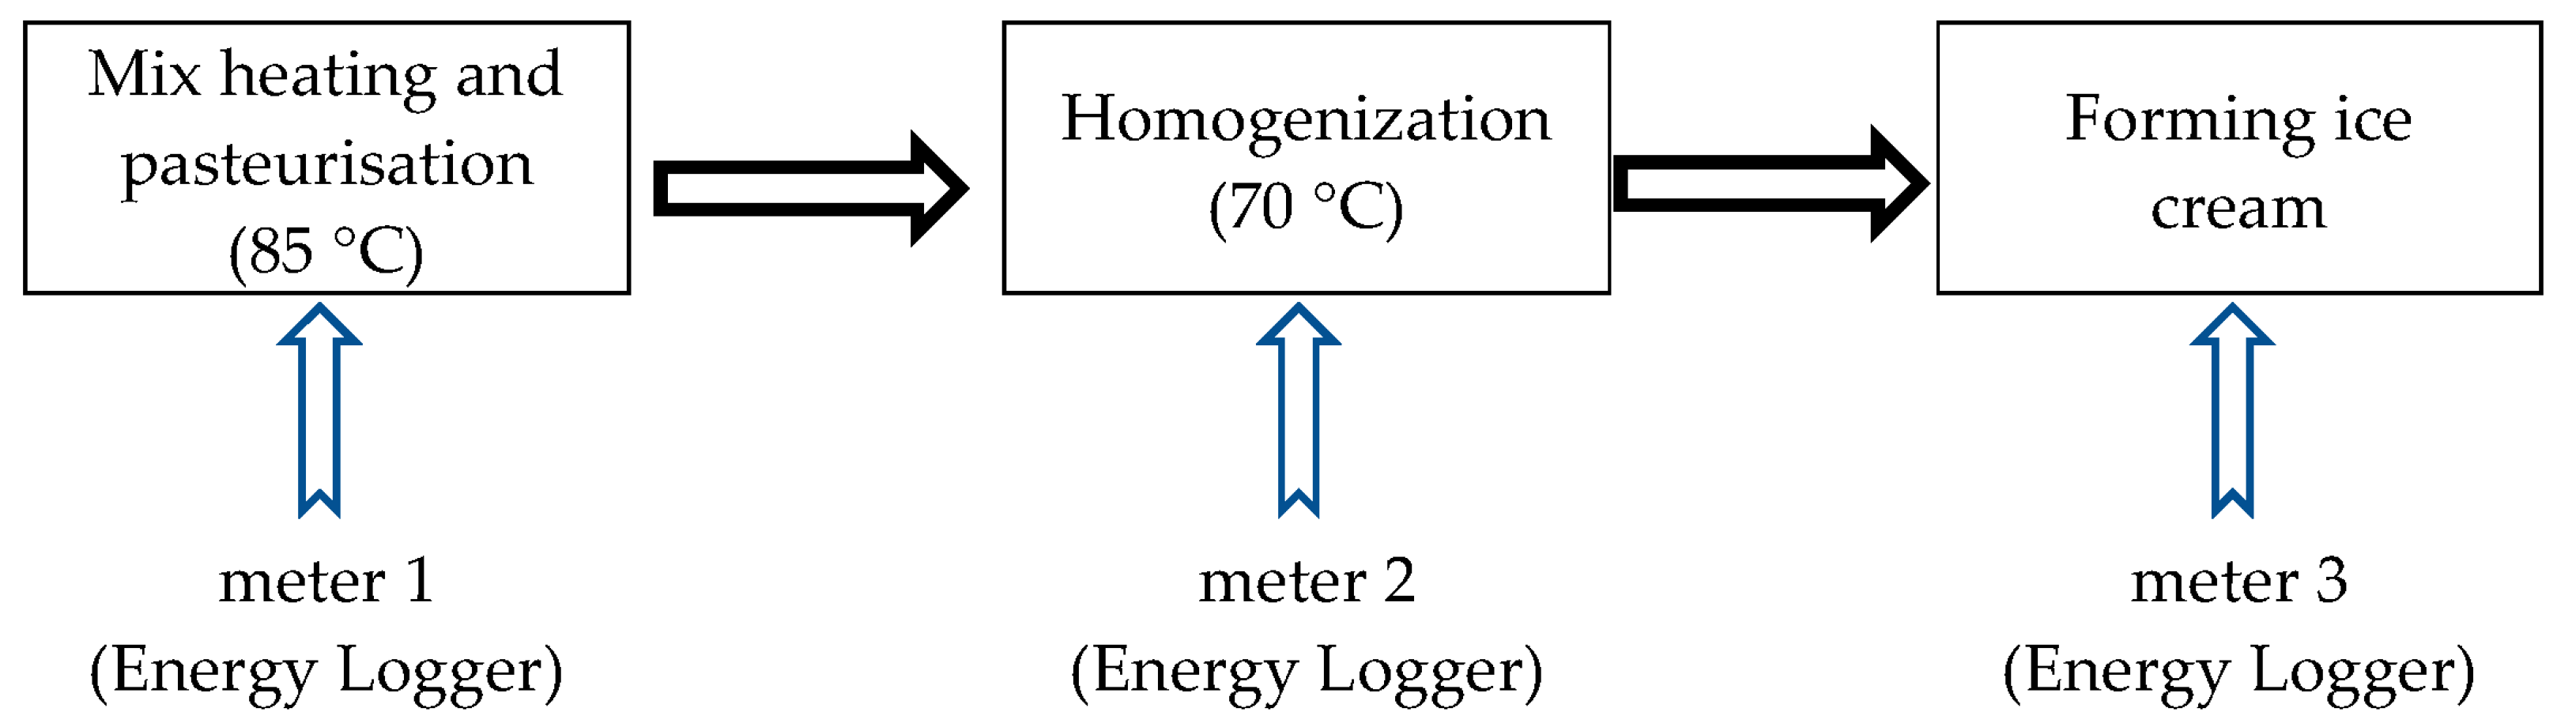
  • Determination of the method and scope of CF analysis of ice cream production technologies in order to develop the measurement system necessary to determine the CF.
  • Study of indirect and direct emissions necessary to the analysis and determination of CF for ice cream technology.
An analysis of ice cream production technologies was carried out in the context of developing a methodology for calculating CF and preparing unit process diagrams in the production cycle for these technologies in laboratory and artisanal production. The case study was chosen as the research method. The tests were performed in three repetitions to ensure reproducibility of the results. The data used for calculations was the average value of the parameters from 3 measurements. After characterizing the technological process under actual working conditions (under laboratory and artisanal conditions), the CF measurement range was determined. The approach to the analysis of the issue was presented as a research method. The mass balance of components used in production based on the selected technology was analyzed. A method for counting CF was developed. Portable metering of the process line was designed and implemented. This was followed by measuring energy consumption over time, under actual production conditions, along with recording its volume and the number of production cycles at each stage. In the case of the laboratory scale the boundary of the analysis includes unit stages: mix heating and pasteurization, homogenization and forming ice cream, while under the artisanal conditions: pasteurization, homogenization, and ripening; ice cream forming and shock freezing.
A “field-to-gate” methodology was used for CF analysis, which was performed in accordance with documents: ISO 14067 Greenhouse gases—Carbon footprint of products—Requirements and guidelines for quantification and communication; ISO 14040 Environmental management, Life cycle assessment—Principles and structure; ISO 14044 Environmental management, Life cycle assessment—Requirements and guidelines; and PAS 2050 Publicly Available Specification 2050, FAO 2006 Livestock’s Long Shadow–Environmental Issues and Options and FAO 2010 Fats and fatty acids in human nutrition [60,61,62,63,64,65]. According to the aforementioned documents, the analysis and designation of CF included the following steps:
  • Determination of the analysis scope, functional unit, and measurement range.
  • Analysis of measurement data and evaluation of production technology.
CF was determined in relation to 1 kg of product (functional unit). Energy Logger 4000 instruments and KE-N80 MID electricity meters placed in appropriate enclosures were used to record energy measurements. Emission and production data were recorded using the developed line metering system for seven ice cream mixes (one traditional composition and six different variants with fat and sugar substitutions). They were prepared under laboratory conditions in the amount of 2.5 kg, and three different ice cream mixes were prepared under industrial (handcraft) conditions. Based on the data obtained from measuring devices and production data, the partial and total CFs were calculated. CF analysis of ice cream production (with fat and sugar substitutions) was also carried out taking into account variable homogenization times (5, 15, and 25 min).

3. Results and Discussion

3.1. Determination of the Carbon Footprint of Ice Cream Production Technology under Laboratory Conditions

Studies of the technology’s CF were carried out at individual unit production stages according to the diagrams provided (Figure 1). Three electricity consumption meters for monitoring parameters were used.
Tests for each recipe were carried out three times to ensure reproducibility of results. Based on the analysis of electricity consumption (Table 3), CF of laboratory-scale ice cream production was determined for 7 recipe formulations (Table 4). Under these conditions, the determined CF of the production of traditional ice cream (recipe 0) was 0.360 kg CO2 per kg of product, and for ice cream according to the recipe with fat (100%) and sugar (100%) replacements (recipe F) 0.385 kg CO2 per kg of product. A study of the contribution of unit processes in the production of ice cream according to recipe F was carried out in relation to the variable durations of these stages (Table 5). The durations of the various stages were limited to specific ranges that allowed the corresponding properties of the final product to be obtained. This allowed testing different times for heating and pasteurization (70, 75, 76 min), homogenization (5, 15, 25 min), and a fixed time for ice cream formation (80 min). CF ranged from 0.355–0.395 kg CO2/kg product. The largest share of CF of ice cream production with fat and sugar substitutes was the pasteurization process which averaged about 77% of the total CO2 emissions (Figure 2) and the smallest was for the homogenization process. The CF of homogenization, for different durations, was 0.005; 0.017; 0.035 kg CO2/kg of product, respectively.

3.2. Determination of the Carbon Footprint of Handicraft Ice Cream Technology

Tests for each recipe were carried out three times to ensure the reproducibility of the results. Studies of the technology’s CF were carried out at individual unit stages according to the diagram provided (Figure 3). On the basis of the characteristics of the production equipment, appropriate measuring devices were used. Measurement of electricity for the pasteurizer and miller was carried out using specialized meters that allow continuous recording. The collected measurement data for individual production equipment during the production of ice cream according to the three recipes are shown in Table 6, Table 7 and Table 8. On the basis of the obtained production data (Table 6) and the data on electricity consumption at individual stages of ice cream production (Table 7), CF was determined, taking into account electricity emissivity data from the NERC. During the production of 1 kWh, 0.765 kg of CO2 is emitted into the atmosphere. Other data describing the CF of electricity production can be found in a study by PGE Obrót S.A. (Poland), where the average emission factor is 0.7488 [66] in relation to the structure of fuels used to generate electricity (Figure 4), which is mainly generated from burning coal (more than 80%).
Under handcrafted conditions, 60 kg of ice cream was produced in one production cycle. The determined CF of the production of traditional ice cream and ice cream with fat and sugar substitutes was 0.253 and 0.248 kg of CO2 per kg of product, respectively. In contrast, for the standard handicraft recipe used at Primulator, CF was the lowest at 0.234 kg CO2 per kg of product. The homogenization and ripening process accounted for the largest share of CF in handcrafted ice cream production with different recipes and amounted to about 60% of the total CO2 emissions (Figure 5).
Comparing the obtained results of the CF of traditional ice cream and with fat substitutes (100%)—0.360 kg CO2 per kg of product and sugar (100%)—0.385 kg CO2 per kg of product on a laboratory scale with the GHG emissions associated with the production of ice cream described in the work of [67], which amounted to about 1.67 kg CO2/kg, while the emissions relating to the Ice-Glu® product were about 1.29 kg CO2/kg. The determined values of CF among the studied ice cream were significantly lower than the ice cream described by Cimini and Moresi [67]. The analysis of the CF of ice cream included a different technology for the production of ice cream with additives, i.e., a broader research scope. The paper [67] performed environmental optimization by taking into account that the new products were made on the same process lines as conventional ice cream. The environmental benefits demonstrated through the CF were the result of the appropriate selection of ingredients with low environmental impact for ice cream cookie desserts. The use of whole grain flour and vegetable fats reduced the CF of the oatmeal cookie compared to conventional shortcake. At the same time, the CF was higher when butter and wheat flour were used. These modifications yielded CO2 savings of 65%.
The CF of handcrafted ice cream production (CFtech) (an average of 0.245 kg of CO2 per kg of product) indicates much lower CO2 emissions than the ice cream presented by Garcia-Suarez et al. [68]. The CF of the products, depending on the type, ranged from 3.66 kg CO2/kg for vanilla ice cream to 3.94 kg CO2/kg for premium chocolate ice cream. The differences in the size of CF are due to the extent of the calculation of CF of the food product studied. The paper [68] describes the GHG mass balance approach that was used to calculate the CF factor of Ben & Jerry’s annual ice cream production and sales in Europe. The company has introduced measures to reduce the climactic and environmental impact of production. The value of the annual CF factor was calculated. This approach allows the entire product range to be evaluated in a cost- and resource-efficient manner. Steps have been taken to achieve reductions in these areas by exploring new refrigeration technologies and working with dairy farmers in a sustainable agriculture program. Offsetting other GHG emissions allowed the company to become “climate neutral.” It was determined that the share of ice cream production was at a low level and accounted for 2% of the total CF; mainly due to the fact that the factory had already taken the right steps in this direction, including the purchase of green electricity. A large contribution to the total CF (as much as 46%) comes from retail refrigeration (including refrigerant leaks), which is by far the largest contributor to CF.
Aspects of the development of food production systems can also be assessed using advanced sustainability assessment tools, such as exergetics and its extensions. Several papers can be found on this topic in the published literature. Their content emphasizes the importance of advanced sustainability assessment tools in food production systems. A comprehensive exergetic performance analysis of an ice cream production was made, suggesting potential locations for plant performance improvement [69]. Another case was industrial-scale long-life UHT milk processing plant analysis. The survey was performed to obtain more in-depth information about the exergy destroyed in the whole plant and its main subcomponents. Through such activities sustainability parameters of dairy processing plants can be best evaluated and improved [70]. An industrial pasteurized yogurt manufacturing plant was analyzed and exergetic efficiency and exergy destruction rate were defined and computed for each component of the production lines [71]. The exergy efficiency and exergy destruction rate of each subcomponent of main subsystems in the yogurt production plant were also computed in order to develop future improvements of dairy processing plants from the viewpoints of sustainability and productivity [72].
By reviewing the literature and considering the CF of the ingredients (Table 9), the CF analysis was expanded. This allowed us to determine the CF in terms of “farm-to-table” for three recipes (I—handcrafted ice cream, II—traditional dairy ice cream, III—ice cream with sugar and fat substitutes) made under handcrafted conditions. The study showed that recommended nutritional changes in food products (reducing sugar and fat content) result in a 2-fold increase in the CF of manufactured ice cream (Table 10).
There has been a dynamic development of the dairy industry related to the production of frozen desserts [47]. A factor characterizing the ice cream market is the high seasonality of both production and consumption. The highest demand is recorded during the summer [69]. In the process of industrial ice cream production, an important aspect is the selection of an appropriate production line, characterized by efficiency, continuity of production, and a significant degree of automation. The result would be a reduction in production costs while maintaining high product quality. It is extremely important to analyze the impact of temperature during ice cream production. The selection of temperature during freezing is very important. At this stage it is extremely important to choose the right process conditions. The temperature should be between −3.5 and −7 °C, depending on the rate of mixing in the tank. The selection of excessively high temperatures will prevent the growth of crystals or prolong the process and increase its cost and environmental indicators. Undoubtedly, ice cream technology is a very promising branch of the food industry due to the continuous increase in demand for frozen desserts. High consumer demands for product quality leads to increased investment in the development of new production technologies. The biggest challenge of developing technologies is to reconcile product quality with economic optimization and environmental neutrality [47].
CFs can be used to assess such impacts in food production and distribution. Companies around the world are choosing to calculate CFs primarily for business reasons. A trend is beginning to emerge in many multinational companies to place more weight on the CF value of a particular product than on its price. In the case of the food and beverage industry, a key element in successfully lowering the CF is taking into account carbon reductions in its supply chains. It is the supply chains that contribute significantly to a company’s CF. On this basis, processes can be optimized, competitiveness can be enhanced, and a sustainable future can be built. Analyzing CF is about growth, it’s about improving energy efficiency, it’s ultimately about looking at the company in a broad perspective.
Estimates of the emitted CF for food products, while known, are usually not displayed on packaging. On the label of ice cream currently on sale, there is no information about the CF emitted during its production. This may be due to a lack of appropriate methodologies but also because there is no obligation to do so. A legal solution to force information regarding the CF of food products is still being worked on by the European Union. As a result, it can be assumed that there is a lack of a standardized and accessible methodology for producers to label their CF, while at the same time the legal environment may soon force a demand for this type of product.

4. Summary and Conclusions

Ice cream is a food product that requires refrigeration temperatures to be maintained throughout its life cycle. Maintaining a continuous cold chain for this type of product is necessary and closely related to energy expenditures [48,83]. Production processes are associated with negative environmental impacts [49,50]. Taking measures to improve it can be done through environmental analysis (considering indicators such as CF). Aiming to reduce emissions. The negative impacts of activities throughout the production chain must be done in cooperation with suppliers and other business partners [84,85]. Determining the CF of a specific technology and, based on this, carrying out actions to reduce GHG emissions is a conscious reduction of emissions contributing to environmental protection. In order to obtain precise data on the size of the CF of a specific food technology process, studies must be conducted on the production of traditional ice cream and with fat and sugar substitutes.
The purpose of the work was to determine the CF of ice cream production technologies with traditional ingredients and with fat and sugar substitutes. The scope of the work included the analysis of ice cream production technology in the context of developing a methodology for CF analysis. The technological process consisted of pasteurization, homogenization, and molding of ice cream under laboratory conditions. In contrast, under artisanal conditions, it included: pasteurization, homogenization and ripening, aeration, and freezing. After characterizing the technological process under actual operating conditions, the measurement range for CF was determined. The issue analysis approach was presented as a research method. The mass balance of ingredients used in production, based on the selected technology, was analyzed. A method for counting a CF was developed and process line metering was designed. Then, the energy consumption was measured over time, under actual production conditions, along with recording its volume and the number of production cycles at each stage. Partial and total CFs were calculated. The implementation of this topic is useful for the rational use of energy in the agri-food industry by optimizing production processes and ensuring adequate food safety.
Conducting CF analyses is reasonable already at the stage of developing new technological solutions for food production. Considerations should be carried out at the stage of recipe development, technology, production and storage equipment, configuration of production lines, and production planning. Reducing potential GHG emissions during the food production and storage process is possible by designing innovative equipment (with natural refrigerants and low energy consumption), which will translate meaningfully into ensuring food security and preventing food waste.
Based on the study of the CF of the technologies for the production of traditional ice cream and ice cream without sugar and fat, the following statements and conclusions were made.
  • At the laboratory scale, the determined CF of the production of traditional ice cream was 0.360 kg CO2 per kg of product and for ice cream according to the recipe with fat substitutes (100%) and sugar (100%) 0.385 kg CO2 per kg of product.
  • The largest share of the CF of ice cream production with different contents of fat and sugar substitutes was the pasteurization process and amounted to about 77% of total CO2 emissions.
  • The CF of the homogenization process, for different durations, was in range 0.005–0.035 kg CO2/kg product.
  • The determined CF of the production of traditional ice cream and ice cream with fat and sugar substitutes was 0.253 and 0.248 kg CO2 per kg of product, respectively, under artisanal conditions. In contrast, for the standard handicraft recipe, used at Primulator, the CF was the lowest at 0.234 kg CO2 per kg of product.
  • The homogenization and ripening process accounted for the largest share of CF of handicraft ice cream production with different recipes and amounted to about 60% of the total CO2 emissions.
  • Analyses showed that nutritional changes in food products reducing sugar and fat content were responsible for a 2-fold increase in the CF of new ice cream produced. The benefits of changing the materials in terms of impact on the chain production was confirmed.
  • The presented practical method of CF calculation can be used in other situations in this industry.
  • There is a need to continue research in this area for other technologies at the design and implementation stage in order to achieve low-carbon environmentally friendly technologies.
Estimates of the emitted CF for food products, while known, are usually not placed on packaging. On ice cream currently on sale, there is no information about the CF emitted during its production. This may be due to the lack of appropriate methodologies, therefore, theoretical development of them is required. A legal solution enforcing information on the CF of food products is still being worked on by the European Union. Therefore, it can be assumed that there is a lack of a standardized and accessible methodology for CF labeling for manufacturers, while at the same time the legal environment may soon create a demand for this type of product.
The stable situation on the ice cream market means that individual manufacturers will be interested in launching new, distinctive products. Entering or expanding into the vegan ice cream segment may make it possible to attract new customers. Buying a ready-made recipe of distinctive plant-based ice cream seems to be an easy way to achieve this goal. In addition, such a recipe would be attractive to both large industrial producers operating on a national scale and smaller artisanal producers offering their products in regional markets. At the same time, the growing share of vegan products in consumption will also apply to ice cream. More and more consumers will gravitate toward this form of frozen dessert for environmental, ethical, or health reasons. Previous brands of vegan ice cream have not relied on fat and sugar substitutes, therefore, a novelty in the offer may be attractive to consumers. The above factors show the existence of a market need for a novel ice cream recipe containing plant-based components, without fat and sugar, labeled with an estimated CF. At the same time, CF labeling of products may be required by law in the coming years. The European Union is discussing mandatory CF labeling on food products. If the relevant regulations come into force, ice cream manufacturers will have a significant interest in CF measurement methodologies tailored to their specific business. Furthermore, some ice cream manufacturers may want to distinguish themselves by providing such information to reach environmentally conscious and responsible consumers. They may be interested in such methodologies regardless of legislation.

Author Contributions

M.W.-J.—Conceptualization, Methodology, Writing—Original Draft Preparation, Formal Analysis, Investigation, Data Curation, Software, Visualization Validation, Funding Acquisition, Writing—Review & Editing. E.P.—Supervision, Resources, Funding Acquisition, Writing—Review & Editing, Project Administration. All authors have read and agreed to the published version of the manuscript.

Funding

This research received no external funding.

Institutional Review Board Statement

Not applicable.

Informed Consent Statement

Not applicable.

Data Availability Statement

Data may be available upon request.

Acknowledgments

This research did not receive any specific grant from funding agencies in the public, commercial, or not-for-profit sectors.

Conflicts of Interest

The authors declare that they have no known competing financial interest or personal relationship that could have appeared to influence the work reported in this paper.

References

  1. Dąbrowska, A.; Babicz-Zielińska, E. Consumer behavior towards new generation foods. HYGEIA Public Health 2011, 46, 39–46. [Google Scholar]
  2. Karwacka, M.; Ciurzyńska, A.; Galus, S.; Janowicz, M. Freeze-dried snacks obtained from frozen vegetable by-products and apple pomace–Selected properties, energy consumption and carbon footprint. Innov. Food Sci. Emerg. Technol. 2022, 77, 102949. [Google Scholar] [CrossRef]
  3. Konieczny, P.; Kijowski, J. Animal origin food preservation and its safety issues. Polish J. Food Nutr. Sci. 2005, 14, 21–29. [Google Scholar]
  4. Ai, X.; Jiang, Z.; Zhang, H.; Wang, Y. Low-carbon product conceptual design from the perspectives of technical system and human use. J. Clean. Prod. 2020, 244, 118819. [Google Scholar] [CrossRef]
  5. Madoumier, M.; Azzaro-Pantel, C.; Gésan-Guiziou, G. Including cleaning and production phases in the eco-design of a milk evaporation process. Food Bioprod. Process. 2020, 123, 427–436. [Google Scholar] [CrossRef]
  6. Kumar, M.; Choubey, V.K.; Deepak, A.; Gedam, V.V.; Raut, R.D. Life cycle assessment (LCA) of dairy processing industry: A case study of North India. J. Clean. Prod. 2021, 326, 129331. [Google Scholar] [CrossRef]
  7. Pasqualino, J.; Meneses, M.; Castells, F. The carbon footprint and energy consumption of beverage packaging selection and disposal. J. Food Eng. 2011, 103, 357–365. [Google Scholar] [CrossRef]
  8. de Vries, H.; Mikolajczak, M.; Salmon, J.M.; Abecassis, J.; Chaunier, L.; Guessasma, S.; Lourdin, D.; Belhabib, S.; Leroy, E.; Trystram, G. Small-scale food process engineering-Challenges and perspectives. Innov. Food Sci. Emerg. Technol. 2018, 46, 122–130. [Google Scholar] [CrossRef]
  9. Wróbel-Jędrzejewska, M.; Polak, E. Determination of carbon footprint in the processing of frozen vegetables using an online energy measurement system. J. Food Eng. 2022, 322, 110974. [Google Scholar] [CrossRef]
  10. Konstantas, A.; Stamford, L.; Azapagic, A. Environmental impacts of ice cream. J. Clean. Prod. 2019, 209, 259–272. [Google Scholar] [CrossRef]
  11. Barendregt, W.; Biørn-Hansen, A.; Andersson, D. Users’ Experiences with the Use of Transaction Data to Estimate Consumption-Based Emissions in a Carbon Calculator. Sustainability 2020, 12, 7777. [Google Scholar] [CrossRef]
  12. Compton, M.; Willis, S.; Rezaie, B.; Humes, K. Food processing industry energy and water consumption in the Pacific northwest. Innov. Food Sci. Emerg. Technol. 2018, 47, 371–383. [Google Scholar] [CrossRef]
  13. Konieczny, P.; Dobrucka, R.; Mroczek, E. Using Carbon Footprint to Evaluate Environmental Issues of Food Transportation. LogForum 2013, 9, 3–10. [Google Scholar]
  14. Zhou, S.; Zhu, Z.; Sun, D.-W.; Xu, Z.; Zhang, Z.; Wang, Q.-J. Effects of different cooling methods on the carbon footprint of cooked rice. J. Food Eng. 2017, 215, 44–50. [Google Scholar] [CrossRef]
  15. Shenashen, M.A.; Emran, M.Y.; El Sabagh, A.; Selim, M.M.; Elmarakbi, A.; El-Safty, S.A. Progress in sensory devices of pesticides, pathogens, coronavirus, and chemical additives and hazards in food assessment: Food safety concerns. Prog. Mat. Sci. 2022, 124, 100866. [Google Scholar] [CrossRef]
  16. Ahmed, W.; Haque, A.; Mohibbullah, M.; Khan, S.I.; Islam, M.A.; Mondal, H.T.; Ahmmed, R. A review on active packaging for quality and safety of foods: Current trends, applications, prospects and challenges. Food Pack. Shelf Life 2022, 33, 100913. [Google Scholar] [CrossRef]
  17. Hartikainen, H.; Roininen, T.; Katajajuuri, J.M.; Pulkkinen, H. Finnish consumer perceptions of carbon footprints and carbon labelling of food products. J. Clean. Prod. 2014, 73, 285. [Google Scholar] [CrossRef]
  18. Treu, H.; Nordborg, M.; Cederberg, C.; Heuer, T.; Claupein, E.; Hoffmann, H.; Berndes, G. Carbon footprints and land use of conventional and organic diets in Germany. J. Clean. Prod. 2017, 161, 127–142. [Google Scholar] [CrossRef]
  19. Metz, B.; Davidson, O.; Coninck, H.; Loos, M.; Meyer, L. IPCC, 2005–Carbon Dioxide Capture and Storage; Cambridge University Press: Cambridge, UK, 2005. [Google Scholar]
  20. Pandey, D.; Agrawal, M. Carbon Footprint Estimation in the Agriculture Sector. In Assessment of Carbon Footprint in Different Industrial Sectors, Volume 1; EcoProduction; Springer: Singapore, 2017. [Google Scholar]
  21. Wiedmann, T.; Minx, J. A definition of ‘carbon footprint’. In Ecological Economics Research Trends; Pertsova, C.C., Ed.; Nova Science Publishers: Hauppauge, NY, USA, 2008. [Google Scholar]
  22. Dong, G.; Mao, X.; Zhou, J.; Zeng, A. Carbon footprint accounting and dynamics and the driving forces of agricultural production in Zhejiang Province, China. Eco. Econom. 2013, 91, 38–47. [Google Scholar] [CrossRef]
  23. Maravić, N.; Kiss, F.; Šereš, L.; Bogdanović, B.; Bogdanović, B.; Šereš, Z. Economic analysis and LCA of an advanced industrial-scale raw sugar juice purification procedure. Food Bioprod. Process. 2015, 95, 19–26. [Google Scholar] [CrossRef]
  24. Cimini, A.; Moresi, M. Are the present standard methods effectively useful to mitigate the environmental impact of the 99% EU food and drink enterprises? Trends Food Sci. Technol. 2018, 77, 42–53. [Google Scholar] [CrossRef]
  25. ISO 14025; Environmental Labels and Declarations-Type III Environmental Declarations-Principles and Procedures. Interna-tional Organization for Standardization: London, UK, 2010.
  26. Commission Regulation (EU) 2019/2024 of 1 October 2019 laying down ecodesign requirements for refrigerating appliances with a direct sales function pursuant to Directive 2009/125/EC of the European Parliament and of the Council. Available online: https://eur-lex.europa.eu/legal-content/EN/TXT/?uri=uriserv:OJ.L_.2019.315.01.0313.01.ENG (accessed on 22 February 2023).
  27. Xua, Z.; Suna, D.; Zhanga, Z.; Zhu, Z. Research developments in methods to reduce carbon footprint of cooking operations: A review. Trends Food Sci. Technol. 2015, 44, 49–57. [Google Scholar] [CrossRef]
  28. Malliaroudaki, M.; Watson, N.J.; Ferrari, R.; Nchari, L.N.; Gomes, R.L. Energy management for a net zero dairy supply chain under climate change. Trends Food Sci. Technol. 2022, 126, 153–167. [Google Scholar] [CrossRef]
  29. Borsato, E.; Tarolli, P.; Marinello, F. Sustaiable patterns of main agricultural products combining different footprint parameters. J. Clean. Prod. 2018, 179, 357–367. [Google Scholar] [CrossRef]
  30. Available online: https://www.igifc.pl/ (accessed on 12 August 2022).
  31. Rees, W.E. Footprint: Our impact on Earth is getting heavier. Nature 2002, 420, 267. [Google Scholar] [CrossRef] [PubMed]
  32. Sala, S.; Castellani, V. The consumer footprint: Monitoring sustainable development goal 12 with process-based life cycle assessment. J. Clean. Prod. 2019, 240, 118050. [Google Scholar] [CrossRef]
  33. Yan, M.; Holden, N.M. Life cycle assessment of multi-product dairy processing using Irish butter and milk powders as an example. J. Clean. Prod. 2018, 198, 215–230. [Google Scholar] [CrossRef]
  34. Laguerre, O.; Hoang, H.M.; Flick, D. Experimental investigation and modelling in the food cold chain: Thermal and quality evolution. Trends Food Sci. Technol. 2013, 29, 87–97. [Google Scholar] [CrossRef]
  35. Karwacka, M.; Ciurzyńska, A.; Lenart, A.; Janowicz, M. Sustainable Development in the Agri-Food Sector in Terms of the Carbon Footprint: A Review. Sustainability 2020, 12, 6463. [Google Scholar] [CrossRef]
  36. Al-Mansour, F.; Jejcic, V. A model calculation of the carbon footprint of agricultural products: The case of Slovenia. Energy 2017, 136, 7–15. [Google Scholar] [CrossRef]
  37. Montzka, S.A.; Dlugokemcky, E.J.; Butler, J.H. Non CO2 greenhouse gases and climate change. Nature 2011, 476, 46–50. [Google Scholar] [CrossRef] [PubMed]
  38. Regulation (eu) No 1169/2011 of the European Parliament and of the Council of 25 October 2011 on the Provision of Food Information to Consumers, Amending Regulations (EC) No 1924/2006 and (EC) No 1925/2006 of the European Parliament and of the Council, and repealing Commission Directive 87/250/EEC, Council Directive 90/496/EEC, Commission Directive 1999/10/EC, Directive 2000/13/EC of the European Parliament and of the Council, Commission Directives 2002/67/EC and 2008/5/EC and Commission Regulation (EC) No 608/2004. Available online: https://eur-lex.europa.eu/legal-content/EN/ALL/?uri=celex%3A32011R1169 (accessed on 22 February 2023).
  39. Miraglia, M.; Marvin, H.J.P.; Kleter, G.A.; Battilani, P.; Brera, C.; Coni, E. Climate change and food safety: An emerging issue with special focus on Europe. Food Chem. Toxic. 2009, 47, 1009. [Google Scholar] [CrossRef] [PubMed]
  40. Bååth, J. How alternative foods become affordable: The co-construction of economic value on a direct-to-customer market. J. Rural Stud. 2022, 94, 63–72. [Google Scholar] [CrossRef]
  41. Hurtado-Romero, A.; Del Toro-Barbosa, M.; Garcia-Amezquita, L.E.; García-Cayuela, T. Innovative technologies for the production of food ingredients with prebiotic potential: Modifications, applications, and validation methods. Trends in Food Sci. Technol. 2020, 104, 117–131. [Google Scholar] [CrossRef]
  42. Chung, Y.; Wu, J.; Huang, W. Effects of prebiotics on intestinal physiology, neuropsychological function, and exercise capacity of mice with sleep deprivation. Food Res. Int. 2023, 165, 112568. [Google Scholar] [CrossRef]
  43. Otles, S.; Gokgunnec, L. Safety Considerations in Developing Functional Foods and Nutraceuticals. In Reference Module in Food Science; Elsevier: Amsterdam, The Netherlands, 2023. [Google Scholar] [CrossRef]
  44. Strieder, M.; Arruda, H.; Pastore, G.; Silva, E. Inulin-type dietary fiber stability after combined thermal, mechanical, and chemical stresses related to ultrasound processing of prebiotic apple beverage. Food Hydrocoll. 2023, 139, 10848. [Google Scholar] [CrossRef]
  45. Franck, A. Technological functionality of inulin and oligofructose. Br. J. Nutrit. 2002, 87, S287–S291. [Google Scholar] [CrossRef]
  46. Selvi, M.K.; Sowmya, B.; Kannan, T.; Latha, M.; Jena, I.; Kumar, V.A.; Vijayaraj, P. Chapter 2-Advances in personalized food and nutrition. In Research and Technological Advances in Food Science; Prakash, B., Ed.; Academic Press: Cambridge, MA, USA, 2022; pp. 31–60. [Google Scholar] [CrossRef]
  47. Szajner, P. The ice cream market in Poland. Przem. Spożywczy 2009, 63, 44–46. (In Polish) [Google Scholar]
  48. Granato, D.; Carocho, M.; Barros, L.; Zabetakis, I.; Andrei Mocan, A.; Alexandros Tsoupras, A.; Gomes Cruz, A.; Pimentel, T. Implementation of Sustainable Development Goals in the dairy sector: Perspectives on the use of agro-industrial side-streams to design functional foods. Trends Food Sci. Technol. 2022, 124, 128–139. [Google Scholar] [CrossRef]
  49. Sundarakani, B.; De Souza, R.; Goh, M.; Wagner, S.M.; Manikandan, S. Modeling carbon footprints across the supply chain. Int. J. Prod. Econom. 2010, 128, 43. [Google Scholar] [CrossRef]
  50. Kobylko, E. Technological and technical conditions of food ice cream production. Acta Sci. Polonorum. Tech. Agrar. 2013, 12, 27–37. [Google Scholar]
  51. Abdeldaiema, A.M.; Ali, A.H.; Mousa, A.H.; Elkot, W.F.; Simal-Gandara, J. Ice cream supplemented with roasted and grilled corn powders: Physical properties, rheology, antioxidant activity, color, sensory evaluation, and production cost. Int. J. Gast. Food Sci. 2023, 32, 100692. [Google Scholar] [CrossRef]
  52. Bekiroglu, H.; Goktas, H.; Karaibrahim, D.; Bozkurt, F.; Sagdic, O. Determination of rheological, melting and sensorial properties and volatile compounds of vegan ice cream produced with fresh and dried walnut milk. Int. J. Gast. Food Sci. 2022, 28, 100521. [Google Scholar] [CrossRef]
  53. Genovese, A.; Balivo, A.; Salvati, A.; Sacchi, R. Functional ice cream health benefits and sensory implications. Food Res. Int. 2022, 161, 111858. [Google Scholar] [CrossRef] [PubMed]
  54. Atalar, I.; Kurt, A.; Gul, O.; Yazici, F. Improved physicochemical, rheological and bioactive properties of ice cream: Enrichment with high pressure homogenized hazelnut milk. Int. J. Gast. Food Sci. 2021, 24, 100358. [Google Scholar] [CrossRef]
  55. Narala, V.R.; Jugbarde, M.A.; Orlovs, I.; Masin, M. Inulin as a prebiotic for the growth of vegan yoghurt culture in pea protein-based vegan yoghurt-ice cream, while improving the textural properties. Appl. Food Res. 2022, 2, 100136. [Google Scholar] [CrossRef]
  56. Narala, V.R.; Orlovs, I.; Jugbarde, M.A.; Masin, M. Inulin as a fat replacer in pea protein vegan ice cream and its influence on textural properties and sensory attributes. Appl. Food Res. 2022, 2, 100066. [Google Scholar] [CrossRef]
  57. Pontonio, E.; Montemurro, M.; Dingeo, C.; Rotolo, M.; Centrone, D.; Carofiglio, V.E.; Rizzello, C.G. Design and characterization of a plant-based ice cream obtained from a cereal/legume yogurt-like. LWT 2022, 161, 113327. [Google Scholar] [CrossRef]
  58. Scipioni, A.; Manzardo, A.; Mazzi, A.; Mastrobuono, M. Monitoring the carbon footprint of products: A methodological proposal. J. Clean. Prod. 2012, 36, 94–101. [Google Scholar] [CrossRef]
  59. Vasilaki, V.; Katsou, E.; Ponsá, S.; Colón, J. Water and carbon footprint of selected dairy products: A case study in Catalonia. J. Clean. Prod. 2016, 139, 504–516. [Google Scholar] [CrossRef]
  60. ISO/TS 14067; Greenhouse Gases–Carbon Footprint of Products–Requirements and Guidelines for Quantification and Communication. International Organization for Standardization: London, UK, 2013.
  61. ISO 14040; Environmental Management—Life Cycle Assessment—Principles and Framework. International Organization for Standardization: London, UK, 2009.
  62. ISO 14044; Environmental Management, Life Cycle Assessment-Requirements and GUIDELINES. International Organization for Standardization: London, UK, 2009.
  63. PAS 2050; Guide to PAS 2050 How to assess the carbon footprint of goods and services. British Standards: London, UK, 2008.
  64. FAO. Livestock’s Long Shadow–Environmental Issues and Options; Food and Agriculture Organization of the United Nations: Rome, Italy, 2006. [Google Scholar]
  65. FAO. Fats and Fatty Acids in Human Nutrition, Report of an Expert Consultation; FAO: Rome, Italy, 2010. [Google Scholar]
  66. PGE. Information for Customers on the Structure of Fuels Used to Generate Electricity Sold by PGE Obrót, S.A. in 2020 in Accordance with §37 of the Regulation of the Minister of Economy on Detailed Conditions for the Operation of the Power System Dated 4 May 2007; PGE: Emeryville, CA, USA, 2020. [Google Scholar]
  67. Cimini, A.; Moresi, M. Design and Development of a Novel Dietetic and Sustainable Ice Cream Cookie Sandwich. Chem. Eng. Trans. 2019, 75, 415–420. [Google Scholar]
  68. Garcia-Suarez, T.; Sim, S.; Mauser, A.; Marshall, P. Greenhouse Gas Assessment of Ben & Jerry’s ice-cream: Communicating their ‘Climate Hoofprint’. In Proceedings of the 6th International Conference on LCA in the Agri-Food Sector, Zurich, Switzerland, 12–14 November 2008; Volume 12–14, pp. 314–351. [Google Scholar]
  69. Dowlati, M.; Aghbashlo, M.; Soufiyan, M.M. Exergetic performance analysis of an ice-cream manufacturing plant: A comprehensive survey. Energy 2017, 123, 445–459. [Google Scholar] [CrossRef]
  70. Soufiyan, M.M.; Aghbashlo, M.; Mobli, H. Exergetic performance assessment of a long-life milk processing plant: A comprehensive survey. J. Clean. Prod. 2017, 140, 590–607. [Google Scholar] [CrossRef]
  71. Jokandan, M.J.; Aghbashlo, M.; Mohtasebi, S.S. Comprehensive exergy analysis of an industrial-scale yogurt production plant. Energy 2015, 93, 1832–1851. [Google Scholar] [CrossRef]
  72. Soufiyan, M.M.; Aghbashlo, M. Application of exergy analysis to the dairy industry: A case study of yogurt drink production plant. Food Bioprod. Process. 2017, 101, 118–131. [Google Scholar] [CrossRef]
  73. Available online: https://theconversation.com/which-milk-is-best-for-the-environment-we-compared-dairy-nut-soy-hemp-and-grain-milks-147660 (accessed on 28 July 2022).
  74. Available online: https://www.healabel.com/cream-side-effects/ (accessed on 28 July 2022).
  75. Available online: https://apps.carboncloud.com/climatehub/product-reports/id/5243965108 (accessed on 28 July 2022).
  76. Available online: http://www.garethhuwdavies.com/environment/environment_blog/butter-margarine-spread-breakfasts-carbon-footprint/ (accessed on 28 July 2022).
  77. García, C.A.; García-Treviño, E.S.; Aguilar-Rivera, N.; Armendáriz, C. Carbon footprint of sugar production in Mexico. J. Clean. Prod. 2016, 112, 263–264. [Google Scholar] [CrossRef]
  78. Available online: https://apps.carboncloud.com/climatehub/product-reports/id/75046256759 (accessed on 28 July 2022).
  79. Tsiropoulos, I.; Cok, B.; Patel, M. Energy and greenhouse gas assessment of European glucose production from corn–A multiple allocation approach for a key ingredient of the bio-based economy. J. Clean. Prod. 2013, 43, 182–190. [Google Scholar] [CrossRef]
  80. Sarkar, R.; Bhowmik, A.; Kundu, A.; Dutta, A.; Nain, L.; Chawla, G.; Saha, S. Inulin from Pachyrhizus erosus root and its production intensification using evolutionary algorithm approach and response surface methodology. Carbohydr. Polym. 2021, 251, 117042. [Google Scholar] [CrossRef]
  81. Available online: https://zdrowie.radiozet.pl/W-zdrowym-ciele/Zdrowe-zywienie/Produkty/Stewia-jak-jej-uzywac-czy-jest-bezpieczna-rowniez-w-cukrzycy (accessed on 28 July 2022).
  82. Rein, P.W. The carbon footprint of sugar. Proc. Int. Soc. Sugar Cane Technol. 2010, 27, 1–15. [Google Scholar] [CrossRef]
  83. Han, J.; Zuo, M.; Zhu, W.; Zuo, J.; Lü, E.; Yang, X. A comprehensive review of cold chain logistics for fresh agricultural products: Current status, challenges, and future trends. Trends Food Sci. Technol. 2021, 109, 536–551. [Google Scholar] [CrossRef]
  84. Heddeghem, W.; Vereecken, W.; Colle, D.; Pickavet, M.; Demeester, P. Distributed computing Carbon Footprint of Fruit for carbon footprint reduction by exploiting low-footprint energy availability. Future Gener. Comp. Syst. 2012, 28, 405–414. [Google Scholar]
  85. Chaudhary, A.; Tremorin, D. Nutritional and Environmental Sustainability of Lentil Reformulated Beef Burger. Sustainability 2020, 12, 6712. [Google Scholar] [CrossRef]
Figure 1. Schematic of unit steps in laboratory production with measurement points.
Sustainability 15 06887 g001
Figure 2. Contribution of unit processes in CFtech ice cream production by recipe.
Sustainability 15 06887 g002
Figure 3. Diagram of unit stages in handcraft manufacturing with ice cream production line equipment and measurement points.
Sustainability 15 06887 g003
Figure 4. Structure of fuels and other primary energy carriers used to generate electricity (PGE, 2020).
Sustainability 15 06887 g004
Figure 5. Share of unit processes in artisanal ice cream production for three recipes.
Sustainability 15 06887 g005
Table 1. Recipes for traditional ice cream as well as ice cream with sugar and fat substitutes used in laboratory production.
IngredientsRecipe
0ABCDEF
sugar+++++
skimmed milk powder+++++++
Butter++++
stabilizing and emulsifying preparation+++++++
Inulin++++++
Oligofructose++++
Stevia++++
Water+++++++
Table 2. Ice cream mix recipes in handicraft production.
IngredientsRecipe
IIIIII
milk+
Cream+
Dextrose+
Sugar+++
glucose syrup+
skimmed milk powder+++
stabilizing and emulsifying preparation+++
Butter++
Inulin+
Oligofructose+
Stevia+
Water++
Table 3. Electricity consumption and time of unit processes for laboratory scale ice cream production for different recipes.
SampleSugar [%]Fat [%]Mix Heating and Pasteurisation (85 °C)Homogenization
(70 °C)
Forming Ice Cream
2.5 kg1.5 kg
0100% sugar100% fat0.890 ± 0.001 kWh0.062 ± 0.001 kWh0.135 ± 0.001 kWh
1 h 10 min15 min1 h 20 min
A100% sugar100% fat replacer0.967 ± 0.001 kWh0.061 ± 0.001 kWh0.133 ± 0.001 kWh
1 h 15 min15 min1 h 19 min
B100% sugar50% fat
50% fat replacement
0.866 ± 0.001 kWh0.059 ± 0.001 kWh0.139 ± 0.001 kWh
1 h 8 min15 min1 h 31 min
C100% sugar substitute50% fat
50% fat replacement
0.841 ± 0.001 kWh0.059 ± 0.001 kWh0.131 ± 0.001 kWh
1 h 4 min15 min1 h 19 min
D50% sugar substitute
50% sugar
50% fat
50% fat replacement
0.896 ± 0.001 kWh0.061 ± 0.001 kWh0.135 ± 0.001 kWh
1 h 10 min15 min1 h 20 min
E50% sugar
50% sugar substitute
100% fat replacer0.895 ± 0.001 kWh0.060 ± 0.001 kWh0.135 ± 0.001 kWh
1 h 10 min15 min1 h 20 min
F100% sugar substitute100% fat replacer0.982 ± 0.001 kWh0.058 ± 0.001 kWh0.131 ± 0.001 kWh
1 h 17 min15 min1 h 19 min
Table 4. CFtech ice cream technology [kgCO2/kg product]—laboratory scale production.
RecipeCF Preheat and PasteurisationCF HomogenizationCF Ice Cream FormingCF Technology
00.2720.0190.0690.360
A0.2960.0190.0680.382
B0.2650.0180.0710.354
C0.2570.0180.0670.342
D0.2740.0190.0690.362
E0.2740.0180.0690.361
F0.3000.0180.0670.385
Table 5. Electricity consumption quantities and CF of ice cream production—laboratory scale—variable homogenization time, recipe F (100% fat replacement, 100% sugar replacement).
Temp.
Water in the Bath
Mix Heating and Pasteurisation (85 °C)CF
Heating and Pasteurization
Homogenization
(70 °C)
CF
Homogenization
Forming Ice CreamCF
Forming Ice Cream
CF
[kgCO2/kg of Product]
2.5 kg1.5 kg
22.5 °C0.925 ± 0.001 kWh0.2830.016 ± 0.001 kWh0.0050.131 ± 0.001 kWh0.0670.355
1 h 10 min5 min1 h 20 min
20.1 °C0.958 ± 0.001 kWh0.2930.057 ± 0.001 kWh0.0170.131 ± 0.001 kWh0.0670.377
1 h 15 min15 min1 h 20 min
21.5 °C0.960 ± 0.001 kWh0.2940.114 ± 0.001 kWh0.0350.131 ± 0.001 kWh0.0670.395
1 h 16 min25 min1 h 20 min
Table 6. Production volume [kg] at individual unit stages in handicraft production.
RecipePasteurizer [kg]Muter [kg]Shocker [kg]
I60.0058.3058.30
II60.0057.3057.30
III60.0056.9856.98
Table 7. Electricity consumption [kWh] by equipment in handicraft production.
RecipePasteurizerMuterShocker
Homogenization, PasteurisationCoolingMaturationEmptyingWashingProcessWashingCooling
I5.000 ± 0.0012.550 ± 0.0012.000 ± 0.0010.040 ± 0.0010.990 ± 0.0014.990 ± 0.0011.060 ± 0.0011.422 ± 0.001
II4.730 ± 0.0012.700 ± 0.0011.910 ± 0.0011.550 ± 0.0010.970 ± 0.0014.760 ± 0.0011.230 ± 0.0011.745 ± 0.001
III4.520 ± 0.0012.740 ± 0.0011.620 ± 0.0011.360 ± 0.0010.780 ± 0.0015.790 ± 0.0010.320 ± 0.0011.953 ± 0.001
Table 8. CF [kg CO2/kg product] of handicraft ice cream technology.
RecipePasteurizerMuterShocker
Homogenization, PasteurisationCoolingMaturationEmptyingWashingProcessWashingCooling
I


Σ
0.0640.0330.0260.00050.0130.0650.0140.019
0.1360.0790.019
0.234
II


Σ
0.0600.0340.0240.0200.0120.0640.0160.023
0.1500.0800.023
0.253
III


Σ
0.0580.0350.0210.0170.0100.0770.0040.026
0.1410.0810.026
0.248
Table 9. Ingredients CF.
ComponentCF [kg CO2/kg Component]Source Data
milk1.14–2.5[73]
cream2.4[74]
skimmed milk powder9.9[75]
butter9.4[76]
sugar0.45–0.63[77]
glucose syrup powder1[78]
dextrose0.62[79]
inulina40[80]
oligofructose*-
stevia sweetener0.24–0.31[81,82]
* data not available.
Table 10. CF calculated for three ice cream recipes.
RECIPEIIIIII
CF components2.3862.2034.388
CF production0.2340.2530.248
CF total2.6202.4574.636
Disclaimer/Publisher’s Note: The statements, opinions and data contained in all publications are solely those of the individual author(s) and contributor(s) and not of MDPI and/or the editor(s). MDPI and/or the editor(s) disclaim responsibility for any injury to people or property resulting from any ideas, methods, instructions or products referred to in the content.

