Article

Financial and Logistical Service Strategy of Third-Party Logistics Enterprises in Cross-Border E-Commerce Environment

College of Transportation Engineering, Dalian Maritime University, Dalian 116026, China
*
Author to whom correspondence should be addressed.
Sustainability 2023, 15(8), 6874; https://doi.org/10.3390/su15086874
Submission received: 20 February 2023 / Revised: 6 April 2023 / Accepted: 17 April 2023 / Published: 19 April 2023

Abstract

:
As competition in the cross-border logistics-service market intensifies and demand rises, enterprises with third-party logistics (3PL) combine logistical and financial services to provide comprehensive services. This study considers a secondary supply chain consisting of a cross-border e-commerce enterprise and a 3PL enterprise. When cross-border e-commerce enterprises lack funds, 3PL enterprises can provide them with inventory pledge loans. Thus, we establish a Stackelberg game model between the abovementioned parties. We consider the stochastic fluctuation of exchange rate and demand, establish a combined decision model of the logistics-service level and financial service pledge rate of the 3PL enterprise when logistics services affect offshore market demand, and prove the existence of an optimal solution. Studies have shown that the optimal logistics-service level and pledge rate increase with an increase in import tariffs and logistics sensitivity coefficients in offshore markets. Meanwhile, they decrease with an increase in the capability coefficient of 3PL enterprises, exchange rate fluctuation, default rate, and price sensitivity factor in offshore markets. In addition, the more capable 3PL enterprises are, the greater the expected profitability of the entire supply chain. We also utilize authentic data to verify the abovementioned inference and establish its validity.

1. Introduction

As an emerging trade model, the cross-border e-commerce system features online transactions, noncontact delivery, and other advantages. It is thus a vital force that stabilizes foreign trade, especially in the current economy influenced by COVID-19. The development of the cross-border e-commerce system involves issues such as high freight rates, long transportation times, and low service levels [1]. Overseas warehouses are essential for cross-border e-commerce enterprises in order to carry out localized operations outside of China. In recent years, the state has strongly supported overseas warehouses as crucial measures to stabilize foreign trade. According to statistics, over 2000 overseas warehouses have been built in China, thereby creating a new infrastructure that promotes the development of China’s cross-border e-commerce system and expands its offshore markets. In this study, we consider a third-party logistics (3PL) enterprise that provides logistical and financial services to a cross-border e-commerce enterprise that is short on capital.
The overseas warehouse model involves hoarding operations, as a shortage of funds is a common problem among cross-border e-commerce enterprises. Financial services provide a complex financial intermediation by generating an annual revenue of USD 5T to match the sources and uses of USD 262T in funds globally. In terms of the share of this revenue, retail banking (35%); corporate and commercial banking (30%); wealth management, asset management, and investment banking (18%); payments (14%); and financial market infrastructure (3%) constitute the five major financial services [2]. Sathaporn et al. propose a systematic framework and simulation analysis for designing operations and infrastructure for modern customs and cross-border transport [3]. Cross-border e-commerce enterprises face difficulties obtaining loans directly from banks because of the lack of credit collateral certificates and their immature business development. The supply chain finance system led by the supply chain enterprises currently provides a new financing option [4]. As the competition in the cross-border logistics-service market intensifies and the overseas logistics demand rises, the supply chain enterprises have also been growing and increasing their capital strength. As important partners of cross-border e-commerce enterprises, supply chain enterprises provide not only logistical services for their product sales process but also financial services such as inventory pledge loans by virtue of their advantage of mastering all the logistical activities of enterprises [5,6]. For example, the international logistics giant UPS provides financial services to downstream customers [7]. SF has established a set of supply chain financial service systems for warehouse financing and leasing in China [8]. The enterprises 4PNT, Barn Overseas Warehouse, and Cloudway Logistics combine logistics and financial services into one through an overseas warehouse financing mode, providing comprehensive services such as intelligent logistics and supply chain finance. Mabula JB et al. reveal the significant positive impact of financial literacy on financial access and firm performance. Their results also reveal that access to financial services has a significant positive direct impact on the actual use of financial services and that the use of such services exerts a significant positive effect on firm performance [9]. How do 3PL enterprises respond to the high market requirements for cross-border logistics? How can the risk of a supply chain finance business be controlled? How can a combined strategy of ‘logistics + finance’ be developed? These urgent issues require immediate resolution.

2. Literature Review

2.1. Supply Chain Finance

In recent years, supply chain finance has become a popular academic research topic. Based on the single- and dual-channel models of credit financing of retailers in the supply chain, Wang et al. construct a model of the intensity of credit default risk contagion amongst supply chain enterprises under different credit financing models and investigate the influencing factors of credit risk contagion amongst supply chain enterprises and their mechanisms of action through a computational simulation system [10]. Chen et al. investigate an extended supply chain model with a supplier, a budget-constrained retailer, a bank, and a 3PL firm, in which the retailer has an insufficient initial budget and may borrow or obtain trade credit from either a bank (traditional role) or a 3PL firm (control role) [11]. Yi et al. argue that the financing efficiency of China’s enterprises for environmental protection can be improved by implementing changes at the fund management level, strengthening research and development investment, encouraging the effectiveness of technological progress, and actively promoting supply chain financing modes [12]. The formation of a healthy network ecosystem and the adoption of modern financial technology contribute to the development of supply chain finance, which is mainly aimed at bearing the social responsibility of sustainable development in the long term [13]. Wang et al. develop a supply chain finance adoption model to investigate the key drivers and corresponding outcomes of supply chain finance adoption decisions [14]. Frye et al. quantify the degree of volatility in the value of pledged inventory and develop a pledge rate decision model that takes default into account [15]. Cossin et al. examine the decision on discount rates for bank pledges when corporate default rates are exogenous [16]. Inventory pledge financing not only solves the financing difficulties for small and medium-sized enterprises (SMEs), but also opens up business channels for banks [17]. Meanwhile, the financing approach led by supply chain firms has begun to gradually emerge at the local and international levels [18]. Ma et al. investigate the financing strategies of supply chain firms in the context of competition among suppliers facing financial constraints [19]. Wang et al. apply the stochastic game model of the Moran process with selection differences to solve the strategy selection problem of whether to provide financial services to supply chain enterprises [20]. Liu et al. conclude that supply chain enterprises can maximize their value and that of the entire supply chain in the value-added game only by developing innovative financial services that meet changing market demand [21]. Yi discusses how Chinese cross-border supply chain enterprises can use ‘blockchain + cross-border supply chain finance’ technology in the future to help small and medium-sized cross-border e-commerce enterprises integrate into the ‘Belt and Road’ construction [22]. Financial literature mainly focuses on the comprehensive investment decisions of an enterprise, which can affect its production capacity and debt decisions. Therefore, from a perspective different from ours, this literature implicitly studies the comprehensive operational and financial decisions of an enterprise, and considers decision making that aims to maximize the overall benefit of the supply chain. Furthermore, few studies have investigated supply chain finance in the context of cross-border e-commerce, and those few are mainly qualitative. Therefore, the study of cross-border financial services, taking into account uncertain factors such as exchange rates and tariffs, is also one of the main characteristics of our paper.

2.2. Logistics-Service Level of 3PL Enterprises

Another approach related to the current work is the study of decision making at the logistics-service level of 3PL enterprises. Li et al. explore how 3PL firms with different strategic orientations gain competitive advantage through market practices [23]. Cao et al. construct a Stackelberg game model between a financially constrained logistics-service provider (LSP) and a well-funded logistics-service integrator (LSI) and discuss hybrid cost-sharing and revenue-sharing contracts on the intelligence level of logistics services, the profits of supply chain members, and the channel for logistics-service demand [24]. Quality logistics service is an effective means of increasing customer loyalty, expanding market share, and enhancing competitiveness [25]. Numerous scholars at home and abroad have proved the important impact of the logistics-service level on business operations. Xu et al. investigate the relationship between the attributes of network structure, sensing capability, and the performance growth of logistical service integrators for logistics-service supply chains [26]. As the 3PL industry continues to grow, the optimal selection of 3PL service providers has become a challenging task because of the large pool of qualified 3PL enterprises and the variety of their service offerings [27]. Van et al. suggest that differentiated logistics services should be provided to customers with different behaviors [28]. In addition to traditional logistics services, Gunasekaran A et al. found that logistical capabilities significantly affect the performance of supply chain enterprises in the e-commerce context [29]. Zhang et al. build two parallel competition logistics-service supply chain models based on the interchain Nash competition and the Stackelberg game of the chain members [30]. Compared with the traditional e-commerce market, the cross-border e-commerce market requires faster logistics delivery, broader areas, and more accurate information. Ding F et al. analyze the optimal product pricing and logistics-service levels under centralized and decentralized decision-making systems when cross-border e-commerce platforms provide differentiated services in a competitive environment [31]. When it comes to research on logistics services, existing literature tends to focus more on how 3PL enterprises can improve their logistics services to increase their competitiveness, or on how to balance logistics and financial service strategies. As cross-border e-commerce is an increasingly booming industry, providing integrated ‘logistics + finance’ services to cash-strapped cross-border e-commerce companies is a hot research topic for the future. Our article preliminarily addresses this issue.
Most of the existing literature focuses on the financing equilibrium and coordination strategies of traditional 3PL. Few quantitative studies have investigated cross-border e-commerce-related issues in the new retail model. Moreover, fewer studies have considered cross-border contextual characteristics such as exchange rates, foreign demand fluctuations, and tariff policies. These factors significantly influence the development of the financial logistics strategies of 3PL enterprises. Unlike the existing literature, the current study considers the aforementioned characteristics in the cross-border e-commerce environment and discusses a combination strategy of logistics and financial services for 3PL enterprises in different offshore markets. Section 2 of this paper describes the problem of a cross-border e-commerce enterprise and a supply chain enterprise constituting a secondary supply chain. A Stackelberg game model is established accordingly. In this model, supply chain enterprises are the leaders deciding the level of logistics services provided l and the pledge rate of financial services ω whilst cross-border e-commerce enterprises act as followers, setting the supply volume to target foreign markets. Section 3 presents the analysis of the supply volume of cross-border e-commerce enterprises with financial constraints to foreign markets and the expected profits of both parties. Section 4 provides an analysis of the impact of key factors on decision making. Section 5 describes the validation of the model through numerical simulation for the analysis of the impact of exchange rate fluctuations on the equilibrium decision. Section 6 summaries the conclusions of the study.

3. Problem Description and Basic Assumption

3.1. Problem Description

In this study, we consider a secondary supply chain that consists of a cross-border e-commerce enterprise and a 3PL enterprise and faces random fluctuations in exchange rates and offshore market demand. Here, the initial capital of the cross-border e-commerce enterprise is M . When the planned supply volume is large and the capital is insufficient to pay for the product purchase, the cross-border e-commerce enterprise can choose to apply for an inventory pledge loan from the 3PL enterprise. The cross-border e-commerce enterprise and 3PL enterprise comprise the Stackelberg game, in which the latter is the leader deciding the level of logistics services l and the financial service pledge rate ω . Cross-border e-commerce enterprises act as followers that set the supply volume to target offshore markets. At the beginning of the sales season, when the cross-border e-commerce enterprise’s capital is insufficient to achieve the optimal supply quantity, it first orders product q 0 with its capital and then applies for a loan for reordering from the 3PL enterprise with part of product q m . During the sales season, the cross-border e-commerce enterprise prioritizes the sale of pledged goods on the commerce platform, and the 3PL enterprise provides logistics services l for warehousing and transportation. At the end of the sales quarter, if the sales revenue of the cross-border e-commerce enterprise is greater than the principal and interest of the loan, then the loan is repaid. Otherwise, it defaults at its default rate, and the revenue from the sale of the pledged items and remaining inventory go to the 3PL enterprise. Figure 1 shows the schematic of the proposed model.

3.2. Model Assumption and Summary of Notation

This study assumes that banks consistently grant credit to 3PL enterprises, are no longer involved in specific inventory pledge decisions, and only receive the corresponding unit rate r . In our model, the cross-border e-commerce enterprise uses a one-time static pledge, and the sales revenue for the pledged goods at the end of the pledge period is pooled in a closed account set up by the bank for the 3PL enterprise for the repayment of the loan principal and interest. The cross-border e-commerce enterprise may default only if the value of the closed account is not greater than the principal and interest of the loan. In addition, the probability of default is independent of fluctuations in exchange rates and offshore market demand. The salvage value of unsold goods is assumed to be zero, and the out-of-stock cost is negligible.
The product market satisfies the typical newsvendor model, in which the price of the product is constant over the sales cycle and the market demand fluctuates randomly. In this study, which considers Mills’ assumptions on a demand function and the influence of exchange rate fluctuations [32], we let the offshore market demand of the cross-border e-commerce enterprise meet D = ε α p e , where ε is the offshore market base demand as a random variable, α > 0 is the offshore market price sensitivity coefficient, p is the price of the product in local currency, and the actual price faced by overseas consumers is the foreign currency price after exchange rate conversion e p . Thus, the uncertain market demand function D ( e p , ε ) consists of two random variables, namely the exchange rate e and underlying demand ε . In practice, the exchange rate itself generally does not follow a normal distribution, but when considered on a monthly basis, exchange rate fluctuations tend to follow a normal distribution [33]. Due to the complexity and instability of the external environment, demand is often random [34], assuming that both e and   ε are independent random variables following a normal distribution with additive properties. For the modelling analysis, the distribution function and probability density of the transformed uncertainty market demand D are assumed to be F ( D ) and f ( D ) , respectively.
The logistics-service level l ( l [ 0 , ) ) can be regulated and improved to increase the demand for cross-border e-commerce enterprises in the offshore market. l = 0 represents the industry standard for logistics-service levels, that is, the minimum level of logistics services to be maintained by 3PL enterprises as per industry standards. Considering the impact of logistics services on market demand and consumer repurchase rates [35,36], this study uses ( 1 + β l ) D to denote actual market demand and β > 0 as the logistics sensitivity coefficient for offshore markets. The model symbols are defined as follows:
Summary of Notation
M Own funds used by the cross-border e-commerce enterprise to place orders at the beginning of the period.
q 0 The number of products ordered by the cross-border e-commerce enterprise using its own funds.
q m The amount of inventory pledged by the cross-border e-commerce enterprise, 0 <   q m   <   q 0 .
Q The total supply volume of the cross-border e-commerce enterprise to offshore markets.
T The sales and loan cycle of the merchandise.
p The selling price of the pledge in local currency.
ω Pledge rate as a decision variable, where 0 ω 1 ; the amount of loans provided by the 3PL enterprise is ω p q m .
l The level of logistics services provided by the 3PL enterprise as a decision variable.
R Interest rates on inventory pledge loans; ω p ( 1 + R T ) q m is the total revenue (principal and interest sum) of financial services for the 3PL enterprise. As the principal and interest due on the loan are not higher than the maximum value of the pledge, ω p ( 1 + R T ) q m p q m , then
ω 1 1 + R T = ω m a x
r The interest rate charged by the bank to the 3PL enterprise, r < R . ω p ( 1 + r T ) q m is the cost of capital for the 3PL enterprise.
D The market demand when the logistics services are at the lowest level for the industry, consisting of the exchange rate e and base demand ε . The distribution function and probability density are F ( D ) and f ( D ) , respectively.
η The 3PL enterprise’s capability coefficient, which is a comprehensive assessment of the indicators that make up the enterprise’s capability (i.e., a comprehensive, integrated, and high-level overview of the enterprise’s capability) [37]. A smaller η denotes higher capability.
α The offshore market price sensitivity coefficient.
β The logistics sensitivity coefficient for offshore markets.
C ( l ) The logistics cost per unit product of the 3PL enterprise. Drawing on the study by Xie et al., we denote C ( l ) = K + ( η 2 ) l 2 , where K is a fixed cost and ( η 2 ) l 2 is a variable cost [38]. Logistics cost and service level have the following relationships: (1) service cost C ( l ) increases with service level l , and the marginal cost increases; (2) the stronger the capability of the 3PL enterprise, the smaller the rate of incremental marginal cost.
p l The price of logistics services per product unit for the 3PL enterprise. As the logistics cost cannot exceed the logistics-service price, C ( l ) p l , we have
l 2 ( p l K ) η = l m a x
p c The unit product cost of the cross-border e-commerce enterprise.
θ Default rate of the cross-border e-commerce enterprise.
e Exchange rate of local and foreign currencies as a random variable.
t Import tariff rates for target offshore markets.
h Cost of loans pledged by the 3PL enterprise per unit of inventory, h = ω p ( 1 + r T ) .
H Loan revenue from inventory pledged by the 3PL enterprise per unit, H = ω p ( 1 + R T ) , where p > H > h .

4. The Model

4.1. Cross-Border E-Commerce Enterprise’s Supply Volume Model

When the exchange rate and offshore market demand fluctuate randomly, the 3PL enterprise provides logistics services to the cross-border e-commerce enterprise with logistics-service level l and logistics-service price p l . It offers financial services with a pledge rate ω and an interest rate R . The profit function at the end of the quarter is
π e ( D ) = p m i n { ( 1 + β l ) D , Q } ( p c + p l ) ( 1 + t ) Q ω p R T q m
The expected profits of the cross-border e-commerce enterprise are
E π e ( D ) = 0 Q / ( 1 + β l ) p ( 1 + β l ) D f ( D ) d D + Q / ( 1 + β l ) + p Q f ( d D ( p c + p l ( 1 + t ) Q ω p R T q m
The optimal supply volume of the cross-border e-commerce enterprise to offshore markets is
Q * = ( 1 + β l ) F ¯ 1 [ ( p c + p l ) ( 1 + t ) p ]

4.2. Decision-Making Model for the 3PL Enterprise When the Cross-Border E-Commerce Enterprise Is Undercapitalized

4.2.1. Revenue Function of the Supply Chain Enterprise’s Financial Services

According to the hypothesis, this study only considers the case of the cross-border e-commerce enterprise with insufficient capital: M < p c Q * . Specifically, the enterprise first orders q 0 units of products with its funds M . To solve the capital problem, it pledges part of the product q m to the 3PL enterprise to apply for loans for reordering. The 3PL enterprise provides financial services at a pledge rate ω and a loan rate R and collects the principal and interest on the loan at the end of the sales quarter. As the inventory held by the 3PL enterprise is q m , the cash flow in the closed account at the end of the sales quarter is
π = p min { ( 1 + β l ) D ,   q m }
As the financial service returns of the 3PL enterprise do not exceed the pledged returns, the profit function of its financial services is
π l f = min { p min { ( 1 + β l ) D , q m } , H q m } h q m
For the cut-off point of the revenue function of the 3PL enterprise’s financial services, let p min { ( 1 + β l ) D ,   q m } h q m = H q m h q m . This cut-off point is noted as D 1 , where D 1 = H q m ( 1 + β l ) p .

4.2.2. Decision Model of the Pledge Rate and Logistics-Service Level of the 3PL Enterprise

Given market demand D ϵ ( 0 ,   ) and using the cut-off point, the definition domain of the revenue function of the 3PL enterprise’s financial services is divided into two cases:
① When market demand D ϵ ( 0 ,   ) is smaller than the inventory pledge volume, D < D 1 < q m , the cross-border e-commerce enterprise has two choices. The first one is to choose to default with its own default rate θ . At this point, the 3PL enterprise’s financial service benefit is
π l f ( 1 ) ( ω , l ) = p ( 1 + β l ) D h q m
The second choice is to keep the contract at its own compliance rate 1 θ . At this point, the 3PL enterprise’s financial service benefit is
π l f ( 2 ) ( ω , l ) = ( H h ) q m
② When the cash flow in the closed account D ϵ ( D 1 ,   ) is sufficient to repay the principal and interest of the loan, the cross-border e-commerce enterprise must choose to keep the contract. In this case, the 3PL enterprise has no risk. The revenue function is the same as that in Equation (6).
Considering the two cases ① and ② and using Equations (4)–(6), we obtain the expected profit function of the 3PL enterprise’s financial services as
E [ π l f ( ω , l ) ] = θ 0 D 1 π l f ( 1 ) f ( D ) d D + ( 1 θ ) 0 D 1 π l f ( 2 ) f ( D ) d D + D 1 π l f ( 2 ) f ( D ) d D
Simplifying Equation (7), we obtain
E π l f ( ω , l ) = ( H h ) q m θ p ( 1 + β l ) 0 D 1 F ( D ) d D  
The profit of the 3PL enterprise consists of logistics and financial service profits.
max 0 ω ω max 1 l l max E [ π 1 ( ω ,   l ) ] = π l s + π l f = [ p l C ( l ) ] Q + ( H h ) q m θ p ( 1 + β l ) 0 D 1 F ( D ) d D
Equation (9) is the decision model of the pledge rate and logistics-service level of the 3PL enterprise when the cross-border e-commerce enterprise is undercapitalized.

5. Model Analysis

Given the above model, we solve the logistics-service level and pledge rate when the 3PL enterprise provides ‘logistics + finance’ service and expects profit maximization. We also analyze their relationship with tariffs, the default rate of the cross-border e-commerce enterprise, the capability coefficient of the 3PL enterprise, and the logistics coefficient of service sensitivity. Conclusions are then derived from the results.
Theorem 1.
When the cross-border e-commerce enterprise has capital constraints, E [ π l ( ω , l ) ] is a joint concave function of the pledge rate and logistics-service level ( ω ,   l ) .
Proof. 
As shown in Equation (3), the supply quantity of the cross-border e-commerce enterprise can be regarded as a function of the logistics-service level l . The first-order partial derivatives of the pledge rate ω and logistics-service level l for Equation (9) are obtained as follows:
E [ π l ( ω , l ) ] ω = [ ( R r ) T θ ( 1 + R T ) F ( D 1 ) ] p q m
E [ π l ( ω , l ) ] l = η l Q + [ p l C ( l ) ] Q + θ p β [ D 1 F ( D 1 ) 0 D 1 F ( D ) d D ]
Here,
Q = Q l = β F ¯ 1 [ ( p c + p l ) ( 1 + T ) p ]
For E [ π l ( ω , l ) ] , the second-order partial derivatives for ω and l , respectively, are
2 E [ π l ( ω , l ) ] ω 2 = θ p [ ( 1 + R T ) q m ] 2 f ( D 1 ) 1 + β l
2 E [ π l ( ω , l ) ] l 2 = η Q 2 η l Q θ p β 2 D 1 2 f ( D 1 ) 1 + β l
The second-order partial derivatives are obviously less than 0. Therefore, to prove the joint concavity E [ π l ( ω , l ) ] concerning ω and l , we establish the following equation:
2 E [ π l ( ω , l ) ] ω 2 2 E [ π l ( ω , l ) ] l 2 2 E [ π l ( ω , l ) ] ω l 2 E [ π l ( ω , l ) ] l ω
where the mixed partial derivatives are
2 E [ π l ( ω , l ) ] ω l = 2 E [ π l ( ω , l ) ] l ω = θ β ( 1 + R T ) p q m D 1 f ( D 1 ) 1 + β l
Substituting Equations (12), (13) and (15) into Equation (14) and simplifying, we obtain
[ θ β ( 1 + R T ) p q m D 1 f ( D 1 ) 1 + β l ] 2 + θ p ( η Q + 2 η L Q ) [ ( 1 + R T ) q m ] 2 f ( D 1 ) 1 + β l [ θ β ( 1 + R T ) p q m D 1 f ( D 1 ) 1 + β l ] 2
As θ p ( η Q + 2 η L Q ) [ ( 1 + R T ) q m ] 2 f ( D 1 ) 1 + β l 0 , Equation (14) is established whilst E [ π l ( ω , l ) is the joint concave function of the pledge rate ω and logistics-service level l . Theorem 1 is thus proved. □
Theorem 2.
The optimal pledge rate and level of logistics services provided by the 3PL enterprise respectively exist as ω * = m a x ( 0 , min ( ω ¯ , ω m a x ) ) and l * = m a x ( 0 , min ( l ¯ , l m a x ) ) , where ω ¯ and l ¯ are determined by Equation (16):
{ ω ¯ = ( 1 + β l ¯ ) D 1 ( 1 + R T ) q m l ¯ = 1 9 β 2 + 2 ( p l + K ) 3 η + 2 θ [ D 1 F ( D 1 ) 0 D 1 F ( D ) d D ] 3 η F ¯ 1 [ ( p c + p l ) ( 1 + t ) p ] 1 3 β
where
D 1 = m a x ( F 1 [ ( R r ) T θ ( 1 + R T ) ] , 0 )
Proof. 
From Theorem 1, we know that E [ π l ( ω , l ) is a joint concave function with respect to ( ω , l ) ; thus, there exists a maximal value. Let Equations (10) and (11) equal 0 and solve the system of cubic equations to obtain the extreme value point ( ω ¯ , l ¯ ) .
Equation (10) is set to 0 and simplified as F ( D 1 ) = ( R r ) T θ ( 1 + R T ) . As D 1 = ω ( 1 + R T ) q m 1 + β l 0 , the solution is ω ¯ = ( 1 + β l ¯ ) D 1 ( 1 + R T ) q m , where D 1 = m a x ( F 1 [ ( R r ) T θ ( 1 + R T ) ] , 0 ) .
Letting Equation (11) be 0 and simplifying it yields
3 2 η β F ¯ 1 [ ( p c + p l ) ( 1 + t ) p ] l 2 + η F ¯ 1 [ ( p c + p l ) ( 1 + t ) p ] l ( p l K ) β F ¯ 1 [ ( p c + p l ) ( 1 + t ) p ] θ p β [ D 1 F ( D 1 ) 0 D 1 F ( D ) d D ] = 0
The above equation is a quadratic equation with respect to l . It is solved using the root formula.
Let a = 3 2 η β F ¯ 1 [ ( p c + p l ) ( 1 + t ) p ] , b = η F ¯ 1 [ ( p c + p l ) ( 1 + t ) p ] ,
c = ( p l K ) β F ¯ 1 [ ( p c + p l ) ( 1 + t ) p ] θ p β [ D 1 F ( D 1 ) 0 D 1 F ( D ) d D ] .
We can easily ascertain that a , b > 0 and that the positive or negative value of c depends on [ D 1 F ( D 1 ) 0 D 1 F ( D ) d D ] ; letting it be H ( D 1 ) gives d H ( D 1 ) d D 1 = D 1 f ( D 1 ) > 0 . H ( D 1 ) monotonically increases relative to D 1 . In addition, because D 1 > 0 , H(0) = 0; thus, H ( D 1 ) = D 1 F ( D 1 ) 0 D 1 F ( D ) d D > 0 , c < 0 . Then, Δ = b 2 4 a c > 0 , and the equation has two different solutions: l 1 , 2 = b ± Δ 2 a and l > 0 . Discarding the negative values yields
l = b ± Δ 2 a = 1 9 β 2 + 2 ( p l + K ) 3 η + 2 θ p [ D 1 F ( D 1 ) 0 D 1 F ( D ) d D ] 3 η F ¯ 1 [ ( p c + p l ) ( 1 + t ) p ] 1 3 β
In sum, the extreme value point of E [ π l ( ω , l ) ] is
{ ω ¯ = ( 1 + β l ¯ ) D 1 ( 1 + R T ) q m l ¯ = 1 9 β 2 + 2 ( p l K ) 3 η + 2 θ p [ D 1 F ( D 1 ) 0 D 1 F ( D ) d D ] 3 η F ¯ 1 [ ( p c + p l ) ( 1 + t ) p ] 1 3 β
where D 1 = m a x ( F 1 [ ( R r ) T θ ( 1 + R T ) ] , 0 ) .
As 0 ω ω m a x , 1 l l m a x ; therefore, the optimal strategy for the logistics enterprise is
ω * = max ( 0 , min ( ω ¯ , ω m a x ) ) , l * = m a x ( 1 , min ( l ¯ , l m a x ) ) . Theorem 2 is proved. □
Theorems 1 and 2 prove that under the assumptions of this study, when the cross-border e-commerce enterprise has capital constraints and chooses inventory pledge loans, the existence and uniqueness of the ‘logistics + finance’ service strategy for the 3PL enterprise, the optimal pledge rate for loan issuance, and the optimal level of logistics service should be selected.
Theorem 3.
The optimal pledge rate of the 3PL enterprise ω * and the level of logistics services l * are positively correlated with tariff rate t .
Proof. 
Let h ( t ) = F ¯ 1 [ ( p c + p l ) ( 1 + t ) p ] . The first-order derivative of h ( t ) from Equation (16) yields
d l ¯ d h ( t ) = θ p [ D 1 F ( D 1 ) 0 D 1 F ( D ) d D ] 3 η [ h ( t ) ] 2 [ A + 2 θ [ D 1 F ( D 1 ) 0 D 1 F ( D ) d D ] 3 η h ( t ) ] 1 2
d ω ¯ d h ( t ) = β p D 1 ( 1 + R T ) p c q m d l ¯ d h ( t )
where A = 1 9 β 2 + 2 ( p l K ) 3 η .
Equations (18) and (19) are less than 0. l ¯ , ω ¯ are decreasing functions of h ( t ) . h ( t ) decreases relative to t . The optimal rate of the 3PL enterprise ω * and the level of logistics services l * are positively correlated with the tariff rate t . Theorem 3 is thus proved. □
Theorem 3 illustrates the impact of the offshore tariff policy on the ‘logistics + finance’ service strategy of the 3PL enterprise. With the increase in offshore market tariffs, the level of logistics service and pledge rate provided by the 3PL enterprise increases. Specifically, the rise in tariffs increases the barriers to entry into offshore markets and raises the cost of the cross-border e-commerce enterprise, causing it to reduce the number of supplies it sends to offshore markets. This condition also leads to a loss of profit and market share for the 3PL enterprise. Therefore, the 3PL enterprise increases market demand by improving the quality of its services, that is, by providing a higher pledge rate and logistics-service level to increase market demand and to stimulate the cross-border e-commerce enterprise and thereby increase its supply to offshore markets. In this way, the impact of the tariff rate increase is mitigated.
Theorem 4.
The optimal pledge rate of the 3PL enterprise ω * and the level of logistics services l * are negatively correlated with the default rate of the cross-border e-commerce enterprise θ .
Proof. 
Let g ( θ ) = 2 θ p [ D 1 F ( D 1 ) 0 D 1 F ( D ) d D ] 3 η F ¯ 1 [ ( p c + p l ) ( 1 + t ) p ] . Finding the first-order derivative of R gives d g ( θ ) d θ = 2 p 0 D 1 F ( D ) d D 3 η F ¯ 1 [ ( p c + p l ) ( 1 + t ) p ] < 0. g ( θ ) decreases monotonically with θ . The first-order derivatives of l ¯ and ω ¯ with respect to θ are respectively obtained from Equation (16) as
d l ¯ d θ = d l ¯ d g ( θ ) d g ( θ ) d θ = 1 2 [ A + g ( θ ) ] 1 2 d g ( θ ) d θ
d ω ¯ d θ = p β ( 1 + R T ) p c q m [ d l ¯ d θ D 1 + d D 1 d θ l ¯ ]
As shown in Equation (17), D 1 is a decreasing function of θ . Therefore, Equations (20) and (21) are less than 0, that is, d l ¯ d θ < 0 and d ω ¯ d θ < 0 , respectively. Thus, ω ¯ and l ¯ are monotonically decreasing functions of θ . Theorem 4 is thus proved. □
Theorem 4 shows that the pledge rate and logistics-service level decisions of the 3PL enterprise are affected by the default rate of the cross-border e-commerce enterprise and that both decrease as the default rate increases. The higher the default rate of the cross-border e-commerce enterprise, the greater the risk faced by the 3PL enterprise, which consequently requires a significant number of pledges to control the business risk when granting the same amount of loan; hence, it provides a lower pledge rate. The reason the logistics-service level decision of the 3PL enterprise is affected by the default rate of the cross-border e-commerce enterprise is illustrated in Corollary 1.
Corollary 1.
Other things being equal, we compare the optimal levels of logistics services provided by the 3PL enterprise when the cross-border e-commerce enterprise applies for inventory pledge loans. When the default rate of the cross-border e-commerce enterprise applying for loans is θ [ 0 , θ 1 ] , the 3PL enterprise provides it with better logistics services; here, θ 1 is determined by F 1 [ ( R r ) T θ ( 1 + R T ) ] = 0 .
Proof. 
The expected profit function when the 3PL enterprise does not provide financial services to the cross-border e-commerce enterprise is as follows:
max 1 l l max E [ π l s ( l ) ] = [ p l C ( l ) ] Q * . The solution method is the same as that for Theorem 2 and is not repeated here. The solution is
l ˜ = η + η 2 + 6 η ( p l K ) β 2 3 η β = 1 9 β 2 + 2 ( p l K ) 3 η 1 3 β
Comparing l ¯ with l ˜ reveals that they differ by only one term, g ( θ ) = 2 θ p [ 0 D 1 F ( D ) d D D 1 F ( D 1 ) ] 3 η F ¯ 1 [ ( p c + p l ) ( 1 + t ) p ] 0 ; thus, l ˜ l ¯ . The equality sign holds when and only when D 1 = m a x ( F 1 [ ( R r ) T θ ( 1 + R T ) ] , 0 ) = 0 , F 1 [ ( R r ) T θ ( 1 + R T ) ] 0 . Corollary 1 is thus proved. □
Corollary 1 suggests that for the cross-border e-commerce enterprise with a default rate within a specific range, the 3PL enterprise provides pledged loans for a higher level of logistics services. As the difference term g ( θ ) between l ¯ and l ˜ is a decreasing function of θ and η , the stronger the capability of the 3PL enterprise to provide services and the better the credit level of the cross-border e-commerce enterprise, the more significant the difference in the logistics services provided by the 3PL enterprise. In this case, the cross-border e-commerce enterprise is less likely to default. Consequently, the 3PL enterprise becomes increasingly willing to improve its logistics services to encourage the cross-border e-commerce enterprise to increase its supply to offshore markets. This increased supply boosts the 3PL enterprise’s logistics revenue. This result explains why the default rate affects the logistics-service decisions of the 3PL enterprise, as in Theorem 4.
Theorem 5.
The optimal pledge rate of the 3PL enterprise ω * and level of logistics services l * are negatively correlated with the 3PL enterprise’s capability coefficient η .
Proof. 
Let B = 2 ( p l K ) 3 + 2 θ p [ D 1 F ( D 1 ) 0 D 1 F ( D ) d D ] 3 F ¯ 1 [ ( p c + p l ) ( 1 + t ) p ] ; thus, l ¯ = 1 9 β 2 + B η 1 3 β .
The first-order derivative of η from Equation (16) yields
d l ¯ d η = B 2 η 2 ( 1 9 β 2 + B η ) 1 2
d ω ¯ d η = p β D 1 ( 1 + R T ) p c q m d l ¯ d η
Equations (22) and (23) are less than 0. Theorem 5 is thus proved. □
Theorem 5 shows that the larger the capability coefficient η of the 3PL enterprise, the lower the pledge rate and logistics services provided to the cross-border e-commerce enterprise. Specifically, the higher the value of η , the lesser the capability of the 3PL enterprise, the greater the logistics cost, and the smaller the profit from providing the same level of logistics services. Thus, the less capable 3PL enterprise will be more inclined to provide a lower level of logistics services to control costs. Meanwhile, a low level of logistics services reduces the market demand of the cross-border e-commerce enterprise, and the financial service risk faced by the 3PL enterprise increases. Thus, risk must be controlled by lowering the pledge rate.
Theorem 6.
The optimal pledge rate of the 3PL enterprise ω * and the level of logistics services l * are positively correlated with the logistics sensitivity coefficient of the offshore market β .
Proof. 
The first-order derivative of β according to Equation (16) is obtained separately as
d l ¯ d β = 1 3 β 2 1 9 β 3 1 9 β 2 + B
d ω ¯ d β = p D 1 ¯ ( 1 + R T ) p c q m [ l ¯ + β d l ¯ d β ]
As B > 0 , the above two equations are obviously greater than 0; thus, ω ¯ and l ¯ are positively related to the logistics sensitivity coefficient β .
Theorem 6 is thus proved. It shows that the larger the foreign consumer’s logistics sensitivity coefficient β is, the higher the pledge rate and logistics service provided by the 3PL enterprise. Specifically, with other things being equal, when the 3PL enterprise improves the level of equivalent logistics services, the more sensitive the logistics services become, the more significant the increase in demand in offshore markets, and the more the cross-border e-commerce enterprise improves its supply to offshore markets. The 3PL enterprise also gains significant benefits from the logistics services. Meanwhile, a substantial increase in demand in offshore markets reduces the risk of pledge liquidation, prompting the 3PL enterprise to increase the pledge rate of financial services. □

6. Numerical Analysis and Discussion

As described in this section, we conduct a numerical analysis to examine the impact of several key parameters on the ‘logistics + finance’ service decisions of the 3PL enterprise and its overall expected profitability. These key parameters include tariff rate, the cross-border e-commerce enterprise’s default rate, the 3PL enterprise’s capability coefficient, the offshore market price and logistics sensitivity coefficient, and the size of exchange rate fluctuations. In this study, we assume that the logistics-service price p l of the 3PL enterprise and the sales price p of the cross-border e-commerce enterprise are exogenous and are determined by market supply and demand. Taking cross-border e-commerce in China and Mongolia as an example, this study uses the historical exchange rate values of RMB and the Mongolian tugrik for 2019–2020 published by China UnionPay as a sample of exchange rate e (as shown in Table A2 in the Appendix A). For the sample of primary demand ε (as shown in Table A4 in the Appendix A), we used 1/50,000th of the monthly import value of machinery, tape recorders, TV sets, and parts imported into Mongolia from February 2020 to January 2021 according to the CEIC database. The normality of the two datasets was verified using SPSS 22.0 (see Appendix A Table A1 and Table A3), yielding a mean value of 394.65 and a standard deviation of 16.09 for the exchange rate e and a mean value of 1747 and a standard deviation of 284.36 for the basic demand ε . Mongolia’s import duty rate for general goods under the Customs Law is 15%. In addition, the annual interest rate of 3.85% announced by China Merchants Bank in 2021 for best-pledged customers is taken as the cost of capital for the 3PL enterprise. The sales and pledging cycle T of the cross-border e-commerce enterprise is assumed to be 3 months. The other parameters are set as listed in Table 1. The following data are processed and estimated based on actual transaction data of an SME cross-border e-commerce platform in China through research.
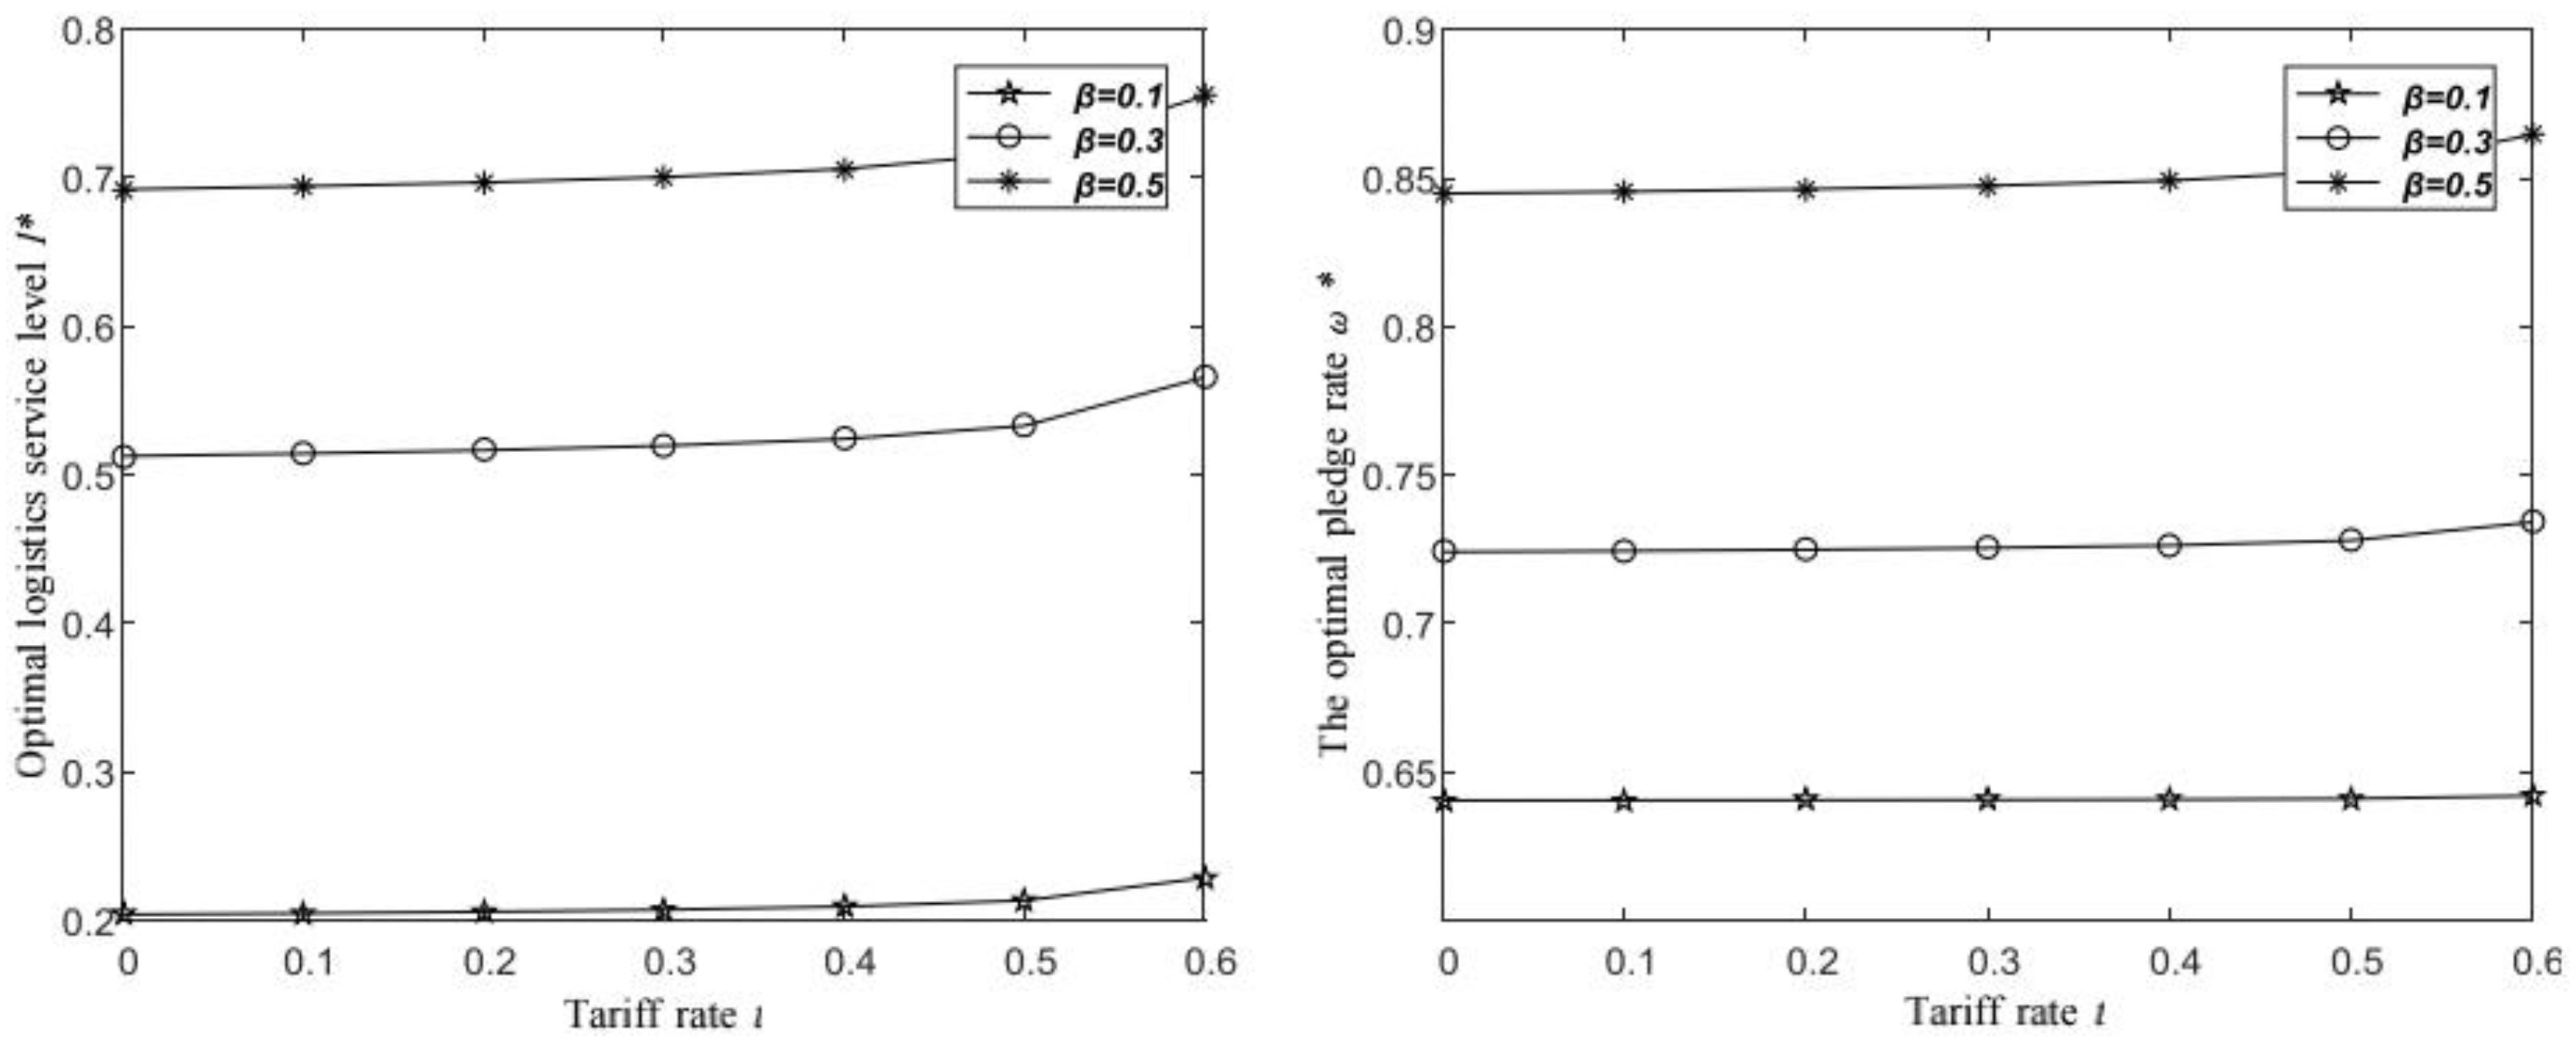
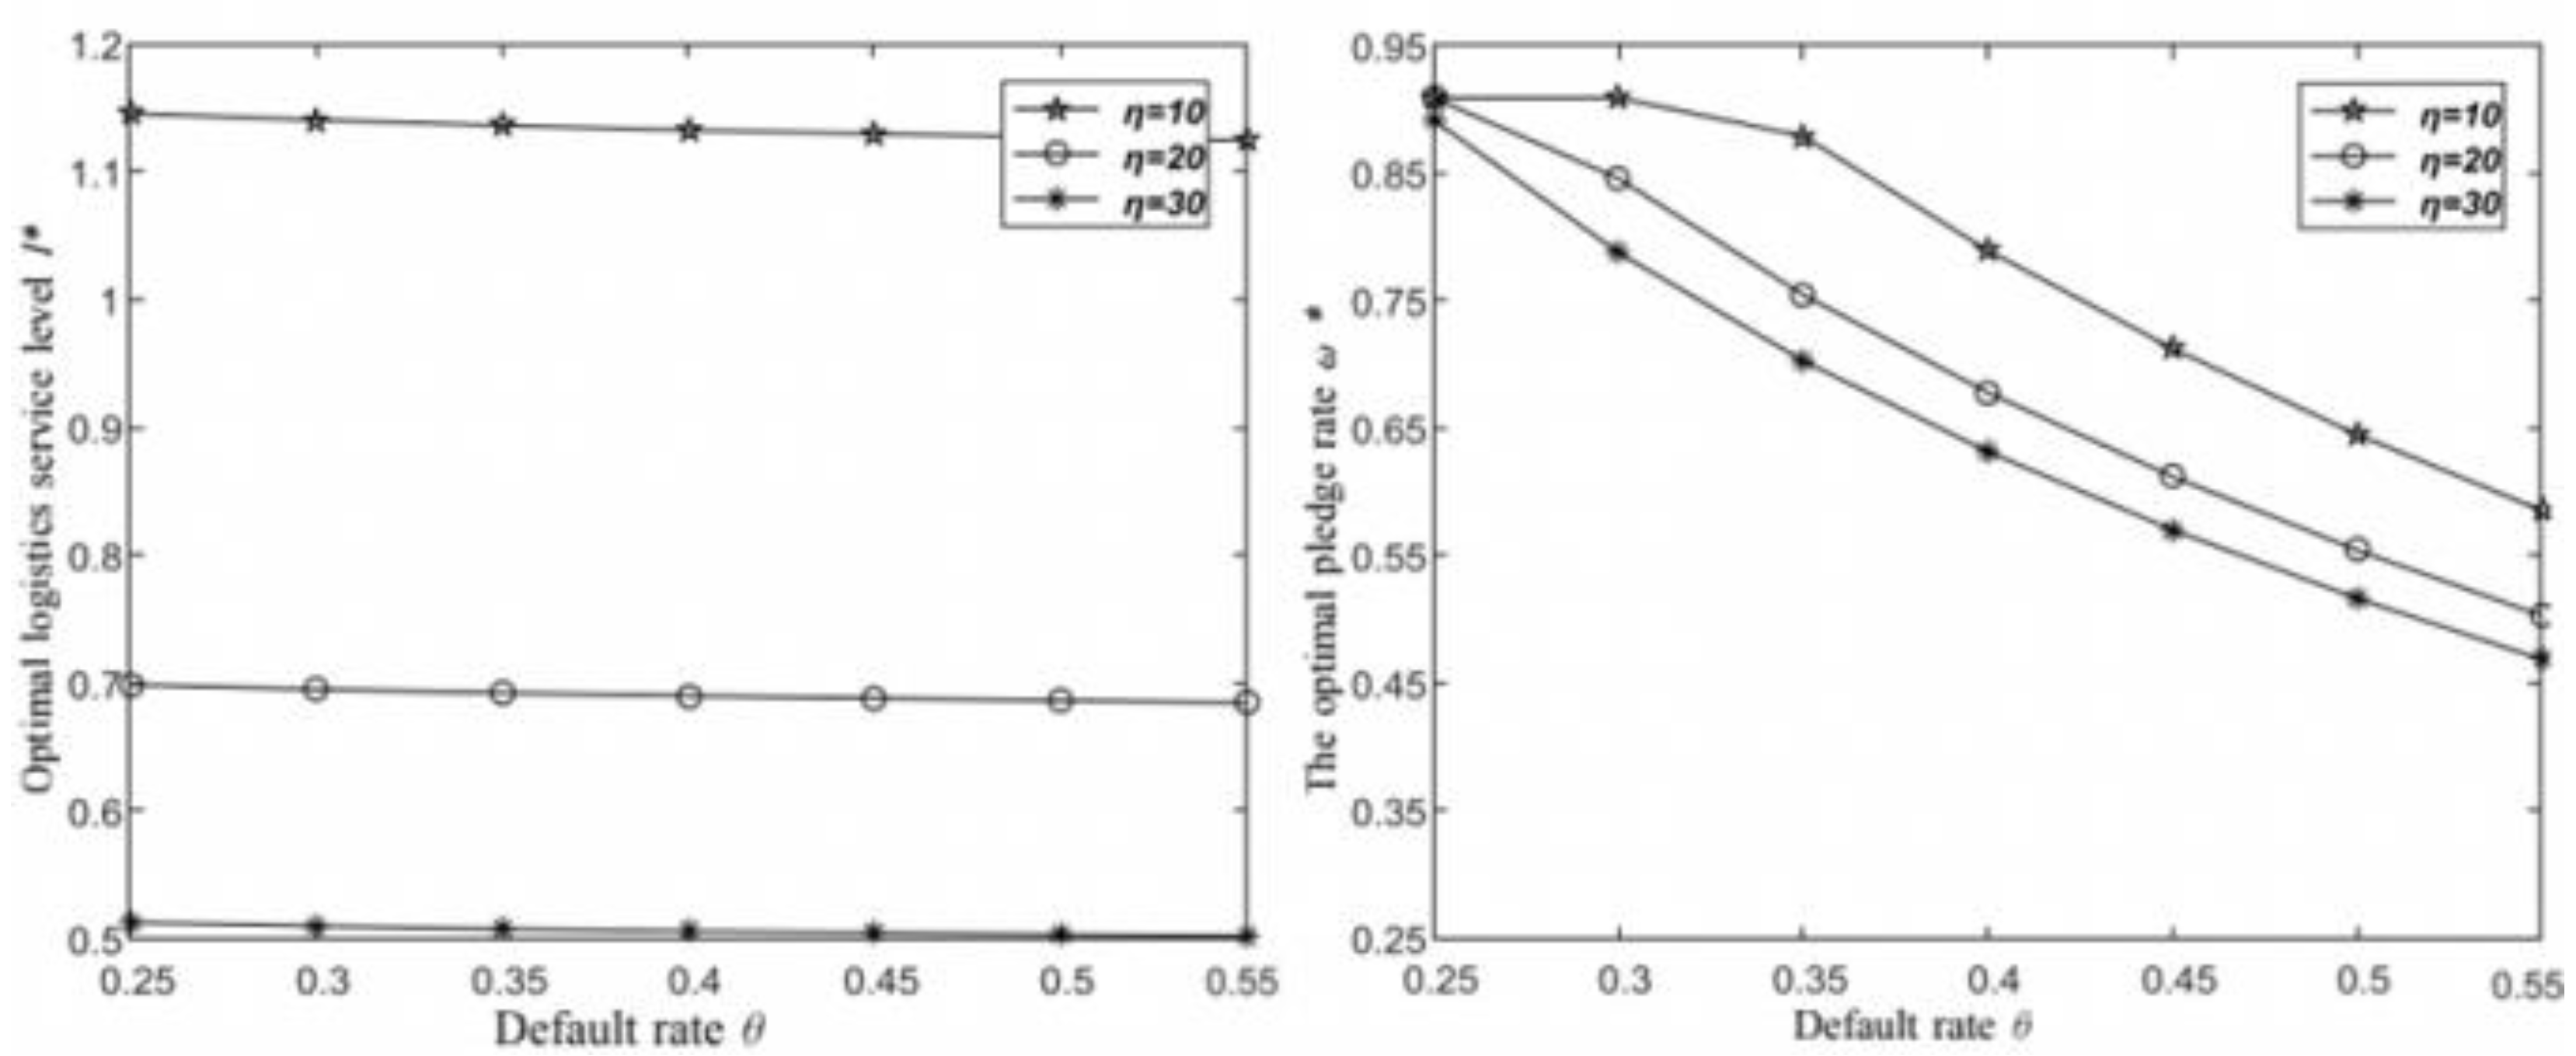
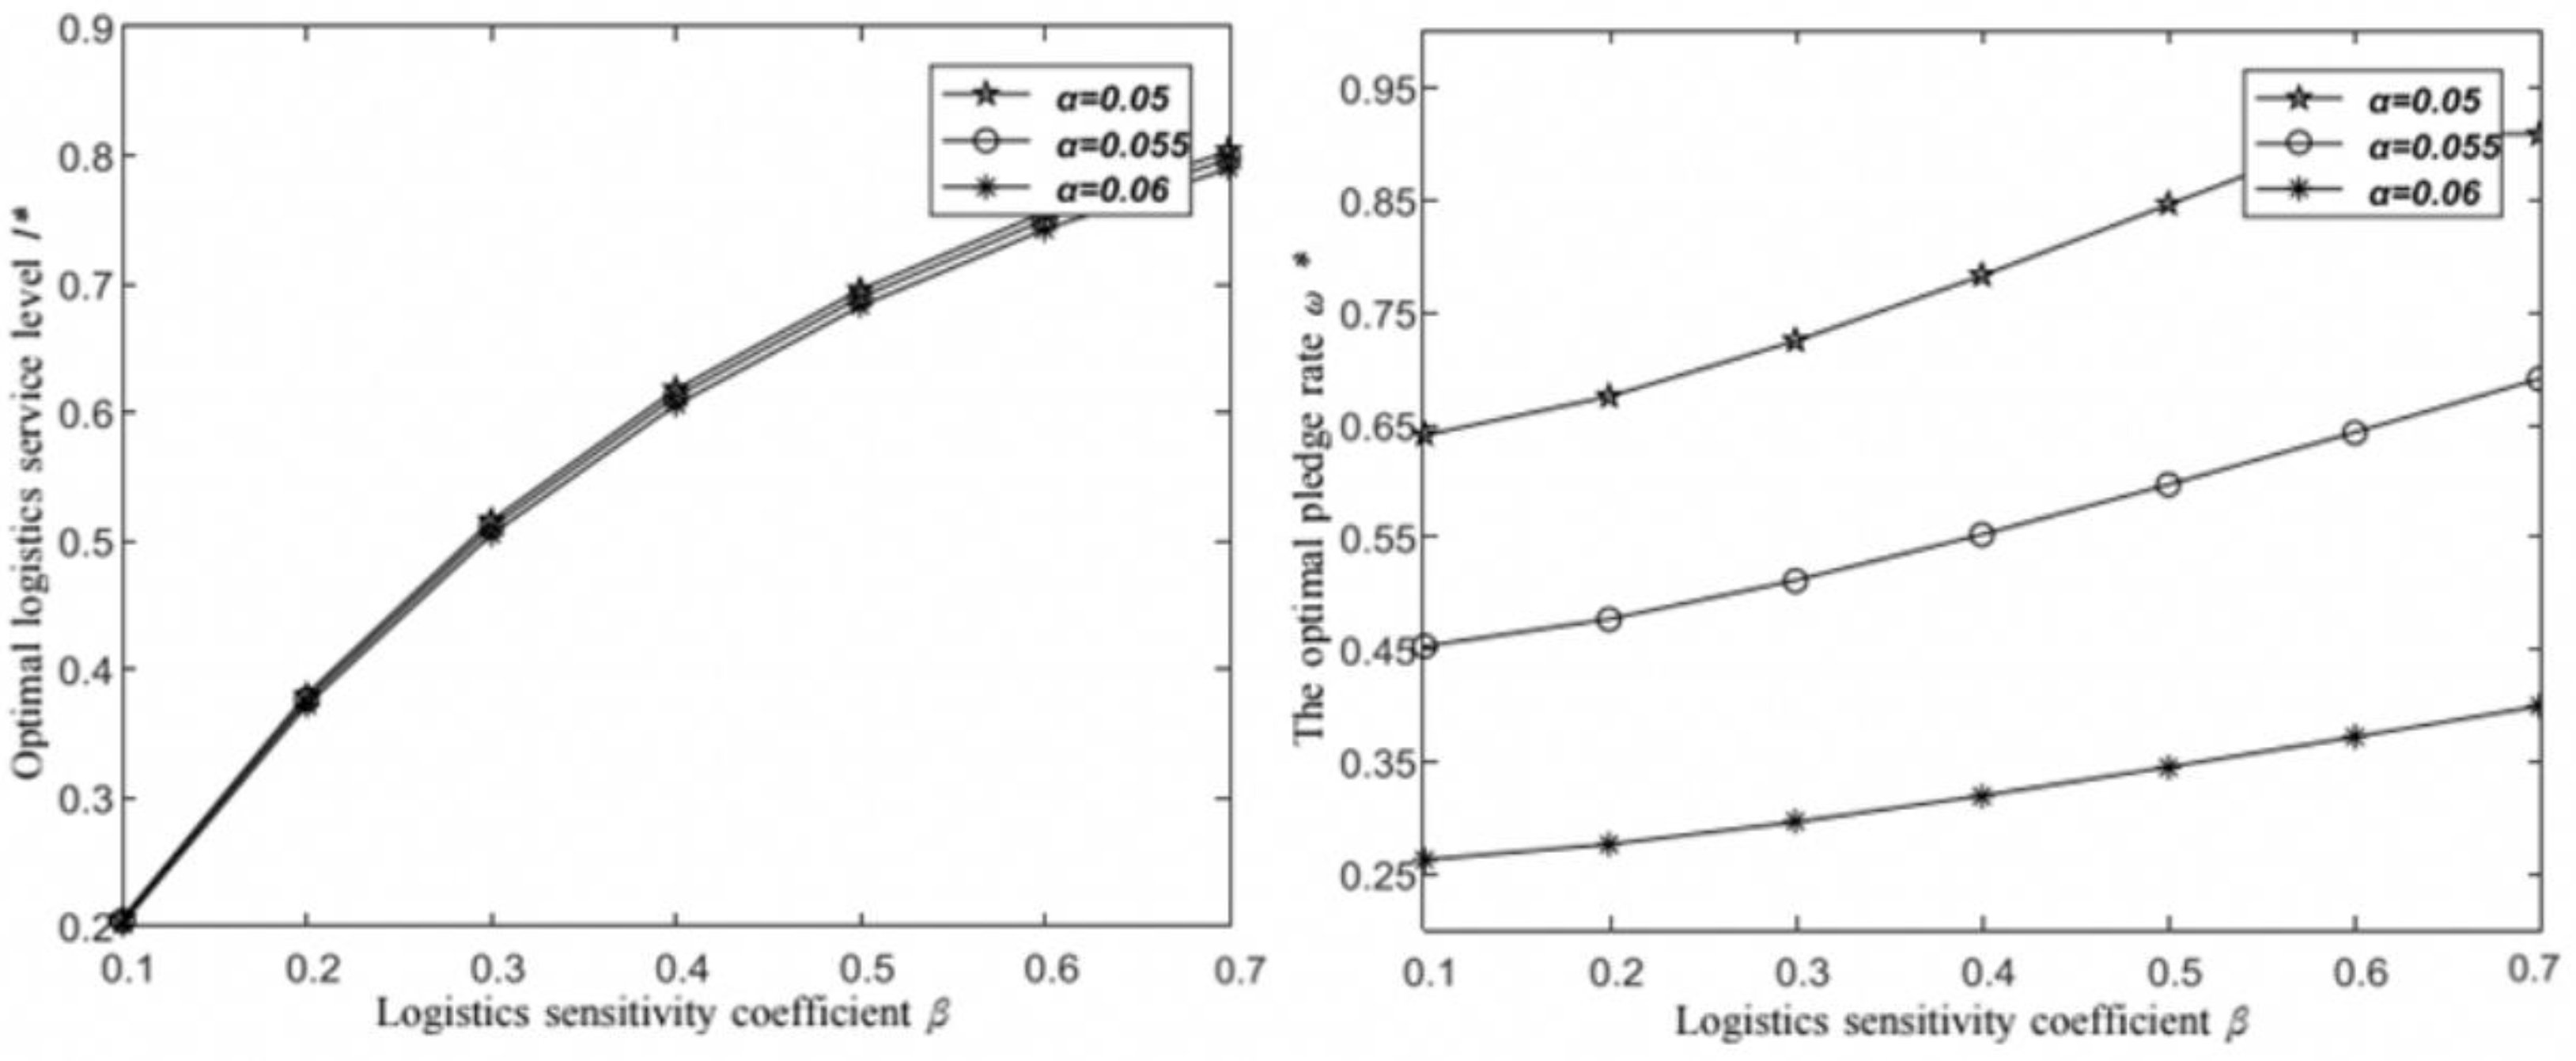
From Equations (1) and (2), we obtain the pledge rate interval as [0, 0.909] and the logistics-service level interval as [0, 2]. According to the basic parameters, the optimal logistics-service level provided by the 3PL enterprise is l * = 0.695 . The optimal supply quantity of the cross-border e-commerce enterprise to offshore markets is Q * = 1388 . The supply quantity that its own capital can satisfy is q 0 = 1000 . Therefore, the cross-border e-commerce enterprise needs to make inventory pledge loans so that the pledged amount, q m = 600 , can obtain the best-quality pledge rate, ω * = 0.846 , from the 3PL enterprise. Figure 2, Figure 3 and Figure 4 show the changes in the values of tariff rate t , default rate θ , 3PL enterprise’s capability coefficient η , offshore market price α , and logistics sensitivity coefficient β whilst keeping the other parameters in Table 1 unchanged.
Figure 2, Figure 3 and Figure 4 also present the trends of the optimal logistics-service level and optimal quality charge rate of the 3PL enterprise with tariff rate t , default rate θ , 3PL enterprise’s capability coefficient η , price sensitivity coefficient α , and logistics sensitivity coefficient β . From Figure 2, we find that the optimal logistics-service level and pledge rate of the 3PL enterprise increase with an increase in the tariff rate; this result is the same as the conclusion of Theorem 3. However, relative to other factors, due to the fact that tariff rates do not have a direct impact on the logistics-service revenue and financial service revenue of 3PL enterprises, the tariff rate does not exert much influence on the 3PL enterprise’s decision. From Figure 3, as stated in Theorems 4 and 5, the optimal logistics-service level and pledge rate of the 3PL enterprise decrease with an increase in the cross-border e-commerce enterprise’s default rate and the 3PL enterprise’s capability coefficient. The higher the default rate of cross-border e-commerce enterprises, the lower the logistics-service level provided by 3PL enterprises, and the lower the pledge rate to provide lower loans. The higher the 3PL enterprises’ capability coefficient, the lower the 3PL enterprises’ capability; thus, 3PL enterprises provide lower logistics-service levels and can only provide lower loans. As shown in Figure 4, the type of offshore market is one of the factors influencing the decision of the 3PL enterprise. The optimal logistics-service level and pledge rate of the 3PL enterprise decrease with an increase in the price sensitivity coefficient α in offshore markets. The price sensitivity coefficient has less influence on the logistics-service level decision and more influence on the pledge rate decision. Consistent with Theorem 6, the price sensitivity coefficient increases with the logistics sensitivity factor β in the offshore market.
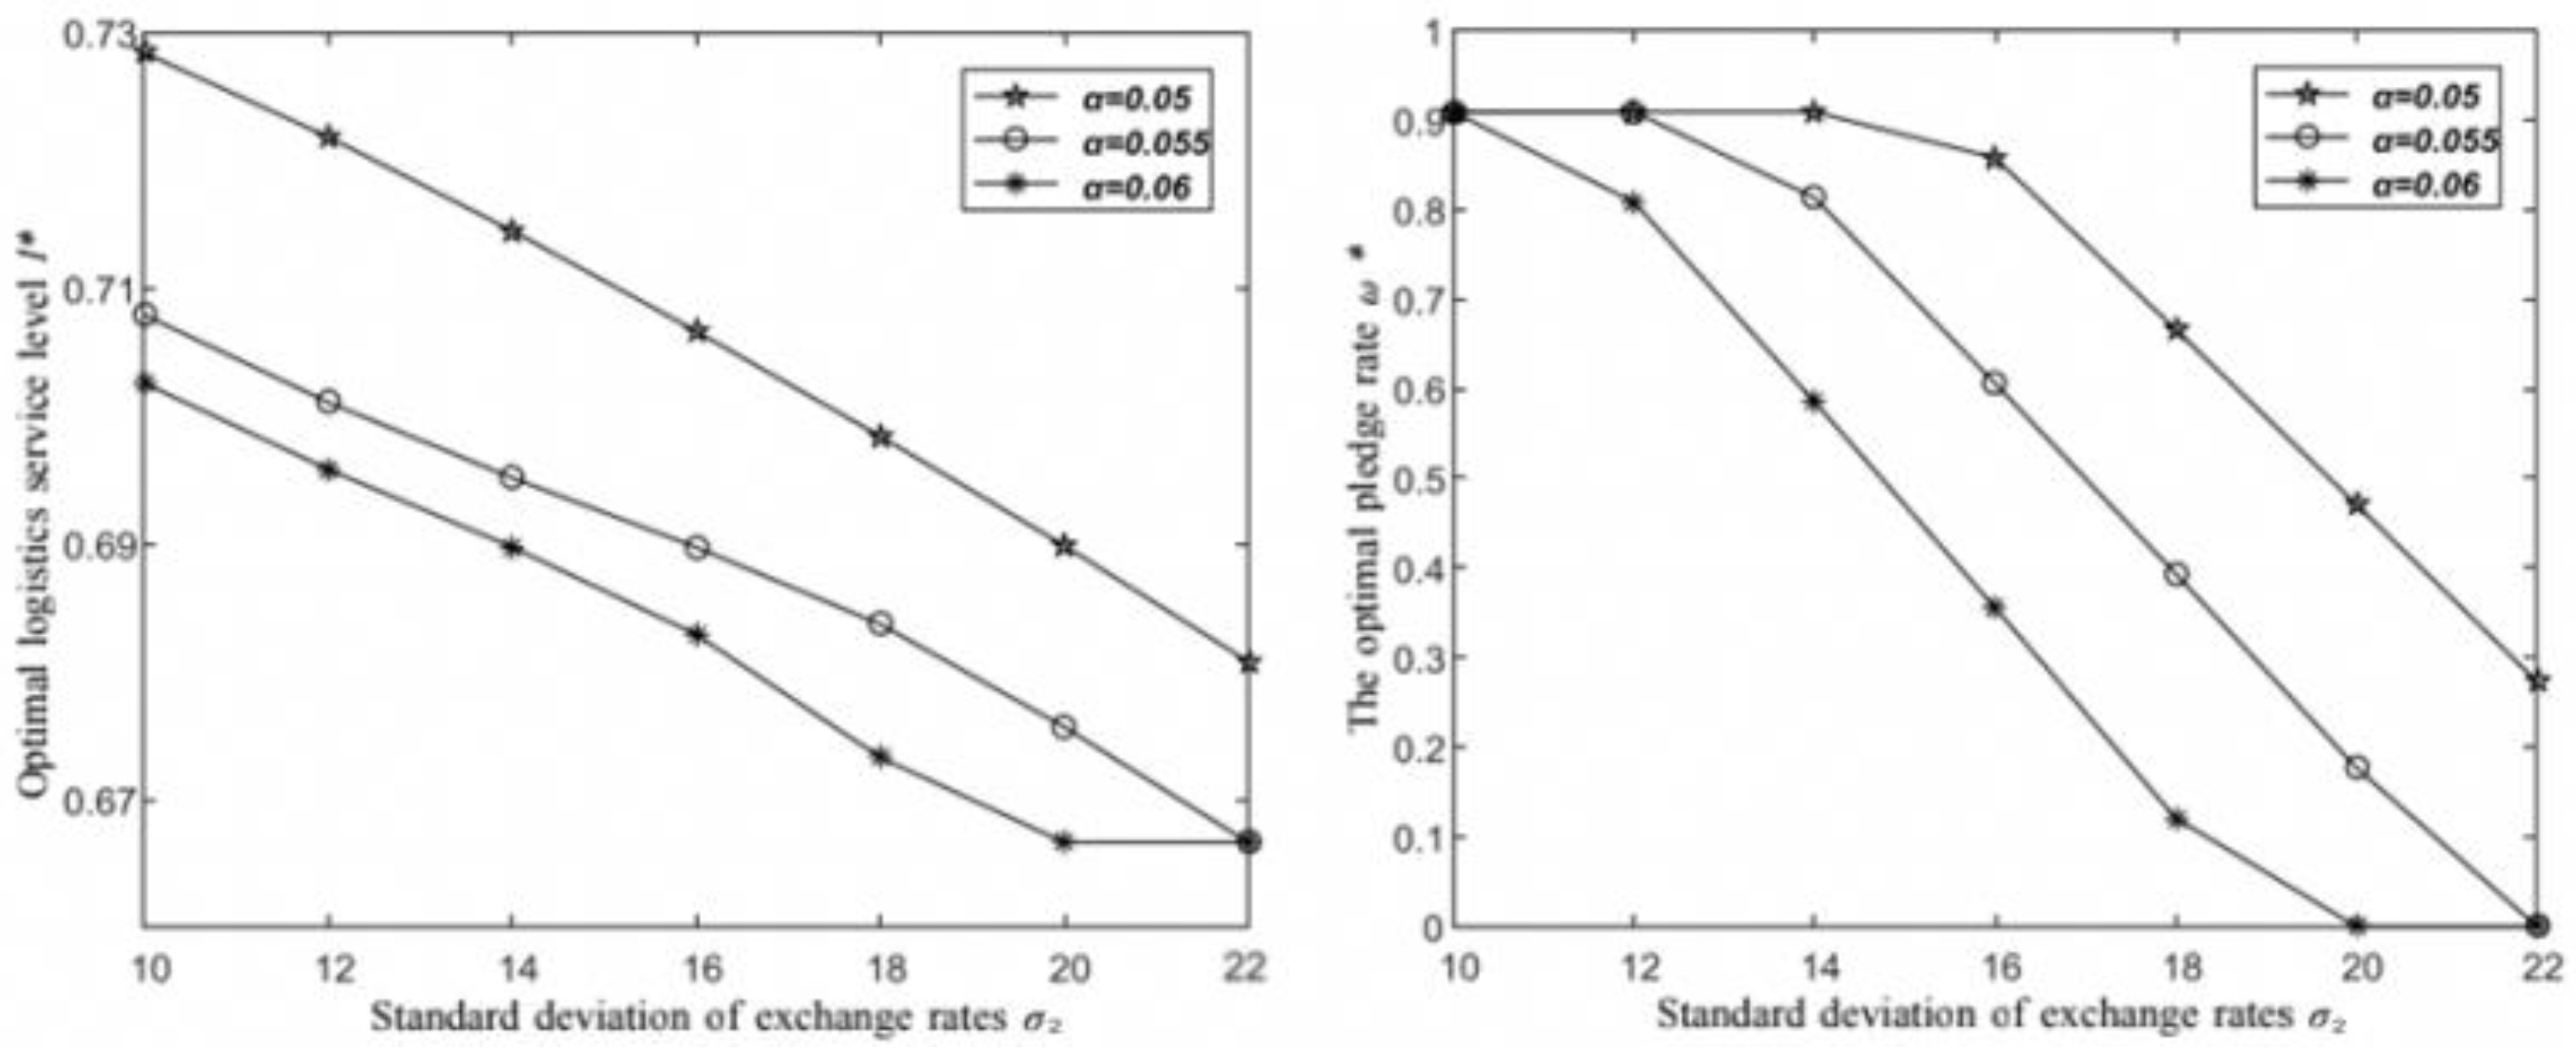
Figure 5 shows that when the parameters in Table 1 are constant, the level of logistics services and the pledge rate provided by the 3PL enterprise gradually decrease as the standard deviation of the exchange rate increases. Hence, the stability of the exchange rate is also one of the critical factors affecting the decision of the 3PL enterprise. In addition, Figure 5 shows that exchange rate fluctuations have less impact on the decision regarding the logistics-service level and more impact on the pledge rate. For example, in the α = 0.05 market environment, the standard deviation of the exchange rate increases from 10 to 22, the pledge rate decreases by 69%, and the logistics-service level decreases by only 6.5%. Specifically, the stability of the exchange rate mainly affects the financial service risk faced by the 3PL enterprise. Therefore, the 3PL enterprise needs to adjust its pledge rates actively for risk control.
Combining the results of the model analysis and numerical experiment, we can obtain the relationships between the decision variables of the 3PL enterprise, namely the logistics-service level l * and pledge rate ω * ; and the tariff rate t , default rate θ of the cross-border e-commerce enterprise, capability coefficient η of the 3PL enterprise, price sensitivity coefficient α of offshore markets, logistics sensitivity coefficient β , and standard deviation σ 2 of the exchange rate (Table 2).
According to Table 2, the decision variables of logistics-service level l * and pledge rate ω *   of the 3PL enterprise decrease with an increase in the tariff rate t and the logistics sensitivity coefficient β of offshore markets. They also decrease with an increase in the cross-border e-commerce default rate θ , capability coefficient η of the 3PL enterprise, price sensitivity coefficient α of offshore markets, and standard deviation of exchange rate   σ 2 . We also conducted Sobol sensitivity analysis on these influencing factors. Based on the results, we obtained the ranking of the impact degree of the relevant factors on the decision variable of logistics-service level l * of the 3PL enterprise, which is as follows: β >   α >   θ >   η >   t > σ 2 . The ranking of the impact degree on the pledge rate ω * is as follows: α >   θ >   β > σ 2 >   η >   t . Therefore, we have identified the main factors that influence the decision variables of the logistics-service level and pledge rate for 3PL enterprises, and these factors can be used by 3PL enterprises to determine the decision-making sequence based on their degree of impact. We have provided a theoretical basis for the decision making of 3PL enterprises, which is beneficial for their management and further development.
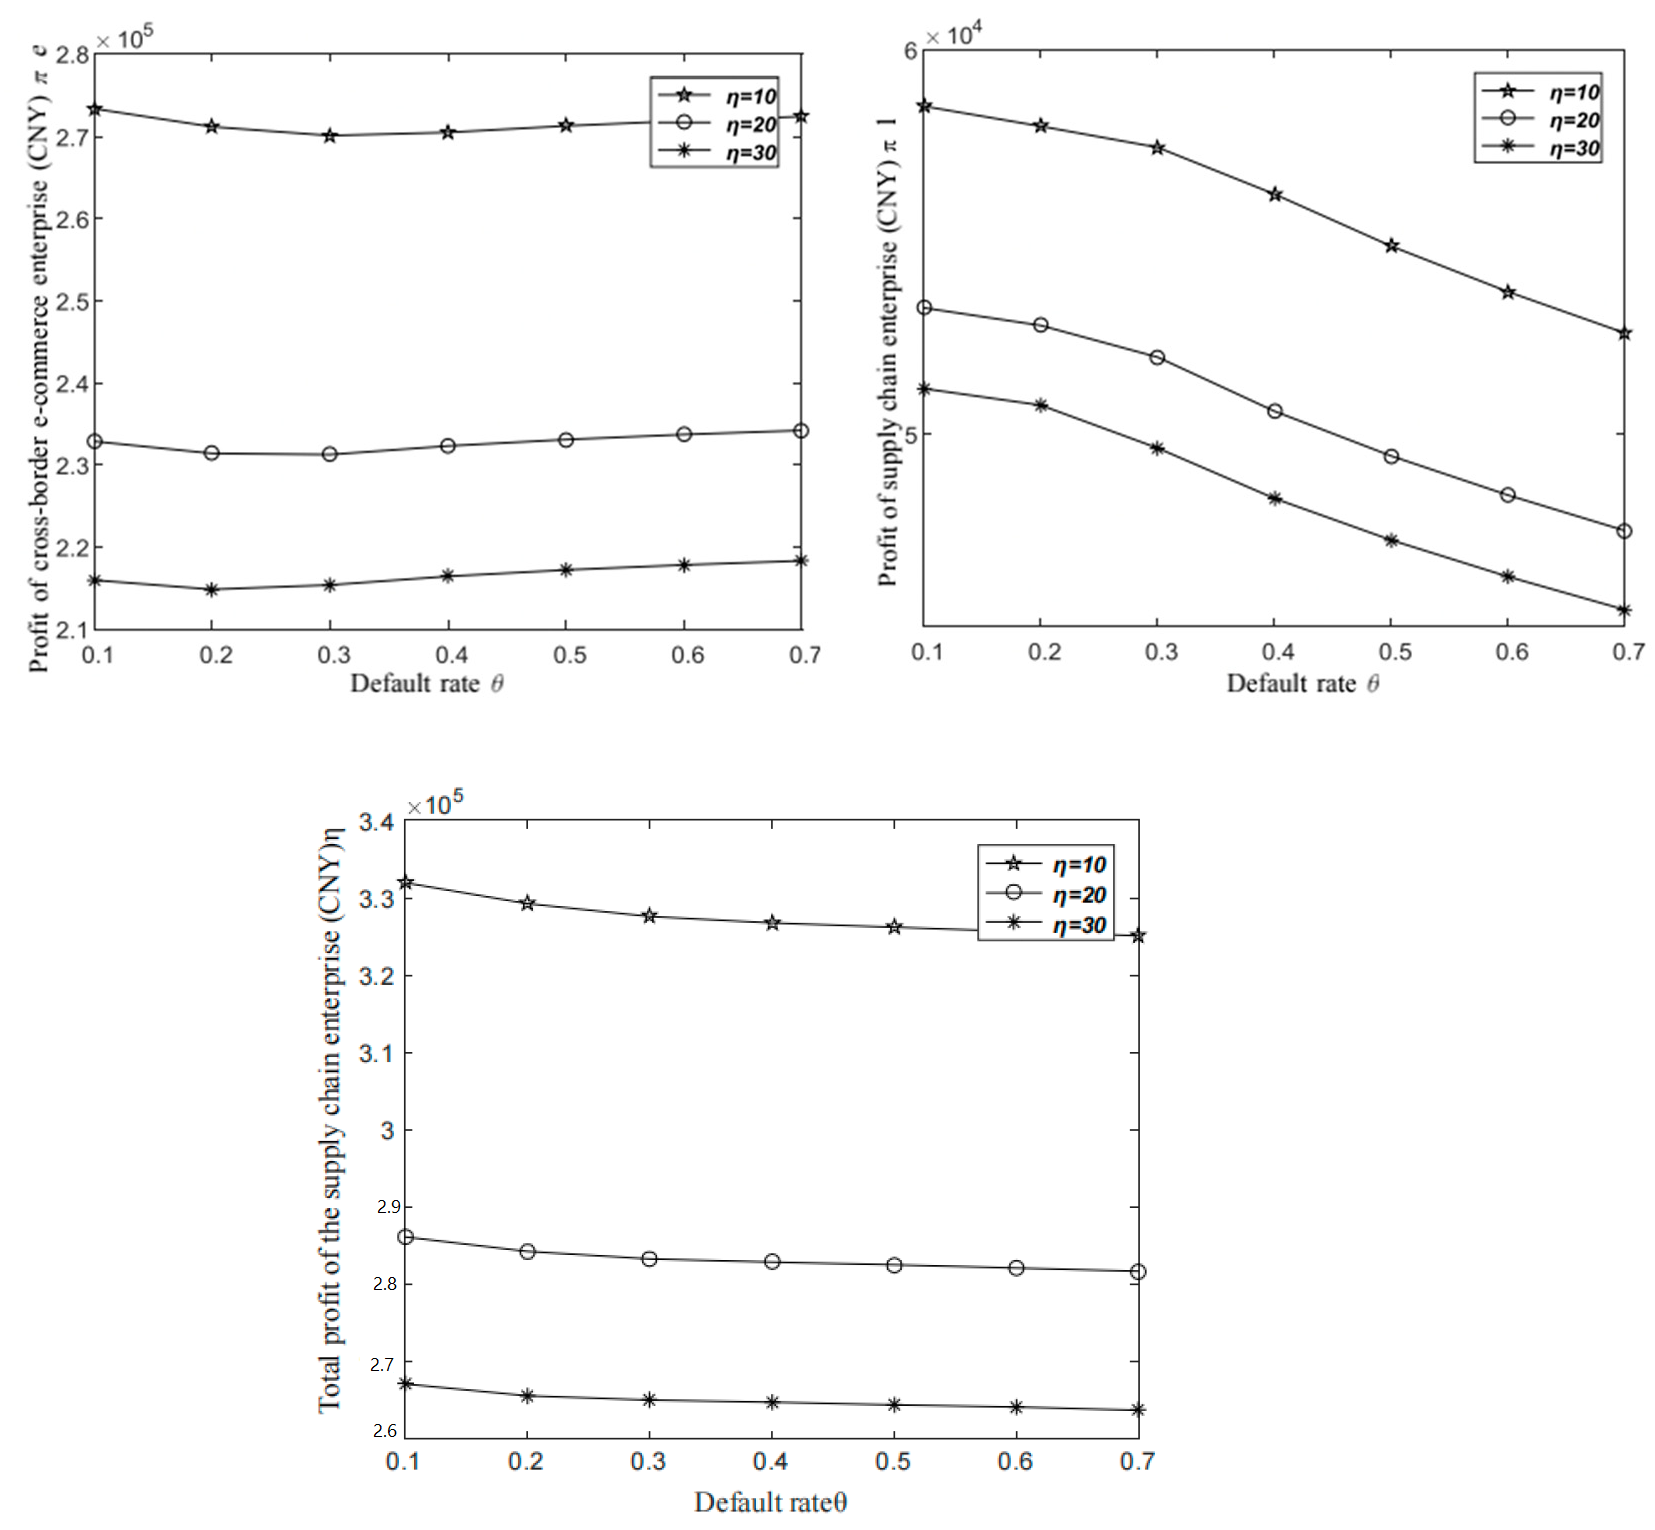
Figure 6 shows the impact of the 3PL enterprise’s capability coefficient η and the cross-border e-commerce enterprise’s default rate θ on the profits of the cross-border e-commerce enterprise, the 3PL enterprise, and 3PL as a whole. When other parameters are the same and constant, as in the primary example, the expected profits of the cross-border e-commerce enterprise are mainly influenced by the capability coefficients of the 3PL enterprise. Therefore, in the context of this study, SMEs with low creditworthiness should choose to cooperate with highly capable 3PL enterprises. For 3PL enterprises, the smaller the capability coefficient, the lower the default rate of cross-border e-commerce enterprises, and the greater the expected profit. Therefore, to increase their profits at a certain level of capacity, 3PL enterprises should choose SMEs with good credit to cooperate with and provide services for them. For 3PL as a whole, the total profit is less affected by the default rate of cross-border e-commerce enterprises and more affected by the capability coefficient of 3PL enterprises. The improvement of 3PL enterprises plays a crucial role in promoting the further development of cross-border e-commerce in China.
In summary, when the tariff rate and the degree of exchange rate fluctuation change and 3PL enterprises with different capabilities face different types of offshore markets and provide services to cross-border e-commerce enterprises with different credit levels, the ‘logistics + finance’ service decision model approach proposed in this study remains valid. Therefore, the proposed model approach has good generality and can be used in practical decision making for cross-border e-commerce. In addition, this service decision-making model approach can also help enterprises in cross-border service supply chains achieve their sustainability goals. Through this model and method, 3PL enterprises can increase their revenue and promote development by balancing logistics and financial service income. Furthermore, SMEs can alleviate financial pressure through this service, which is beneficial for their growth and expansion. Therefore, the ‘logistics + finance’ service decision-making model approach can promote the sustainable development of enterprises and contribute to the sustainable development of the cross-border e-commerce industry.

7. Conclusions, Limitations, and Future Research

Against the background of cross-border e-commerce, this study investigates the decision problem of 3PL enterprises providing ‘logistics + finance’ services when the exchange rate and offshore market demand are random. Product price and logistics-service level simultaneously affect market demand. Under the uncertain conditions of exchange rate and demand, the effects of tariff rates, offshore market types, cross-border e-commerce enterprises’ default rates, and 3PL enterprises’ capability coefficients on the decision-making process are considered. A decision model for the logistics-service level and pledge rate of inventory pledge financing for 3PL enterprises aiming toward expected profit maximization is established. The unique existence of an optimal solution for the combined strategy model is proved. The optimal logistics-service level and pledge rate of 3PL enterprises are obtained by solving the model. A numerical analysis of the influence of critical parameters on the optimal decision is conducted using arithmetic examples. The results show that the optimal logistics-service level and pledge rate provided by 3PL enterprises increase with an increased tariff rate and logistics sensitivity coefficient in offshore markets. At the same time, they decrease with an increase in the capability coefficient of 3PL enterprises, the default rate of cross-border e-commerce enterprises, and the price sensitivity coefficient of offshore markets. The more violent the exchange rate fluctuation is, the faster it decreases. In addition, this study analyzes how overall profit is affected by the default rate of cross-border e-commerce enterprises and the capability coefficient of 3PL enterprises. The analysis shows that the profit of each member and the overall profit are mainly affected by the capability coefficient of 3PL enterprises. Moreover, the stronger the capability of 3PL enterprises, the greater the profit. The findings of this paper are very important for the decision making of 3PL enterprises providing ‘logistics + finance’ services, and also lay the foundation for the management and development of the supply chain in the context of cross-border e-commerce. In the presence of uncertainties such as exchange rate and demand, it is conducive to risk avoidance when 3PL enterprises make decisions to ensure their stable revenue, and this also lays the foundation for the study of maximizing the overall revenue of the supply chain in the context of cross-border e-commerce.
In this study, we consider the situation in which the logistics-service level affects demand and the characteristics of cross-border e-commerce transactions, such as exchange rate and high demand fluctuation. However, even though the overall optimality of the supply chain must be considered, the problem is considered only from the perspective of 3PL enterprises. In reality, factors such as risk uncertainty and supply chain competition can also affect how 3PL enterprises make decisions, and these factors are not considered in this paper. In the future, we can refer to the current work to explore 3PL enterprise coordination issues related to risk sharing and profit distribution to maximize the overall supply chain effectiveness. On the other hand, it is also possible to consider how competitive relationships affect supply chain decision making, and future research on decision making in competitive supply chain environments needs to be expanded.

Author Contributions

Conceptualization, J.J. and H.Z.; methodology, J.J.; software, J.Q.; validation, J.J., J.Q., and M.J.; formal analysis, J.J.; investigation, L.K.; resources, S.J.; data curation, J.J.; writing—original draft preparation, J.J.; writing—review and editing, H.Z.; visualization, J.Q.; supervision, M.J.; project administration, M.J.; funding acquisition, M.J. All authors have read and agreed to the published version of the manuscript.

Funding

This research was funded by the National Natural Science Foundation of China, grant number 71971035; the National Natural Science Foundation of China, grant number 72201045; and the National Social Science Fund of China, grant number 20BGJ027.

Institutional Review Board Statement

This study did not require ethical approval.

Informed Consent Statement

Not applicable.

Data Availability Statement

The data are unavailable due to privacy concerns.

Conflicts of Interest

The authors declare no conflict of interest.

Appendix A

Table A1. Results of normality tests on exchange rate data.
One-Sample Kolmogorov–Smirnov Test
VAR00001
N 728
Normal Parameters a,bMean394.6535
Std. Deviation16.09476
Most Extreme DifferencesAbsolute0.206
Positive0.206
Negative−0.088
Test Statistic 0.206
Asymp. Sig. (2-tailed) 0.000 c
a. Test distribution is normal. b. Calculated from data. c. Lilliefors significance correction.
Table A2. China UnionPay: Mongolian tugrik exchange rate history.
DateExchange RatesRise or Fall%Trial Calculation in 1 RMB
1 December 20200.0023220.10%430.6632214
1 November 20200.002365--422.832981
1 October 20200.002395−0.38%417.5365344
1 September 20200.002388−0.15%418.760469
1 August 20200.002472--404.5307443
1 July 20200.002512−0.23%398.089172
1 June 20200.002544−0.66%393.081761
1 May 20200.002538−0.55%394.0110323
1 April 20200.002562−0.03%390.3200625
1 March 20200.002551--392.003136
1 February 20200.002558--390.9304144
1 January 20200.002562−0.34%390.3200625
1 December 20190.002623--381.2428517
1 November 20190.00264−0.63%378.7878788
1 October 20190.0026890.13%371.8854593
1 September 20190.002675--373.8317757
1 August 20190.0025850.18%386.8471954
1 July 20190.002585−0.23%386.8471954
1 June 20190.002623--381.2428517
1 May 20190.0025650.33%389.8635478
1 April 20190.002564−0.41%390.0156006
1 March 20190.0025540.21%391.5426782
1 February 20190.0025730.49%388.6513797
1 January 20190.002613--382.7018752
Note: The actual calculation is for the daily rate; due to the large amount of data, only the monthly rate is taken here.
Table A3. Import demand data normality test results.
One-Sample Kolmogorov–Smirnov Test
VAR00001
N 12
Normal Parameters a,bMean1747.0894
Std. Deviation284.36303
Most Extreme DifferencesAbsolute0.187
Positive0.157
Negative−0.187
Test Statistic 0.187
Asymp. Sig. (2-tailed) 0.200 c,d
a. Test distribution is normal. b. Calculated from data. c. Lilliefors significance correction. d. This is a lower bound of the true significance.
Table A4. Mongolia’s imports of machinery, tape recorders, televisions, and parts.
DateActual Import ValueExample Data (1/5 Million)
February 202053,685.9041073.72
March 202089,429.5151788.59
April 202093,850.2241877.00
May 202085,107.2181702.14
June 2020106,678.8922133.58
July 202092,437.0951848.74
August 202086,049.4741720.99
September 202092,804.8931856.10
October 2020107,175.0922143.50
November 202073,914.8571478.30
December 202081,880.651637.61
January 202185,239.851704.80

References

  1. Liu, C.; Wu, J.; Lakshika Jayetileke, H. Overseas Warehouse Deployment for Cross-Border E-Commerce in the Context of the Belt and Road Initiative. Sustainability 2022, 14, 9642. [Google Scholar] [CrossRef]
  2. Bhaskaran, K.; Chang, R.N.; Dey, P.; Sanz, J.L. Financial Services Industry Challenges and Innovation Opportunities R&D to shape the digital future of financial services. In Proceedings of the IEEE World Congress on Services (IEEE Services 2019), Milan, Italy, 8–13 July 2019; pp. 224–227. [Google Scholar] [CrossRef]
  3. Opasanon, S.; Kitthamkesorn, S. Border Crossing Design in Light of the ASEAN Economic Community: Simulation based approach. Transp. Policy 2016, 48, 1–12. [Google Scholar] [CrossRef]
  4. Vandenberg, P. Adapting to the Financial Landscape: Evidence from Small Firms in Nairobi. World Dev. 2003, 31, 1829–1843. [Google Scholar]
  5. Li, J.M.; Li, X.R.; Zhang, K.Y.; Guo, M. Research on the Financing Equilibrium and Coordination Strategy of Online Retailers under the New Eetail Model. Chin. J. Manag. Sci. 2021, 29, 57–69. [Google Scholar] [CrossRef]
  6. Qin, X.S. Research on Cross-Border E-Commerce Supply Chain Financing Model under the Condition of Overseas Warehouse. Commer. Account. 2020, 6, 63–66. [Google Scholar]
  7. Huang, S.; Fan, Z.P.; Wang, X. The Impact of Transportation Fee on the Performance of Capital-Constrained Supply Chain under 3PL Financing Service. Comput. Ind. Eng. 2019, 130, 358–369. [Google Scholar]
  8. Wang, F.; Yang, X.; Zhuo, X.; Xiong, M. Joint Logistics and Financial Services by a 3PL Firm: Effects of Risk Preference and Demand Volatility. Transp. Res. Part E Logist. Transp. Rev. 2019, 130, 312–328. [Google Scholar] [CrossRef]
  9. Mabula, J.B.; Ping, H.D. Financial Literacy of SME Managers’ on Access to Finance and Performance: The Mediating Role of Financial Service Utilization. Int. J. Adv. Comput. Sci. Appl. 2018, 9, 32–41. [Google Scholar]
  10. Wang, Y.; Shen, J.; Pan, J.; Chen, T. A Credit Risk Contagion Intensity Model of Supply Chain Enterprises under Different Credit Modes. Sustainability 2022, 14, 13518. [Google Scholar] [CrossRef]
  11. Chen, X.F.; Cai, G.S. Join Logistics and Financial Services by a 3PL Firm. Eur. J. Oper. Res. 2011, 214, 579–587. [Google Scholar] [CrossRef]
  12. Yi, X.J.; Sheng, K.; Yu, T.; Wang, Y.Y.; Wang, S.H. R&D Investment and Financing Efficiency in Chinese Environmental Protection Enterprises: Perspectives of COVID-19 and Supply Chain Financial Regulation. Int. J. Logist. Res. Appl. 2022, 25, 569–590. [Google Scholar] [CrossRef]
  13. Li, J.; Wang, Y.; Feng, G.; Wang, S.; Yuguang, S. Supply Chain Finance Review: Current Situation and Future Trend. Syst. Eng.-Theory Pract. 2020, 40, 1977–1995. [Google Scholar]
  14. Wang, Z.; Wang, Q.; Lai, Y.; Liang, C. Drivers and Outcomes of Supply Chain Finance Adoption: An Empirical Investigation in China. Int. J. Prod. Econ. 2020, 220, 107453. [Google Scholar] [CrossRef]
  15. Frye, J.; Ashley, L.; Bliss, R. Collateral Damage: A Source of Systematic Credit Risk. Risk 2000, 13, 91–94. [Google Scholar]
  16. Cossin, D.; Huang, Z.J.; Aunon-Nerin, D. A Framework Collateral Risk Control for Determination. Eur. Cent. Bank Work. Pap. Ser. 2003, 209, 1–42. [Google Scholar]
  17. Zhang, X.X. Research on Inventory Pledge Financing Pledge Decision under Internet of Things Technology. J. Financ. Res. 2020, 4, 80–86. [Google Scholar]
  18. Chen, X.F.; Cai, G.; Song, J.S. The Cash Flow Advantages of 3PLs as Supply Chain Orchestrators. Manuf. Serv. Oper. Manag. 2019, 21, 435–451. [Google Scholar]
  19. Ma, Z.H.; Xu, X.Q. Third Party Logistics Financing and Logistics Service Decisions under Supplier Competition. Appl. Res. Comput. 2019, 36, 404–410. [Google Scholar]
  20. Wang, X.J.; Gu, C.L.; Zhao, J.H.; He, Q.L. Stochastic Game Model for Moran Process under Selection Differences and its Application. Syst. Eng. Theory Pract. 2020, 40, 1193–1209. [Google Scholar]
  21. Liu, X.H.; Zhou, L.G. Logistics Financial Services in the Supply Chain Environment-Analysis of the Role of “Orchestrator” Based on 3PL. J. Cent. Univ. Financ. Econ. 2015, 7, 74–79+90. [Google Scholar]
  22. Yi, Y. Prospects for the Development of Chinese Cross-border Logistics Finance Based on Blockchain Technology—Taking Pay As You Go as an Example. Pract. Foreign Econ. Relat. Trade 2020, 4, 77–80. [Google Scholar]
  23. Li, S.; Chen, X.F. The Role of Supply Chain Finance in Third-party Logistics Industry: A Case Study from China. Int. J. Logist. Res. Appl. 2018, 22, 154–171. [Google Scholar] [CrossRef]
  24. Cao, G.M.; Wang, Y.S.; Gao, H.H.; Liu, H.; Liu, H.B.; Song, Z.G.; Fan, Y.Q. Coordination Decision-Making for Intelligent Transformation of Logistics Services under Capital Constraint. Sustainability 2023, 15, 5421. [Google Scholar] [CrossRef]
  25. Gefen, D.; Straub, D.W. Consumer Trust in B2C E-Commerce and the Importance of Social Presense: Experiments in E-Products and E-Services. Omega 2004, 32, 407–424. [Google Scholar] [CrossRef]
  26. Xu, X.; He, C. The Effects of Network Structure Attributes on Growth Performance of Logistics Service Integrators in Logistics Service Supply Chain: Empirical Evidence. Sustainability 2022, 14, 16788. [Google Scholar] [CrossRef]
  27. Perçin, S.; Min, H. A Hybrid Quality Function Deployment and Fuzzy Decision-Making Methodology for the Optimal Selection of Third-Party Logistics Service Providers. Int. J. Logist. Res. Appl. 2013, 16, 380–397. [Google Scholar] [CrossRef]
  28. Van, D.J.M.; Rutten, W.G.M.M. Logistics Service Management: Opportunities for Differentiation. Int. J. Logist. Manag. 1998, 9, 91–98. [Google Scholar]
  29. Gunasekaran, A.; Ngai, E. Information Systems in Supply Chain Integration and Management. Eur. J. Oper. Res. 2004, 159, 269–295. [Google Scholar]
  30. Zhang, X.M.; Zhao, Q.L.; Zhang, J.J.; Yue, X.P. Logistics Service Supply Chain Vertical Integration Decision under Service Efficiency Competition. Sustainability 2023, 15, 3915. [Google Scholar] [CrossRef]
  31. Ding, F.; Chen, J.; Chen, C.; Huo, J.Z. Research on the Competitive Strategy of Cross-Border E-Commerce based on Differentiation Strategy. Oper. Res. Manag. Sci. 2019, 28, 33–40. [Google Scholar]
  32. Mills, E.S. Uncertainty and Price Theory. Q. J. Econ. 1959, 73, 116–130. [Google Scholar] [CrossRef]
  33. Coppes, R.C. Are Exchange Rate Changes Normally Distributed? Econ. Lett. 1995, 47, 117–121. [Google Scholar] [CrossRef]
  34. Dong, J.; Zhang, D.; Nagurney, A. A Supply Chain Network Equilibrium Model with Random Demands. Eur. J. Oper. Res. 2004, 40, 2648–2657. [Google Scholar]
  35. Feng, Y.; Zhang, Y.Z. Evaluation of TPL-Intervened Production Transportation and Marketing Supply Chain Alliance Decisions and Operational Efficiency. Oper. Res. Manag. Sci. 2019, 28, 67–77. [Google Scholar]
  36. Zhu, Y.M.; Wang, X.M.; Zhang, S.C. Study on the Impact of Cross-Border E-Commerce Logistics Dervice Quality on Consumers’ Willingness to Repurchase. Price Theory Pract. 2020, 5, 113–116. [Google Scholar]
  37. Wu, Z.G.; Han, Y.Q.; Zhou, Y.Z. Research on Enterprise Capability Index Measurement Model. Oper. Res. Manag. Sci. 2004, 13, 145–149. [Google Scholar]
  38. Xie, T.S.; Li, J. Third-Party Logistics Service Pricing Game Analysis. J. Syst. Eng. 2008, 23, 751–758. [Google Scholar]
Figure 1. Schematic of the proposed model.
Sustainability 15 06874 g001
Figure 2. Impact of tariff rates on decision making.
Sustainability 15 06874 g002
Figure 3. Impact of cross-border e-commerce enterprise’s default rate and 3PL enterprise’s capability coefficient on decision making.
Sustainability 15 06874 g003
Figure 4. Impact of price and logistics sensitivity coefficient on decision making.
Sustainability 15 06874 g004
Figure 5. Impact of standard deviation of exchange rate on decision making.
Sustainability 15 06874 g005
Figure 6. Impact of default rate of cross-border e-commerce enterprise and 3PL enterprise’s capability coefficient on profit.
Sustainability 15 06874 g006
Table 1. Other parameters of the algorithm.
Parameters M p c p l R p θ K η α β
Value300,0003006010%60030%20200.050.5
Table 2. Relationship between decision variables and main parameters.
t θ η α β σ 2
l *
ω *
Disclaimer/Publisher’s Note: The statements, opinions and data contained in all publications are solely those of the individual author(s) and contributor(s) and not of MDPI and/or the editor(s). MDPI and/or the editor(s) disclaim responsibility for any injury to people or property resulting from any ideas, methods, instructions or products referred to in the content.