Article

Analysis of Ketoprofen in Fish: Life Cycle Assessment Using Sensors vs. Conventional Methodology

REQUIMTE-LAQV, Instituto Superior de Engenharia do Porto, Instituto Politécnico do Porto, Rua Dr. António Bernardino de Almeida, 431, 4249-015 Porto, Portugal
*
Authors to whom correspondence should be addressed.
Sustainability 2023, 15(8), 6775; https://doi.org/10.3390/su15086775
Submission received: 9 March 2023 / Revised: 7 April 2023 / Accepted: 13 April 2023 / Published: 18 April 2023
(This article belongs to the Special Issue Biosustainability and Waste Valorization)

Abstract

:
Life cycle assessment (LCA) is a powerful tool to quantify the environmental burdens of different analytical techniques. This work assesses the environmental impacts associated with the use of a simple electrochemical carbon paper sensor (CPS) for ketoprofen detection in fish by LCA in comparison with traditional liquid high-performance chromatography (HPLC) with fluorescent detection. The results indicate significant advantages of CPS compared to HPLC in 16 of the 18 analyzed categories of impact (ReCiPe2016(H) method), with average CPS values 26% lower than for HPLC. This is due, in the categories of impact with higher environmental relevance, to the higher electric energy consumption during the “Analysis” step and, secondarily, to the use of acetonitrile as a mobile phase. On an annual basis, ketoprofen detection by CPS saves 333 kg 1.4 dichlorobenzene equivalents (1.4 DCB eq) of non-carcinogenic and 6.9 kg 1.4 DCB eq of carcinogenic human toxicities, 43.6 kg oil eq of fossil resources, and 91.4 kg CO2 eq of greenhouse gas emissions compared to HPLC. The high capital investment, maintenance costs, and reagents quantities required for HPLC mitigate the economic competitiveness of this traditional technique compared to the rapid and less complex portable CPS device under the studied conditions.

1. Introduction

The development of small, versatile, and portable analytical systems is of utmost importance for the analytical and environmental science fields to accomplish simple, cheap, and on-site determinations. Electrochemical sensors can offer a viable solution in this matter due to the downsize capability of the electrode components enabled by the involvement of nanotechnology and microfabrication processes. Currently, conventional electrodes based on glassy carbon are still widely employed as transducers in the development of new electrochemical sensors for pollutants [1] due to their robustness and reproducibility but are generally constricted to laboratory. Therefore, in situ environmental analysis may imply miniaturization efforts of more conventional electrodes or the use of different and versatile materials as sensors. Carbon fiber paper has been established as an excellent electrode material due to its interesting physicochemical, electronic, and electrochemical properties. This material can be pertinently exploited in portable and small electrochemical systems due format resemblance to paper, which enables customizable sizing and shaping. Owing to these characteristics, carbon fiber paper has recently been increasingly employed in electrochemical sensors for a variety of compounds [2]. Electrochemical sensors can offer advantages over traditional analytical techniques such as those based on chromatographic–spectroscopic methods. These advantages are mainly derived from the simplicity of electrochemical methods and the reduction in material and reagent requirements and produced waste, translating into potentially reduced environmental impacts. In addition, these overall economic advantages are likely to increase over time. Life cycle assessment (LCA) is one of the most powerful tools for assessing the environmental impacts of a product or a process over its life cycle [3], allowing for comparison with different products or processes through a common functional unit [4]. LCA follows the rules of the ISO 14040 [5] and ISO 14044 [6] guidelines and includes four mandatory steps: (i) goal and scope, (ii) life cycle inventory (LCI), (iii) impact assessment, and (iv) interpretation of the results. The goal and scope step aims to define the system boundaries and the environmental question, which, in the case of this work, is: “Are electrochemical sensors environmentally more advantageous than traditional analytical techniques?”. LCI is the core of LCA, involving the quantitative analysis of the materials (raw materials, chemicals, and waste) and energy flows (electric energy and heat) within the boundaries of the studied system and their interaction with the environment in terms of natural resource consumptions, the raw materials used, energy supply, and emissions to the environment. In the “impact assessment” step, the environmental burdens are calculated according to different categories of impact (i.e., Recipe 2016 [7]). The last stage of life cycle assessment involves critical review and presentation of the results. The LCA calculation method depends on the scope of the work, the geographical area to which the work refers, and the set of impact categories the practitioner aims to assess. The ReCiPe method is a global method that is the subject of international scientific consensus; it combines the Eco-Indicator 99 and CML methodologies in an updated version. ReCiPe distinguishes two levels of indicators: midpoint (i.e., global warming, fossil resource scarcity, human toxicity, etc.) and endpoint indicators, which assess damage in the areas of protection of human health, ecosystems, and resource availability [8]. The integration of LCA with traditional economic analysis allows for the generation of an exhaustive picture of both environmental and economic impacts associated with the development of a new analytical platform and ensures that all necessary tools are available for future investment or decision making.
Despite these tools adding valuable information to new developments, they have been scarcely applied to the development of electrochemical sensors, with only four studies found in the literature. In this regard, Ahmed et al. [9] applied LCA to screen-printed electrodes fabricated with different materials, comparing their environmental impacts. One year earlier, Le Brun and Raskin [10] developed a microfluidic paper-based sensor for bacterial detection, using LCA to compare two different conceptual designs, as well as a traditional microfabrication technique. Very recently, LCA was employed to measure the impacts on human health and the environment related to the fabrication and operation of a microbial fuel cell used for Pb2+ detection [11]. In addition, the environmental advantages of using a carbon paper sensor (CPS) for 17α-ethinylestradiol detection compared to the commonly used analytical technique [12] were assessed using both LCA and life cycle cost (LCC) to estimate the cost of these assets over their entire life cycles [13].
The objective of the present work was the assessment of the environmental and economic benefits of a developed CPS applied to the detection of ketoprofen pharmaceutical drugs in fish samples and comparison of this method with a conventional chromatographically based analytical technique. Previous results have evidenced advantages regarding lower environmental impacts generated by the use of CPS for analytical purposes compared to traditional analytical techniques [12]. This study provides more detailed insight on this topic, taking ketoprofen, one of the most commonly consumed anti-inflammatory drugs and therefore one of the most frequently found drugs in the environment with potential to bioaccumulate and to cause adverse effects in ecosystems and on human health, as a reference analyte [14].

2. Materials and Methods

2.1. Experimental Assumptions

Carbon paper can be a viable sensing material for the determination of environmental contaminants. This was demonstrated in a previous study [2] developed by the authors in which an unmodified CPS was revealed to be effective in the determination of the drug ketoprofen in water and fish samples. Figure 1a–e show a schematic representation the experimental work done for an electrochemical platform, as well as the CPS development and the results on which the conceptual model adopted in this were based. The electrochemical determination of this drug is particularly challenging, as the voltametric reduction peak appears at considerably negative potentials (−1.1 V vs. Ag/AgCl) (Figure 1d). Nevertheless, under optimized conditions of pH 5 and with differential pulse voltammetry technique parameters, ketoprofen can be detected with high sensitivity in two linear ranges: from 0.088 to 1.96 µM (sensitivity of 35 µA µM−1 cm−2) and from 1.96 to 6.02 µM (24 µA µM−1 cm−2) with a low limit of detection of 0.11 µM. The CPS was then validated in fish (Trachurus trachurus) samples by recovery assays using a solid-phase extraction procedure, as schematized in Figure 1e, with recoveries varying from 82 ± 4.4% to 89 ± 4.5% and values of relative standard deviation ranging from 6 to 15% for reproducibility and repeatability assays [2]. The experimental assays demonstrated the efficiency of CPS in detecting ketoprofen in these complex matrices, suggesting its potential as a rapid field test and as an alternative to the traditional high-performance liquid chromatography (HPLC) methodology.
The extraction procedure of ketoprofen from solid fish samples and the methodology used for the subsequent analysis performed either by CPS or by the conventional HPLC method are described in the following sections. They represent the conceptual model based on which LCA and the economic analysis were developed.

2.1.1. Ketoprofen Extraction from Fish Samples

The extraction of ketoprofen from fish tissue was based on an Agilent procedure [15] and was divided into 8 steps as depicted in the scheme (left) depicted in the following Section 2.2.1. Samples of horse mackerel were obtained from a local market (Porto, Portugal). About 0.5 g of edible meat was weighed (Thermo Fisher Scientific, model FPRS223, Leicestershire, UK) into a 50 mL falcon tube (step 1). Then, 5 mL of ultrapure water (UP; 18 MΩ, Milli-Q, Millipore, Molsheim, France) was added and mixed in a vortexer (VWR VV3, UK) for 1 min (step 2), followed by the addition of 10 mL acetonitrile and subsequent mixing by hand shaking. QuEChERS salts (AOAC buffered salts: 6 g magnesium sulfate and 1.5 g sodium acetate; Agilent, Santa Clara, CA, USA) were added to the falcon tube and hand-shaken for 1 min (step 3), followed by centrifugation (Thermo Scientific Heraeus Megafuge 16R, Kandel, Germany) at 4500 rpm and 4 °C for 5 min (step 4). The supernatant was retrieved and further cleaned by adding it to a 15 mL dispersive solid-phase extraction tube containing 150 mg C18 and 900 mg MgSO4 (Agilent, Santa Clara, CA, USA), which was agitated for 1 min in a vortexer (step 5), followed by centrifugation at 13,000 rpm and 4 °C for 3 min (step 6). The supernatant was then evaporated under a nitrogen stream (step 7) and redissolved in 2 mL of a water: acetonitrile mixture (4:1) with the aid of ultrasound waves (J.P. Selecta ultrasons H-D, Barcelona, Spain) and vortexing (step 8).

2.1.2. Electrochemical Analysis of Ketoprofen

An aliquot of 10 μL of the extract was added to an electrochemical cell containing about 10 mL of 0.1 M Britton–Robinson buffer (pH 5). A differential pulse voltammetry technique was employed for the analysis in the electrochemical window from −0.7 to −1.3 V with the following technique parameters: modulation amplitude, 70 mV; modulation time, 5 milliseconds; step potential, 17.5 mV; interval time, 0.1 s. Before the analysis, the electrolyte was purged with nitrogen for 15 min. Britton–Robinson buffer was prepared by mixing NaOH (2.07 g/L), CH3COOH (1.78 g/L), H3PO4 (2.29 g/L), H3BO3 (1.83 g/L), KCl (3.7 g/L), and water.
Electrochemical analysis was performed with a Metrohm Autolab PGSTAT12 potentiostat/galvanostat (120 W power) controlled with GPES version 4.9 software (Herisau, Switzerland) (Figure 1a) and with a three-electrode electrochemical cell composed of a Ag/AgCl (3 M, KCl) reference electrode and a platinum rod-counter electrode, with CPS as the working electrode [2], as shown in Figure 1b. The voltametric measuring stand (663 VA Stand) only served as a support for the three electrodes. The CPS consisted of unmodified Toray carbon paper (TGP-H-60, 0.19 mm thickness; Alfa Aesar, Germany) with a size of approximately 2.5 × 0.7 cm2 [2] containing aluminum foil in one end for better contact with the crocodile clip (Figure 1c). The CPS was electrochemically pretreated in 10 mL solution of 0.5 M H2SO4 from −0.2 to 1 V at 50 mV/s for 50 scans for 20 min. The calculated electric energy consumption based on a 20 min analysis duration with 120 W power was 3.96 × 10⁻² per analysis.

2.1.3. Chromatographic Analysis of Ketoprofen

Chromatographic analysis was based on a literature procedure with some modifications [16]. An aliquot of 10 μL of extract was injected into a liquid chromatograph system composed of an octadecylsilane column (Luna 5 μm C18 100 Å, 150 × 4.6 mm (Phenomenex, Alcobendas, Spain), a Sil-20AHT autosampler, a CBM-20A system controller (Shimadzu, Duisburg, Germany) with a flow rate of 1 mL min−1 of the mobile phase constituted by 60% v/v acetonitrile, 40% v/v water, and 0.1% v/v formic acid. The total run time was 17 min.

2.2. Life Cycle Assessment Methodology

2.2.1. Life Cycle Goal and Scope

The aim of the present work was to assess the environmental benefits and the economic advantages generated by the developed CPS for ketoprofen detection in fish samples (scenario 1) compared with the detection of ketoprofen using traditional HPLC methodology (scenario 2).
Figure 2 reports the flowsheet of scenario 1 (CPS) and scenario 2 (HPLC), with the extraction procedure common to both scenarios and divided into 8 different steps.
Scenario 1 includes analysis of ketoprofen in fish extract using the novel CPS. Since CPS is designed to detect ketoprofen only, in scenario 2, chromatographic analysis was modeled accordingly, considering only the reagents and the electric energy required for the detection of one pharmaceutical during each chromatographic run as inputs. This LCA was developed according to ISO 14040 [5] and ISO 14044 [17] in a “cradle to gate” approach, which includes raw material and energy acquisition, equipment usage, and waste disposal. The construction of both electrochemical (potentiostat and reference and counter electrodes) and HPLC equipment was not considered. The basis for calculation is described below.
This LCA follows the ReCiPe2016(H) methodology of calculation, which converts, through proper characterization factors, the elementary flows of the inputs into 18 environmental indicators at midpoint and endpoint levels [7]. The midpoint level focuses on single environmental categories of impact (i.e., global warming, human carcinogenic and non-carcinogenic toxicity, etc.), and the results are expressed as emissions of equivalent substances (kg CO2 eq, kg 1.4 DCB eq, etc.). The results calculated at the “endpoint” level are directly related to the damage caused by the induced impacts in the three areas of protection, namely (i) human health, expressed in disease-adjusted life years (DALY), which represents the loss of the equivalent of one year of full health [18]; (ii) ecosystems, measured in terms of the number of potentially disappeared species (species.y); and (iii) resources, which are assessed as increased costs to extract 1 kg of resources and are linked to the resource availability (USD 2013) [7]. Moreover, the ReciPe2016 method allows for interpretation of the results obtained at the endpoint level through the “weighting” function to obtain aggregated results. This function allows for comparison of the environmental impacts of different categories through a single unit (pt) and for selection of those that have higher associated environmental loads according to the criteria set by the method, which are related to (i) the distance to the policy target, (ii) the distance to the scientific target, (iii) monetization, and (iv) panel consensus [19]. The drawback of this approach is that “weighting” means applying a value judgment to LCA results, which can be seen as a controversial step. In this work, the “weighting” function was used to rank the environmental impacts and to define which categories of impact have higher environmental relevance.
The “Hierarquist” (H) analysis perspective was adopted, which is based on scientific consensus with regard of the time frame and the plausibility of the impact mechanisms. The software package used for this study was SimaPro Version 9.1.1.7 from pre-Sustainability (Le Amersfoort, The Netherlands) run on Windows 10 and equipped with the Ecoinvent 3.7 database [20].

2.2.2. Life Cycle Inventory

The assumptions and theoretical calculations used for elaboration of the life cycle inventory (LCI) are reported in Table S1 (Supplementary Material) and represent the basis for the LCI (Table 1, Table 2, Table 3 and Table 4).
LCI is defined as a phase of LCA involving the compilation and quantification of inputs and outputs for a given product system throughout its life cycle [5]. Compared to the other phases of LCA, LCI has been considered a rather straightforward procedure when the allocation and system boundaries are clearly defined [21], as in the case of the present work. The inventory data used in this study are highly reliable, since they were all measured by the authors during the laboratory assays performed for the characterization and application of the novel CPS for ketoprofen analysis [2]. All input/output data are real quantities with operational parameters that characterize the process and were not estimated based on third-party data as is often the case in LCA studies; these data are reported in the LCI (Table 1, Table 2, Table 3 and Table 4).
The indirect impacts associated with C18 [22,23,24] and Britton–Robinson buffer [20] production were estimated on the basis of scientific literature and based on the measurements performed by the authors during laboratory experiments [25] (Table 2 and Table 3).
The amounts of chemicals used for the extraction process reported in Table 1 are relative to one sample of fish extract. The amount of fish extract obtained is enough to be used either for HPLC or on the novel electrochemical platform based on CPS to perform one analysis.
The energy requirements for the “sample extraction” step are in agreement with literature data for a similar extraction process [12]. Some discrepancies are observed in the “analysis” step due to differing amounts and types of reagents needed for the different contaminants under analysis (ketoprofen vs. 17α-Ethinylestradiol) [12].

2.3. Economic Analysis Methodology

The economic analysis was based on the purchase cost of equipment (PCE) methodology [26], which is described in Table S2 (Supplementary Material). For both CPS and HPLC scenarios, we considered a need to conduct 4950 analyses per year, with a duration of 7 and 17 min for each run, respectively. In addition, in both cases, 15 min were added for the sample extraction process. The duration of a single analysis takes into consideration sample preparation, analysis, cleaning, and final waste management. A 5-year lifetime was considered for both setups. Table 5 reports the equipment-purchase costs, and Table 6 reports the material, labor, utility, and waste disposal costs associated with the economic analysis.
Table 7 reports the annual costs for CPS and HPLC analysis.
The Depreciation factors used for the profitability analysis are reported in Table S3 (Supplementary Material). All data are highly reliable since they were retrieved from real invoices and economic costs paid to the suppliers during the development of the project and during the everyday operation of HPLC equipment.

3. Results

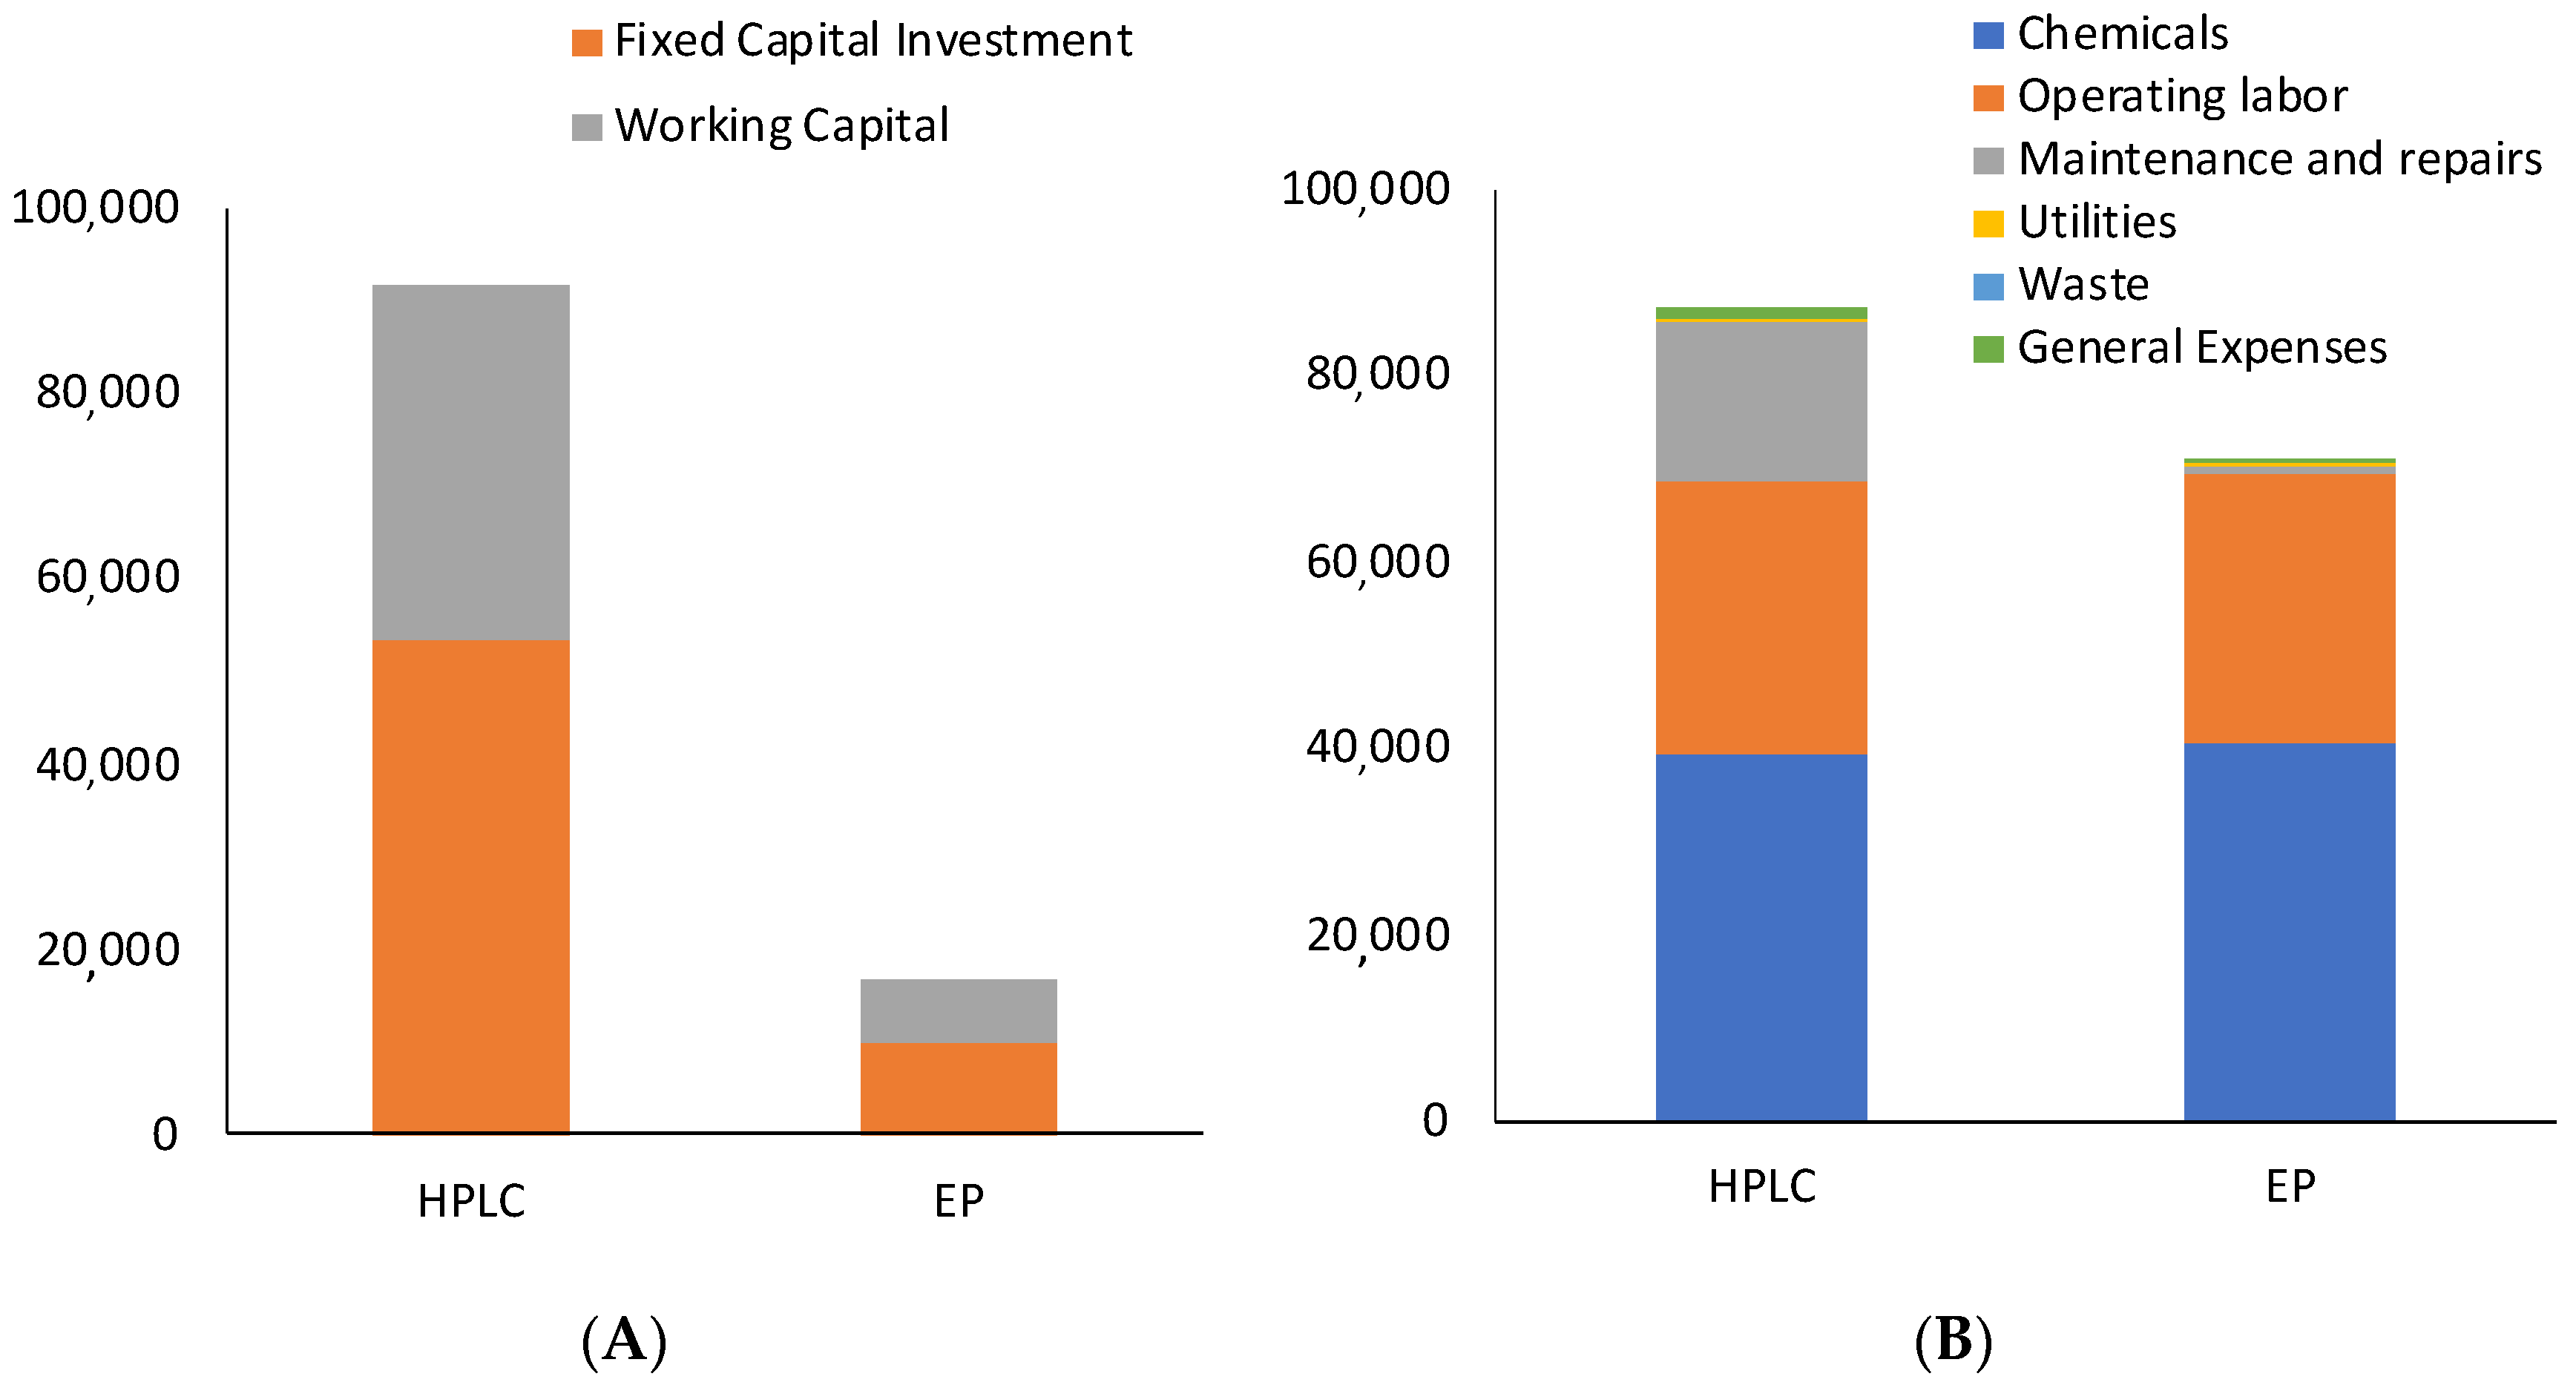
3.1. Life Cycle Assessment

Table 8 shows a comparison of the environmental burdens associated with one ketoprofen analysis performed on fish extract samples using the novel CPS and an analysis conducted using the traditional chromatographic method (HPLC). The results were calculated at midpoint and endpoint levels, and they showed that the novel CPS had lower environmental impacts in almost all the categories when compared to HPLC, with percentages of decrease ranging, on average, from 15% (“ozone formation”) to 62% (“stratospheric ozone depletion”). These results suggest that the use of CPS for the determination of ketoprofen in fish sample extract is environmentally more advantageous than traditional HPLC methodology.
For the categories of impact of “land use” and “ionizing radiation ”, the CPS showed worse environmental performance than HPLC, represented by increases of 183% and 120%, respectively (Table 8). This is attributed, in the case of “ionizing radiation”, to the higher environmental credits accounted by the ReCiPe2016 method based on the Ecoinvent 3.7 database [20] for the electric energy mix associated with the production of acetonitrile and formic acid in the global market, with benefits of renewable biomass sources and avoidance of non-renewable sources of energy.
Applying the “weighting” function, which expresses all the impact results in a single scoring unit (points), it is possible to rank, group, and assign importance to the different impact categories based on stakeholder concerns, established policies, scientific targets, and economic aspects. The environmental impacts calculated as weighted values [29] (highlighted in gray in Table S4 of Supplementary Material) show that the categories of impact with the highest environmental relevance in the three areas of protection are “fine particulate matter formation”, “global warming, human health”, “human non-carcinogenic and carcinogenic toxicity”, and “fossil resource scarcity”.
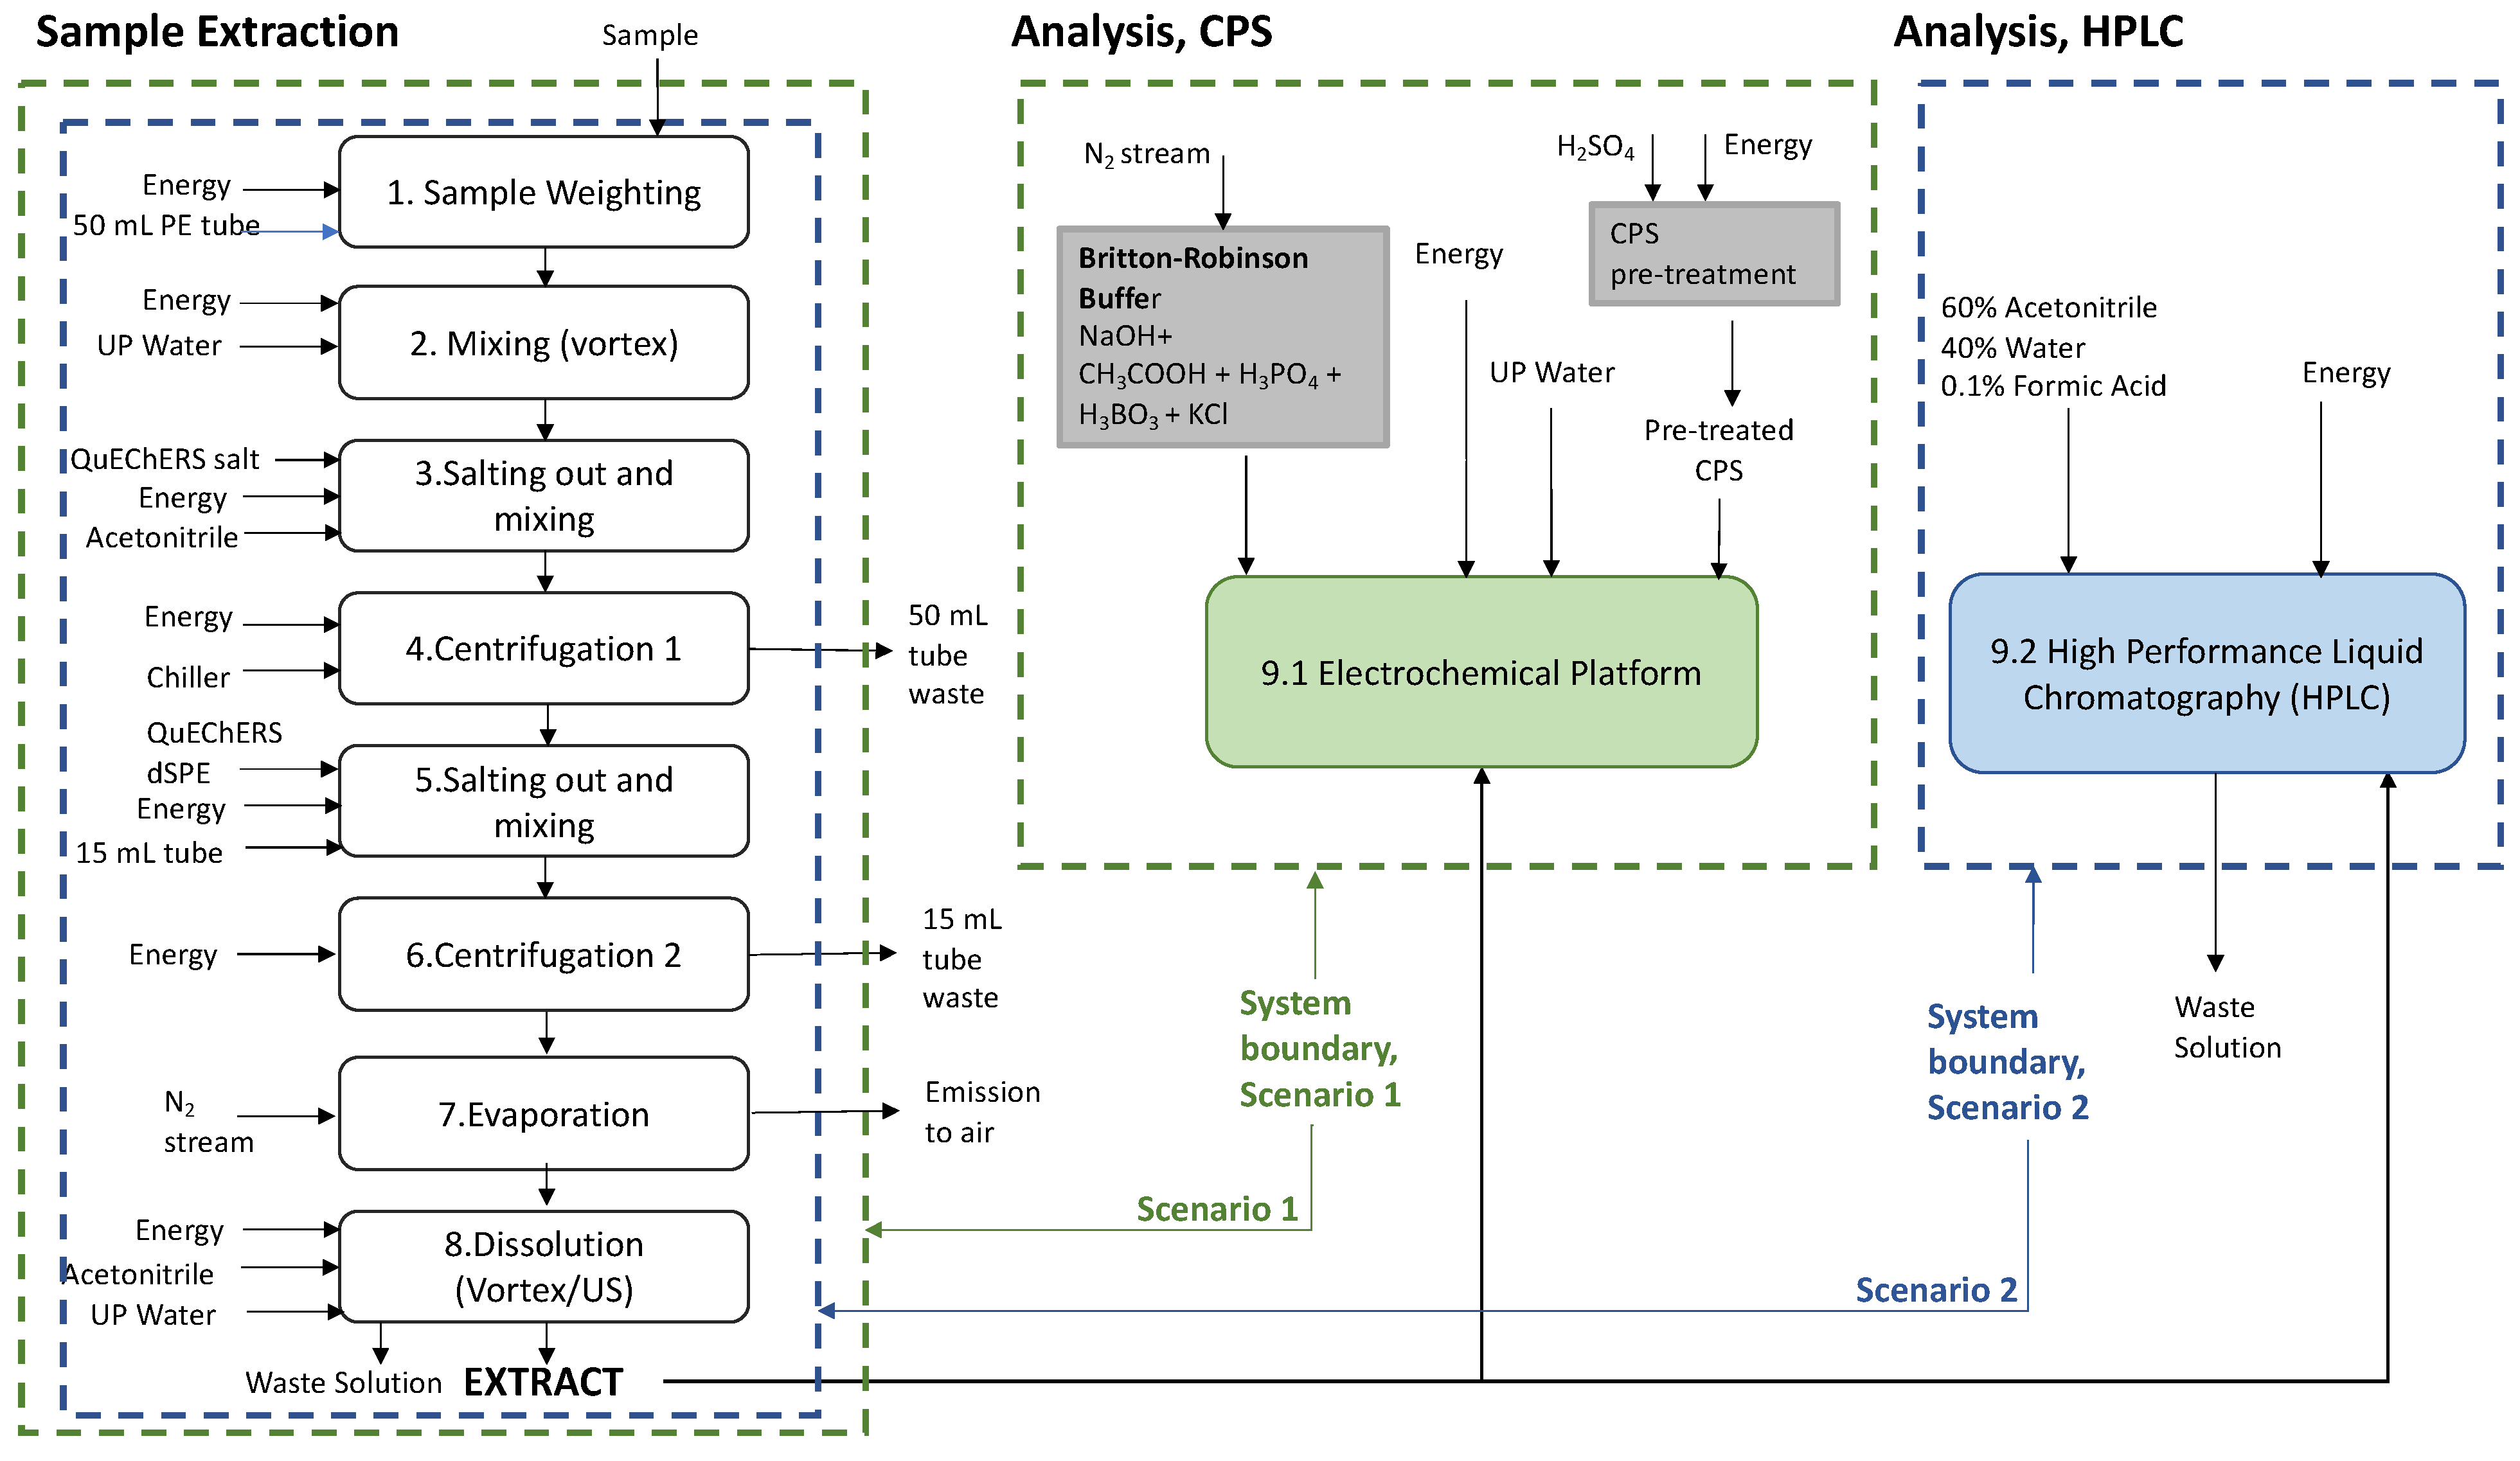
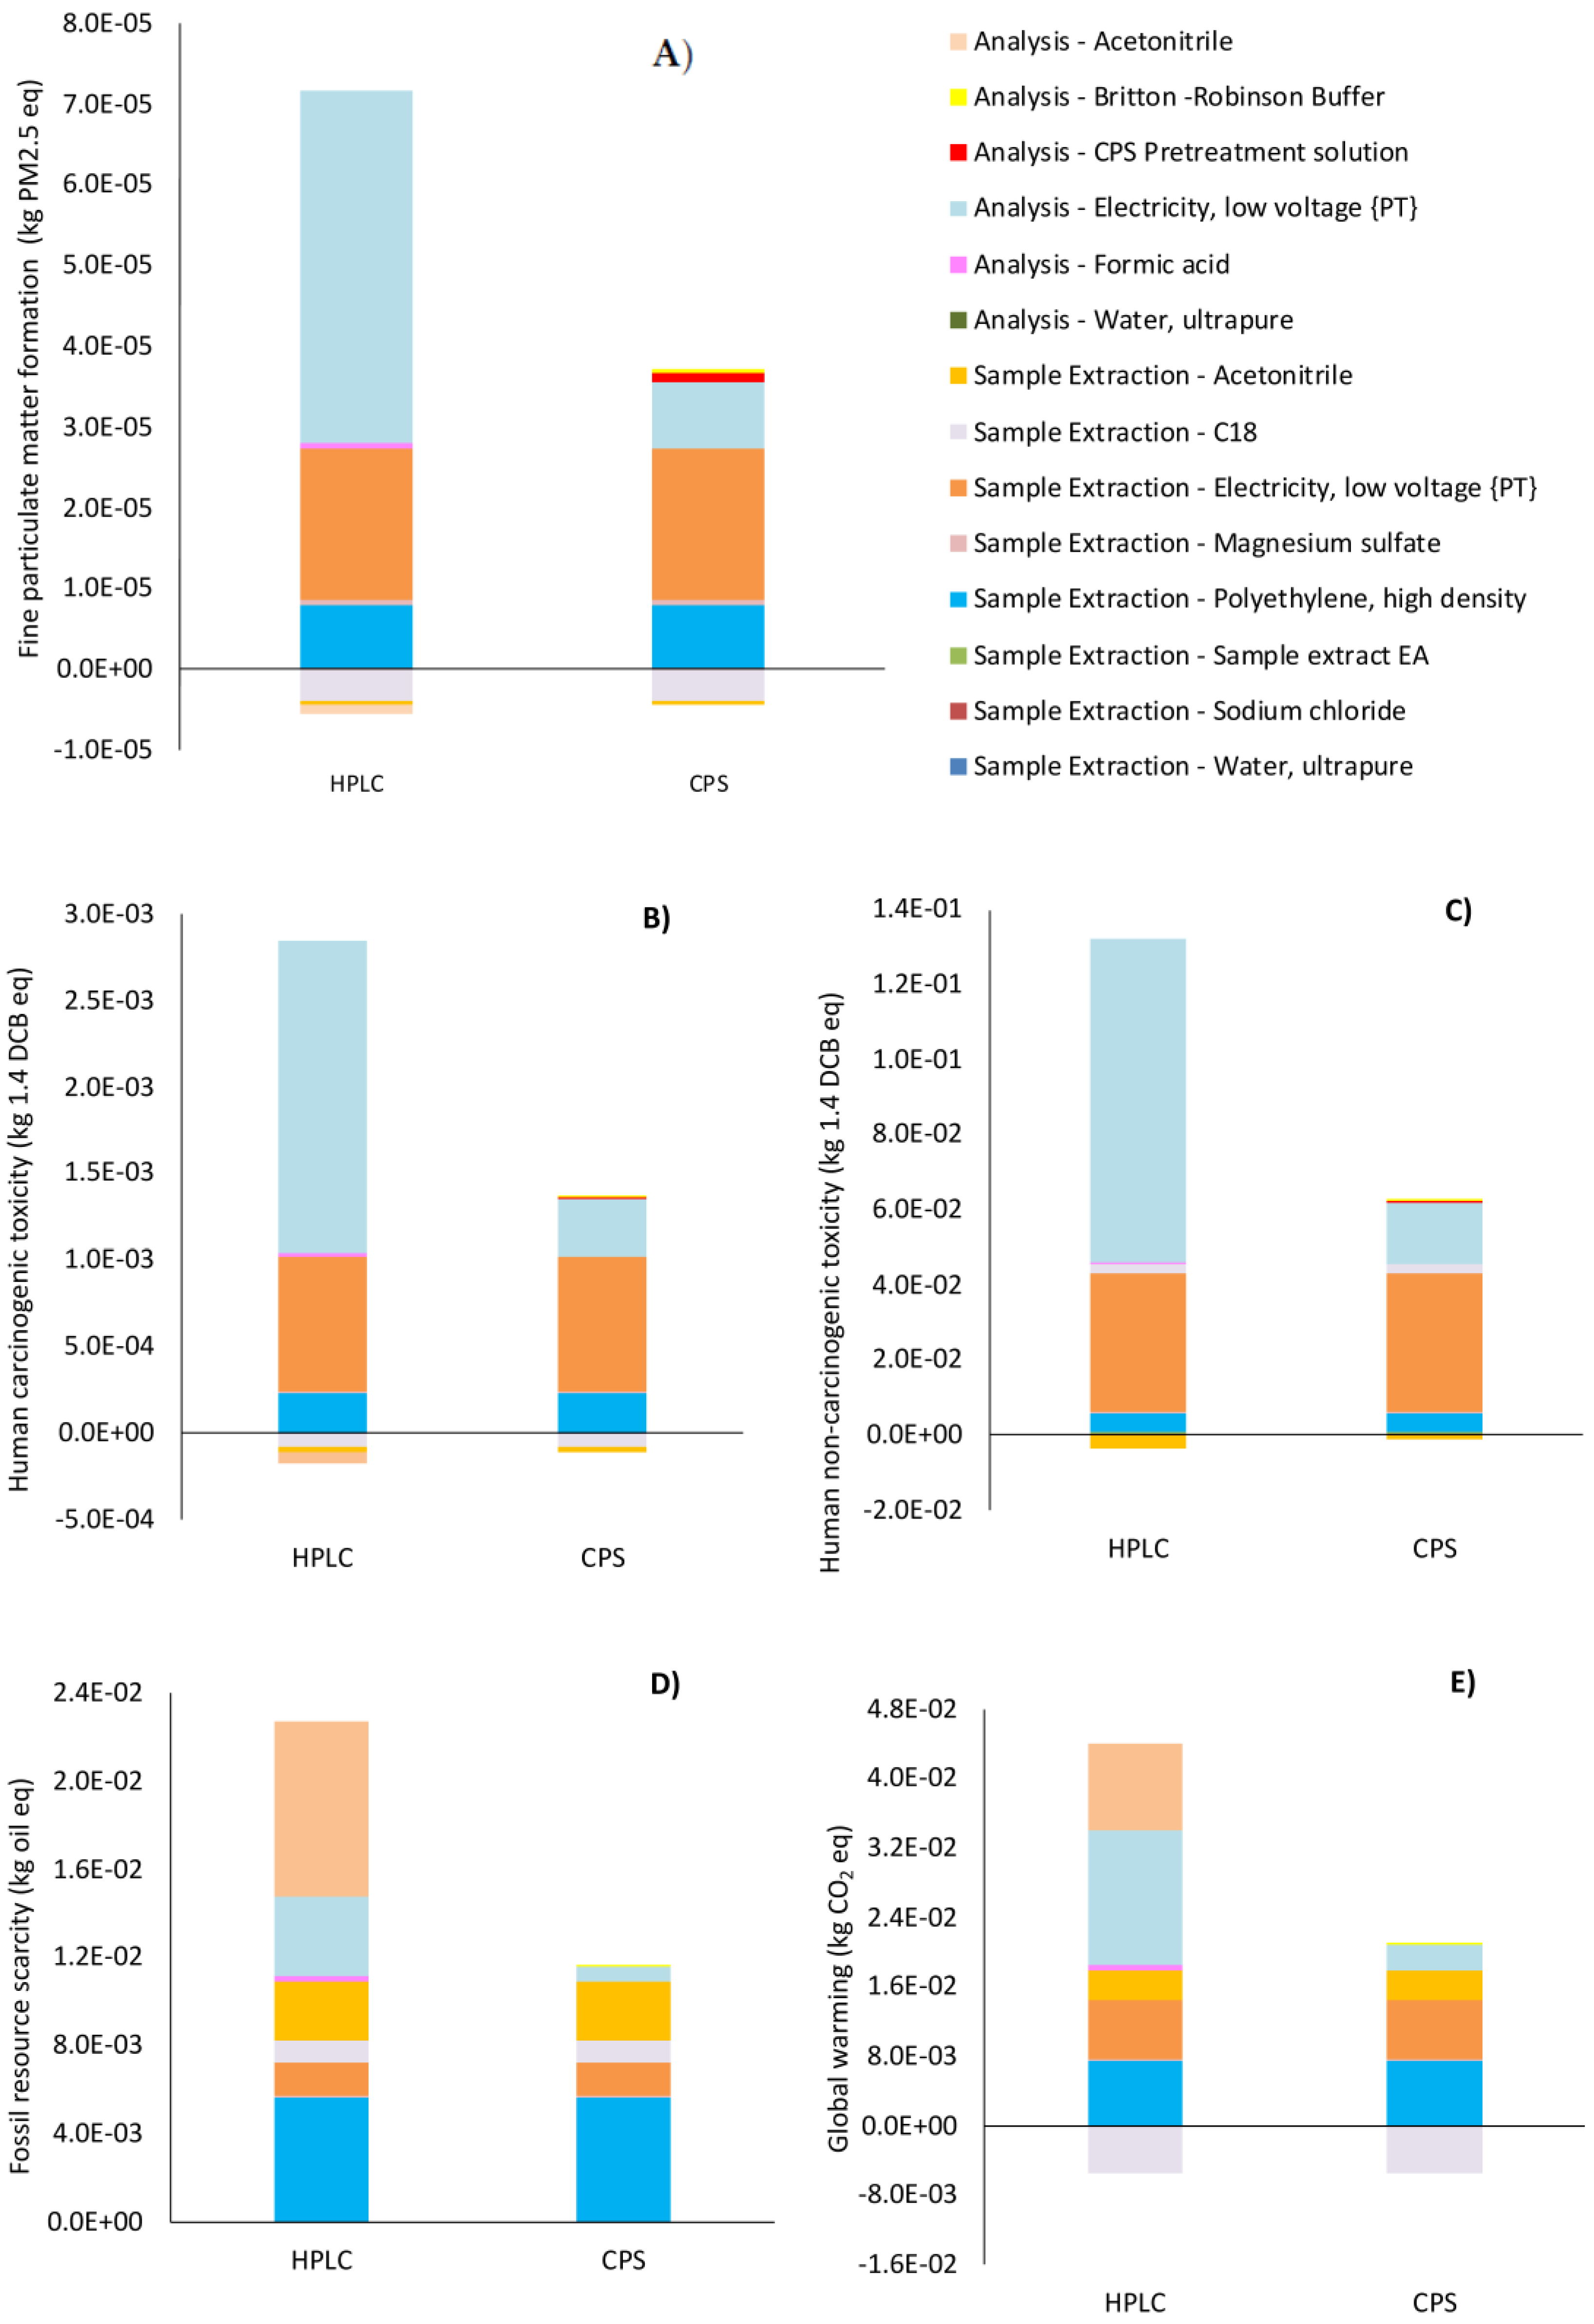
Figure 3A–E show the process contributions to the final values of the main environmental categories of impact (Midpoint). The results, as reported with a specific indication if the subprocesses contributed to the “sample extraction” or to the final “analysis” step (Figure 1), confirmed the clear environmental advantages of CPS in comparison with HPLC in all the main categories of impact analyzed in this study.
Higher final values of impact were obtained in the HPLC scenario compared with the CPS scenario due to the higher contribution provided by the “analysis” step, which accounts for 52% (fossil resource scarcity) to 68% (global warming) of the total values of the main categories of impact. This is a direct consequence of the higher electric energy consumption associated with the HPLC “analysis” step, which is more than fivefold higher for HPLC than for the CPS scenario (Table 3 and Table 4). This result is in full agreement with the literature, wherein electricity consumption is considered the main contributor to the environmental impacts associated with chromatographic analysis [6,12,30]. In fact, Schneider et al. [6] observed that electricity consumption, rather than solvents, was the major contributor to the environmental burden associated with the use of the HPLC system.
Figure 3A shows that in both the HPLC and CPS scenarios the “fine particulate matter formation” (FPM) category of impact is mainly affected by the indirect loads associated with the electric energy production in the Portuguese energy mix, with the “sample extraction” step contributing 1.87 × 10⁻⁵ kg PM2.5 eq in both the HPLC and CPS scenarios. The “analysis” step in the CPS scenario provides 8.20 × 10⁻⁶ kg PM2.5 eq, which is 81% lower than the corresponding values generated by HPLC (4.35 × 10⁻⁵ kg PM2.5eq). This evidence reflects the low electric energy demand required by CPS. The use of polyethylene tubes in the “sample extraction” step accounts for 24% and 12% of the final value of the FPM category of impact in the CPS and HPLC scenarios, respectively. It must be noted that FPM category of impact provides some environmental benefits, which are connected to acetonitrile and C18 salt, the production processes of which are able to reduce the final value of this category of impact by −1.20%, −2.37% (acetonitrile) and −12.3%, −6.1% (C18) in CPS and HPLC scenarios, respectively. These credits are derived from the market of hexane used for the synthesis of C18 QuEChERS salt and from the market of acetonitrile, the production processes of which, as modeled by the Ecoinvent 3.7 database, are based on hexane produced by molecular sieve separation of naphtha and methanol, both of which are supported by the process of industrial or district production of products other than natural gas. This last process is based on the global biomass market (wood pellets use) or other renewable fuels able to provide environmental credits to the system. The use of reagents marginally contribute to the final value of the FPM category of impact both in the “sample extraction” and “analysis” steps. For instance, magnesium sulfate accounts for 2.45% of the final FPM value, whereas sodium chloride accounts for 0.2% and 0.4% during the “sample extraction” step in the CPS and HPLC scenarios, respectively. The use of formic acid contributes 0.97% in the HPLC scenario, and CPS pretreatment reagents and Britton–Robinson buffer contribute 3.1% and 1.78% of the total value of FPM, respectively.
The human non-carcinogenic toxicity (HT-nc) category of impact is affected by the production of electric energy required for CPS and HPLC operations, accounting for 60.4% and 29% in the “sample extraction” step and by 26.5% and 67% in the “analysis” step, respectively, demonstrating, again, that electric energy production is the main contributor to HT-nc (Figure 3B). The use of polyethylene tubes in the “sample extraction” step accounts for 3.7% and 7.8% of the total value of HT-nc in the HPLC and CPS scenarios, respectively (Figure 3B). C18 preparation generates 2.15 × 10⁻³ kg 1.4 DCB eq of human non-cancerogenic toxicity, corresponding to 1.7% and 3.5% of the final HT-nc value in the HPLC and CPS scenarios, respectively. This is mainly due to the contributions of the activated silica and polymethyl siloxane processes.
Similar relative percentages of contribution are observed for human carcinogenic toxicity (HT-c), with absolute values two orders of magnitude lower than for HT-nc (Figure 3C). The use of polyethylene tubes is responsible for 17.4% and 8.3% of the total value of HT-c, with a contribution of 2.21 × 10⁻⁴ kg 1.4 DCB eq. It must be noted that for both HT-nc and HT-c, the use of reagents such as magnesium chloride, sulfuric acid used for CPS pretreatment, formic acid, and Britton–Robinson buffer accounts for less than 1% to the final value of HT-nc and HT-c both in the CPS and HPLC scenarios, suggesting the low indirect toxic effect on human health derived by the processing of most of the reagents used in these processes. Environmental credits from acetonitrile in HT-nc and HT-c (>1.4%), as well as from C18 in HT-c (>3%), are also observed (Figure 3C). This is due, as previously mentioned for the FPM category of impact, to the use of renewable resource for the production process in the global market (Ecoinvent 3.7) of acetonitrile and C18 constituents [20].
The fossil resource scarcity (FRS) category of impact is affected in the “sample extraction” step by the production of polyethylene (5.6 × 10⁻³ kg oil eq), acetonitrile (2.7 × 10⁻³ kg oil eq), electric energy 1.5 × 10⁻³ kg oil eq, and C18 (9.8 × 10⁻⁴ kg oil eq) (Figure 3D). In the CPS scenario, the “sample extraction” step contributes 94% to the final value of the FRS category of impact, with 48% due to polyethylene tube production, 23% due to acetonitrile, 13% to electric energy, and 8% due to C18 synthesis, whereas the remaining 6% is due to the electric energy required for the “analysis” step (Figure 2D). In the HPLC scenario, approximately equal contributions are provided by the “sample extraction” (48%) and “analysis” (52%) steps to the final value of FRS, with the “analysis” step mainly affected by acetonitrile (7.9 × 10⁻³ kg oil eq) and electric energy production (3.6 × 10⁻³ kg oil eq), accounting for 35% and 16% of total FRS value, respectively. In the FRS category of impact, the main contributors are represented by the reagents rather than energy generation, and the use of CPS shows a decrease in FRS by 49% when compared with HPLC, which, on an annual basis, allows for savings of 43.6 kg oil eq. This result highlights the importance of the process contribution for each category of impact, since it provides information for further environmental improvements.
Finally, Figure 2E represents a comparison of the impacts associated with the global warming (GW) category of impact for the CPS and HPLC scenarios. HPLC shows a final value of impact (3.85 × 10⁻² kg CO2 eq) 150% higher than that for the CPS scenario (1.54 × 10⁻² kg CO2 eq), which, on an annual basis, corresponds to a savings of 91.4 kg CO2 eq. The main contributions associated with the “sample extraction” step, which are equal for both the HPLC and CPS scenarios, include polyethylene (high density, granulate for tube production) (7.4 × 10⁻³ kg CO2 eq), acetonitrile (3.4 × 10⁻³ kg CO2 eq), electric energy production (1.34 × 10⁻² kg CO2 eq) and rely on significant environmental credits provided by C18 synthesis (−5.6 × 10⁻³ kg CO2 eq). The “analysis” step is mainly affected by electric energy consumption, the contribution of which in the HPLC scenario is 430% higher than in the CPS scenario and represents 41% of total HPLC GW value, whereas acetonitrile represents 26% (1.0 × 10⁻² kg CO2 eq). This evidence is confirmed by available literature data [6,12,30]. In the CPS scenario, electric energy consumption accounts for 19% of the final GW value, and reagents such as formic acid, Britton–Robinson buffer, and sulfuric acid used for CPS pretreatment contribute individually, with percentages always lower than 1.7%, representing minor contributions.
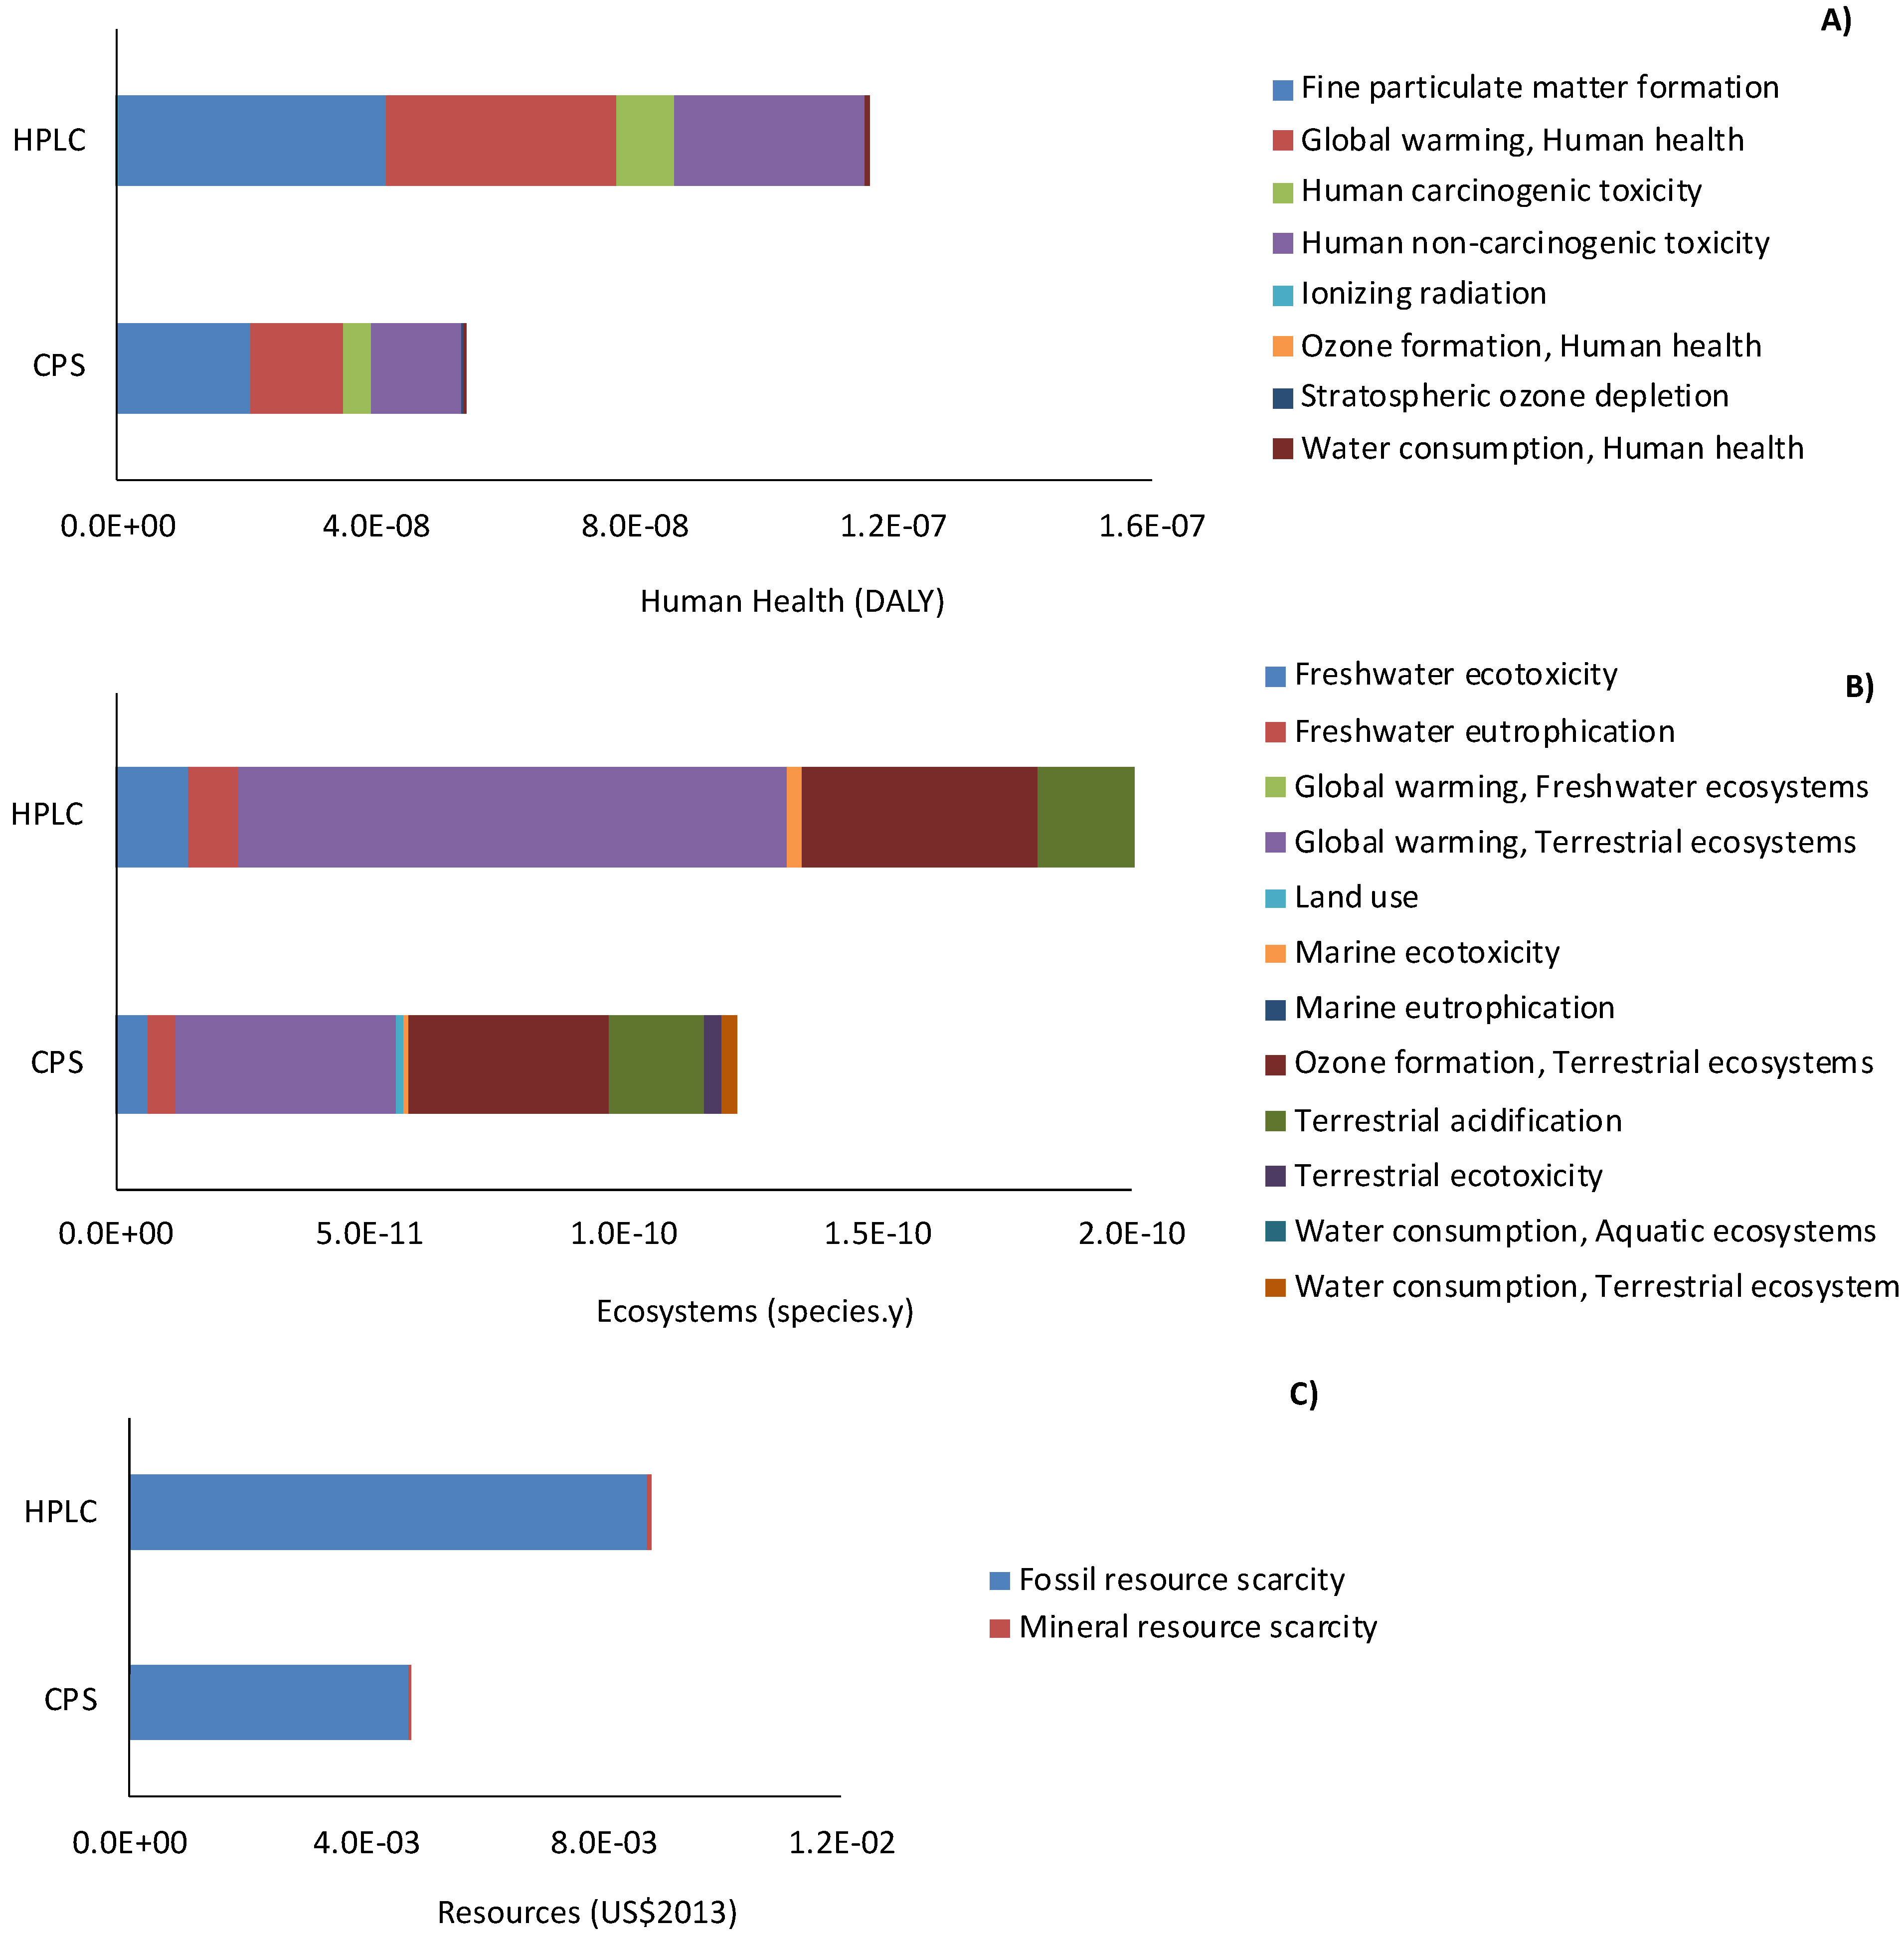
Figure 4A–C show the relative contributions of the categories of impact to the areas of protection of human health (DALY), ecosystems (species.y), and resources (USD 2013) calculated at the endpoint level. In all cases, CPS has fewer associated damages than HPLC, with 54%, 47.5%, and 46% lower damages in the three areas of protection, respectively. These results are in agreement with those found in a previous study [12], although the method used for calculation was different (ReCiPe2016 vs. IMPac 2000+).
Regarding human health (Figure 4A), “fine matter formation”, “global warming, human health”, and “human non-carcinogenic toxicity” are the main categories responsible for human health damage, whereas for the ecosystem area of protection (Figure 4B) “global warming, terrestrial ecosystems”, “ozone formation”, and “terrestrial acidification” account for, on average, 41%, 26%, and 16% of the final value, respectively.
Finally, as shown in Figure 3C, “mineral resource scarcity” marginally contributes to resource depletion, with damage associated with “fossil resource scarcity” accounting for 99% of the total damage in the area of protection of resources in both the CPS and HPLC scenarios.

3.2. Economic Analysis

The economic viability of the CPS analytical methodology was compared with that of traditional HPLC assuming equal depreciation time of 5 years for both equipment setups.
Figure 5A shows that HPLC is characterized by a total capital investment (TCI) more than fivefold higher than that required for the implementation of the CPS. Therefore, the working capital (WC) required for CPS operation is approximately one-fifth of that required for HPLC, with values of EUR 7153 and EUR 39074, respectively. In present study, the CPS and HPLC were equated for the detection of one pharmaceutical compound; thus, the duration of the run and the chemicals required for the “extraction phase” and “analysis phase” were calculated accordingly. Currently, HPLC is often used for punctual single analysis, is CPS, since no faster and easier alternative is available at large commercial scale. It must be noted that HPLC equipment is more complex and is able to detect several compounds at the same time under various operational conditions (more reagents, longer duration of the analysis, higher electric energy consumption), making it suitable for multitarget analysis.
Regarding investment and total annual cost (Figure 5B), the novel CPS is economically more advantageous than HPLC, as “maintenance and repairs”, including operating supplies for CPS, are, on average 96% lower than the corresponding values for HPLC. The reason is related to the high value associated with maintenance contract for the HPLC equipment, which accounts for 32% of the HPLC “fixed capital investment”, including the annual operating supplies (spare parts). The use of “chemicals” and “operating labor” contribute equally to both analytical methodologies, with “general expenses”, “waste”, and “utilities” representing marginal costs. A analysis of the profitability parameters, as reported in Table 9, clearly shows that the CPS is profitable, whereas HPLC has a negative associated net return with a hypothesized sale price of EUR 23 per analysis and 4950 analyses per year. The choice of the CPS analytical methodology under the conditions studied in this work guarantees a total positive net return (EUR 14,144) in a short payback period (less than one year), even assuming a minimum acceptable rate of return on the initial investment of 15% per year.

3.3. Discussion

Analysis of the categories of impact with the highest environmental relevance according to ReCiPe2016(H) weighting factors shows that the worse environmental performance provided by the HPLC scenario is mainly caused by the higher indirect impact associated with electric energy consumption during the “analysis” step for the FPM, HTR-nc, and HT-c categories of impact. For FRS and GW, beyond electric energy consumption, the use of acetonitrile as major component of the mobile phase contributes to the final impact values always being higher than 25%.
It must be noted that the use of reagents such as magnesium chloride, sulfuric acid solution for CPS pretreatment, formic acid, and Britton–Robinson buffer provides individually contributions always lower than 3.1% to the final value of the FPM, HT-nc, HT-c, and GWP categories of impact both in the CPS and HPLC scenarios; therefore, they can be considered minor environmental contributors.
Quantification of the advantages of the CPS on an annual basis shows an annual savings of 333 kg 1.4 DB eq of non-carcinogenic toxicity and 6.9 kg 1.4 DB eq of carcinogenic toxicity for human health, 43.6 kg oil eq in terms of fossil resources, and 91.4 kg CO2 eq of greenhouse gases emissions in comparison with HPLC.
In the “sample extraction” step, the use of polyethylene tubes to contain QuEChERS salts represents a significant contribution to the final values of the FPM, HTR-nc, HT-c, FRS, and GW categories of impact, accounting for 24 %, 17.4%, 7.8%, 48%, and 48% in the CPS scenario and 12 %, 8.3%, 3.7%, 25%, and 19% in the HPLC scenario, respectively.
The critical environmental aspects associated with the operation of the novel portable CPS device are related to energy supply and the use of fossil-derived polyethylene tubes. The systematization of the use of recycled polyethylene tubes, as well as the design of a CPS device energetically supplied by solar batteries or by 100% renewable sources, may drastically improve its environmental performance, making the novel device close to carbon-neutral, since processes that currently have higher impacts provide credits to the system.

4. Conclusions

CPS systems have been successfully used in electroanalytical applications owing to their set of unique electrochemical and mechanical characteristics; furthermore, such systems are adjustable in terms of size and format. When applied to ketoprofen detection, the novel CPS investigated herein achieved high sensitivity without the need for additional reagents and surface modifiers, representing a more portable and ecofriendly analytical solution when compared to the traditional analytical technique (HPLC).
The LCA results obtained in this work demonstrate that the environmental impacts associated with the use of the novel CPS for the analysis of ketoprofen in fish samples are, on average, 26% lower when compared to the HPLC technique in the 18 categories of impact analyzed in this study (ReCiPe2016 method). This is mainly due to the lower consumption of electric energy and to the reduced quantities of reagents and chemicals required. CPS methodology showed higher impacts in the extraction step than in the analysis step due, in part, to the use of organic solvents. A possible solution to mitigate these impacts relies on finding greener solvents or the development of simpler extraction procedures.
Similarly, economic analysis indicates that the novel CPS-based methodology is economically more advantageous and profitable in a short period of time, providing a positive net return on investment. Moreover, the high initial capital investment, maintenance costs, and quantity of reagents required for HPLC analysis reduce the economic competitiveness of this traditional technology when compared to the smaller, faster, and less complex portable CPS device. Despite their environmental and economic advantages, a clear limitation of sensors not specifically identified in this study but from a general perspective, is their lower capacity to perform multianalyte detection compared with chromatographically based methods.
This work highlights how the application of life cycle methodology integrated with a specific economic analysis can quantify the advantages of this novel, sustainable, and eco-friendly analytical device for ketoprofen analysis and suggests how these advantages can be further improved. Thus, LCA is a pertinent tool, although still employed to a limited extent in the electroanalytical field, that offer the potential for new research opportunities. The systematic application of the LCA methodology to assess the environmental impacts associated with the development of new devices and methodologies from the early stage of their development is an effective way to select the most environmentally sustainable solutions.

Supplementary Materials

The following supporting information can be downloaded at: https://www.mdpi.com/article/10.3390/su15086775/s1, Table S1: Assumptions made for the elaboration of the life cycle inventory; Table S2: Methodology used for the profitability analysis; Table S3: Depreciation factors used for the development of the profitability analysis; Table S4: Comparison of the “weighted” total impacts of high-performance liquid chromatography (HPLC) with the novel CPS calculated according to the ReCiPe endpoint (H) method. Refs. [31,32,33] are mentioned in supplementary materials.

Author Contributions

Conceptualization, E.S. and S.M.; methodology, E.S. and S.M.; formal analysis, E.S.; investigation, E.S., Á.T. and S.M.; resources, S.M.; data curation, E.S, Á.T., C.D.-M. and S.M.; writing—original draft preparation, E.S. and Á.T.; writing—review and editing, E.S., Á.T., C.D.-M. and S.M.; supervision, S.M.; project administration, S.M.; funding acquisition C.D.-M. and S.M. All authors have read and agreed to the published version of the manuscript.

Funding

This work was financially supported through project NATURIST 2022.07089.PTDC by the Fundação para a Ciência e a Tecnologia (FCT), Ministério da Ciência, Tecnologia e Ensino Superior (MCTES) and through national funds.

Institutional Review Board Statement

Not applicable.

Informed Consent Statement

Not applicable.

Data Availability Statement

Not applicable.

Acknowledgments

This work received support from UIDB/50006/2020, UIDP/50006/2020, and LA/P/0008/2020 from the Fundação para a Ciência e a Tecnologia (FCT)/Ministério da Ciência, Tecnologia e Ensino Superior (MCTES). Álvaro Torrinha thanks FCT (Fundação para a Ciência e Tecnologia) for funding provided through the Scientific Employment Stimulus-Individual Call (ref. 2022.04357.CEECIND) and the REQUIMTE 2020-23 fellowship (UIDB/50006/2020).

Conflicts of Interest

The authors declare no conflict of interest.

Abbreviations

1.4-DCB eq1.4-dichlorobenzene equivalents
CFC11 eqChlorofluorocarbon-11 equivalents
CO2 eqCarbon dioxide equivalents
Co-60 eqCobalt-60 equivalents
CPSCarbon paper sensor
Cu eqCopper equivalents
DALYDisease-adjusted life years of electrochemical cells
FPMFine particulate matter formation
FCIFixed capital investment
FRSFossil resource scarcity
GLOGlobal
GWGlobal warming
HPLCHigh-performance liquid chromatography
HT-cHuman carcinogenic toxicity
HT-ncHuman non-carcinogenic toxicity
LCALife cycle assessment
LCILife cycle inventory
LCIALife cycle impact assessment
m2a crop eqArea time (crop) equivalents
NOx eqNitrogen oxide equivalents oil eq oil equivalents
P eqPhosphorus equivalents
PM2.5 eqParticulate matter (less than or equal to 2.5 μm in diameter) equivalents
QuEChERSQuick, easy, cheap, effective, rugged, and safe
RoWRest of the world U Unit
SO2 eqSulfur dioxide equivalents species
yspecies per year
USD 2013United States Dollars 2013
WCWorking capital

References

  1. Torrinha, Á.; Oliveira, T.M.B.F.; Ribeiro, F.W.P.; Correia, A.N.; Lima-Neto, P.; Morais, S. Application of nanostructured carbon-based electrochemical (Bio)sensors for screening of emerging pharmaceutical pollutants in waters and aquatic species: A review. Nanomaterials 2020, 10, 1268. [Google Scholar] [CrossRef] [PubMed]
  2. Torrinha, Á.; Martins, M.; Tavares, M.; Delerue-Matos, C.; Morais, S. Carbon paper as a promising sensing material: Characterization and electroanalysis of ketoprofen in wastewater and fish. Talanta 2021, 226, 122111. [Google Scholar] [CrossRef] [PubMed]
  3. Guinée, J. Handbook on Life Cycle Assessment; Kluwer Academic Publisher: Norwell, MA, USA, 2004; ISBN 9780415475976. [Google Scholar]
  4. Arzoumanidis, I.; D’Eusanio, M.; Raggi, A.; Petti, L. Functional Unit Definition Criteria in Life Cycle Assessment and Social Life Cycle Assessment: A Discussion. In Perspectives on Social LCA: Contributions from the 6th International Conference; Traverso, M., Petti, L., Zamagni, A., Eds.; Springer International Publishing: Cham, Switzerland, 2020; pp. 1–10. ISBN 978-3-030-01508-4. [Google Scholar]
  5. ISO 14040:2006; International Organization for Standardisation (ISO) Environmental Management—Life Cycle Assessment—Principles and Framework 2023). Available online: https://www.iso.org/obp/ui/#iso:std:iso:14040:ed-2:v1:en (accessed on 1 March 2023).
  6. Schneider, L.; Finkbeiner, M.; Leiser, S.; Knauer, A.; Bünz, A. The Life of an HPLC System An Environmental Perspective. Available online: https://www.knauer.net/Dokumente/overviews_and_systems/old/vev0041p_hplc_2011_life_cycle_assessment.pdf (accessed on 1 April 2023).
  7. Huijbregts, M.; Steinmann, Z.J.N.; Elshout, P.M.F.M.; Stam, G.; Verones, F.; Vieira, M.D.M.; Zijp, M.; van Zelm, R. ReCiPe 2016-A Harmonized Life Cycle Impact Assessment Method at Midpoint and Endpoint Level Report I: Characterization; RIVM Report 2016-0104; RIVM: Bilthoven, The Netherlands, 2016. [Google Scholar]
  8. Acero, A.P.; Rodriguez, C.; Ciroth, A. LCIA Methods: Impact Assessment Methods in Life Cycle Assessment and Their Impact Categories, Version 1.5.6; GreenDelta: Berlin, Germany, 2017; pp. 1–23. [Google Scholar]
  9. Ahamed, A.; Ge, L.; Zhao, K.; Veksha, A.; Bobacka, J.; Lisak, G. Environmental footprint of voltammetric sensors based on screen-printed electrodes: An assessment towards “green” sensor manufacturing. Chemosphere 2021, 278, 130462. [Google Scholar] [CrossRef] [PubMed]
  10. Le Brun, G.; Raskin, J.P. Material and manufacturing process selection for electronics eco-design: Case study on paper-based water quality sensors. Procedia CIRP 2020, 90, 344–349. [Google Scholar] [CrossRef]
  11. Cetinkaya, A.Y.; Kuzu, S.L.; Bilgili, L. Development of an MFC-biosensor for determination of Pb+2: An assessment from computational fluid dynamics and life cycle assessment perspectives. Environ. Monit. Assess. 2022, 194, 245. [Google Scholar] [CrossRef] [PubMed]
  12. Martins, F.; Torrinha, Á.; Delerue-Matos, C.; Morais, S. Life Cycle Assessment and Life Cycle Cost of an Innovative Carbon Paper Sensor for 17α-Ethinylestradiol and Comparison with the Classical Chromatographic Method. Sustainability 2022, 14, 8896. [Google Scholar] [CrossRef]
  13. Ashby, M.F. Life Cycle Costing, LCC. In Materials and Sustainable Development, 2nd ed.; Ashby, M.F., Ed.; Butterworth-Heinemann: Oxford, UK, 2022; pp. 149–181. ISBN 978-0-323-98361-7. [Google Scholar]
  14. Gómez-Regalado, M.d.C.; Martín-Pozo, L.; Martín, J.; Santos, J.L.; Aparicio, I.; Alonso, E.; Zafra-Gómez, A. An Overview of Analytical Methods to Determine Pharmaceutical Active Compounds in Aquatic Organisms. Molecules 2022, 27, 7569. [Google Scholar] [CrossRef] [PubMed]
  15. Fu, R.; Zhai, A. Determination of Hormones in Shrimp by Agilent 1290 Infinity LC with Agilent Poroshell 120 LC Column and Agilent QuEChERS for Sample Preparation; Agility Technologies Inc.: Atlanta, GA, USA, 2012. [Google Scholar]
  16. Toledo-Neira, C.; Álvarez-Lueje, A. Ionic liquids for improving the extraction of NSAIDs in water samples using dispersive liquid-liquid microextraction by high performance liquid chromatography-diode array-fluorescence detection. Talanta 2015, 134, 619–626. [Google Scholar] [CrossRef] [PubMed]
  17. International Organization for Standardisation (ISO) Environmental Management—Life Cycle Assessment—Requirements and Guidelines (ISO 14044: 2006). Available online: https://www.iso.org/obp/ui/#iso:std:iso:14044:ed-1:v1:en (accessed on 1 March 2023).
  18. WHO Disability-Adjusted Life Years (DALYs). Available online: https://www.who.int/data/gho/indicator-metadata-registry/imr-details/158 (accessed on 12 May 2022).
  19. Ellen Meijer Weighting: Applying a Value Judgment to LCA Results. Available online: https://pre-sustainability.com/articles/weighting-applying-a-value-judgement-to-lca-results/ (accessed on 24 June 2022).
  20. Wernet, G.; Bauer, C.; Steubing, B.; Reinhard, J.; Moreno-Ruiz, E.; Weidema, B. The ecoinvent database version 3 (part I): Overview and methodology. Int. J. Life Cycle Assess. 2016, 21, 1218–1230. [Google Scholar] [CrossRef]
  21. Suh, S.; Huppes, G. Methods in the Life Cycle Inventory of a Product. In Handbook of Input-Output Economics in Industrial Ecology; Suh, S., Ed.; Springer: Dordrecht, The Netherlands, 2009; pp. 263–282. ISBN 978-1-4020-5737-3. [Google Scholar]
  22. da Silva, C.G.A.; Collins, C.H. Preparation and characterization of a poly(methyloctadecylsiloxane) thermally immobilized onto zirconized silica stationary phase for high-performance liquid chromatography. J. Chromatogr. A 2012, 1232, 248–256. [Google Scholar] [CrossRef] [PubMed]
  23. Maltez, H.F.; Costa Melo, L.F.; De Queiroz, S.C.D.N.; Jardim, I.C.S.F.; Curtius, A.J.; Carasek, E. A comparative study of homemade C18 and commercial C 18 sorbents for preconcentration of lead by minicolumn solid phase extraction. Microchim. Acta 2004, 144, 17–21. [Google Scholar] [CrossRef]
  24. Waters Corporation. 515 HPLC Pump Operator’s Guide-WAT068980/Revision 5; Waters Corporation: Milford, MA, USA, 2010. [Google Scholar]
  25. Morais, S. Extraction Procedure for Analysis of Ketoprofen in Fish Samples; Laboratorial Records: Porto, Portugal, 2022. [Google Scholar]
  26. Timmerhaus, K.D.; Peters, M.S. Plant Design and Economica for Chemical Engineers, 4th ed.; Carberry, J.J., Fair, J.R., Schowalter, W.P., Tipell, M., Wei, J., Eds.; McGRAW_HILL International Editions-Chemical and Petroleum Engineering Series; McGraw-Hill International: Singapore, 1991; ISBN 0070496137. [Google Scholar]
  27. Sigma-Aldrich Chemical Products. Available online: https://www.sigmaaldrich.com/PT/en?gclid=CjwKCAiA3KefBhByEiwAi2LDHLUYuF7WrgfIvzqs9FSacEEx-1EPKMug-5AkLUyH37VRgXA28AkRmBoCC8wQAvD_BwE&gclsrc=aw.ds (accessed on 13 February 2023).
  28. GreenDelta openLCA–The Life Cycle and Sustainability Modeling Suite. Available online: https://www.openlca.org/openlca/ (accessed on 3 October 2020).
  29. Meijer, E. Weighting: Applying a Value Judgment to LCA Results. Available online: https://pre-sustainability.com/articles/weighting-applying-a-value-judgement-to-lca-results/#:~:text=Weighting LCA results creates a single score&text=The weighted results all have,judgment to your LCA results (accessed on 5 May 2022).
  30. Fitch, B.N.; Gray, R.; Beres, M.; Hicks, M.B.; Farrell, W.; Aurigemma, C.; Olesik, S. V Life cycle analysis and sustainability comparison of reversed phase high performance liquid chromatography and carbon dioxide-containing chromatography of small molecule pharmaceuticals. Green Chem. 2022, 24, 4516–4532. [Google Scholar] [CrossRef]
  31. TRELAB Inventory of Laboratorial Waste Produced in 2021 at Instituto Superior de Engenharia do Porto (ISEP). Internal Records. 2021.
  32. EDP Tarifários Energía Verde. Available online: https://www.edp.pt/particulares/energia/tarifarios/ (accessed on 13 June 2022).
  33. Trading Economics Portugal Core Inflation Rate. Available online: https://tradingeconomics.com/portugal/core-inflation-rate (accessed on 14 June 2022).
Figure 1. Schematic representation of the development and validation of carbon paper sensors. (a) Electrochemical setup, showing 1—potentiostat 2—voltametric measuring stand supporting the electrodes, 3—computer with software. (b) Three-electrode cell configuration composed by 1—CPS, 2—auxiliary platinum electrode, 3—Ag/AgCl reference electrode, 4—glass electrochemical cell. (c) CPS with scanning electron microscopy images of 100· and 500· magnifications. (d) Cyclic voltammetry of 50 µM ketoprofen performed at 100 mV s−1 in 0.1 M Britton–Robinson buffer (pH 5.5, purged with N2). The peak is observed at −1.1 V in relation to the Ag/AgCl reference electrode. (e) Diagram of the ketoprofen extraction procedure.
Sustainability 15 06775 g001
Figure 2. Diagram of the electrochemical CPS (Scenario 1) and HPLC (Scenario 2) procedures under study. System boundaries: the green dashed line refers to CPS, and the blue dashed line refers to HPLC. The values reported in Section 2.2.2. represent the experimental conditions according to the mass and energy balance of the system under study.
Sustainability 15 06775 g002
Figure 3. Comparison of the process contributions to (A) fine particulate matter formation, (B) human non-carcinogenic toxicity, (C) human carcinogenic toxicity (D), fossil resource scarcity, and (E) global warming categories of impact of the HPLC and CPS scenarios according to the ReCiPe midpoint (H) method. All values are relative the functional unit (one analysis).
Sustainability 15 06775 g003
Figure 4. Comparison of the contributions to the categories of impact in three areas of protection—(A) human health (DALY), (B) ecosystems (species.y), and (C) resources (USD 2013)—for the CPS and HPLC scenarios according to the ReCiPe endpoint (H) method. All values are relative to the functional unit (one analysis).
Sustainability 15 06775 g004
Figure 5. Investment and total annual costs: (A) fixed Capital investment and working capital; (B) chemical, labor, utility, and waste costs associated with HPLC and CPS. All values are reported on an annual basis.
Sustainability 15 06775 g005
Table 1. Inventory data of the sample extraction process. All values are relative to the base of calculation: one functional unit.
Step 1 (Sample Weighting)UnitValue
INPUT
Fish, unspecified, in seag0.5
Electricity, low voltage {PT}, market for|Conseq, UkWh9.0 × 10−5
Polyethylene, high density, granulate {GLO}|market for|Cons, Ug7.6
OUTPUT
Polyethylene, high density, granulate {GLO}|market for|Cons, Ug7.6
Weighted fish sample0.5
Step 2 (Mixing)
INPUT
Weighted fish sampleg0.5
Ultrapure water {RER}|water production, ultrapure|Conseq, UmL5.0
Electricity, low voltage {PT}, market for|Conseq, UkWh5.0 × 10−4
Polyethylene, high density, granulate {GLO}|market for|Cons, Ug7.6
OUTPUT
Mixed fish sample g5.5
Polyethylene, high density, granulate {GLO}|market for|Cons, Ug7.6
Step 3 (salting out QuEChERS) and Step 4 (centrifugation)
INPUT
Mixed fish sample g5.5
Acetonitrile {GLO}|market for|Conseq, U (1)mL10
Magnesium Sulfate {RER}|production|Conseq, Ug4
Sodium chloride, powder {RER}|production|Conseq, Ug1
Polyethylene, high density, granulate {GLO}|market for|Cons, U 7.6
Electricity, low voltage {PT}, market for|Conseq, UkWh1.12 × 10−2
OUTPUT
Fish sample salted out 1 (2)mL6
Waste
Hazardous waste, EWC 150110* (WFL)/ RERg7.6
Hazardous waste (wfd)/RER (2)13.2
Step 5 and Step 6 (salting out dSPE QuEChERS + mixing + centrifugation + chilling)
INPUT
Fish sample salted out 1mL6
C18 (Table 2)g1.50 × 10−1
Magnesium sulfate9.0 × 10−1
Polyethylene, high density, granulate {GLO}|market for|Cons, U3.0
Electricity, low voltage {PT}, market for|Conseq, UkWh7.10 × 10−2
OUTPUT
Fish sample salted out 2 mL4.0
Waste
Hazardous waste, EWC 150110* (wfl)/RERg3.0
Hazardous waste (wfd)/RER (2)g2.62
Step 7 (evaporation)
INPUT
Fish sample salted out 2mL4.0
N2 streamcm3negligible
Electricity, low voltage {PT}, market for|Conseq, UkWh7.0 × 10−2
OUTPUT
Fish extractg0.01
Emission to air
Acetonitrile (20% w/w)mL2.67
Water vapor (80% w/w)1.33
Step 8 (dissolution)
INPUT
Evaporated fish extractg0.01
Acetonitrile {GLO}|market for|Conseq, U mL4.0 × 10−1
Ultrapure water {RER}|water production, ultrapure|Conseq, U1.6
Electricity, low voltage {PT}, market for|Conseq, UkWh/L1.6 × 10−2
OUTPUT
Fish extract for analysismL6.0 × 10−2
Hazardous waste (wfd)/RER1.99
(1) Acetonitrile density 0.786 g/cm3; (2) acetonitrile aq density: 0.857 g/cm3.
Table 2. Inventory data of the synthesis of C18 sorbent. All values are relative to the functional unit (one analysis).
C18 SynthesisUnitValue
INPUT
Activated silicag1.30 × 10−1
polydimethylsiloxane (PMODS) {GLO}|market for|Conseq, U2.11 × 10−2
Electricity, low voltage {PT}, market for|Conseq, UkWh1.47 × 10−3
Hexane {GLO}|production|Conseq, Ug2.49
Pentane {RoW}|production|Conseq, U5.28 × 10−2
Methanol {GLO}|production|Conseq, U4.19
OUTPUT
C18g1.5 × 10−1
Emission to air
Hexane (1) 2.49
Pentane 5.28 × 10⁻²
Methanol (2) 4.19
(1) Hexane density (20 °C): 0.66 g/cm3; (2) Ethanol density (20 °C): 0.791 g/cm3.
Table 3. Inventory data of electrochemical analysis with CPS. All values are relative to the functional unit (one analysis).
Electrochemical AnalysisUnitValue
INPUT
Fish extractmL1.0 × 10−2
Ultrapure water {RER}|water production, ultrapure|Conseq, U9.93
Britton-Robinson buffer
Sodium hydroxide, w/o water, 50% sol. state, market forg4.14 × 10−2
Acetic acid, w/o water, 98% sol. state, market for1.8 × 10−2
Phosphoric acid, merchant grade (75% H3PO4) at plant3.9 × 10−2
Boric acid, anhydrous, powder production|Conseq, U1.8 × 10−2
Potassium chloride, industrial grade, market for|Conseq, U3.7 × 10−2
CPS pretreatment solution
Sulfuric acid {RER}|, market for|Conseq, U mL2.7 × 10−1
Ultrapure water {RER}|market for water, ultrapure|Conseq, U9.7
Electricity, low voltage {PT}, market for|Conseq, UkWh3.7 × 10−2
OUTPUT
Electrochemical analysisitem1
Waste
Dummy_Disposal, liquid wastes, unspecified to wastewater treatment/|/RNAmL20.1
Table 4. Inventory data for high-performance liquid chromatography analysis. All values are relative to the functional unit (one analysis).
High-Performance Liquid ChromatographyUnitValue
INPUT
Fish extractmL1.0 × 10−2
Ultrapure water {RER}|water production, ultrapure|Conseq, UmL6.6
Formic acid {RER}|market for |Conseq, UmL0.17
Acetonitrile {GLO}|market for|Conseq, UmL10.2
Electricity, low voltage {PT}, market for|Conseq, UkWh2.1 × 10−1
OUTPUT
Chromatographic analysisItem1
Waste
Dummy, disposal, liquid wastes, unspecified to wastewater treatment/|/RNAmL17
Table 5. Purchased equipment (PE) costs.
ItemQuantityCPSHPLC
Total Cost
EUR
Electrochemical platform1 item213-
Sensors with 40 chips with 6 electrochemical cells (ECs) each (silicon+metal (Au/Cr/Al2O3))Batch1449-
PGSTAT12 potentiostat1 item5000-
Reference electrode246-
Counter electrode (platinum)246-
Waters 2795 separation module and Waters 2996 PDA detector-38,573
HPLC HC-C18 column: 170 A, 5 μm, 4.6 × 250 mm-501
TOTAL COST 715339,074
Table 6. Material, labor, utility, and waste disposal costs of electrochemical analysis and HPLC.
ItemUnitUnit CostAnnual AmountAnnual Value
CPSHPLC
#EUR/##/yEUR/y
Materials
QuEChERS salts, orig.
(4 g MgSO4 + 1 g NaCl)
tube3.12495015,45315,453
QuEChERS salts, dSPE
(0.15 g C18 and 0.9 g MgSO4)
3.6418,02818,028
Acetonitrile-1.4169836983
Britton–Robinson buffer (0.1 M) (1)analysis0.01679.2-
CPS pretreatment solution (2)0.004723.3-
Mobile phase for HPLC (3)1.40-6939
Labor
Laboratory technicianh16.0181629,05629,056
Utilities
Electric energy purchase cost (PT)kWh0.20215,514 (4)/23,955 (5)313483
Waste disposal
070704* Waste: organic solvents, washing liquids, and mother liquorskg0.171816 (6)/1447 (7)30.824.6
150110* Waste: packaging containing residues of or contaminated by hazardous substances0.1152.55.85.8
(1) For 10 mL Britton–Robinson buffer (0.1 M), the following chemicals manufactured by Sigma-Aldrich were considered: 0.027 g NaOH (49.3 EUR/kg), 0.018 g CH3COOH (62 EUR/L), 0.029 g H3PO4 (168 EUR/L), 0.018 H3BO3 (69.7 EUR/kg), 0.037 g KCl (159 EUR/kg) [27], and UP (0.47 EUR/L) [28]. (2) For 10 mL CPS pretreatment solution with H2SO4 0.5 M, the following chemicals were considered: 0.49 g H2SO4 with 95–98% purity (94.98 EUR/L) [27] and UP (0.47 EUR/L) [28]. (3) The mobile phase was injected for 17 min at a flow rate of 1 mL/min (17 mL. analysis). The mobile phase was composed of 60% v/v acetonitrile (135.6 EUR/L), 40% v/v UP water (0.47 EUR/L), and 0.1% v/v formic acid (86.6 EUR/L). (4) Annual electric energy demand for CPS. (5) Annual electric energy demand for HPLC analysis. (6) Annual spent liquid hazardous waste produced by CPS. (7) Annual spent liquid hazardous waste produced by HPLC.
Table 7. Annual costs of CPS and HPLC analysis.
CostsCPSHPLC
EUR/y
Variable Costs (VC)
Raw materials00
Operating labor29,05629,056
Utilities and waste disposal350521
Maintenance and repairs59014,990
Operating supplies 892248
Reagents40,56647,398
Total VC66,79494,212
Fixed Costs (FC)
Taxes (property)00
Financing (interest)00
Insurance00
Rent00
Depreciation (1)Calculated separately
Total FC00
Total Costs70,65194,212
General Expenses (GE)
Administration593881
TOTAL71,24495,093
(1) Depreciation factors are reported in Table S3.
Table 8. Comparison of the total impacts of the high-performance liquid chromatography (HPLC) with those of the novel carbon paper sensor (CPS). Green and yellow cells represent the lowest and highest values of categories of impact, respectively (functional unit: one analysis).
Impact CategoryUnitHPLCCPSUnitHPLCCPS
Midpoint (H)Endpoint (H)
Fossil resource scarcitykg oil eq2.27 × 10−2 1.17 × 10⁻²USD20138.70 × 10−3 4.71 × 10⁻³
Mineral resource scarcitykg Cu eq3.89 × 10−4 1.86 × 10⁻⁴USD20138.99 × 10−5 4.3 × 10⁻⁵
Fine particulate matter formationkg PM2.5 eq6.60 × 10−5 3.28 × 10⁻⁵DALY4.14 × 10−8 2.06 × 10⁻⁹
Global warmingkg CO2 eq3.85 × 10−2 1.54 × 10⁻²DALY
Global warming, human health DALY3.57 × 10−8 1.43 × 10⁻⁸
Global warming, terrestrial ecosystems species.y 1.08 × 10⁻¹⁰ 4.31 × 10⁻¹¹
Global warming, freshwater ecosystems species.y 2.95 × 10⁻¹⁵ 1.18 × 10⁻¹⁶
Water consumptionm3 1.92 × 10⁻³ 8.53 × 10⁻⁴
Water consumption, human health DALY 8.06 × 10⁻¹⁰ 3.66 × 10⁻¹⁰
Water consumption, terrestrial ecosystems species.y 6.97 × 10⁻¹² 3.14 × 10⁻¹²
Water consumption, aquatic ecosystems species.y 1.20 × 10⁻¹⁵ 5.31 × 10⁻¹⁶
Human non-carcinogenic toxicitykg 1,4-DCB 1.29 × 10⁻¹ 6.15 × 10⁻²DALY 8.84 × 10⁻⁹ 4.20 × 10⁻⁹
Human carcinogenic toxicity 2.66 × 10⁻³ 1.26 × 10⁻³DALY 2.94 × 10⁻⁸ 1.40 × 10⁻⁸
Freshwater ecotoxicity 2.09 × 10⁻² 9.43 × 10⁻³species.y 1.45 × 10⁻¹¹ 6.52 × 10⁻¹²
Terrestrial ecotoxicity 6.53 × 10⁻¹ 2.96 × 10⁻²species.y 7.45 × 10⁻¹² 3.38 × 10⁻¹²
Ozone formationkg NOx eq 2.57 × 10⁻⁴ 2.05 × 10⁻⁴
Ozone formation, human health DALY 2.34 × 10⁻¹⁰ 1.87 × 10⁻¹⁰
Ozone formation, terrestrial ecosystems species.y 4.65 × 10⁻¹¹ 3.96 × 10⁻¹¹
Terrestrial acidificationkg SO2 eq 1.83 × 10⁻⁴ 8.75 × 10⁻⁵species.y 3.87 × 10⁻¹¹ 1.85 × 10⁻¹¹
Stratospheric ozone depletionkg CFC11 eq 2.94 × 10⁻⁸ 1.12 × 10⁻⁸DALY 1.56 × 10⁻¹¹ 5.94 × 10⁻¹²
Freshwater eutrophicationkg P eq 1.47 × 10⁻⁵ 8.14 × 10⁻⁶species.y 9.83 × 10⁻¹² 5.45 × 10⁻¹²
Land usem2a crop eq 1.84 × 10⁻⁴ 1.52 × 10⁻⁴species.y 1.63 × 10⁻¹² 1.35 × 10⁻¹²
Ionizing radiationkBq Co-60 eq 6.48 × 10⁻⁴ 1.13 × 10⁻⁴DALY 5.50 × 10⁻¹² 1.11 × 10⁻¹²
Marine eutrophicationkg N eq 8.68 × 10⁻⁷ 5.49 × 10⁻⁷species.y 1.48 × 10⁻¹⁵ 9.33 × 10⁻¹⁶
Table 9. Average return of investment rate (ROI), payback period (PbP), and net return (NR) on investment in the HPLC and CPS scenarios.
ParameterUnitHPLCCPS
ROI%.y−15.399
PbPy−6.20.4
NREUR−23,30414,144
Disclaimer/Publisher’s Note: The statements, opinions and data contained in all publications are solely those of the individual author(s) and contributor(s) and not of MDPI and/or the editor(s). MDPI and/or the editor(s) disclaim responsibility for any injury to people or property resulting from any ideas, methods, instructions or products referred to in the content.

