Article

Assessment of Outdoor Pedestrian Ventilation Performance While Controlling Building Array Scale and Density

State Key Laboratory of Subtropical Building Science, Department of Architecture, South China University of Technology, Guangzhou 510640, China
*
Author to whom correspondence should be addressed.
Sustainability 2023, 15(8), 6742; https://doi.org/10.3390/su15086742
Submission received: 20 February 2023 / Revised: 8 April 2023 / Accepted: 11 April 2023 / Published: 17 April 2023

Abstract

:
In hot and humid regions of China, people experience great discomfort. Good ventilation improves human comfort by facilitating the discharge of heat in a region. None of the previous studies considered which scale is appropriate for the outdoor ventilation of building arrays, and the ventilation performance differs with the array size. Moreover, the building density has an upper limit in Chinese cities, and many studies overestimate this density. Based on these considerations, the neighborhood block is proposed to represent the scale of building arrays with the combination of the urban planning scale and climatic scale. Using this scale, the building density and representative building array configurations for hot and humid regions of China were determined. The outdoor ventilation of these building arrays at the pedestrian height was then studied via computational fluid dynamics simulations. The results show that, in the neighborhood block, an increase in the building height and length is beneficial for the mean velocity, whereas an increase in the building distance is not, and a staggered layout has a negative effect on ventilation. Furthermore, the semi-enclosed layouts are no better than the enclosed layouts in terms of ventilation and sunlight. Some contributions contradict the existing studies because of the selection of different array scales and densities, which prove their significance.

1. Introduction

1.1. General Background

Cities present higher ambient temperatures than the surrounding suburban and rural areas. This phenomenon is known as the urban heat island effect. Surface modifications brought about by urbanization, typically including replacing soil and vegetation with impervious surfaces and urban structures, are recognized as one of the major causes of UHIs [1]. Other reasons include the released anthropogenic heat, canyon radiative geometry, urban greenhouse effect, and reduced turbulent transfer in the dense urban environment [2,3]. The IPCC Fourth Assessment Report indicates 11 of the 12 years (1995–2006) ranked among the 12 warmest years since 1850 [4]. An analysis of data collected using mobile traverses in 101 Asian and Australian cities showed that the UHI magnitude may vary between 0.5 and 11 °C, with an average value close to 4.1 °C. A similar analysis performed using data from 110 European cities showed that the UHI magnitude varied between 1 and 10 °C, with an average maximum value close to 6 °C [5]. A heat island can occur at a range of scales: it can manifest itself around a single building, a small vegetative canopy, or a large portion of a city [6]. Heat is trapped in large masses that have high specific heat, such as buildings, roadways, and parking areas. As well, the poor circulation of air in narrow streets and the lack of green spaces that provide shade, trap less heat, and even dissipate heat through evapotranspiration exacerbate these problems. People located in micro-urban heat islands, and who are more likely to be exposed to higher temperatures, are at higher risk of morbidity during warmer summer days [1,2,3,4,6,7,8]. Therefore, as people’s health is affected during outdoor activities, they tend to engage in indoor activities. If there is a lack of indoor cooling equipment, then indoor comfort will also be unsatisfactory [9]. Therefore, comfort in both indoor and outdoor environments is affected. Moreover, if the temperature rise in a region continues for an extended period, then it results in a heat wave, which significantly affects the morbidity and mortality in that region. The 1995 heat wave of Chicago resulted in a 30% increase in mortality [10], and the 2003 Paris heat wave resulted in a 130% increase in the death rate [11]. These heat waves have been reported as the most severe ones in history. Heat waves have been occurring more frequently in recent years.
The urbanization rate in China has been rapidly increasing in the last few decades. According to historical meteorological records and numerical modeling, the urban warming trend has been observed since the mid-1980s. Meanwhile, the urban wind environment has been deteriorating, and the urban wind speed has generally declined in most Chinese cities [12]. The trend has been negatively correlated with the urbanization process [13,14]. With the continuous expansion of the city scale, the urban thermal problem has become increasingly apparent, and it directly affects people’s thermal safety and comfort. Especially in South China, the overheating of the outdoor environment results in an increase in the heat load on the human body and the risk of morbidity and mortality in residents with cardiovascular and cerebrovascular diseases [15,16]. This has raised the alarm for local politicians and city planners. In South China, the duration of summer is very long, and there is essentially no winter. Moreover, as this region is close to the sea, the humidity is often extremely high. For some part of the year, the surfaces of building floors and walls are often wet. Such high temperatures and humidity cause great harm to people living in these cities.
Good ventilation facilitates the discharge of heat in cities, which helps improve people’s comfort and health. The effect of ventilation on urban comfort has been analyzed in many studies [17,18,19,20,21,22], and empirical and modeling studies have shown that higher wind speeds in specific conditions reduce the physiological equivalent temperature [23,24] compared with that under the same conditions but without any wind or at low wind velocities; thus, comfort is significantly improved. Therefore, research on urban ventilation is of great significance.

1.2. Literature Review on Urban Ventilation and Problem Statement

In the last few decades, numerous investigations have been conducted to study urban ventilation [7,8,9,10,11,12,13,14,15,16,17,18,19,20,21,22,23,24,25,26]. In the case of street canyons, the flow regimes are different for changing values of the aspect ratio [25,26]. There are two main ways to improve pedestrian ventilation, which are the modification of the building morphology of street canyons [27,28,29] and the variation in the relationship between the building height and canyon width [30,31,32]. Similarly, in the case of building arrays, a variety of basic morphology parameters, including the building height variability [33], length [34], shape [35,36,37], and distance [33,38], were discussed in terms of their effect on outdoor ventilation. The effects of incident wind angles on wind velocity were also examined [36,37]. Another kind of research on building arrays is the relationship between ventilation and building densities, which include the frontal area density, plan area density, and floor area density. Regarding the frontal area density, the number of building blocks can be reduced to investigate the effect of the frontal area density on wind circulation [39]. The effect of different frontal area densities due to various building heights on the air quality at the pedestrian level was investigated [40]. The frontal area ratio, ranging with low, medium, and high plan area densities, can be associated with pedestrian ventilation [41]. Surrounding layouts semi-encircling the fixed target-site development coverage were varied to obtain different frontal area ratios to discover the optimum building layouts on permeabilities [42]. Regarding the plan area density, different urban morphologies, including aligned and staggered layouts with different plan area densities, were examined for the ventilation effect [43,44]. Similar situations were studied [45], and the layout with non-uniform height cases was added. Under the constant floor area ratio, layouts with various plan area densities were studied to evaluate the ventilation [46]. Both the floor area density and plan area density were ranged to study their impacts on ventilation [47,48]. Correlations between five morphological parameters, the frontal area density, plan area density, area-weighted mean building height, volume density, and non-dimensional mean velocity at the pedestrian level, are evaluated, and simple models are obtained using linear regression analysis [49]. The aforementioned parameters regarding building arrays are also often investigated [50,51,52,53] in residential areas, as typical building arrays, to determine the optimal design for outdoor ventilation. By changing the spatial morphological factors, the key factor for improving the residential wind environment can be recognized in planning practice [54,55].
Although the effects of different parameters have been extensively studied for the evaluation of outdoor ventilation, none of these studies considered which scale is appropriate for the building arrays. Different array sizes have different ventilation performances, as discussed in [56]. Moreover, the building density has an upper limit in Chinese cities, and in order to realize greater commercial profits, building developers generally attempt to design building arrays as close to the required building-density limit as possible. Therefore, the density often cannot change in a large range [38,47,57] of building arrays. The idealized array tends to underestimate or overestimate real densities, leading to the frequent misrepresentation of the urban planning density [58]. The array parameterization should be derived from real urban block geometries to provide a more precise representation of density. Thus, some previous results are inapplicable to actual urban design because of ambiguous building array scales and inaccurate building densities.
Three approaches are typically used for urban ventilation research: wind-tunnel experiments, field measurements, and computational fluid dynamics (CFD) simulations. Field measurements usually require the arrangement of wind speed measurement points at the research objects (such as street valleys and residential areas) and comparisons of the wind speed and direction with the data of nearby weather stations [13,59]; based on these, the influence of the built environment on the wind speed can be determined. During the test, if the reference measurement point can be selected in a nearby unobstructed location, then it is generally better than the weather station measurement point as the reference point. Important disadvantages, however, are that they are not fully controllable due to—among others—the inherently variable meteorological conditions, they are not possible in the design stage of a building or urban area, and usually only point measurements are performed. The latter disadvantage also holds for wind-tunnel measurements. Techniques such as particle image velocimetry and laser-induced fluorescence in principle allow planar or even full 3D data to be obtained in wind-tunnel tests, but the cost is considerably higher and the application for complicated geometries can be hampered by laser-light shielding by the obstructions constituting the model. Another disadvantage is the required adherence to similarity criteria in reduced-scale testing, which can limit the extent and range of problems that can be studied in wind tunnels [60,61]. Compared with the former two approaches, CFD is advantageous because it can provide the whole flow field data under well-controlled conditions, does not suffer from similarity constraints, and is more efficient and economical [52,61,62]. However, the accuracy of CFD is of primary concern, and validation via wind-tunnel experiments is thus imperative.

1.3. Objectives

This paper proposes the requirements for and significance of the building array scale and building density on the outdoor ventilation design. Based on the urban planning and climate scales, a suitable building array scale is determined, and the building density is thus further required. Furthermore, using the proposed building array scale, round-robin simulations were conducted on the impact of the building dimensions (i.e., building length and height) and layouts (i.e., building distance, staggered layout, and enclosed and semi-enclosed layouts) on outdoor ventilation performances at the pedestrian height via CFD. Then, in order to further verify the effect of the building array scale and density on the outdoor ventilation performance, the results were discussed and compared with those obtained by existing research on other array scales and densities. This work proposes the important premise for research on the outdoor ventilation of building arrays, under which the results can contribute to urban planning design, leading to a more comfortable outdoor environment.
This paper is structured as follows. Section 2 presents the methodologies of this study. In Section 2.1 and Section 2.2, the urban configurations and experimental data used for the CFD validation are presented. Section 2.3 describes the computational settings and parameters used in the CFD simulations. The impacts of different building dimensions and layouts on the velocity field at the pedestrian level are presented in Section 3 and discussed in Section 4. Finally, the conclusions and limitations of this study are presented in Section 5.

2. Methodologies

2.1. Determination of Neighborhood Block Configuration

Various regions have different urban designs owing to their different climates. In South China, the building arrays should be permeable, as outdoor ventilation is a critical issue. People in this region suffer considerable discomfort during the long hot and humid summers. In China, urban residents spend more than two-thirds of their lives in residential areas. Therefore, the study of residential areas is of great significance. However, the Chinese code specifies various scales for residential areas, such as neighborhoods with 15 min, 10 min, and 5 min pedestrian scales. The 15 min pedestrian scale comprises approximately 10 times the population size of a 5 min one. A neighborhood block is a basic unit that constitutes residential areas and can be the best choice for study. The climatic scale corresponding to the neighborhood block is the street scale, which accounts for the effect on pedestrian comfort [63], which is the aspect that this paper is focused on.
When the neighborhood block scale is selected in the hot and humid climate in South China, natural ventilation should be fully utilized. For that, the upper limits for the building density and floor area ratio of neighborhood blocks are required by the Code of Urban Residential Areas Planning & Design (GB/50180-18). As stated previously, the building density is always within a small range for various building forms and layouts. In such cases, studying the varieties in the building dimensions and their arrangement in the limited building density under the neighborhood scale can have a guiding influence on urban planning and design.
Considering the building layouts, the neighborhood blocks can be classified into aligned layouts, enclosed layouts, and irregular layouts. Considering the building height, the neighborhood blocks can be classified into low-rise, mid-rise, and high-rise [64]. Typical neighborhood blocks were selected through a large-sample survey in Guangzhou, a typical city in the hot and humid regions of China. A survey of 107 neighborhood blocks was conducted with a focus on the design characteristics of the layouts as well as the lengths, heights, and depths of the buildings. A statistical analysis showed that dominant residential areas were aligned and enclosed. The height most often observed was 20–40 m. The mid-rise and high-rise buildings can be classified based on a height of 30 m [65]. The mid-rise and high-rise buildings had representative heights of 24 m and 36 m, respectively.
Some building length and depth ranges were frequently observed. They were 35–75 m and 10–25 m, respectively, in the aligned layout. For the enclosed layout, the smaller lengths were in the range of 35–45 m, and the larger lengths were in two ranges, 65–75 m and 95–105 m. The building depth range was 20–30 m.
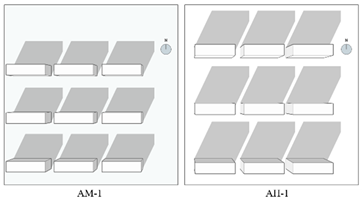
For a neighborhood block, the plan area density and floor area density should be less than 30% and 2.1 for a mid-rise layout, respectively, and less than 22% and 2.8 for a high-rise layout, respectively [65]. The area of the neighborhood block should be less than 4 hm2, and the edge lengths of the block should be less than 200 m. The original building array can be set as listed in Table 1, which satisfies the requirements of the building density, array size, and statistical analysis data. These arrays can be termed AM-1 (aligned mid-rise layout), AH-1 (aligned high-rise layout), EM-1 (enclosed mid-rise layout), and EH-1 (enclosed high-rise layout).
The building form and layout changes are specified in Table 2. The adjacent layout has only one element change, the influence of which can be evaluated.
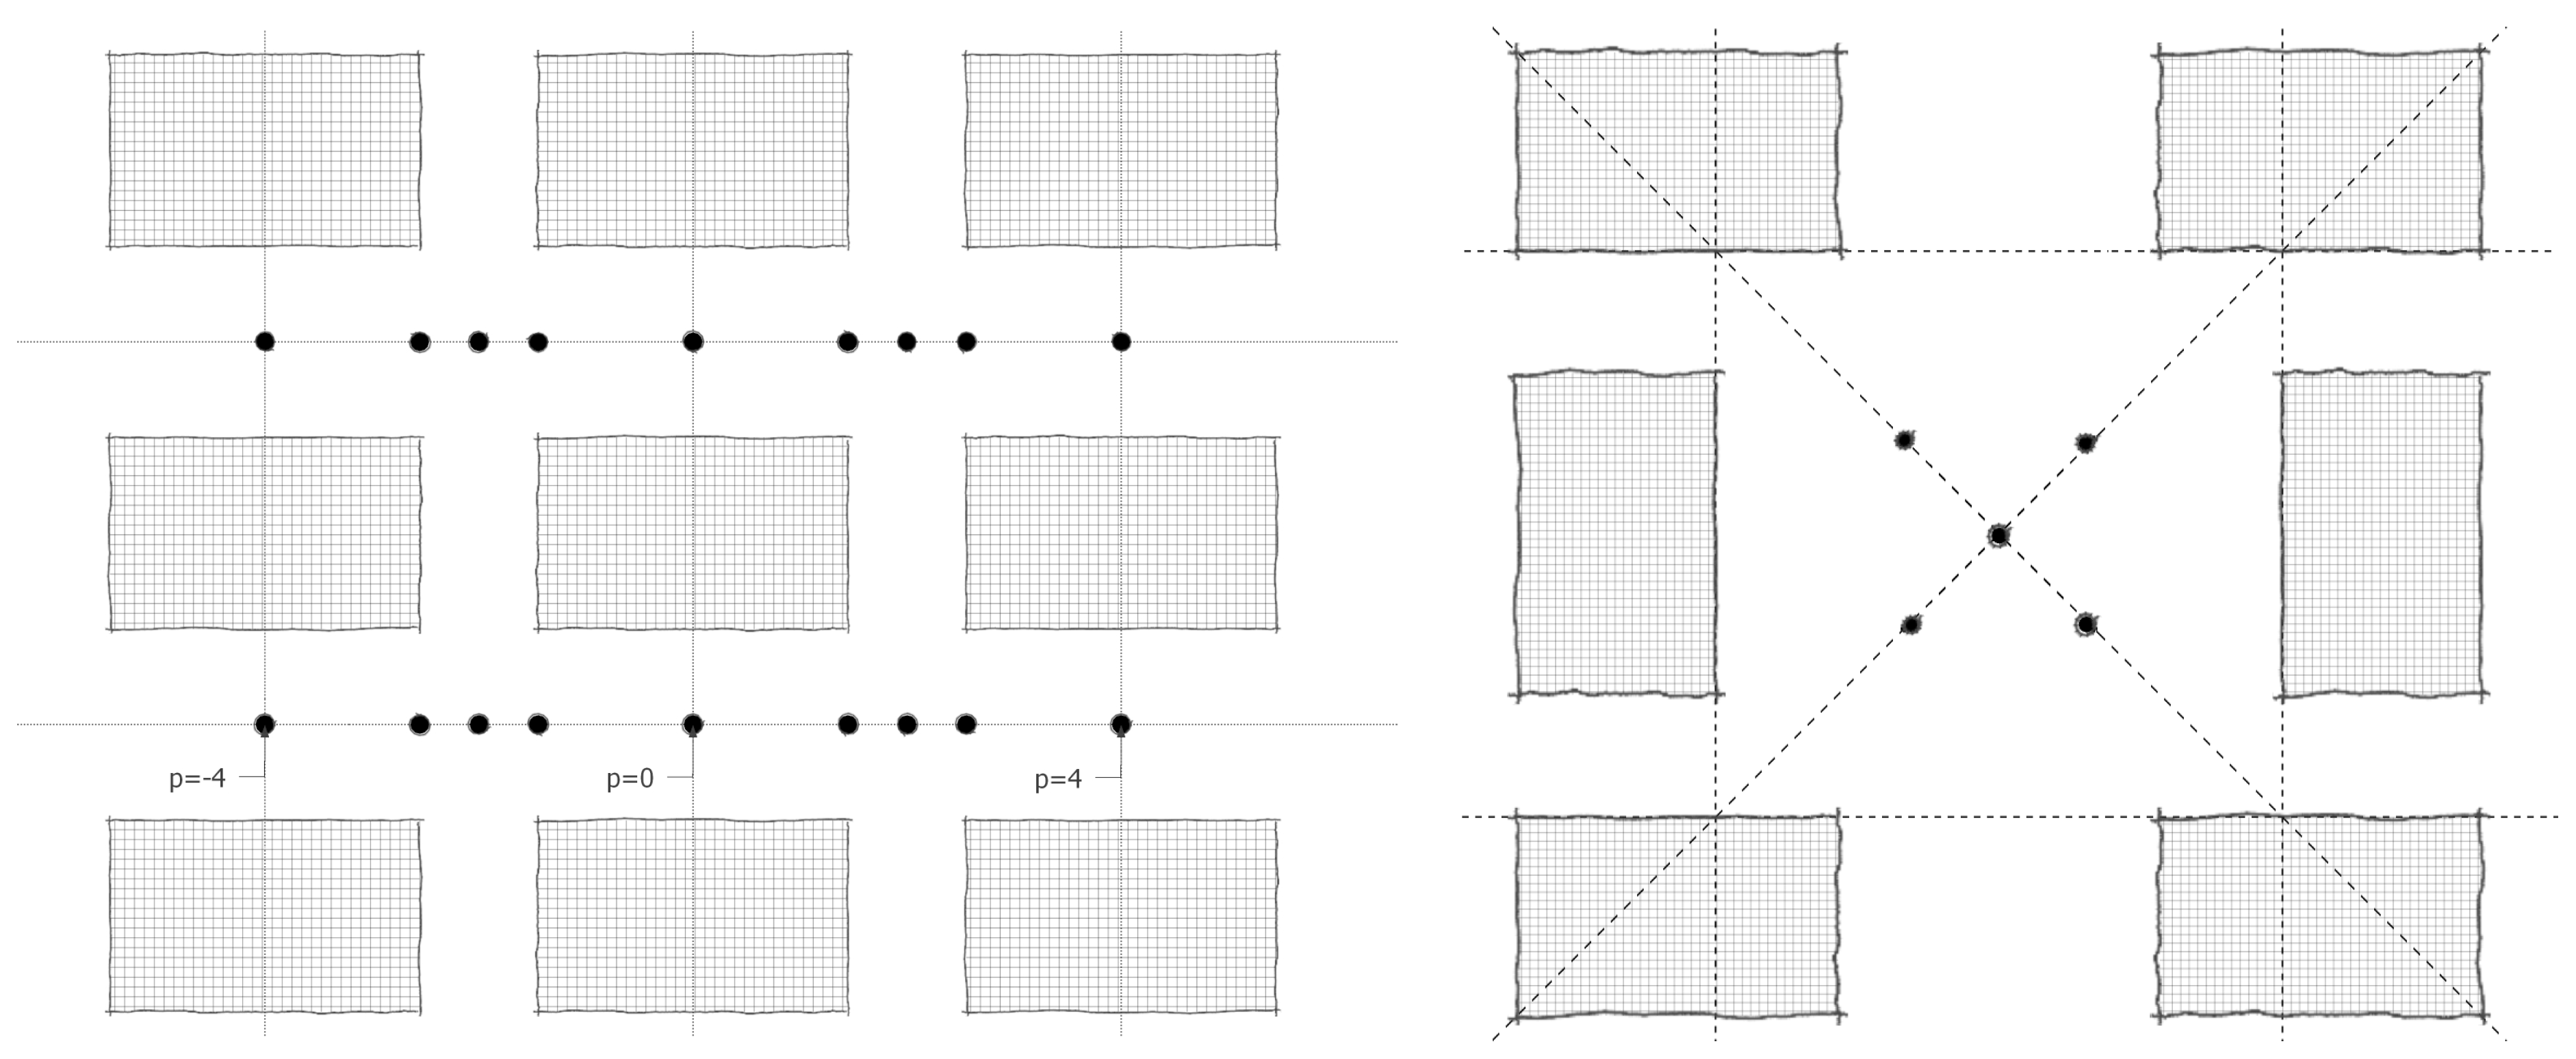
For the convenience of the following description, the building arrays can be classified into different regions (Figure 1). The aligned layouts include ① the adjacent building gap, ② sideward building, ③ first row, ④ second row, and ⑤ central building. L, M, and R represent the left, middle, and right sides, respectively. The enclosed layout includes ⑥ the adjacent building gap and ⑦ the central zone.
To quantify the element change on the wind speed more accurately, the velocity points were selected as shown in Figure 2. In the aligned layout, the points are all located on the centerline of the gap between the buildings marked as p = −4–4. Points −4–0 are at the left centerline of the rows, the right corner of the left building, the center of the left intersection, the left corner of the middle side building, and the middle centerline of the rows, respectively. The positions of p = 1–4 and p = −4–−1 are symmetrical. These points are not only places where people often stay or pass by, but they are also affected by different factors that are directly affected by the incident flow, such as p = –2, 2, building blocking, such as p = –4, 0, 4, and the above two, such as p = –3, –1, 1, 3. For an enclosed layout, people often stay at the center of the layout, and the points are selected as shown in Figure 2.

2.2. Experimental Data for CFD Validation

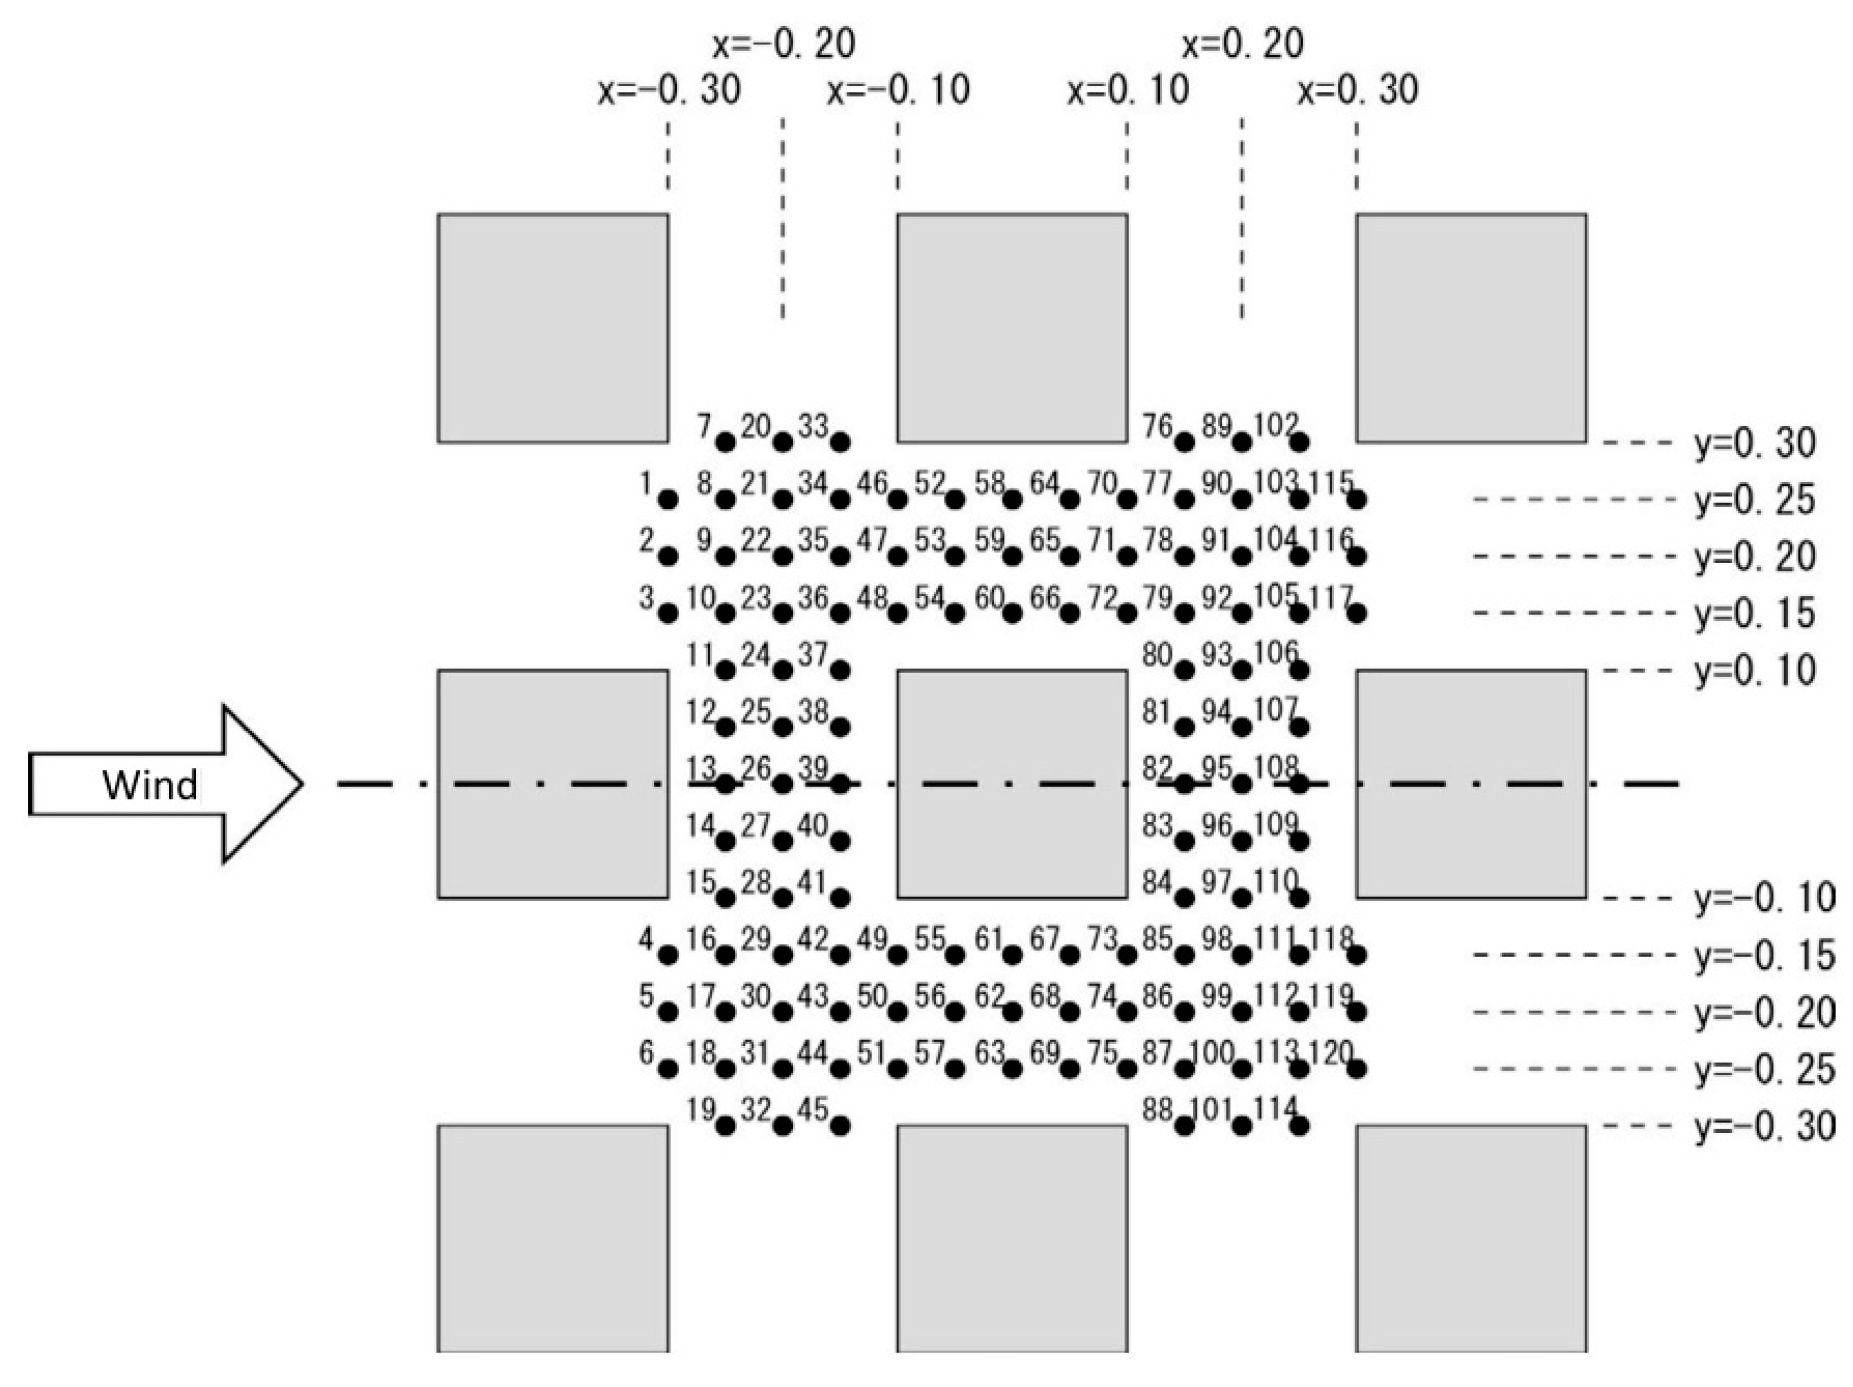
The wind-tunnel experiments used for validation were performed by Nonomura et al. [66] at the technical center of the Fujita Corporation. The wind-tunnel section dimensions were 1.8 m × 3.0 m, and the research object comprised nine building blocks (Figure 3) of the size D (0.2 m) × D (0.2 m) × D (0.2 m). The block layout was similar to the aligned layout of this study, and thus, it was selected. The velocities measured via hot-wire anemometry at 120 points at a height of 0.1 D (Figure 4) can be compared with the CFD simulation results to validate the CFD settings.

2.3. CFD Validation: Computational Settings and Parameters

As parameter setting is important in CFD simulations, before the simulation, users should select the appropriate computational domain, meshing method, boundary conditions, turbulence model, convergence conditions, and other aspects.

2.3.1. Computational Domain and Grid

Based on the available guidelines [67,68], the lateral and top boundaries were set at distances of 6 D and 5 D from the building blocks, respectively. Thus, the blockage ratio was 0.029 (<3%). The outflow boundary length behind the building was set as 10 D. The inflow boundary length was set as 3 D (Figure 5).
The grid was created as a structured grid because of the regular shape of the buildings. There were 14 grids on each side of the building. The smallest grid size was 0.01 m. In each direction, the expansion ratio was set as 1.2 to ensure the grid quality (Figure 6).

2.3.2. Boundary Conditions

The CFD boundaries used were those measured in the wind tunnel. The velocity (u), turbulent energy (k), turbulence dissipation ( ε ) rate, and specific dissipation rate ( ω ) written in points were read using Fluent and interpolated (Figure 7 and Figure 8). The velocity (u) was directly measured in the wind tunnel. The turbulent energy (k) was calculated as follows [68]:
k z σ u 2 z
where σ u is the root-mean-square value of the velocity fluctuation in the streamwise direction.
The turbulence dissipation rate ( ε ) is calculated as follows [68]:
ε z = u A B L * 3 / ( κ ( z + z 0 ) )
where u A B L * denotes the atmosphere-boundary-layer friction velocity, κ denotes the von Karman constant (0.4), z denotes the height coordinate, and z 0 denotes the aerodynamic roughness length (0.00045 m).
The specific dissipation rate ( ω ) is obtained using the following [69]:
ω z = ε ( z ) / ( C μ k ( z ) )
where C μ is a constant and equals 0.09.
The ground and building surfaces were set as smooth walls for the standard wall functions when the standard k ε model was used.

2.3.3. Solver Setting

A standard k ε model was used. The coupled scheme was selected in the solution method algorithm, which considers the least-squares cell-based gradient, second-order pressure, second-order upwind momentum, second-order upwind turbulent kinetic energy, and dissipation rate [67,68]. The equation residuals and the area-weighted average velocity of the outlet were monitored. The calculation was stopped when the value was 10−6 for continuity, 10−8 for the x, y, and z velocities, and 10−7 for k and ε . The area-weighted outlet average velocity did not change considerably.

2.3.4. Grid-Sensitivity Analysis

First, a grid-sensitivity analysis was conducted to eliminate the grid effect. The basic case comprised 401,954 cells, while the coarse and fine cases comprised 176,484 and 708,885 cells, respectively. Grids 11, 14, and 17 were set on each building side in different cases. The first cell heights of the building and ground were all 0.01 m. The wind direction was set to 0°. The comparison results of the velocity normalized by the inflow velocity at the same height are presented in Figure 9. It can be observed that the difference between the basic and coarse grids is significant, whereas the difference between the basic and fine grids is small. Therefore, a basic grid can be used to simulate a project to save time.

2.3.5. Turbulence Models

CFD turbulence models have been widely used to predict airflow patterns around obstacles. However, the selection of an appropriate turbulence model for the simulation of such a flow field is challenging [70]. The 3D steady Reynolds-averaged Navier–Stokes (RANS) CFD simulations can provide sufficiently accurate data for the mean wind speed at the pedestrian level [71]. Compared with the RANS model, other more accurate CFD models (e.g., large-eddy simulation and detached-eddy simulation) are more complex and time-consuming. These drawbacks imply that the practical application of computational wind engineering will continue to be based on the steady RANS model for a considerable period [72]. Therefore, the common RANS turbulence models, the standard k ε (S k ε ), renormalization group k ε (RNG), realizable k ε (R k ε ), standard k ω (S k ω ), shear-stress transport k ω (SST), and Reynolds stress model (RSM), are compared here.
The wind speed ratio comparison between the CFD simulation and wind-tunnel experiments of different turbulence models for the basic case is illustrated in Figure 10. Because of the symmetry of the measured points, only wind speed ratios at sites Y = from 0 to 0.3 were analyzed, as shown in Figure 11. If it is limited to the region where the wind speed ratio is 1.0 or more, which is important in the evaluation of the pedestrian wind environment, then it is predicted within an accuracy of approximately ±20%. However, in the weak region behind the building, the wind speed ratio is evaluated lower in the calculation than in the experiment. When compared with other models, S k ε and R k ε have higher prediction accuracies in the weak-wind region. The correction coefficient (CC) and root mean square error (RMSE) were also used to evaluate the simulation accuracy. A CC value closer to 1 and an RMSE closer to 0 indicate that the results are better. It can be observed that the S k ε , R k ε , and RSM have lower RMSE values. The S k ε , R k ε , and SST have better CCs. Thus, considering both indexes, the S k ε and R k ε perform better in simulating the basic case. This is mainly because of the better consistency for some points at sites Y = 0.15 and Y = 0.2, which have higher velocities and are easily affected by the incident flow. Other sites behind the buildings for the turbulence models exhibited a similar performance.

2.4. CFD Simulation Setting for Full-Scale Building Arrays

The full-scale building arrays were built using SketchUp and imported into ANSYS ICEM for the grid division. In the computational domain, the distance from the side of the building to the lateral boundary is 8 H (H is the height of the tallest building in the building array), the top boundary distance is 7 H from the upper boundary, the inflow boundary distance is 5 H, and the outflow boundary distance is 15 H. The blockage ratio of AM-1 is 3%, which meets the requirement of less than 3–5% [68]. When simulating other arrays, the blockage ratio was also checked, which will not be repeated here.
ANSYS Fluent was used as the CFD solver. Compared with the simulation setting of the reduced-scale building blocks in Section 2.3, only the boundary conditions were changed. The wind speed in the typical meteorological year was used as the boundary condition. In order to compare with the previous studies [19,20,21,22,23,24,25,26,27,28,29,30,31,32], the wind direction here was chosen as south–north, perpendicular to the buildings’ long sides. Because this research was focused on urban ventilation, the wind-profile power-law exponent was selected as 0.30, and the gradient height was selected as 550 m [73]. The lateral side, top, and bottom of the computational domain were considered as no-slip boundaries, and the outlet had a zero-gradient boundary condition. The inlet boundary conditions were calculated using the following formulas [68]:
U ( z ) = U 10 ( z / z 10 ) α
k z = I z U z 2 = ( 0.1 z / z G α 0.05 U z ) 2
ε z P k ( z ) C μ 1 / 2 k ( z ) d U ( z ) / d z
As the size of the building here changed significantly compared with that of the block in the wind-tunnel experiment, a grid sensitivity analysis was conducted once again. The minimum size of the grid near the building in the horizontal direction of the building arrays was 0.8–2 m. The minimum size of the grid near the ground and the roof in the vertical direction was 0.6 m, and the expansion ratio was 1.2. The number of grids on each side of the building was greater than 10, and the height of 1.5 m was within the third vertical grid. The three grids were still marked as coarse, basic, and fine, and the corresponding grid numbers of AM-1 were 1,124,460, 2,330,880, and 4,547,400, respectively. The numbers of grids for EM-1 were 1,425,996, 3,057,340, and 6,030,288, respectively. The grid comparison results are presented in Figure 12. It can be observed that the results of the coarse grid are slightly different from those of the basic grid, and the results of the fine and basic grids are nearly identical. A basic grid was thus used for further investigation.

3. Velocity Simulation Results

This section presents the simulation results of the impact of the building dimensions and layout on the ventilation. Changes in building dimensions include the building length and height changes. For the aligned layout, the layout changes include the building distance and staggered layout. For the enclosed layout, layout changes include enclosed and semi-enclosed layouts, which are divided into openings in different directions.

3.1. Building Length

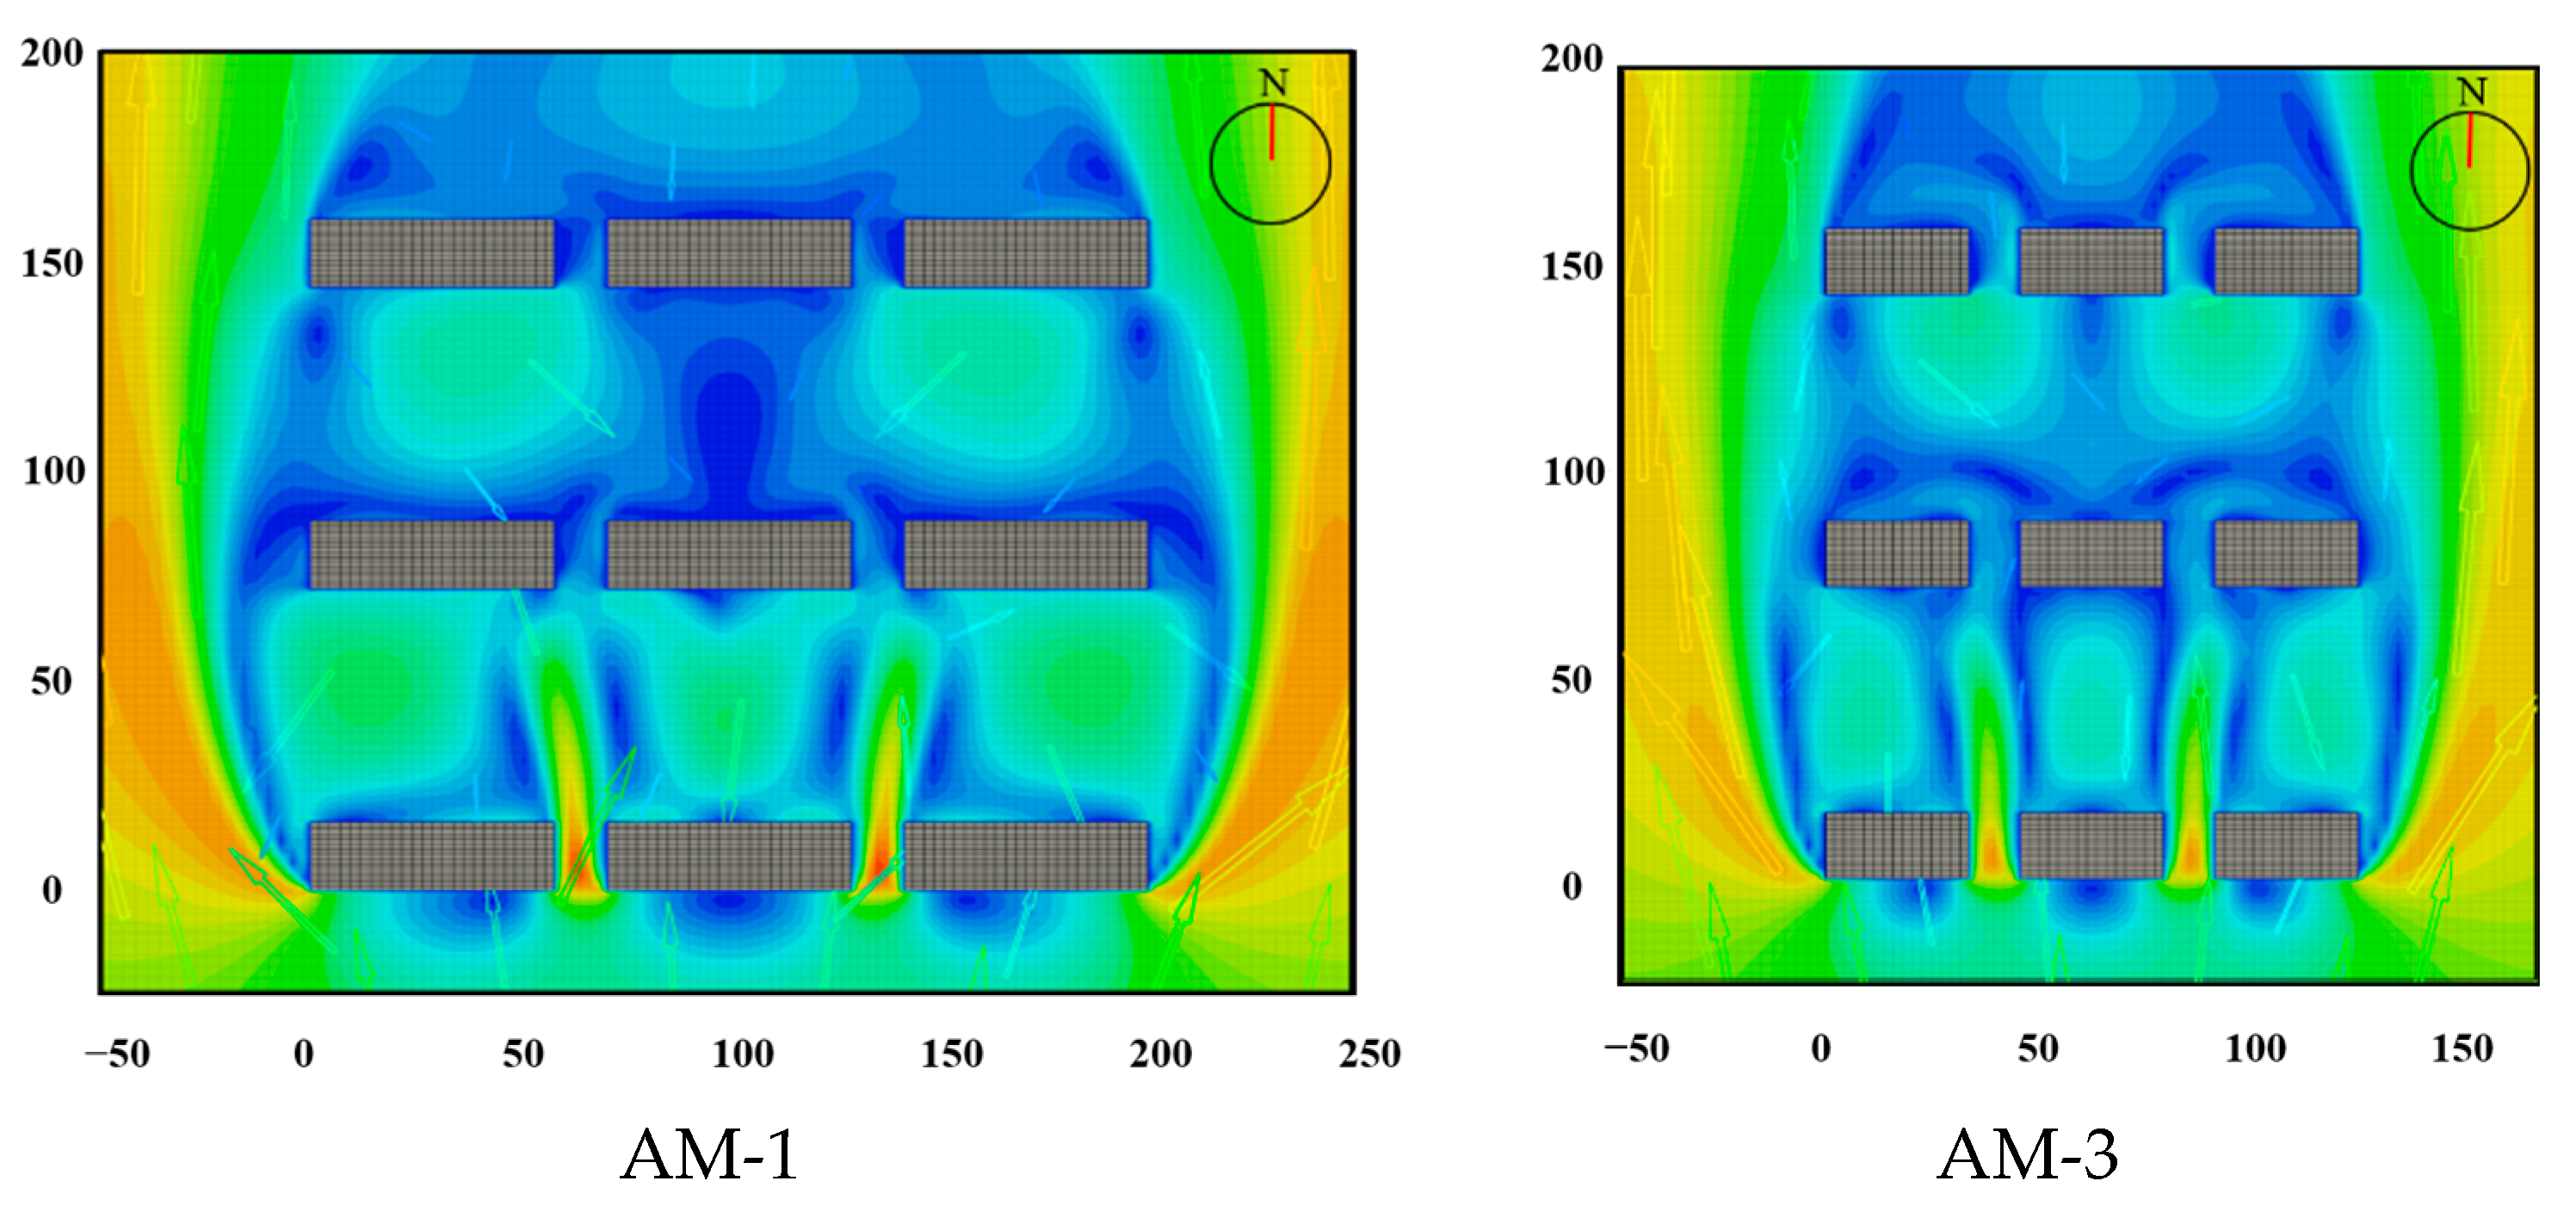
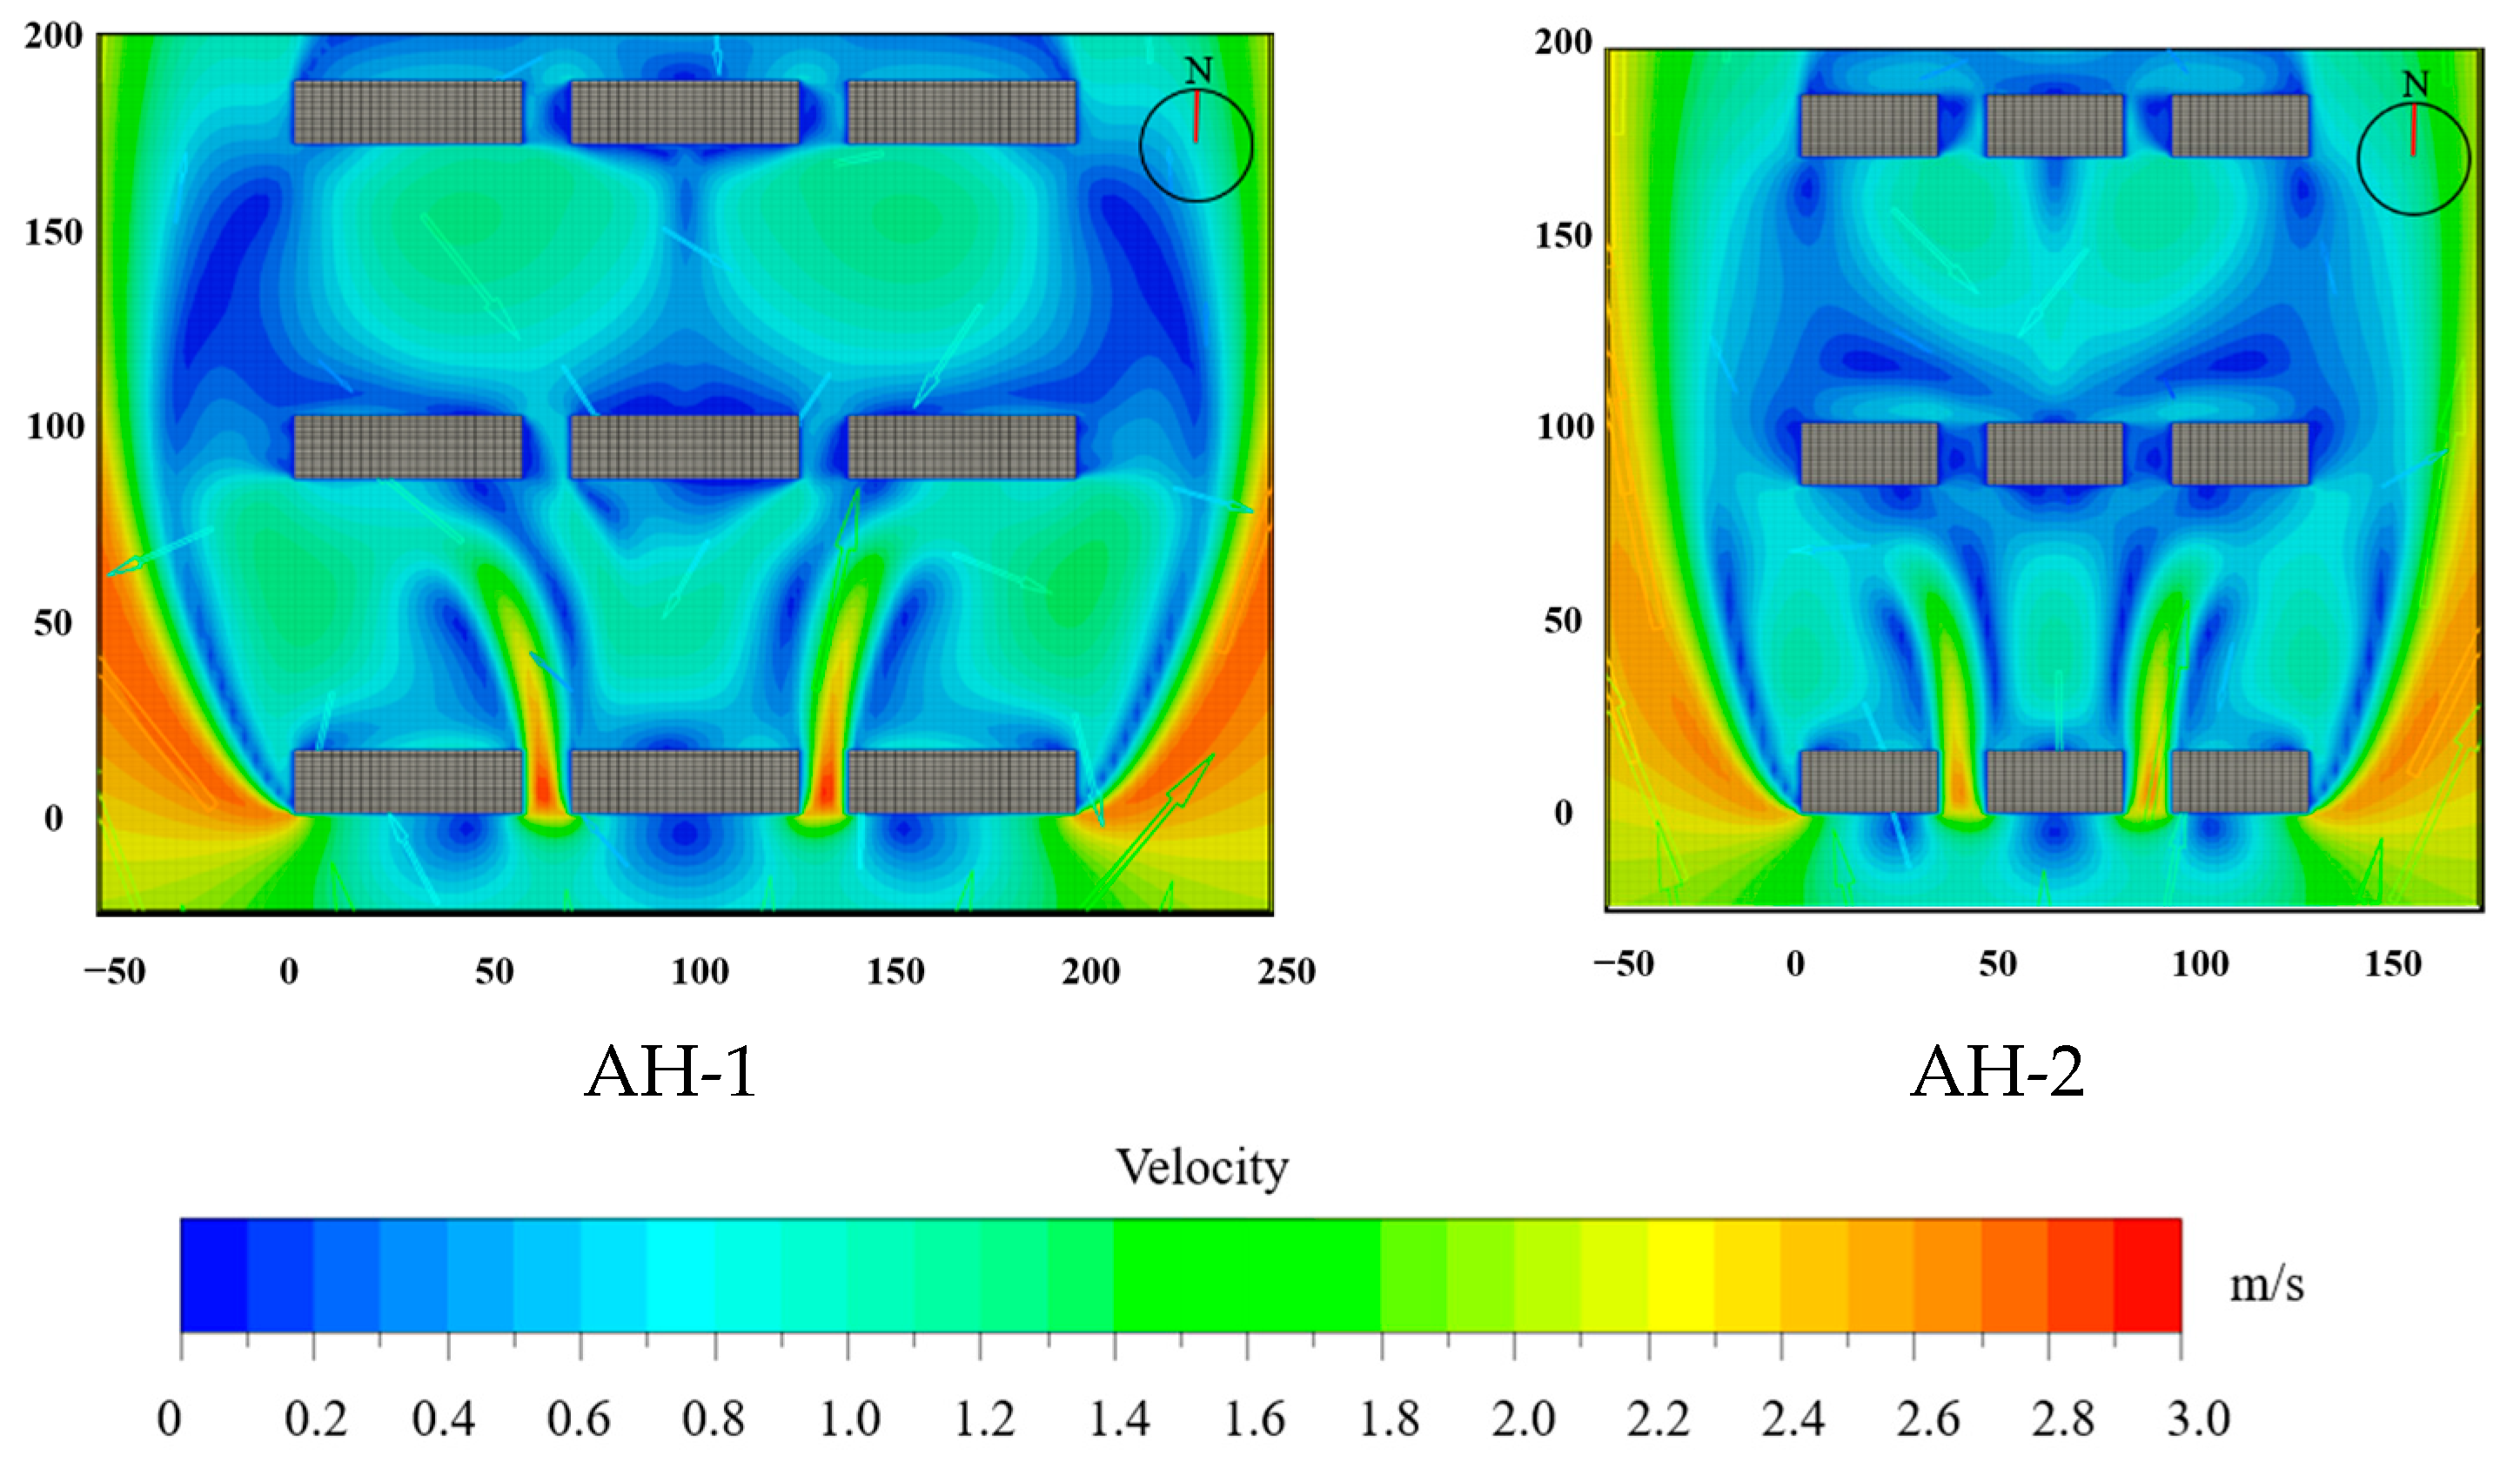
For the aligned layout, when the building length varies, such as in the cases of AM-3, AM-1, AH-2, and AH-1, the wind speed distributions at the pedestrian height remain similar (Figure 13). Higher velocities are in the sideward and downwind directions of the first row of buildings, and in the downwind direction of the left and right buildings in the second row. The evident difference is in the wind speed in the wind shadow area behind the central building. The wind speeds for AM-3, AM-1, AH-1, and AH-2 were 0.41, 0.02, 0.39, and 0.71, respectively. From the speed vector, it can be observed that, for shorter buildings, the airflows on the left and right sides affect this location more easily than those of the longer buildings.
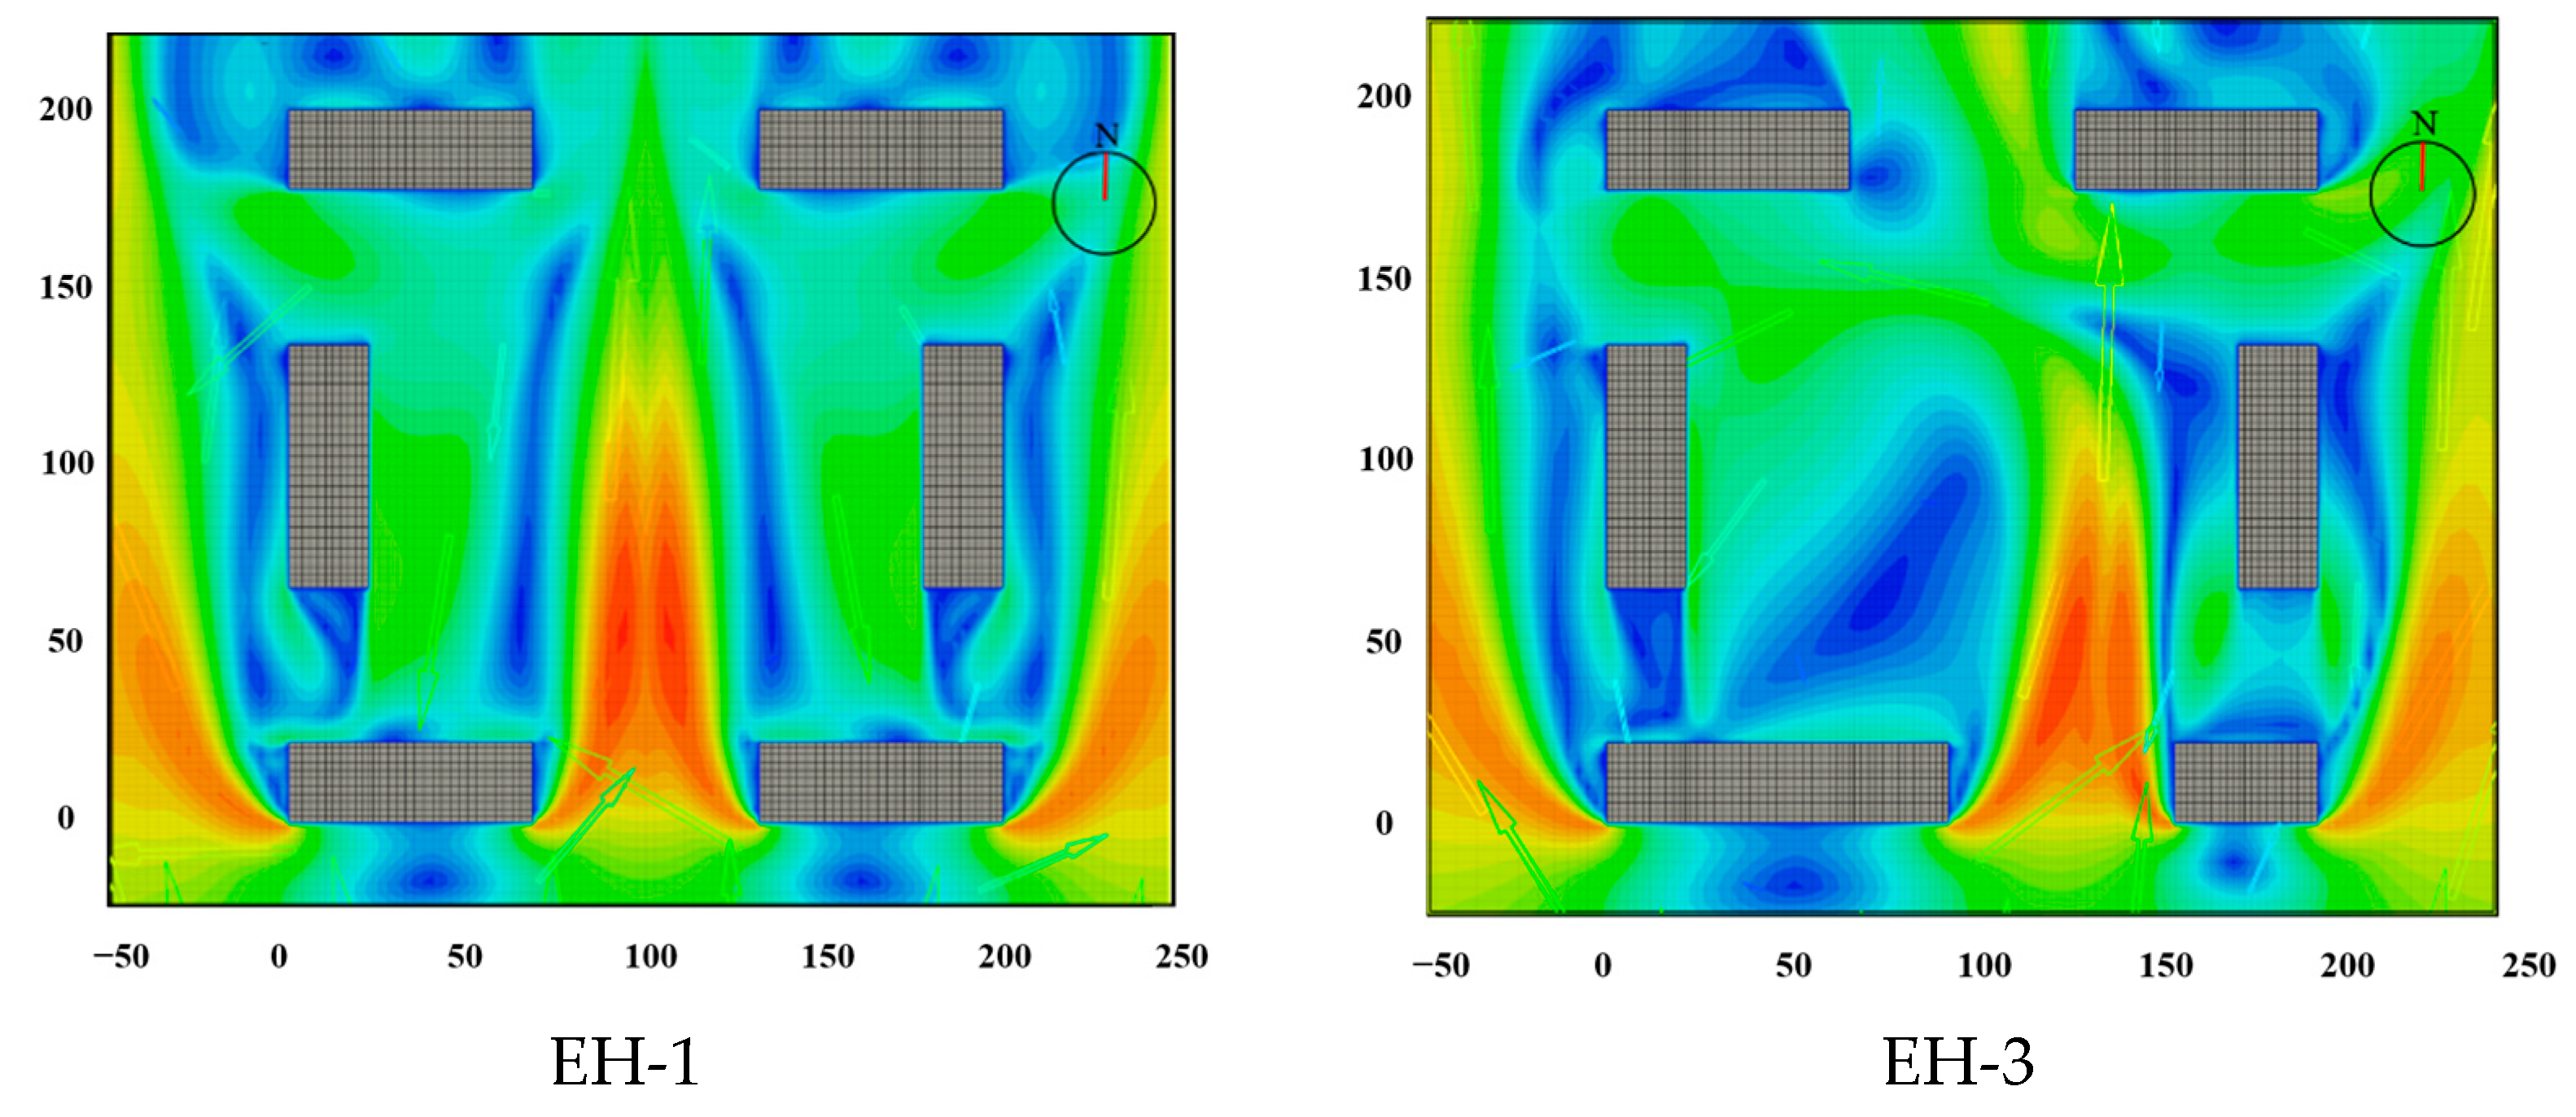
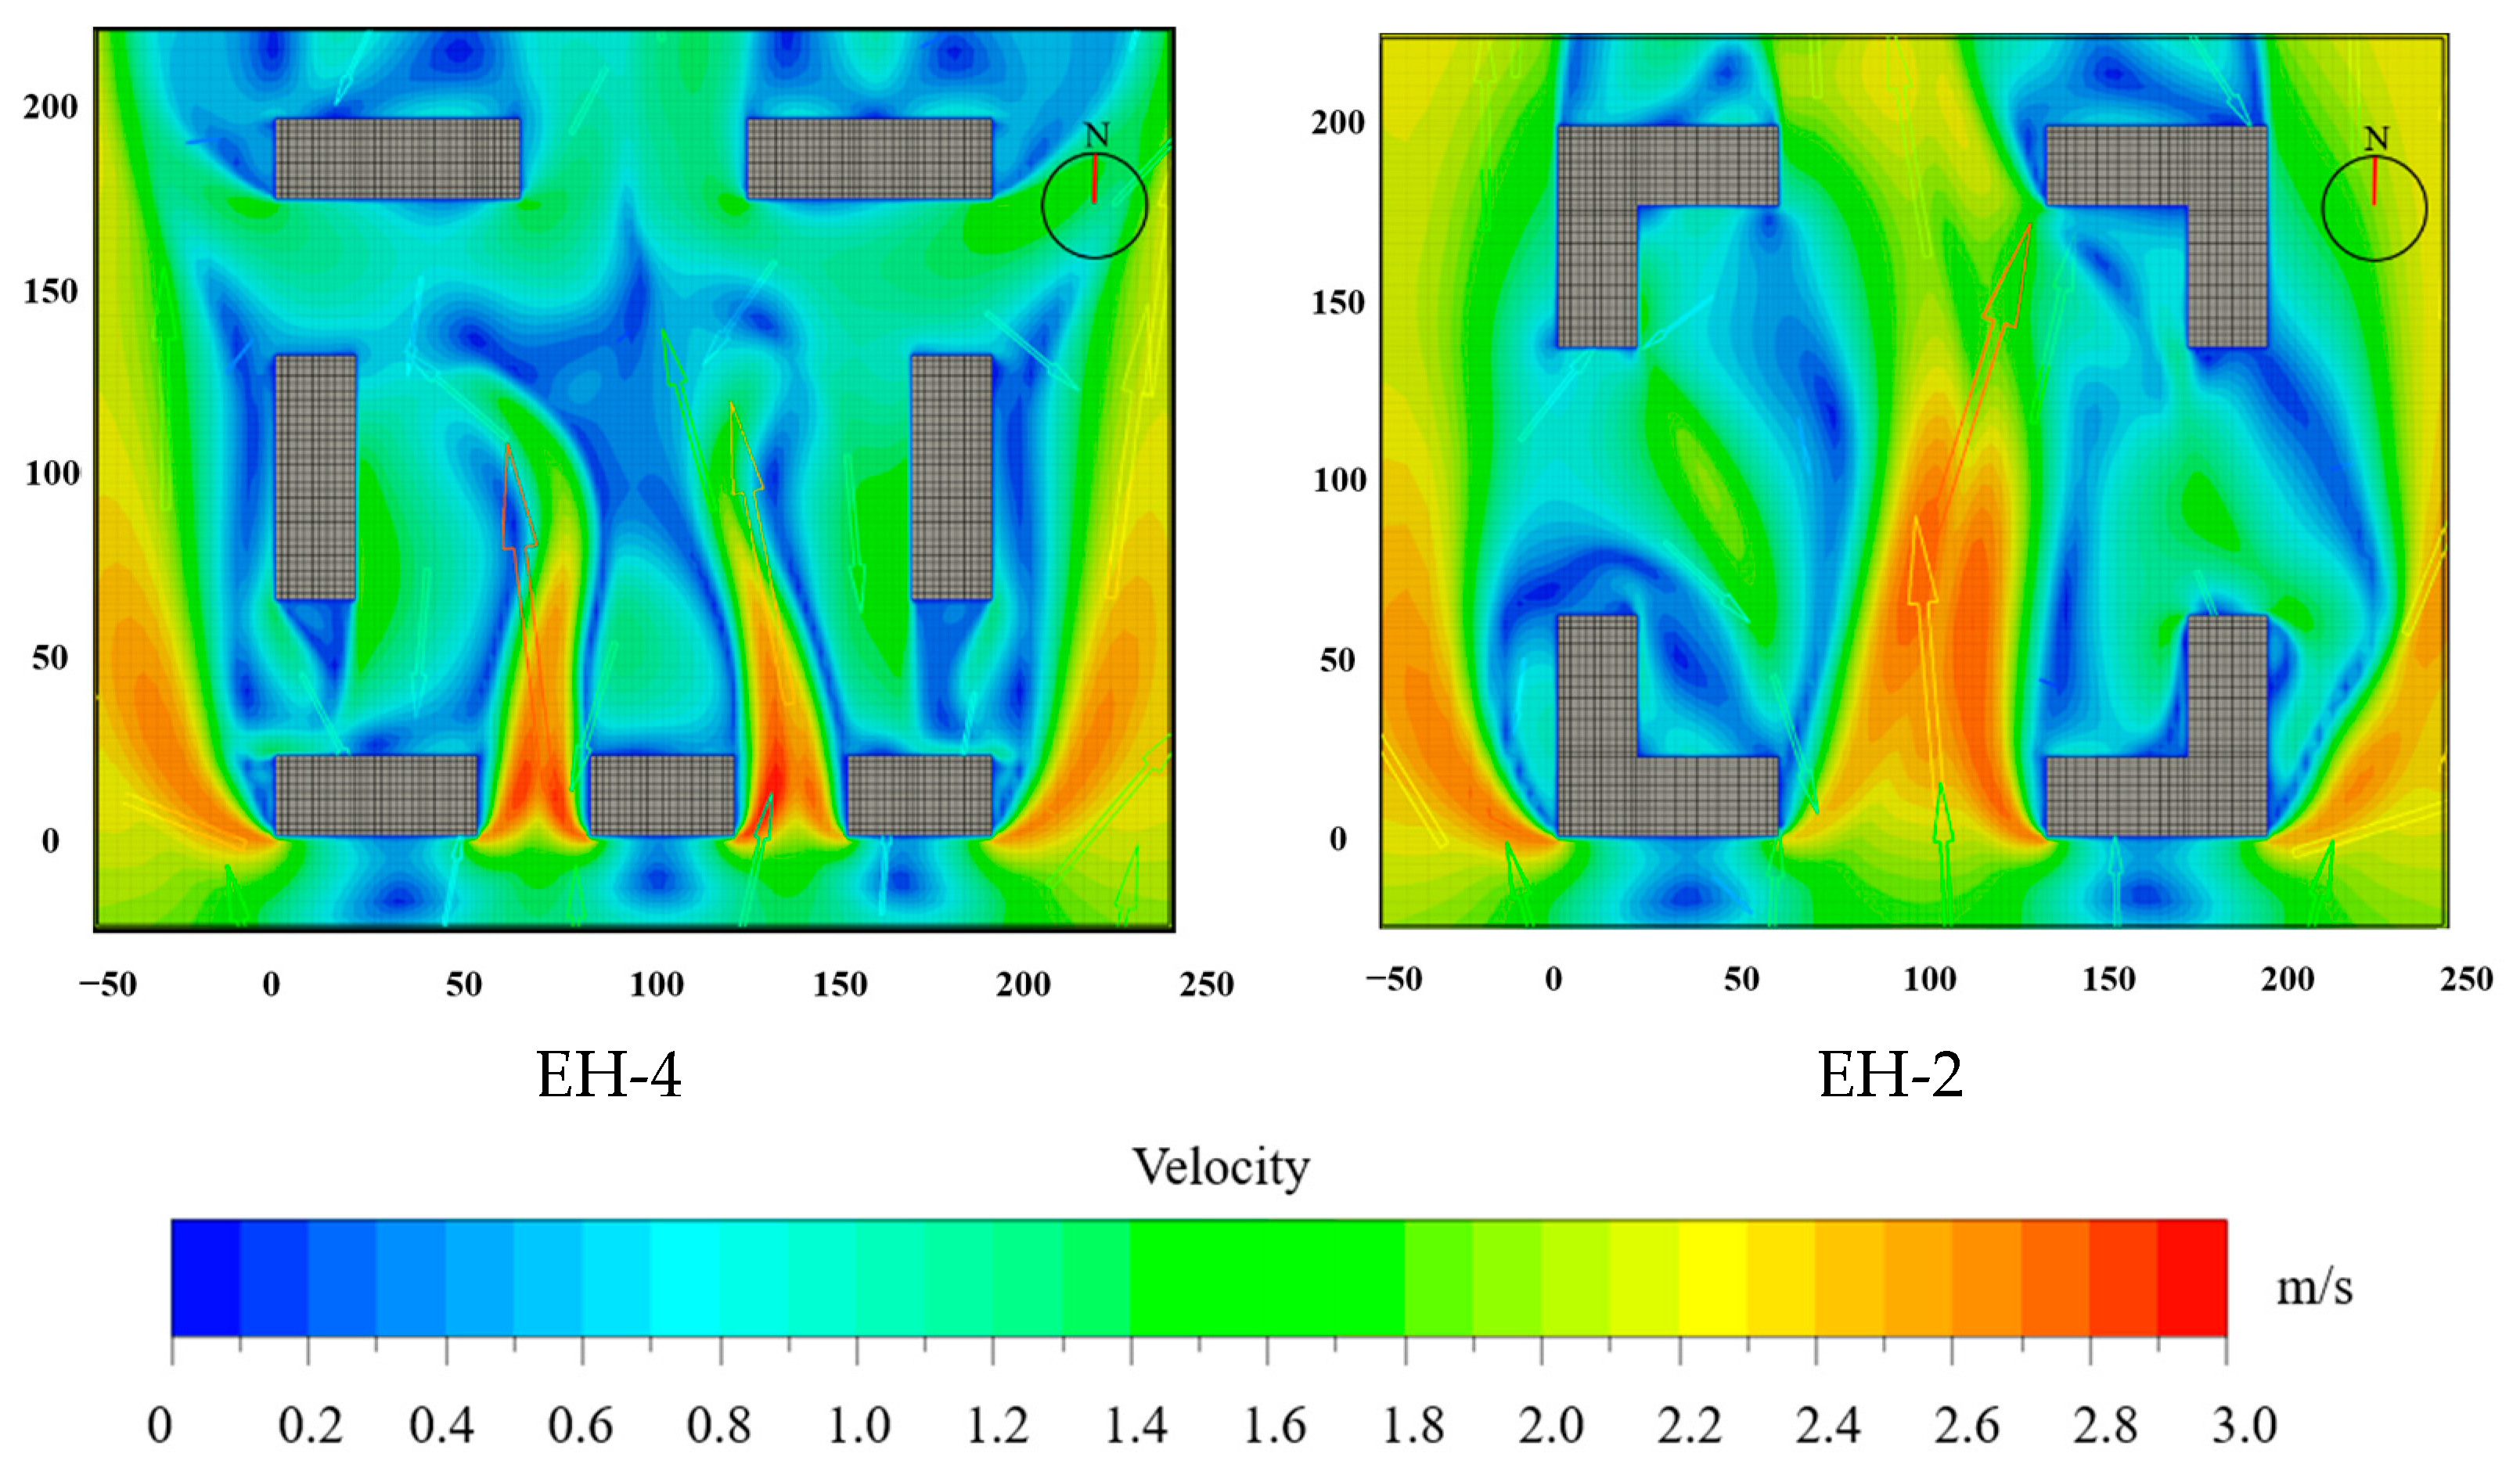
For an enclosed layout, the windward building length can be changed in different ways. For example, two buildings with equal lengths (EH-1) or different lengths (EH-3) or multiple buildings with shorter lengths (EH-4) can be considered; the buildings can also be scattered along each side and connected at adjacent edges (EH-2). As shown in Figure 14, when the building length (EH-3) increases, the low-wind-velocity zones behind the building are more concentrated, and in the case of multiple buildings with shorter lengths (EH-4), there are more isolated leeward low-wind-velocity zones behind the buildings. Compared with EH-1, EH-2 exhibits no major differences in the flow field. Therefore, the wind speed in the building layout is mainly affected by the combined effects of the incoming airflow and a building blocking the wind. When the windward building number remains unchanged, the blocking ability is enhanced as the building length increases. When the number of buildings increases, more isolated low-wind-velocity zones occur, which is not beneficial to the ventilation of the centralized construction of public spaces. The scattered layout has no significant effect on the flow field.
The building length mainly affects the different underpressure zones caused by different blocking abilities. Furthermore, when the building length changes, the adjacent building distance may also change. Subsequently, the flow acceleration ability changes. These two factors have a combined effect on the airflow, which ultimately changes the flow field for layouts comprising different building lengths.
The mean velocity (MV) of the selected points can be used as a parameter for evaluating the ventilation efficiency. These values are listed in Table 3. Longer buildings have larger MVs. This is because, when the building length increases, the blocking ability of the building against the incoming airflow increases, and more of the airflow enters the building layout from the lateral building gap. In the aligned layout, the velocity in the first row is enhanced. Taking the mid-rise building layout as an example, the MV of the first row for AM-1 is 1.03, and that for AM-3 is 0.79. Part of the backflow in the first row rises and reaches the pedestrian height on the left and right sides of the second row. The velocity also increases significantly, and the values at p = −4 for AM-1 and AM-3 are 0.84 and 0.47, respectively. The enclosed layout is equivalent to the first row in the aligned layout and is directly affected by the incoming flow from the lateral building gap.

3.2. Building Height

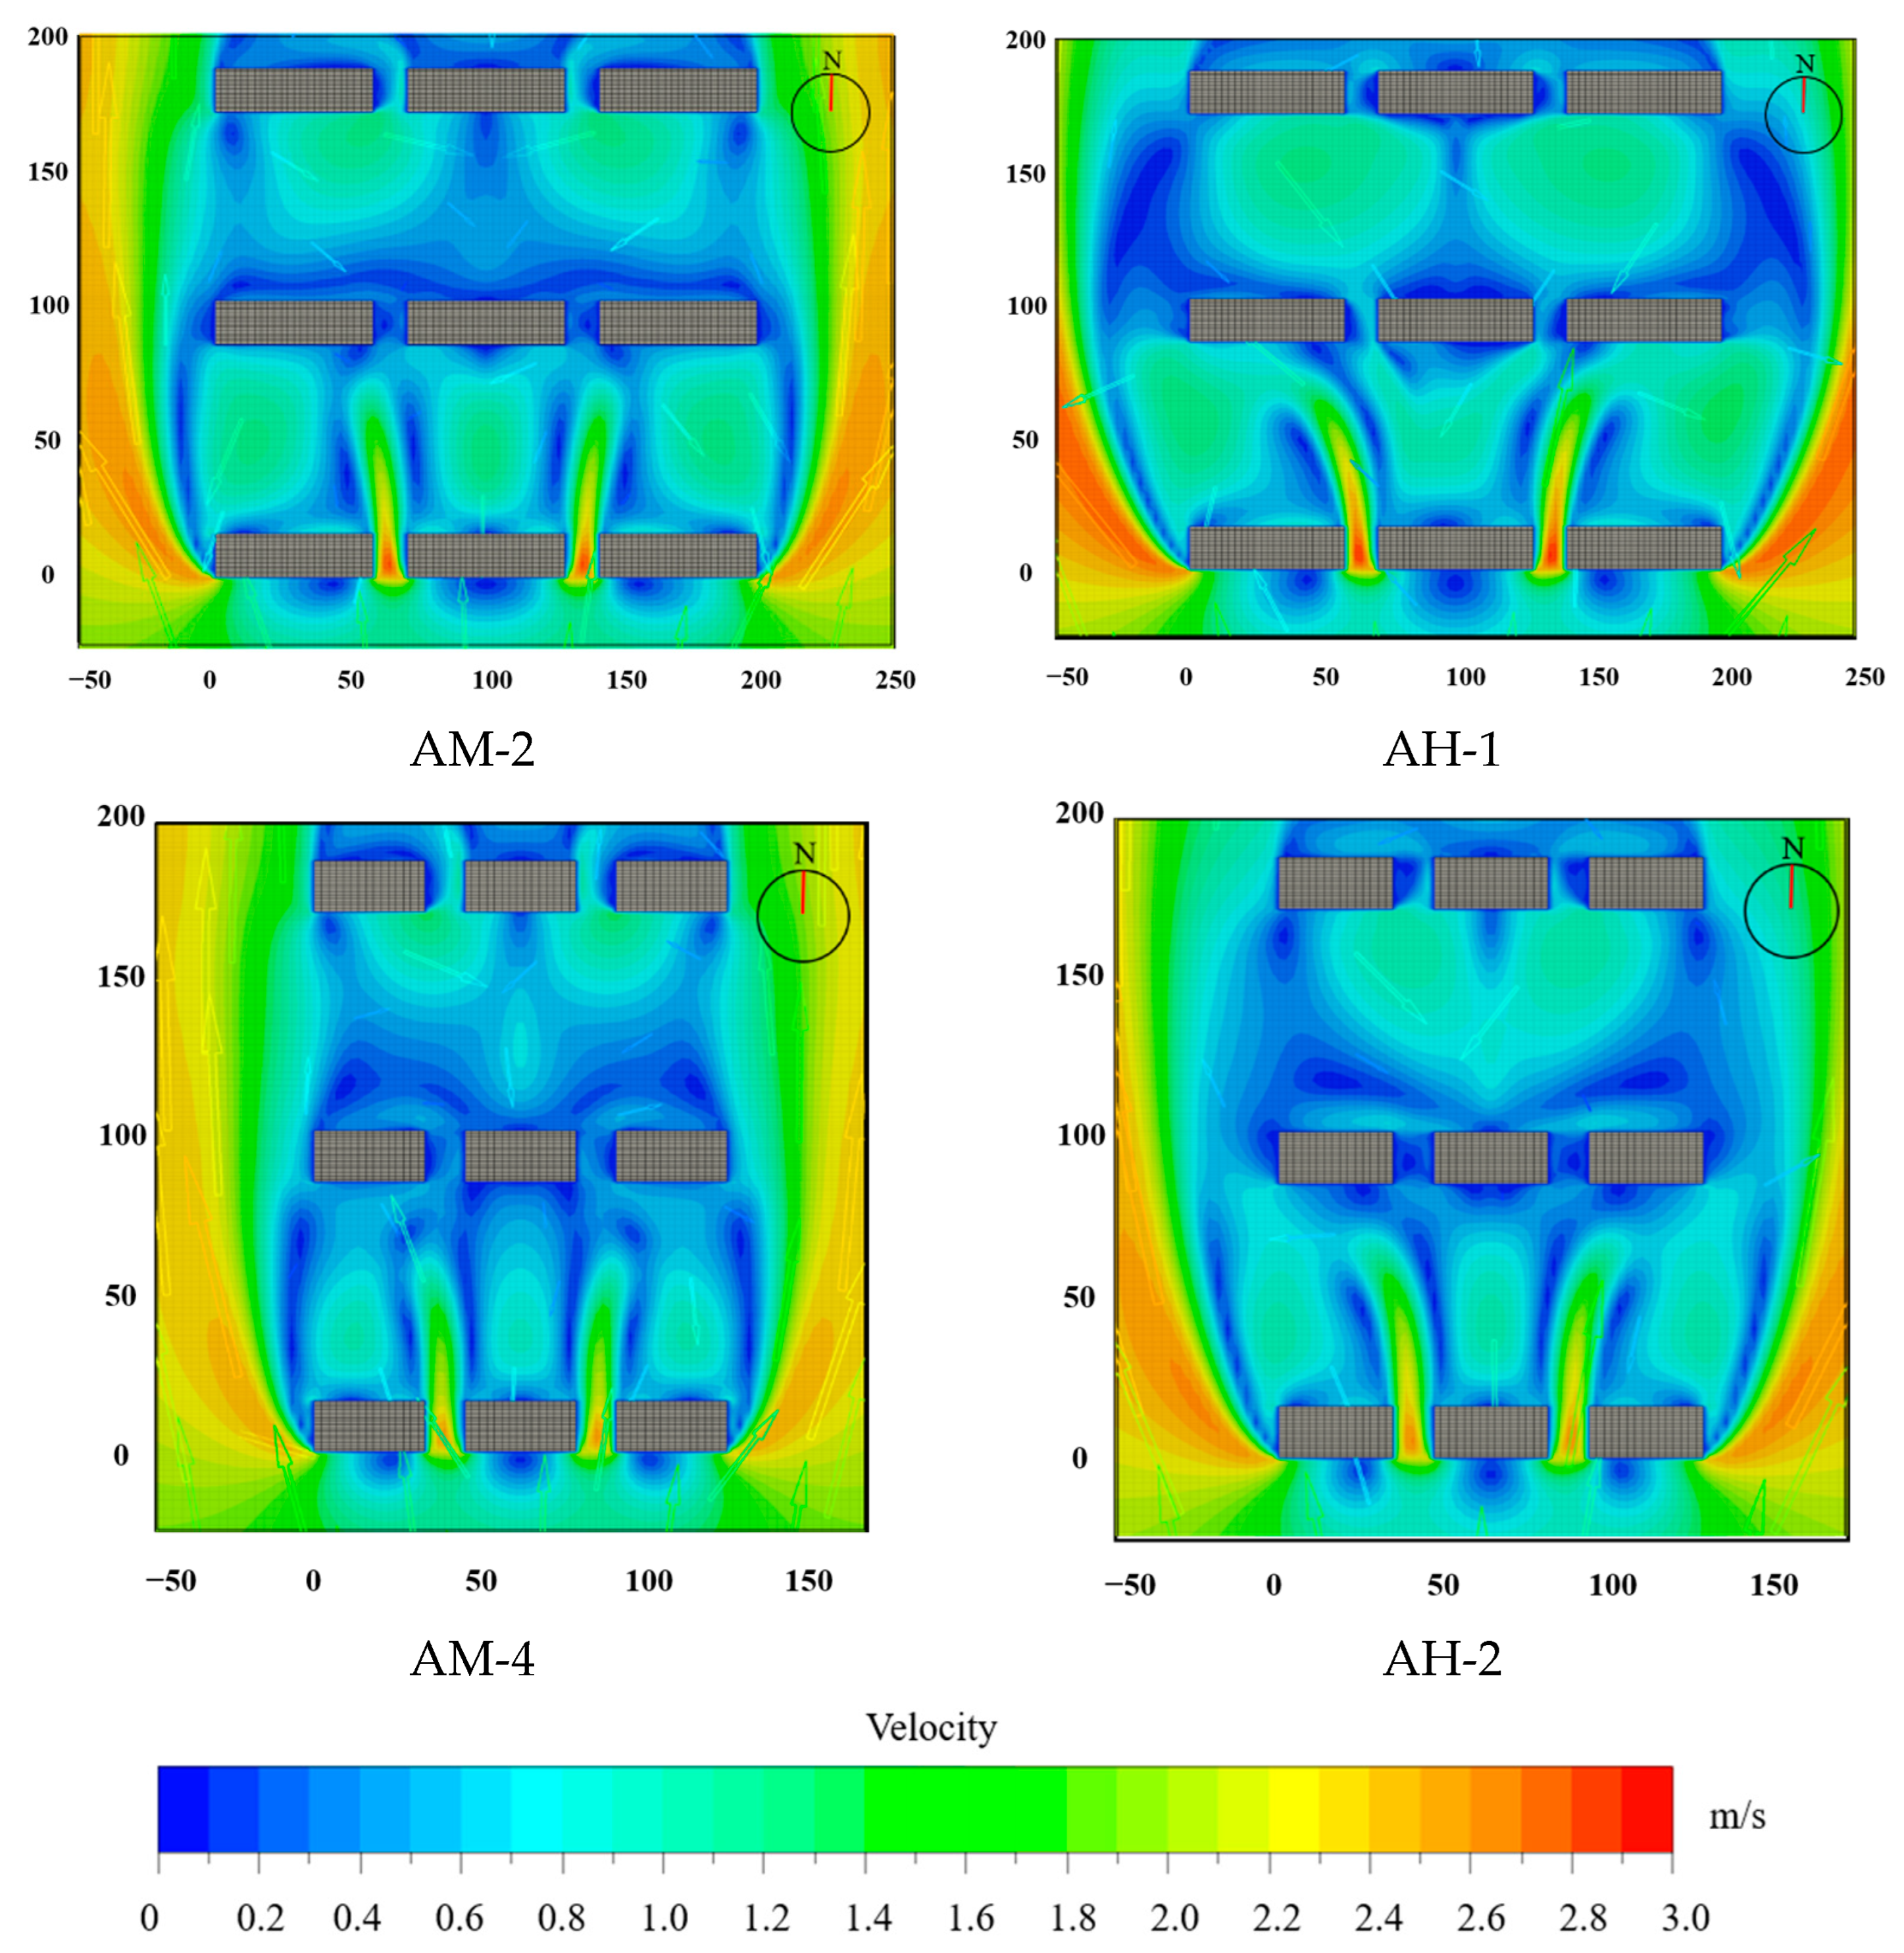
For the aligned layout, only the building height is changed, as in the case of AM-2, AH-1, AM-4, and AH-2. Two major changes appear as the height increases (Figure 15). First, the flow of higher buildings entering from the lateral gap has a large deflection. Second, the high-velocity zone increases in size, especially at the leeward zone of the central building. The reasons for these changes are as follows. The building-height increase results in an increase in the blocking effect, and the underpressure at the leeward building increases, thus causing the flow coming into the layout to deflect more. Taking AM-2 and AH-1 as examples, the pressures of AH-1 at p = −4, 0, and 4 in the first row are −1.52, −1.07, and −1.52 Pa, respectively; the corresponding pressures of AM-2 are −0.78, −0.57, and −0.78 Pa, respectively. If more of the flow is blocked, then the velocity entering the lateral gap increases, thus enhancing the velocity in the layout. Higher buildings increase the underpressure in the second zone, which attracts more flow. For AM-2 and AH-1, the pressures at p = −4, 0, and 4 in the second row of AH-1 are −2.58, −2.26, and −2.58 Pa, respectively, and the pressures of AM-2 are −1.85, −1.77, and −1.85 Pa, respectively.
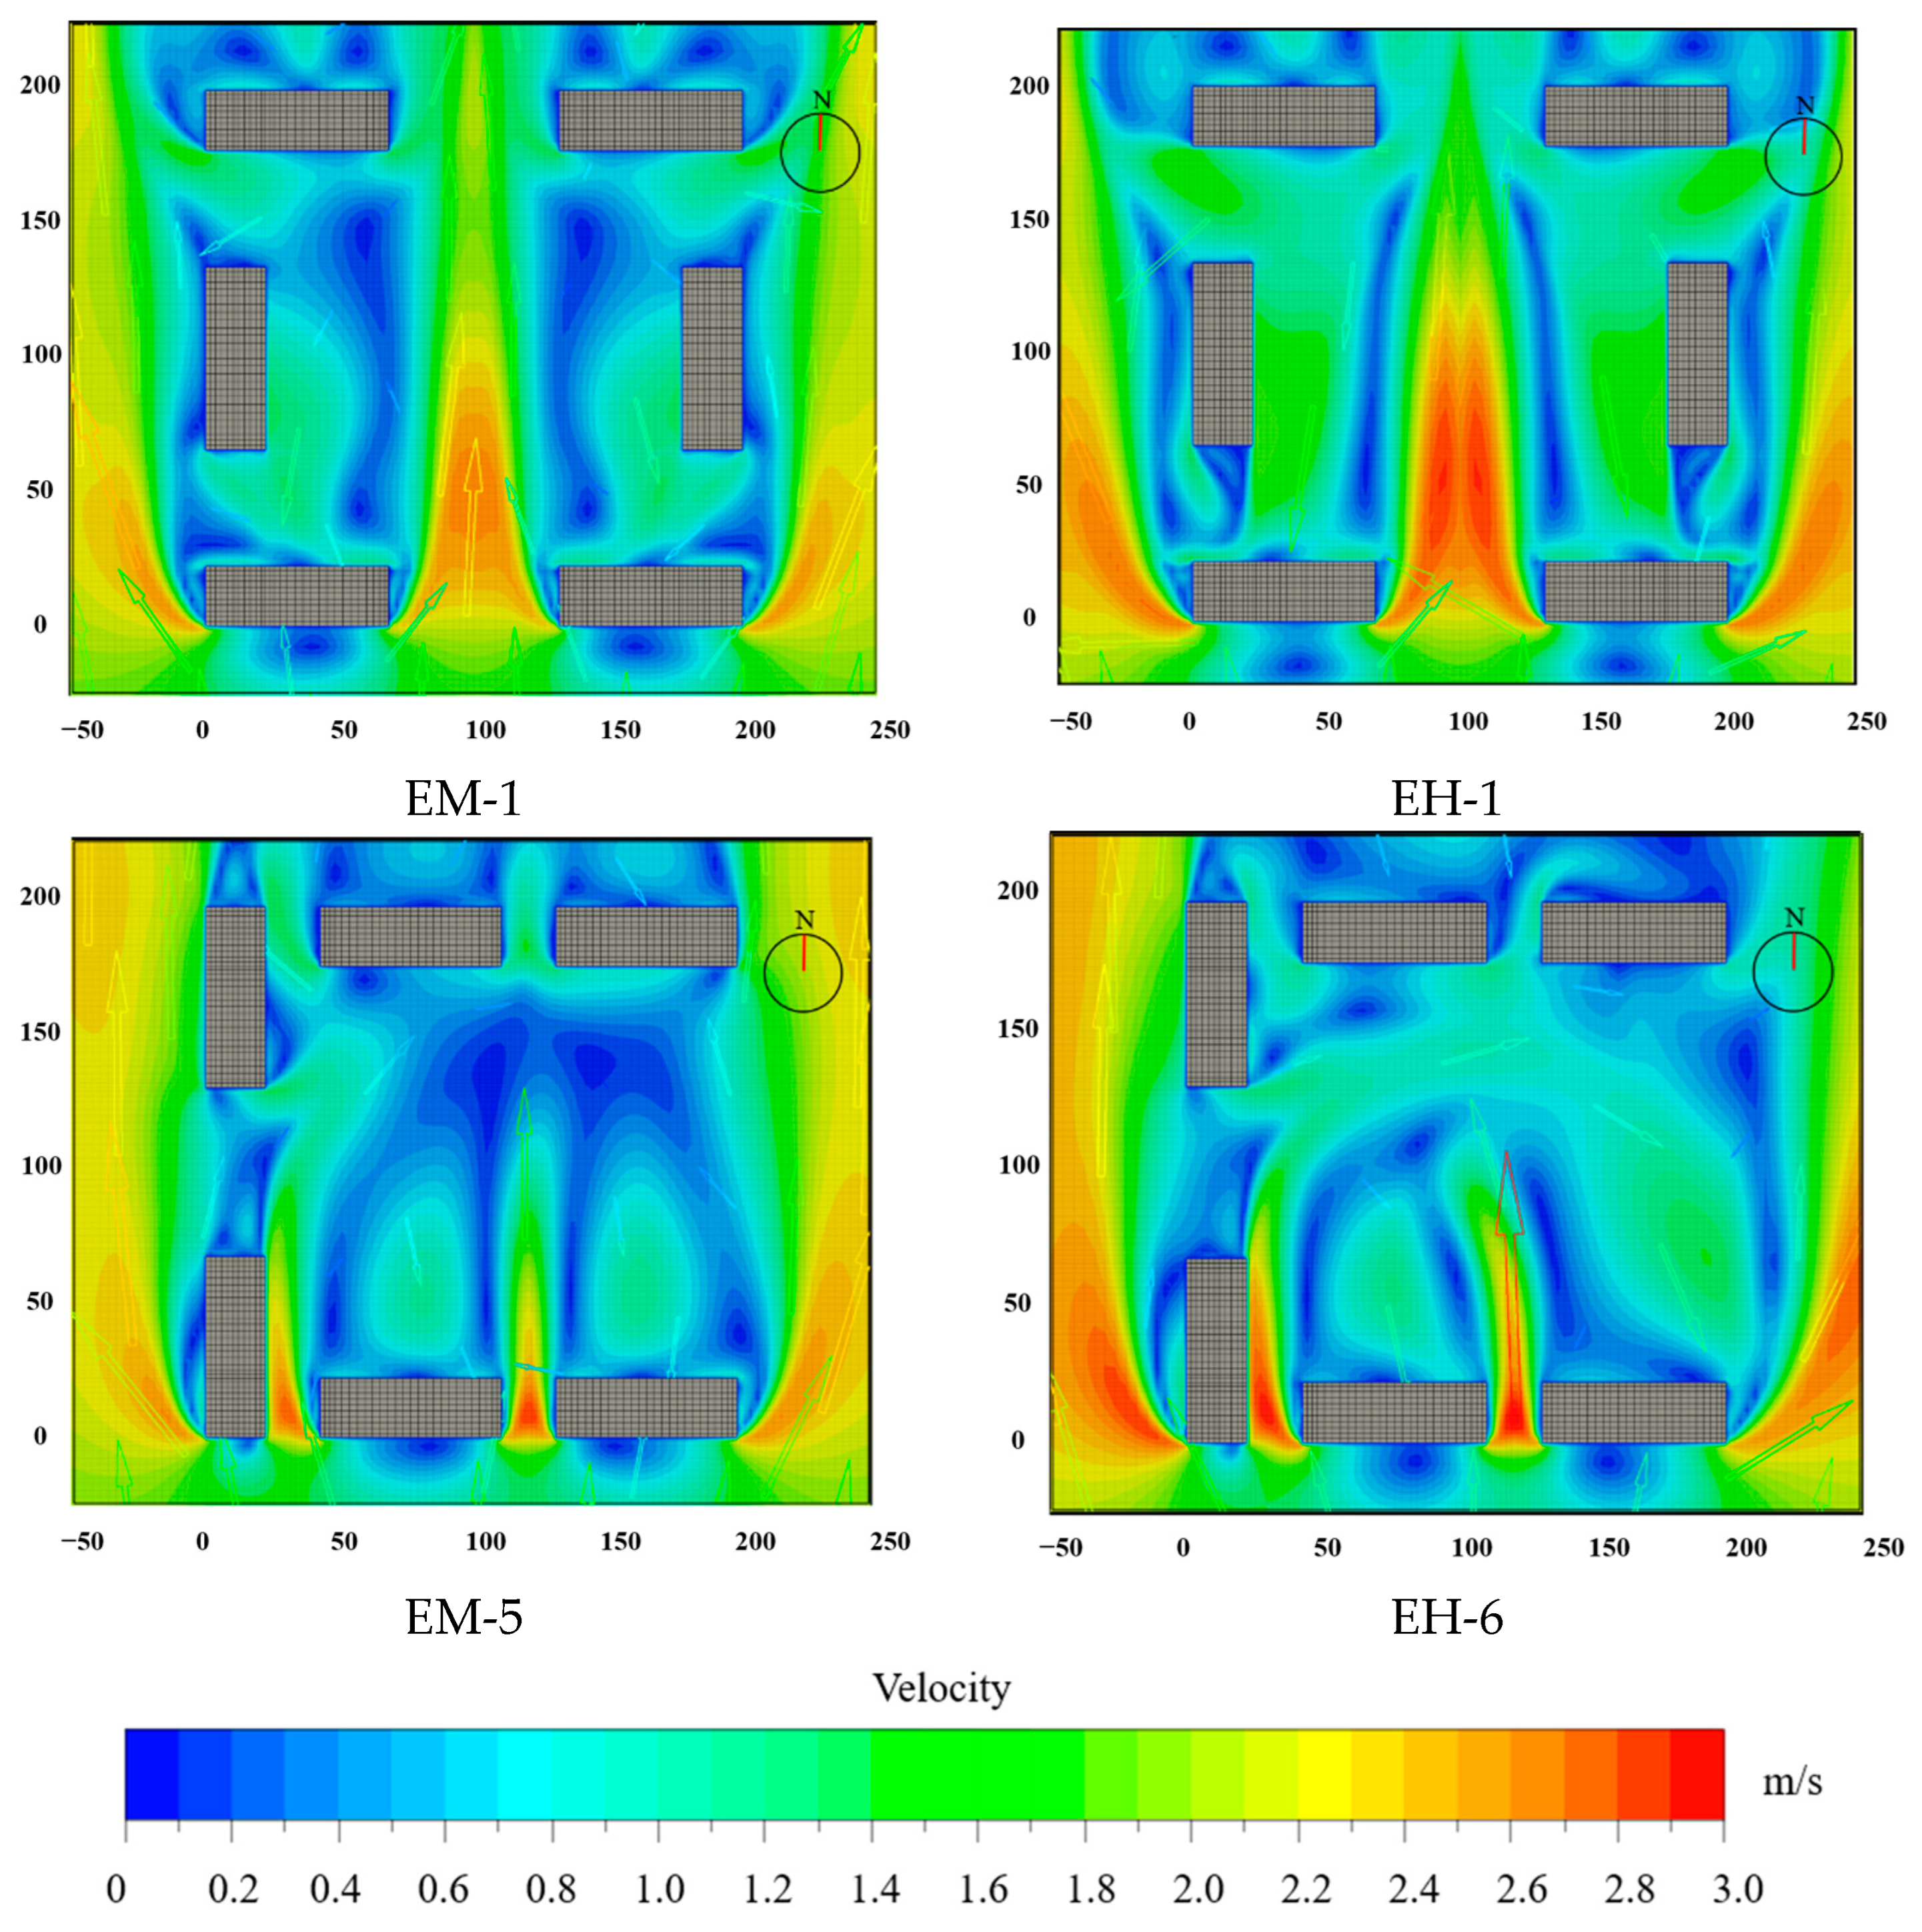
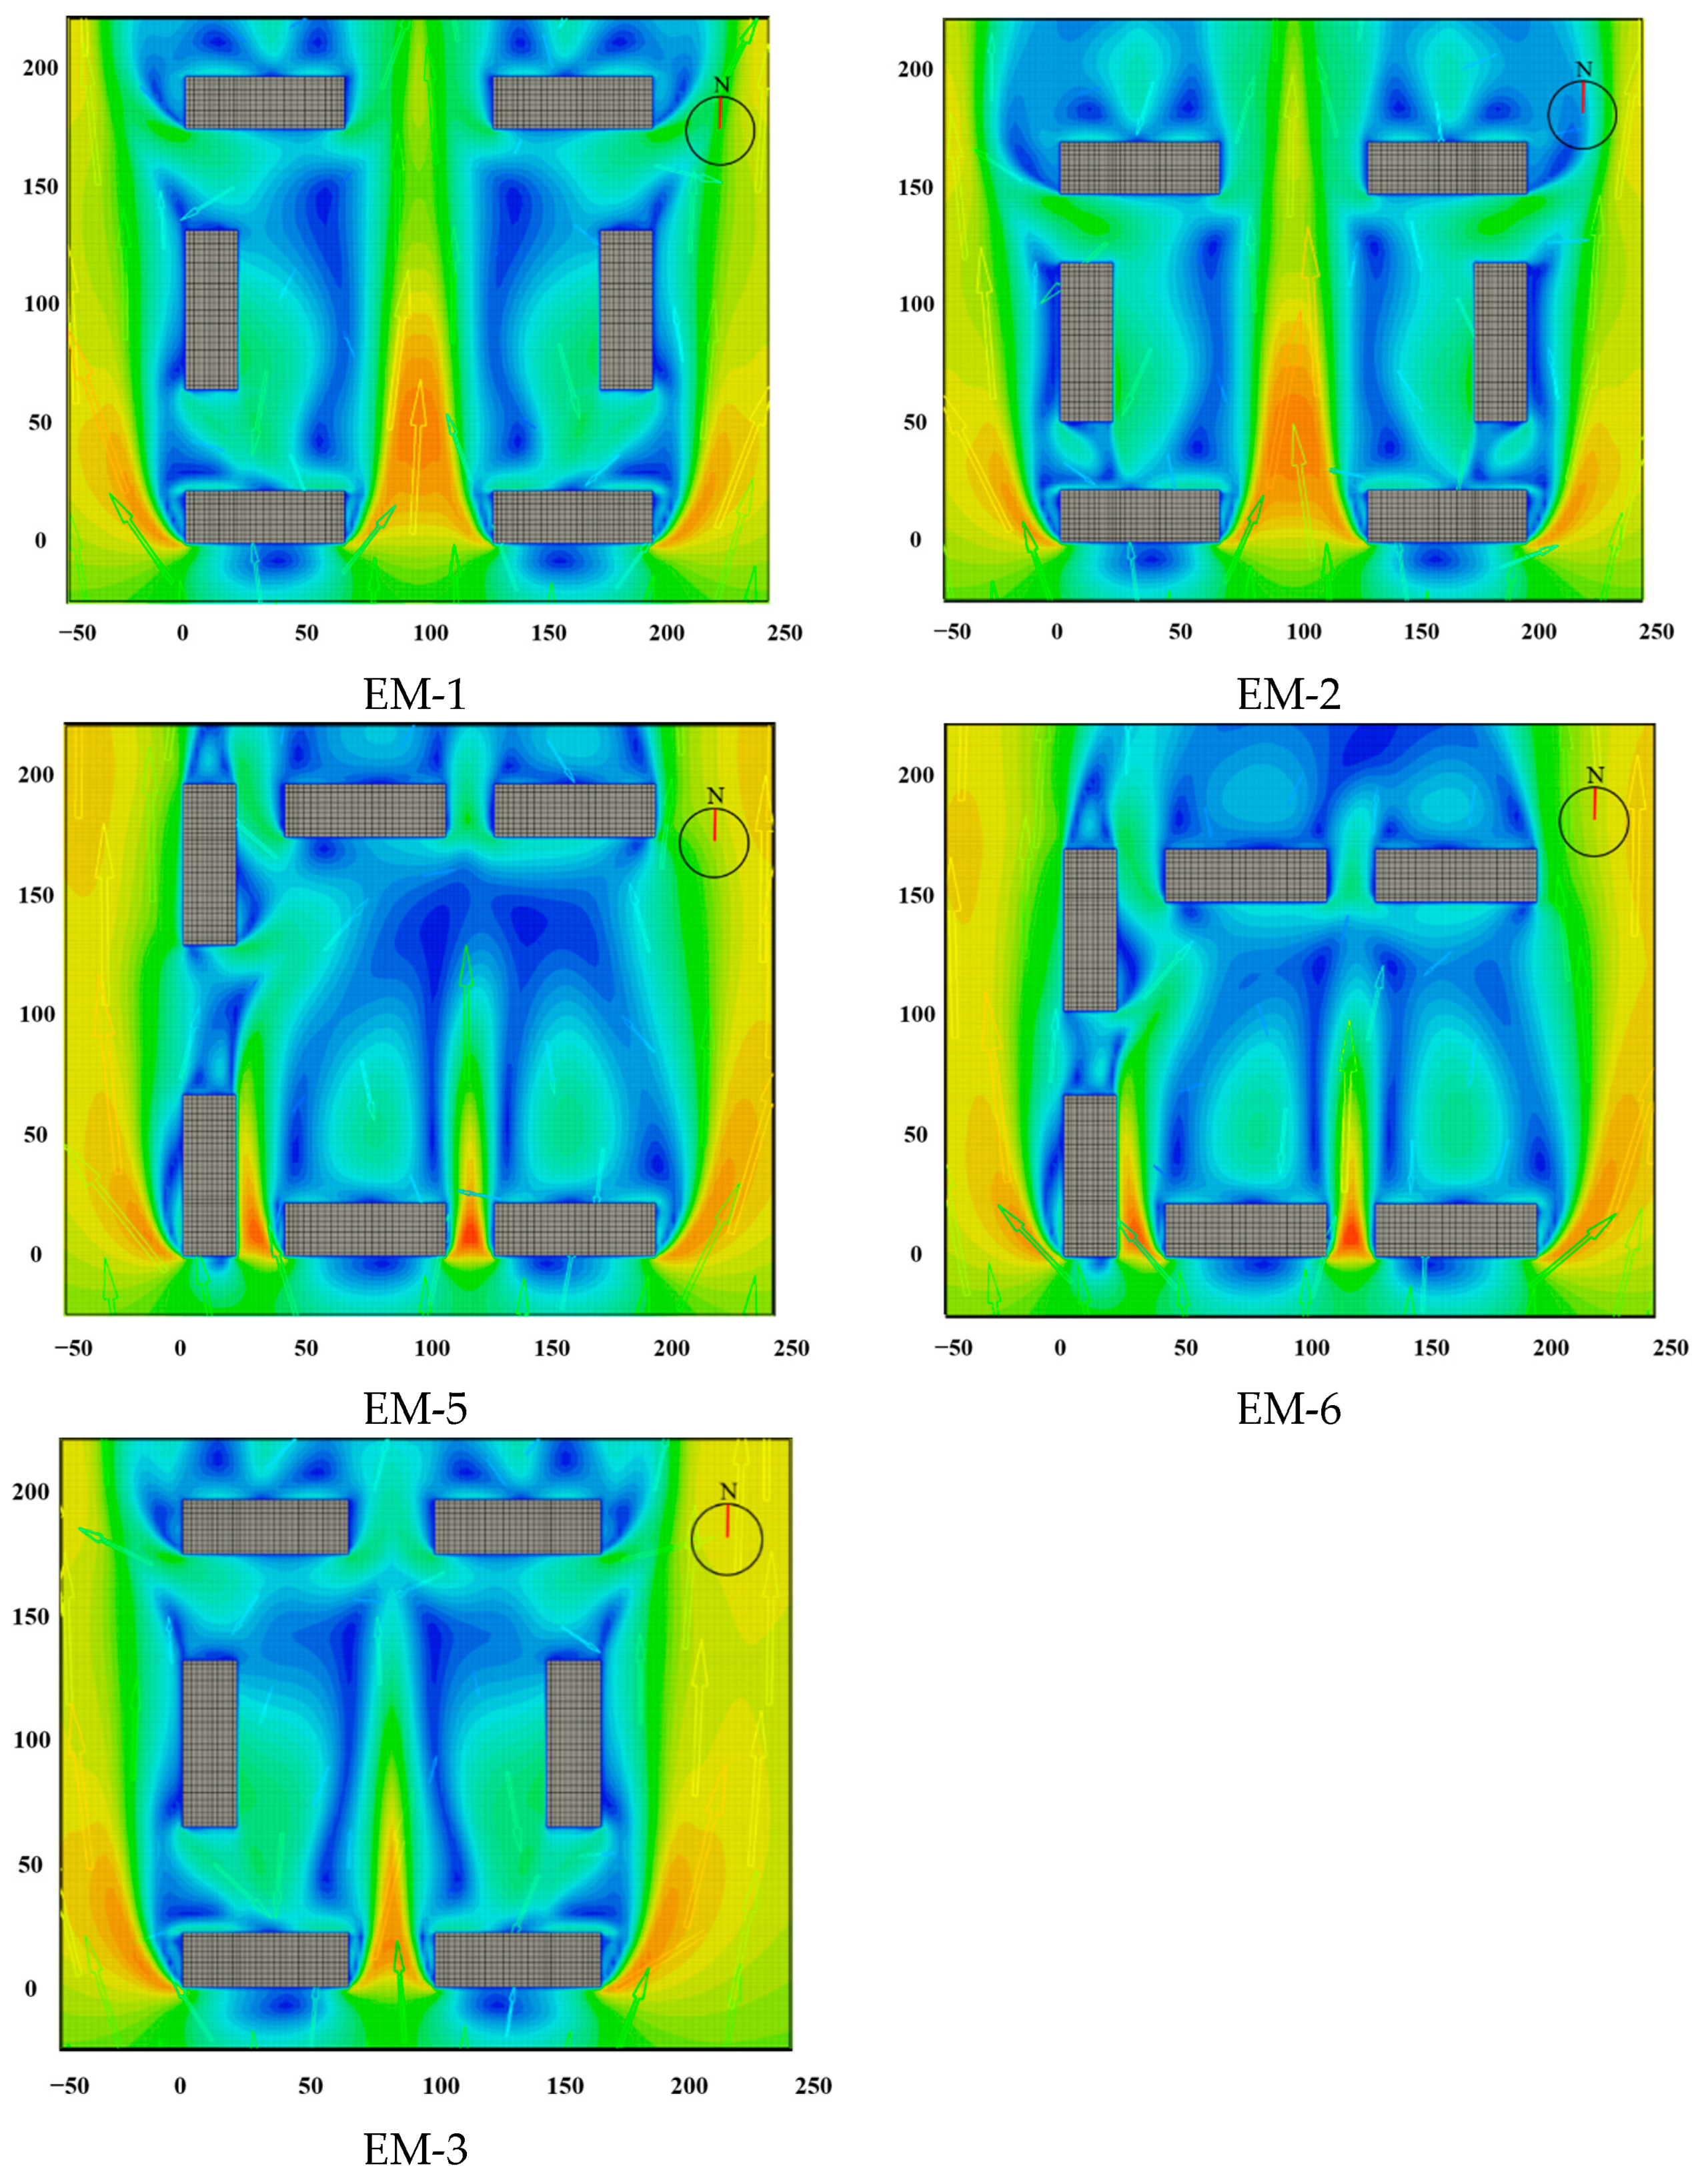
The building height of the enclosed layout also changed in EH-1, EM-1, EH-6, and EM-5 (Figure 16). The most evident difference between the two heights is the area of the low-velocity zone. This was similar to the case of the increase in the high-velocity-zone area in the aligned layout.
The effects of an increase in building height are similar to those of increasing the building length. An increase in the blocked area increases the flow velocity entering the layouts, and the larger underpressure zone attracts more flow. This phenomenon can be used in planning and designing public-activity spaces to enhance their ventilation capacities.
In some situations, the building height does not change uniformly. In this study, two conditions of the aligned layout were considered. To reduce the simulation time, the non-uniform heights were based on the mid-rise building’s layout. In AM-5, the central building was one layer higher than the surrounding buildings, and in AM-6, the buildings were one layer higher than the front buildings along the wind direction. Compared with the case of AM-2, the symmetrical flow field disappears (Figure 17). This is because, when the building heights are non-uniform, the flow field above the building array is disturbed, and more turbulence appears, thus resulting in an increased velocity at the pedestrian height.
The MVs at the different heights are listed in Table 4. Higher buildings tend to have larger MVs. Height inhomogeneity increases the MV at the pedestrian height. The velocity increase is more evident at greater inhomogeneities.

3.3. Building Distance

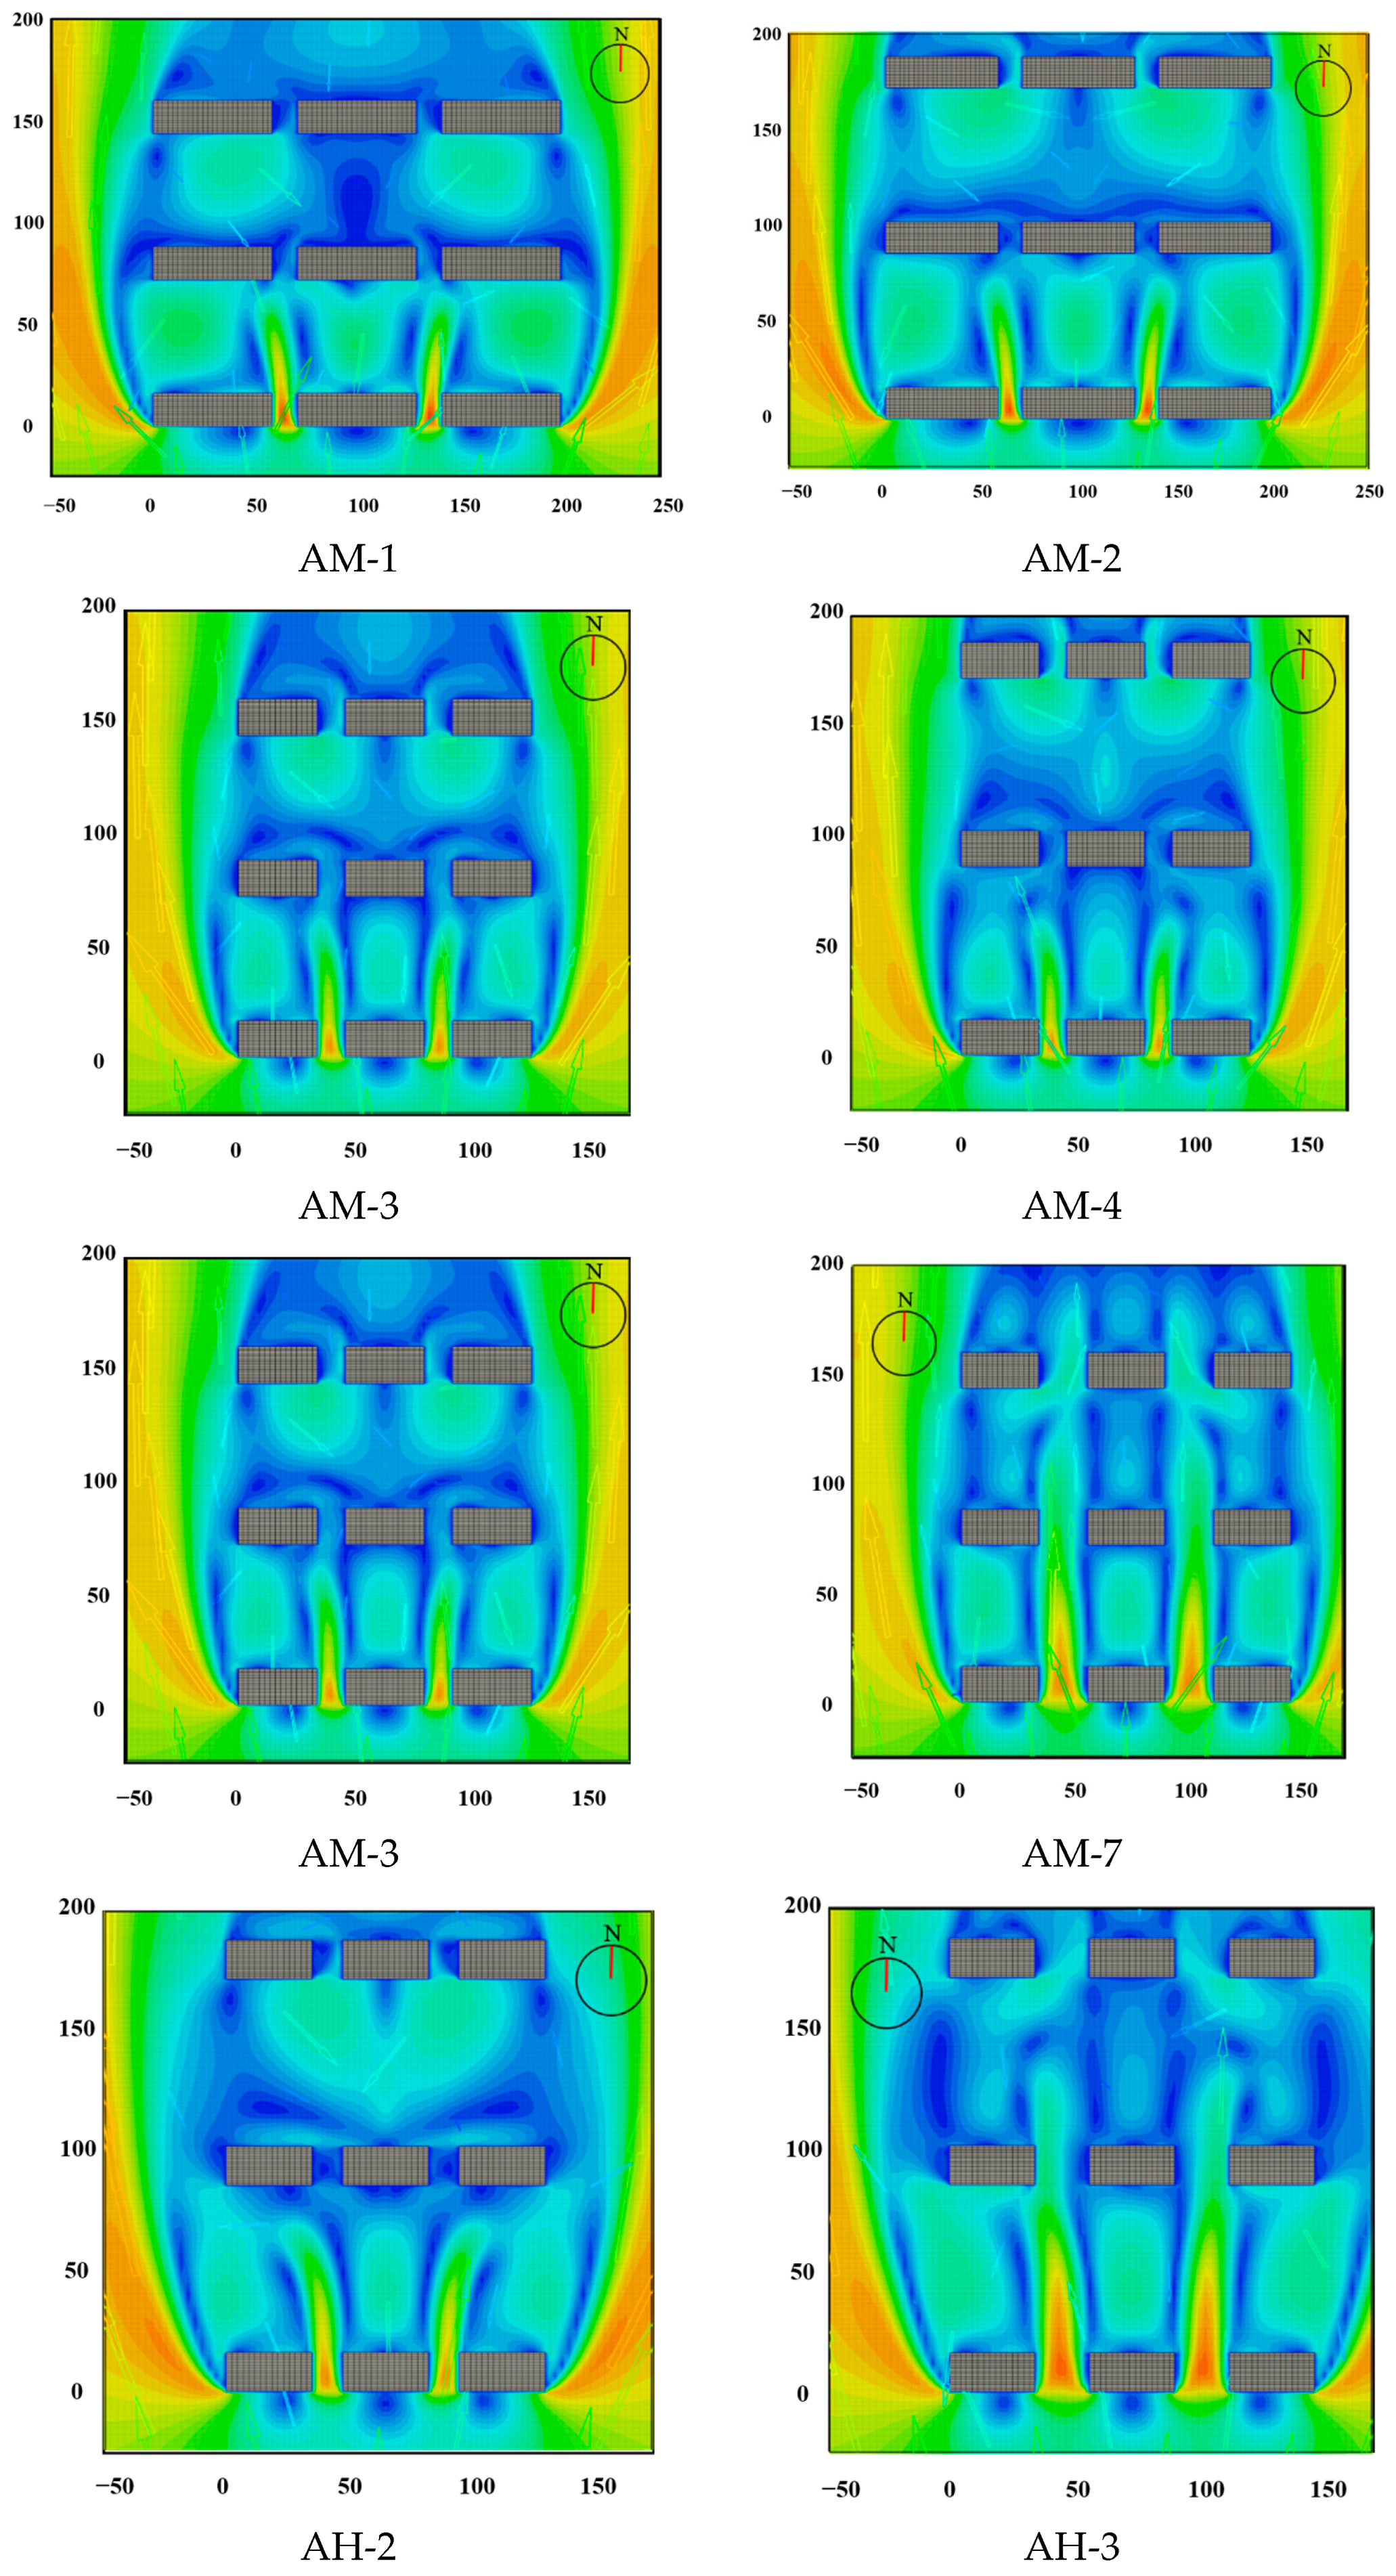
For the aligned layout, the building distance includes the normal and lateral distances, which both have impacts on the flow field. AM-1 and AM-2 along with AM-3 and AM-4 are considered for the normal-distance change; AM-3 and AM-7 along with AH-2 and AH-3 are considered for the lateral-distance change. As shown in Figure 18, when the normal distance increases, the velocity in the downwind direction of the first row decreases, and the velocity increases in the leeward zone of the central building. For the first row, because of the backflow, the airflow entering from the gap between adjacent buildings travels a limited distance, the effect of which decreases on the downwind zone of the first row as the normal building distance increases. In the cases of AM-1 and AM-2, the MV of the first row of AM-1 is 1.03, and that of AM-2 is 0.93. However, in the second row, for a larger normal distance, a greater amount of the flow enters the row, thus increasing the velocity in the leeward zone of the central buildings. The MV in the second row of AM-1 is 0.59, and that of AM-2 is 0.61. When the lateral distance of the building increases, a greater amount of the flow can enter the layout, travel a longer distance, and even affect the second row. The flow direction is opposite to the backflow direction in the second row, which reduces the velocity in this row.
For the enclosed layout, the building distance exhibits a similar trend (Figure 19). The changes in the north–south-direction building distance can be considered as normal-distance changes. These correspond to EM-1, EM-2, EM-5, and EM-8. The changes in the east–west-direction building distance can be considered as lateral-distance changes corresponding to EM-1 and EM-3. When the north–south-direction distance increases, the low-velocity zone becomes larger. When the distance between the east and west increases, the flow entering the layout can reach farther distances.
It can be observed that the building distance change mainly affects two aspects. One is the influence of the flow in the layout, and the other is the direct impact of the amount of flow entering the layout. These two aspects affect the layout velocity.
The MVs obtained at different distances are listed in Table 5. When the normal distance increases, the MV decreases. As the building distance increases, the airflow entering the rows from the lateral gap can no longer affect the downwind direction of the first row; therefore, the MV of the first row decreases. This is similar to the case of the change in the length of the building, wherein the first row plays a major role in the influence of the MV. When the lateral distance increases, the MV decreases. However, in the case of the enclosed layout, a larger lateral distance can increase the MV. This is because a greater amount of the flow enters the building layout, and no opposite-direction flow reduces the velocity.

3.4. Staggered Layout

Buildings can be arranged in staggered layouts, such as SH-1 and SH-2. Compared with AH-1 and AH-2, SH-1 has no central building, and SH-2 has a longer building (Figure 20). These are two common staggered layouts. For these, the flow above the buildings reaches the first row to a greater extent, thus inducing an increase in the air pressure in the central zone. The flow entering from the adjacent building gap flows more sidewards, and the deflection increases.
The MVs of the aligned and staggered layouts are listed in Table 6. Staggered layouts lower the MV. Because a greater amount of airflow enters the layout from the building array above, the deflection increases. This causes a greater flow towards the outside of the building arrays. Thus, the incoming flow has a weaker effect on the velocity in the building array.

3.5. Enclosed Layout and Semi-Enclosed Layout

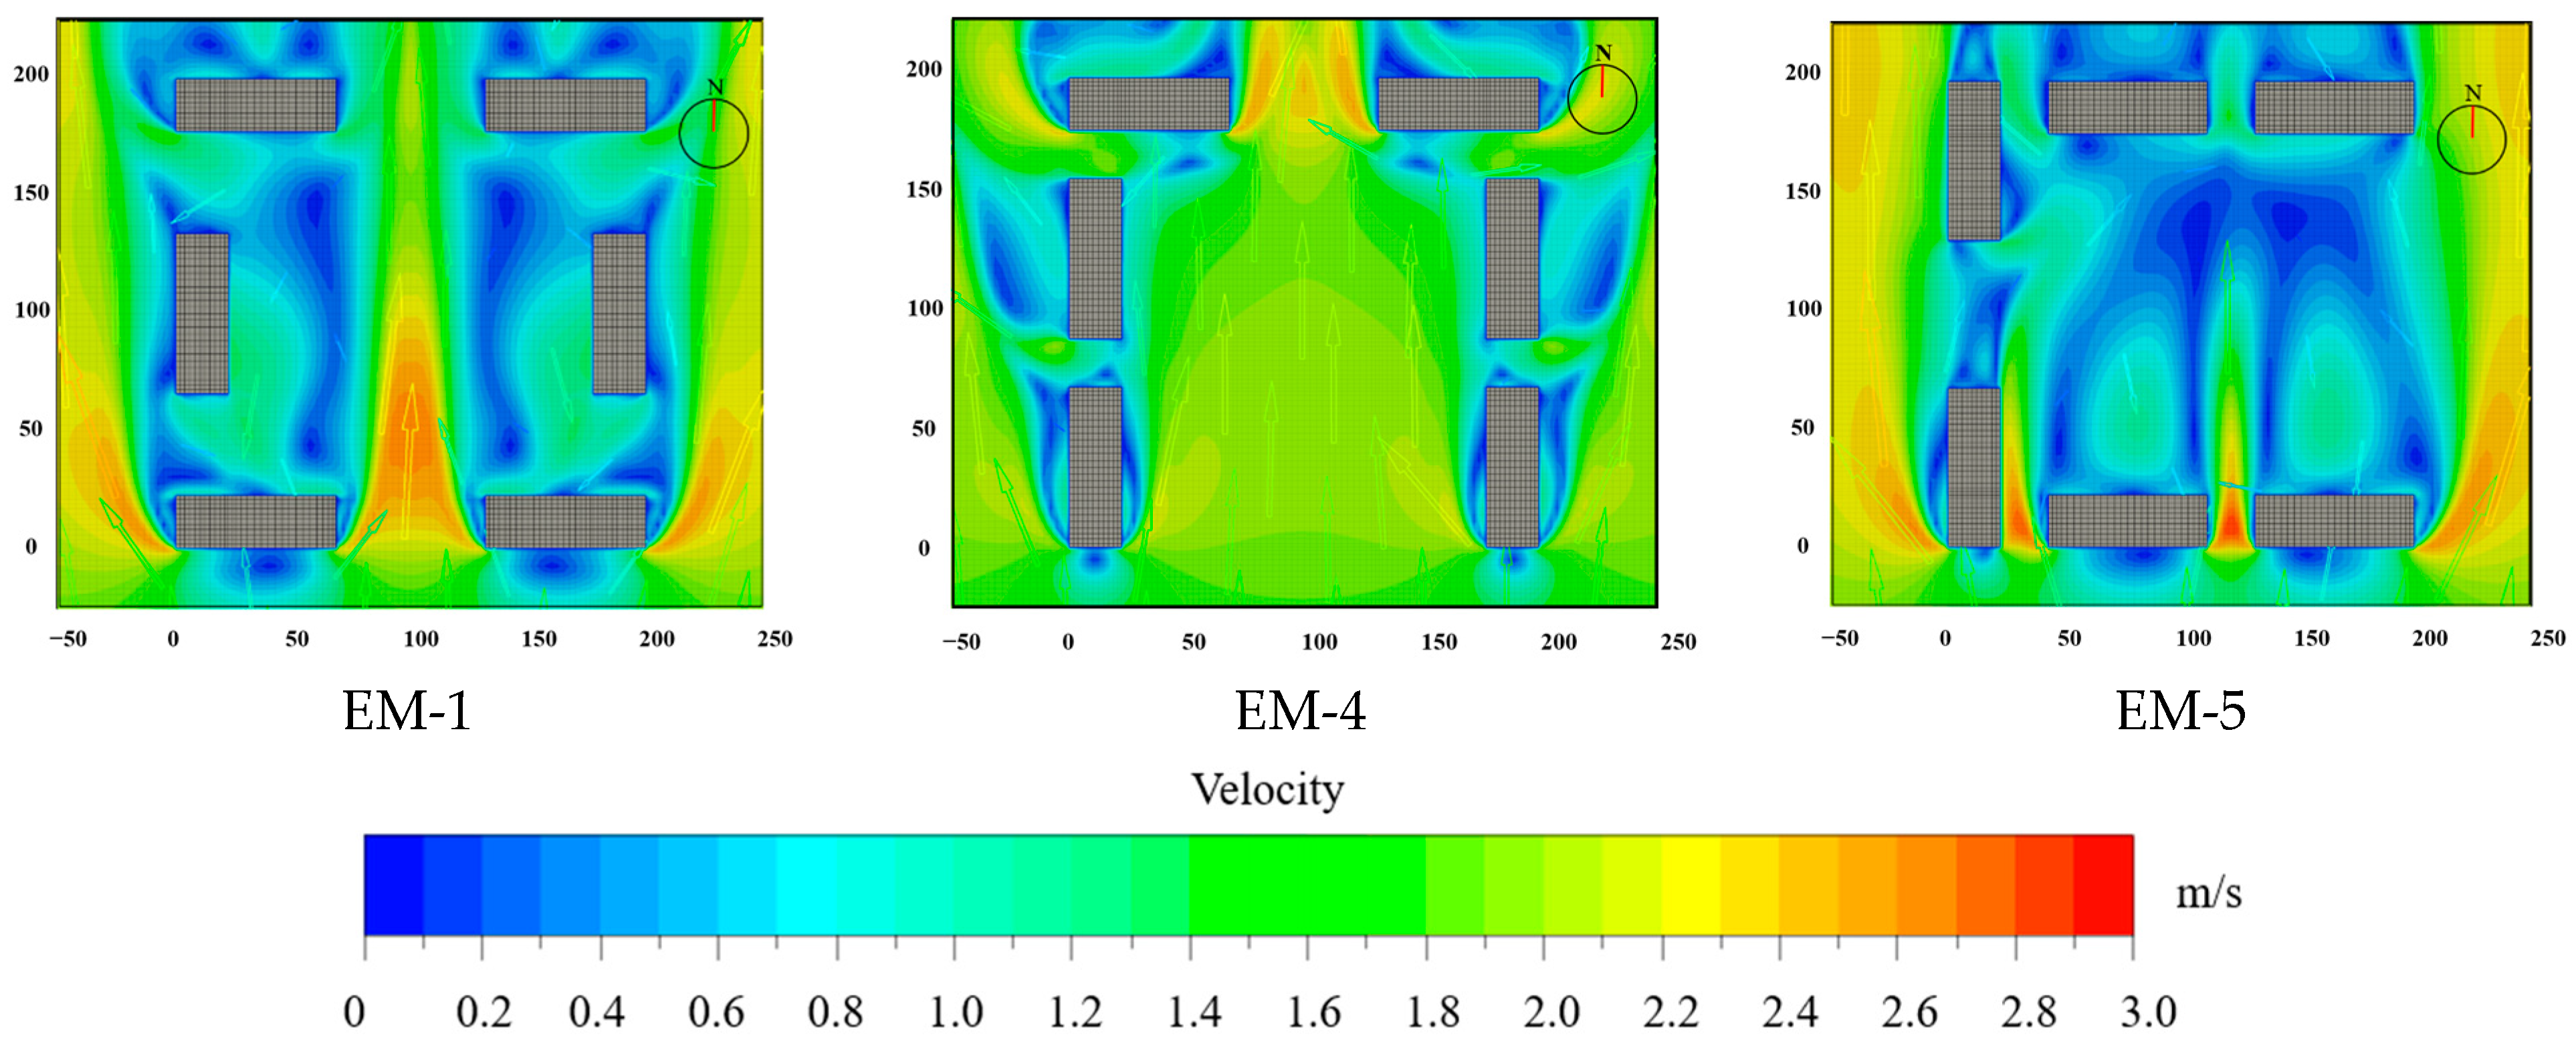
A semi-enclosed layout generally includes two different opening-direction layouts: opening to the south or opening to the east. EM-4 and EH-5 are south-facing openings, and EM-5 and EH-6 are east-facing openings. As shown in Figure 21, if the opening is to the south, then the flow maintains the incoming velocity entering the layout. When the opening is to the east, the flow enters from the adjacent building gap and flows to the underpressure zone. The high-velocity zone is more isolated compared with that of the enclosed layout, which is not beneficial to the ventilation of centralized public-activity spaces. The reason for the use of the semi-enclosed layout for different openings is often that the conditions outside the building array are at a different position. In addition, the opening to the south exposes more buildings to sunshine. This is not suitable for hot regions in summer.
The MVs of different layouts are listed in Table 7. EH-5 and EM-4 have no blocking effect on the airflow; therefore, the corresponding MVs are close to 1. When the layout is EH-6 or EM-5, the lateral distance decreases; thus, the velocity decreases.

4. Discussion

Because of the specific array scale and density limit, the velocity performances at the investigated pedestrian height are different from some previous studies [20,22,26,28]. If the building density and building array scale are not taken into account, then there will be some errors in the assessment of the outdoor ventilation performance. The outdoor ventilation effect can be evaluated by the MV, the variations in which that are caused by the building dimensions and layout are discussed below.
It should be noted that for the aligned layout, the first row has a major effect on the MV: a higher velocity in the first row indicates a larger MV in the layout. An enclosed layout can be regarded as a special aligned layout. Based on the first row of the aligned layout, buildings are added in the east and west directions. Therefore, the wind speed characteristics of the first row of the aligned layout can be applied to an enclosed space. Then, if the velocity of the first row is greatly influenced by the incoming flow, the MV characteristics of the enclosed layout are the same as that of the aligned layout, which will not be discussed once again in the following.
An increase in the building length can benefit the outdoor MV. You et al. [50] found that a shorter building length increased the ventilation efficiency of the middle space of the row for residential areas because the row studied was not directly affected by the incoming wind. Similar results were obtained in the present study. However, the MV has different characteristics because the first row is directly affected by the incoming flow. From the analysis in Section 3.2, it can be observed that, for the aligned layout, the velocity increases as the building length increases. When the length increases, the blocking effect is enhanced. A greater amount of the flow enters from the adjacent building gap, resulting in a higher velocity in the first row. However, in the second row, because the building is longer, it is difficult for the left- and right-side flows to enter the central zone of the row, which decreases the wind speed of the row. Because the first row has a major effect on the MV, a higher velocity in the first row indicates a larger MV in the layout.
An appropriate increase in height is beneficial for outdoor MV. Although an increase in height increases the wind-blocking effect of the building, a larger underpressure at downwind buildings attracts a greater incoming flow into the first row. In [40], after the height was increased, the ventilation effect in the majority of areas was reduced. In the study, the building height was increased without increasing the building distance. This condition often results in a higher floor area ratio than that required in reality. Therefore, as mentioned previously, the density limit and array scale should be checked before conducting research. Chen et al. [45] arrived at the same conclusion as us, stating that increasing the building height is usually beneficial for human comfort owing to the relationship between temperature and wind speed. However, this does not mean that a larger height always results in a greater MV. If the array scale is much greater than the neighborhood scale, then after the airflow passes through multiple rows, the influence of the incoming flow is reduced, and blocking plays a dominant role. Therefore, the array scale is crucial and should be determined previously. Different building heights in the array will always facilitate ventilation, which is the same conclusion as that arrived at in [46,56,74,75,76,77]. Buildings with non-uniform heights will have more flow at the pedestrian height owing to greater turbulence generated above the building array. However, an extremely high building should be avoided because sunlight does not easily reach the pedestrian height, the wind speed from above is sometimes too high, thus causing people to fall, and people may develop a depressing feeling, which is disadvantageous for outdoor activities.
A larger building distance does not necessarily increase the MV. For the aligned layout, in the second row, an increase in the normal distance allows more flow to enter the row, thereby increasing the velocity. The same conclusion was arrived at in [38,46] under this condition. However, in the first row, the incoming flow can directly affect the row after it enters the adjacent building gap. A larger building normal distance will weaken the influence of the incoming flow in the downwind direction of the first row because the incoming flow cannot reach too far. As discussed previously, lower velocity in the first row indicates a lower MV in the layout. When the lateral distance increases, more flow can enter the layout. The velocity in the building intersections is larger, as discussed in [50], but the flow direction is opposite to that of the backflow of the second row, which leads to a reduction in the velocity of this row, decreasing the MV. For the enclosed layout, increasing the lateral distance means more flow can enter the centralized public-activity spaces, increasing the MV.
A staggered layout does not necessarily result in a larger ventilation effect. In [46], the staggered array exhibited a better ventilation efficiency than the aligned array. In [56], the ventilation of the aligned urban form was better than that of the staggered urban form; this is likely because the staggered urban form produces a stronger form drag than the square urban form. In the staggered layout considered in this study, owing to the absence of a central building, a greater amount of the flow from above the buildings reaches the pedestrian height, thus enhancing the backflow to the first row and inducing an increase in the air pressure in the central zone. The flow entering from the adjacent building gap flows more sidewards, and the deflection increases, thus reducing the ventilation in the layout.
The semi-enclosed layout does not necessarily increase the MV. The opening to the south layout does increase the MV; however, the east-facing opening does not. This is because the flow of the east-facing opening is blocked in the south, which is similar to the case of the enclosed layout but has a weaker velocity because the corresponding lateral distance is shorter under the same building-density conditions.

5. Conclusions

In this study, a CFD parametric approach was taken to investigate the impact of geometric morphology elements and layout forms on the outdoor pedestrian ventilation in neighborhood blocks while controlling the building array scale and density. The analysis and discussion of the results of this study revealed the following scientific understandings for decision making in urban planning and design activities:
(1) The building array size and practical building density should be considered for outdoor ventilation before urban planning and architecture design. The different results can be obtained under various array scales and building densities. The neighborhood block recommended in this study can be applied to both new project designs and urban redevelopment. Small-range variation in the building density should be more focused on;
(2) In the neighborhood block, increases in the building height and length generally generate a higher MV. Non-uniform heights are preferred. The importance of array scales and building densities is also validated because of some different results for other scales and the large range of building densities;
(3) An increase in the building distance, including normal and lateral distances, reduces the MV in the aligned layout. This is also different from that concluded from the large range of building densities;
(4) The staggered layout and semi-enclosed layout with the east-facing opening are not beneficial to achieving a higher MV in the layout. Although a semi-enclosed layout with the south-facing opening is effective for improving ventilation, it may expose more buildings to the eastern and western sunlight with the same array size and building density;
(5) In engineering applications, policymakers are reminded to pay more attention to the premise for the strategies for superior outdoor ventilation before selecting appropriate strategies, as the simulation results are different under the specific scale and building density of this study.

6. Limitations and Future Study

It is worth mentioning that the above conclusions are valid for building arrays within the neighborhood scale, and for approaching wind perpendicular to the buildings’ long sides. Some care should be adopted when considering building arrays that are significantly larger than the neighborhood scale that do not satisfy the building-density limit, or without the same approaching wind. This study involves one of the first attempts at suggesting methods for improving the ventilation at the pedestrian level in actual construction. Further investigations are required before formulating a practical framework for urban planning guidelines. Real urban studies are necessary to clarify the relationship between urban ventilation and various design parameters.

Author Contributions

Conceptualization, R.L.; Methodology, R.L.; Writing—original draft, R.L.; Writing—review & editing, Y.C.; Supervision, Y.Z. All authors have read and agreed to the published version of the manuscript.

Funding

This research was funded by National Natural Science Foundation of China grant number 52178074.

Conflicts of Interest

The authors declare no conflict of interest.

References

  1. Zhou, W.; Qian, Y.; Li, X.; Li, W.; Han, L. Relationships between land cover and the surface urban heat island: Seasonal variability and effects of spatial and thematic resolution of land cover data on predicting land surface temperatures. Landsc. Ecol. 2013, 29, 153–167. [Google Scholar] [CrossRef]
  2. Huang, J.; Jones, P.; Zhang, A.; Peng, R.; Li, X.; Chan, P.-W. Urban Building Energy and Climate (UrBEC) simulation: Example application and field evaluation in Sai Ying Pun, Hong Kong. Energy Build. 2020, 207, 109580. [Google Scholar] [CrossRef]
  3. Kato, S.; Yamaguchi, Y. Analysis of urban heat-island effect using ASTER and ETM+ Data: Separation of anthropogenic heat discharge and natural heat radiation from sensible heat flux. Remote Sens. Environ. 2005, 99, 44–54. [Google Scholar] [CrossRef]
  4. Tan, J.; Zheng, Y.; Tang, X.; Guo, C.; Li, L.; Song, G.; Zhen, X.; Yuan, D.; Kalkstein, A.J.; Li, F. The urban heat island and its impact on heat waves and human health in Shanghai. Int. J. Biometeorol. 2010, 54, 75–84. [Google Scholar] [CrossRef] [PubMed]
  5. Santamouris, M. Recent progress on urban overheating and heat island research. Integrated assessment of the energy, environmental, vulnerability and health impact. Synergies with the global climate change. Energy Build. 2020, 207, 109482. [Google Scholar] [CrossRef]
  6. Taha, H. Urban climates and heat islands: Albedo, evapotranspiration, and anthropogenic heat. Energy Build. 1997, 25, 99–103. [Google Scholar] [CrossRef]
  7. Smargiassi, A.; Goldberg, M.S.; Plante, C.; Fournier, M.; Baudouin, Y.; Kosatsky, T. Variation of daily warm season mortality as a function of micro-urban heat islands. J. Epidemiol. Community Health 2009, 63, 659–664. [Google Scholar] [CrossRef]
  8. Mirzaei, P.A.; Haghighat, F. Approaches to study Urban Heat Island—Abilities and limitations. Build. Environ. 2010, 45, 2192–2201. [Google Scholar] [CrossRef]
  9. Sakka, A.; Santamouris, M.; Livada, I.; Nicol, F.; Wilson, M. On the thermal performance of low income housing during heat waves. Energy Build. 2012, 49, 69–77. [Google Scholar] [CrossRef]
  10. Whitman, S.; Good, G.; Donoghue, E.R.; Benbow, N.; Shou, W.Y.; Mou, S.X. Mortality in Chicago attributed to the July 1995 heat wave. Am. J. Public Health 1997, 87, 1515–1518. [Google Scholar] [CrossRef]
  11. Dhainaut, J.F.; Claessens, Y.E.; Ginsburg, C.; Riou, B. Unprecedented heat-related deaths during the 2003 heat wave in Paris: Consequences on emergency departments. Crit. Care 2004, 8, 1–2. [Google Scholar] [CrossRef] [PubMed]
  12. Ren, C.; Yang, R.Z.; Cheng, C.; Xing, P.; Fang, X.Y.; Zhang, S.; Wang, H.F.; Shi, Y.; Zhang, X.Y.; Kwok, Y.T.; et al. Creating breathing cities by adopting urban ventilation assessment and wind corridor plan—The implementation in Chinese cities. J. Wind Eng. Ind. Aerodyn. 2018, 182, 170–188. [Google Scholar] [CrossRef]
  13. Yang, F.; Qian, F.; Lau, S.S.Y. Urban form and density as indicators for summertime outdoor ventilation potential: A case study on high-rise housing in Shanghai. Build. Environ. 2013, 70, 122–137. [Google Scholar] [CrossRef]
  14. Wang, W.; Yang, T.; Li, Y.; Xu, Y.; Chang, M.; Wang, X. Identification of pedestrian-level ventilation corridors in downtown Beijing using large-eddy simulations. Build. Environ. 2020, 182, 107169. [Google Scholar] [CrossRef]
  15. Ng, E. Towards planning and practical understanding of the need for meteorological and climatic information in the design of high-density cities: A case-based study of Hong Kong. Int. J. Climatol. 2012, 32, 582–598. [Google Scholar] [CrossRef]
  16. Chan, E.Y.; Goggins, W.B.; Kim, J.J.; Griffiths, S.M. A study of intracity variation of temperature-related mortality and socioeconomic status among the Chinese population in Hong Kong. J. Epidemiol. Community Health 2012, 66, 322–327. [Google Scholar] [CrossRef]
  17. Mochida, A.; Lun, I.Y.F. Prediction of wind environment and thermal comfort at pedestrian level in urban area. J. Wind Eng. Ind. Aerodyn. 2008, 96, 1498–1527. [Google Scholar] [CrossRef]
  18. Janssen, W.D.; Blocken, B.; van Hooff, T. Pedestrian wind comfort around buildings: Comparison of wind comfort criteria based on whole-flow field data for a complex case study. Build. Environ. 2013, 59, 547–562. [Google Scholar] [CrossRef]
  19. Hong, B.; Lin, B.R. Numerical study of the influences of different patterns of the building and green space on micro-scale outdoor thermal comfort and indoor natural ventilation. Build. Simul. 2014, 7, 525–536. [Google Scholar] [CrossRef]
  20. Geon Kang, J.-J.K.; Choi, W. Computational fluid dynamics simulation of tree effects on pedestrian wind comfort in an urban area. Sustain. Cities Soc. 2020, 56, 102086. [Google Scholar] [CrossRef]
  21. Blocken, B.; Janssen, W.D.; van Hooff, T. CFD simulation for pedestrian wind comfort and wind safety in urban areas: General decision framework and case study for the Eindhoven University campus. Environ. Model. Softw. 2012, 30, 15–34. [Google Scholar] [CrossRef]
  22. Jin, H.; Wang, B.; Han, B.B. Study on Environment Regulation of Residential in Severe Cold Area of China in Winter: Base on Outdoor Thermal Comfort of the Elderly. Sustainability 2019, 11, 6509. [Google Scholar] [CrossRef]
  23. Muller, N.; Kuttler, W.; Barlag, A.B. Counteracting urban climate change: Adaptation measures and their effect on thermal comfort. Theor. Appl. Climatol. 2014, 115, 243–257. [Google Scholar] [CrossRef]
  24. Svensson, M.K.; Thorsson, S.; Lindqvist, S. A geographical information system model for creating bioclimatic maps—Examples from a high, mid-latitude city. Int. J. Biometeorol. 2003, 47, 102–112. [Google Scholar] [CrossRef] [PubMed]
  25. Oke, T.R. Street design and urban canopy layer climate. Energy Build. 1988, 11, 103–113. [Google Scholar] [CrossRef]
  26. Xie, H.M.; Huang, Z.; Wang, J.S. The impact of urban street layout on local atmospheric environment. Build. Environ. 2006, 41, 1352–1363. [Google Scholar] [CrossRef]
  27. Yuan, C.; Ng, E. Building porosity for better urban ventilation in high-density cities—A computational parametric study. Build. Environ. 2012, 50, 176–189. [Google Scholar] [CrossRef]
  28. Juan, Y.-H.; Wen, C.-Y.; Li, Z.; Yang, A.-S. A combined framework of integrating optimized half-open spaces into buildings and an application to a realistic case study on urban ventilation and air pollutant dispersion. J. Build. Eng. 2021, 44, 102975. [Google Scholar] [CrossRef]
  29. Li, Z.; Zhang, H.; Juan, Y.-H.; Wen, C.-Y.; Yang, A.-S. Effects of building setback on thermal comfort and air quality in the street canyon. Build. Environ. 2022, 208, 108627. [Google Scholar] [CrossRef]
  30. Cui, D.J.; Li, X.D.; Liu, J.L.; Yuan, L.; Mak, C.M.; Fan, Y.; Kwok, K. Effects of building layouts and envelope features on wind flow and pollutant exposure in height-asymmetric street canyons. Build. Environ. 2021, 205, 108177. [Google Scholar] [CrossRef]
  31. Wen, C.Y.; Juan, Y.H.; Yang, A.S. Enhancement of city breathability with half open spaces in ideal urban street canyons. Build. Environ. 2017, 112, 322–336. [Google Scholar] [CrossRef]
  32. Adelia, A.S.; Yuan, C.; Liu, L.; Shan, R.Q. Effects of urban morphology on anthropogenic heat dispersion in tropical high-density residential areas. Energy Build. 2019, 186, 368–383. [Google Scholar] [CrossRef]
  33. Chen, G.; Rong, L.; Zhang, G. Impacts of urban geometry on outdoor ventilation within idealized building arrays under unsteady diurnal cycles in summer. Build. Environ. 2021, 206, 108344. [Google Scholar] [CrossRef]
  34. Tsang, C.W.; Kwok, K.C.S.; Hitchcock, P.A. Wind tunnel study of pedestrian level wind environment around tall buildings: Effects of building dimensions, separation and podium. Build. Environ. 2012, 49, 167–181. [Google Scholar] [CrossRef]
  35. Du, Y.X.; Mak, C.M.; Liu, J.L.; Xia, Q.; Niu, J.L.; Kwok, K.C.S. Effects of lift-up design on pedestrian level wind comfort in different building configurations under three wind directions. Build. Environ. 2017, 117, 84–99. [Google Scholar] [CrossRef]
  36. Mittal, H.; Sharma, A.; Gairola, A. Numerical simulation of pedestrian level wind conditions: Effect of building shape and orientation. Environ. Fluid Mech. 2020, 20, 663–688. [Google Scholar] [CrossRef]
  37. Lee, K.Y.; Mak, C.M. Effects of wind direction and building array arrangement on airflow and contaminant distributions in the central space of buildings. Build. Environ. 2021, 205, 108234. [Google Scholar] [CrossRef]
  38. Xuan, Y.; Yang, G.; Li, Q.; Mochida, A. Outdoor thermal environment for different urban forms under summer conditions. Build. Simul. 2016, 9, 281–296. [Google Scholar] [CrossRef]
  39. Zahid Iqbal, Q.M.; Chan, A.L.S. Pedestrian level wind environment assessment around group of high-rise cross-shaped buildings: Effect of building shape, separation and orientation. Build Env. 2016, 101, 45–63. [Google Scholar] [CrossRef]
  40. Li, Z.; Zhang, H.; Wen, C.-Y.; Yang, A.-S.; Juan, Y.-H. Effects of frontal area density on outdoor thermal comfort and air quality. Build. Environ. 2020, 180, 25–41. [Google Scholar] [CrossRef]
  41. Tsichritzis, L.; Nikolopoulou, M. The effect of building height and facade area ratio on pedestrian wind comfort of London. J. Wind Eng. Ind. Aerodyn. 2019, 191, 63–75. [Google Scholar] [CrossRef]
  42. An, K.; Wong, S.M.; Fung, J.C.H. Exploration of sustainable building morphologies for effective passive pollutant dispersion within compact urban environments. Build. Environ. 2019, 148, 508–523. [Google Scholar] [CrossRef]
  43. Mohammad Hadavi, H.P. Quantifying impacts of wind speed and urban neighborhood layout on the infiltration rate of residential buildings. Sustain. Cities Soc. 2020, 53, 21–38. [Google Scholar] [CrossRef]
  44. Hadavi, M.; Pasdarshahri, H. Investigating effects of urban configuration and density on urban climate and building systems energy consumption. J. Build. Eng. 2021, 44, 15–31. [Google Scholar] [CrossRef]
  45. Chen, G.; Rong, L.; Zhang, G. Unsteady-state CFD simulations on the impacts of urban geometry on outdoor thermal comfort within idealized building arrays. Sustain. Cities Soc. 2021, 74, 16–33. [Google Scholar] [CrossRef]
  46. Hu, T.; Yoshie, R. Indices to evaluate ventilation efficiency in newly-built urban area at pedestrian level. J. Wind Eng. Ind. Aerodyn. 2013, 112, 39–51. [Google Scholar] [CrossRef]
  47. Li, Q.; Meng, Q.; Zhao, L. Research on Wind Environment around Residential Buildings with Different Planning and Design Factors. In Proceedings of the 2nd International Conference on Frontiers of Manufacturing and Design Science (ICFMD 2011), Taichung, Taiwan, 11–13 December 2011; pp. 725–729. [Google Scholar]
  48. Peng, Y.L.; Gao, Z.; Buccolieri, R.; Ding, W.W. An Investigation of the Quantitative Correlation between Urban Morphology Parameters and Outdoor Ventilation Efficiency Indices. Atmosphere 2019, 10, 33. [Google Scholar] [CrossRef]
  49. Palusci, O.; Monti, P.; Cecere, C.; Montazeri, H.; Blocken, B. Impact of morphological parameters on urban ventilation in compact cities: The case of the Tuscolano-Don Bosco district in Rome. Sci. Total Environ. 2022, 807, 150490. [Google Scholar] [CrossRef]
  50. You, W.; Gao, Z.; Chen, Z.; Ding, W.W. Improving Residential Wind Environments by Understanding the Relationship between Building Arrangements and Outdoor Regional Ventilation. Atmosphere 2017, 8, 102. [Google Scholar] [CrossRef]
  51. Zhou, H.; Lu, Y.J.; Liu, X.D.; Chang, R.D.; Wang, B. Harvesting wind energy in low-rise residential buildings: Design and optimization of building forms. J. Clean. Prod. 2017, 167, 306–316. [Google Scholar] [CrossRef]
  52. Shui, T.T.; Liu, J.; Yuan, Q.; Qu, Y.; Jin, H.; Cao, J.L.; Liu, L.; Chen, X. Assessment of pedestrian-level wind conditions in severe cold regions of China. Build. Environ. 2018, 135, 53–67. [Google Scholar] [CrossRef]
  53. Hassan, A.M.; Elmokadem, A.A.; Megahed, N.A.; Eleinen, O.M.A. Urban morphology as a passive strategy in promoting outdoor air quality. J. Build. Eng. 2020, 29, 101204. [Google Scholar] [CrossRef]
  54. Ma, T.; Chen, T. Classification and pedestrian-level wind environment assessment among Tianjin’s residential area based on numerical simulation. Urban Clim. 2020, 34, 100702. [Google Scholar] [CrossRef]
  55. Wei, Y.; Jialei, S.; Wowo, D. Improving residential building arrangement design by assessing outdoor ventilation efficiency in different regional spaces. Archit. Sci. Rev. 2018, 61, 202–214. [Google Scholar] [CrossRef]
  56. Lin, M.; Hang, J.; Li, Y.G.; Luo, Z.W.; Sandberg, M. Quantitative ventilation assessments of idealized urban canopy layers with various urban layouts and the same building packing density. Build. Environ. 2014, 79, 152–167. [Google Scholar] [CrossRef]
  57. Abd Razak, A.; Hagishima, A.; Ikegaya, N.; Tanimoto, J. Analysis of airflow over building arrays for assessment of urban wind environment. Build. Environ. 2013, 59, 56–65. [Google Scholar] [CrossRef]
  58. da Silva, F.T.; Reis, N.C.; Santos, J.M.; Goulart, E.V.; Maciel, F.S.; Braganca, L.; de Alvarez, C.E. Atmospheric dispersion and urban planning: An interdisciplinary approach to city modeling. Sustain. Cities Soc. 2021, 70, 102882. [Google Scholar] [CrossRef]
  59. Li, R.; Zhang, Y.; Huang, C.; He, C. A field study on Ground Energy Balance calculation for typical communities in South China. In Proceedings of the 12th Nordic Symposium on Building Physics, NSB 2020, Tallinn, Estonia, 6–9 September 2020; pp. 1–8. [Google Scholar]
  60. Blocken, B. 50 years of Computational Wind Engineering: Past, present and future. J. Wind Eng. Ind. Aerodyn. 2014, 129, 69–102. [Google Scholar] [CrossRef]
  61. Blocken, B.; Stathopoulos, T.; van Beeck, J.P.A.J. Pedestrian-level wind conditions around buildings: Review of wind-tunnel and CFD techniques and their accuracy for wind comfort assessment. Build. Environ. 2016, 100, 50–81. [Google Scholar] [CrossRef]
  62. Ramponi, R.; Blocken, B.; de Coo, L.B.; Janssen, W.D. CFD simulation of outdoor ventilation of generic urban configurations with different urban densities and equal and unequal street widths. Build. Environ. 2015, 92, 152–166. [Google Scholar] [CrossRef]
  63. Britter, R.E.; Hanna, S.R. Flow and dispersion in urban areas. Annu. Rev. Fluid Mech. 2003, 35, 469–496. [Google Scholar] [CrossRef]
  64. Lucchi, E.; D’Alonzo, V.; Exner, D.; Zambelli, P.; Garegnani, G. A Density-Based Spatial Cluster Analysis Supporting the Building Stock Analysis in Historical Towns. In Proceedings of the 16th IBPSA Conference, Rome, Italy, 2–4 September 2019; pp. 3831–3838. [Google Scholar]
  65. G50180-2018; Standard for Urban Residential Area Planning and Design. China Architecture & Building Press: Beijing, China, 2018.
  66. Nonomura, Y.; Kobayashi, N.; Tominaga, Y.; Mochida, A. The cross comparison of CFD results for flowfield around building models (Part 3): The Wind Tunnnel Test for the Varification Models on the Flowfield around Building Blocks. JWE 2003, 95, 83–84. [Google Scholar]
  67. Franke, J.; Hellsten, A.; Schlünzen, H.; Carissimo, B. Best Practice Guideline for the CFD Simulation of Flows in the Urban Environment; University of Hamburg: Hamburg, Germany, 2007. [Google Scholar]
  68. Tominaga, Y.; Mochida, A.; Yoshie, R.; Kataoka, H.; Nozu, T.; Yoshikawa, M.; Shirasawa, T. AIJ guidelines for practical applications of CFD to pedestrian wind environment around buildings. J. Wind Eng. Ind. Aerodyn. 2008, 96, 1749–1761. [Google Scholar] [CrossRef]
  69. Blocken, B.; Stathopoulos, T.; Carmeliet, J. CFD simulation of the atmospheric boundary layer: Wall function problems. Atmos. Environ. 2007, 41, 238–252. [Google Scholar] [CrossRef]
  70. Ntinas, G.K.; Shen, X.; Wang, Y.; Zhang, G. Evaluation of CFD turbulence models for simulating external airflow around varied building roof with wind tunnel experiment. Build. Simul. 2017, 11, 115–123. [Google Scholar] [CrossRef]
  71. Blocken, B. LES over RANS in building simulation for outdoor and indoor applications: A foregone conclusion? Build. Simul. 2018, 11, 821–870. [Google Scholar] [CrossRef]
  72. Handbook, A.F. Airflow Around Buildings; ASHRAE: Peachtree Corners, Georgia, 2009. [Google Scholar]
  73. Ministry of Housing and Urban-Rural Development, China. Load Code for the Design of Building Structures (GB 50009-2012); China Architecture & Building Press: Beijing, China, 2012. (In Chinese) [Google Scholar]
  74. Chen, L.; Hang, J.; Sandberg, M.; Claesson, L.; Di Sabatino, S.; Wigo, H. The impacts of building height variations and building packing densities on flow adjustment and city breathability in idealized urban models. Build. Environ. 2017, 118, 344–361. [Google Scholar] [CrossRef]
  75. Stathopoulos, T.; Wu, H. Generic models for pedestrian-level winds in built-up regions. J. Wind Eng. Ind. Aerodyn. 1995, 54, 515–525. [Google Scholar] [CrossRef]
  76. Carpentieri, M.; Robins, A.G. Influence of urban morphology on air flow over building arrays. J. Wind Eng. Ind. Aerodyn. 2015, 145, 61–74. [Google Scholar] [CrossRef]
  77. Du, Y.X.; Mak, C.M.; Tang, B.S. Effects of building height and porosity on pedestrian level wind comfort in a high-density urban built environment. Build. Simul. 2018, 11, 1215–1228. [Google Scholar] [CrossRef]
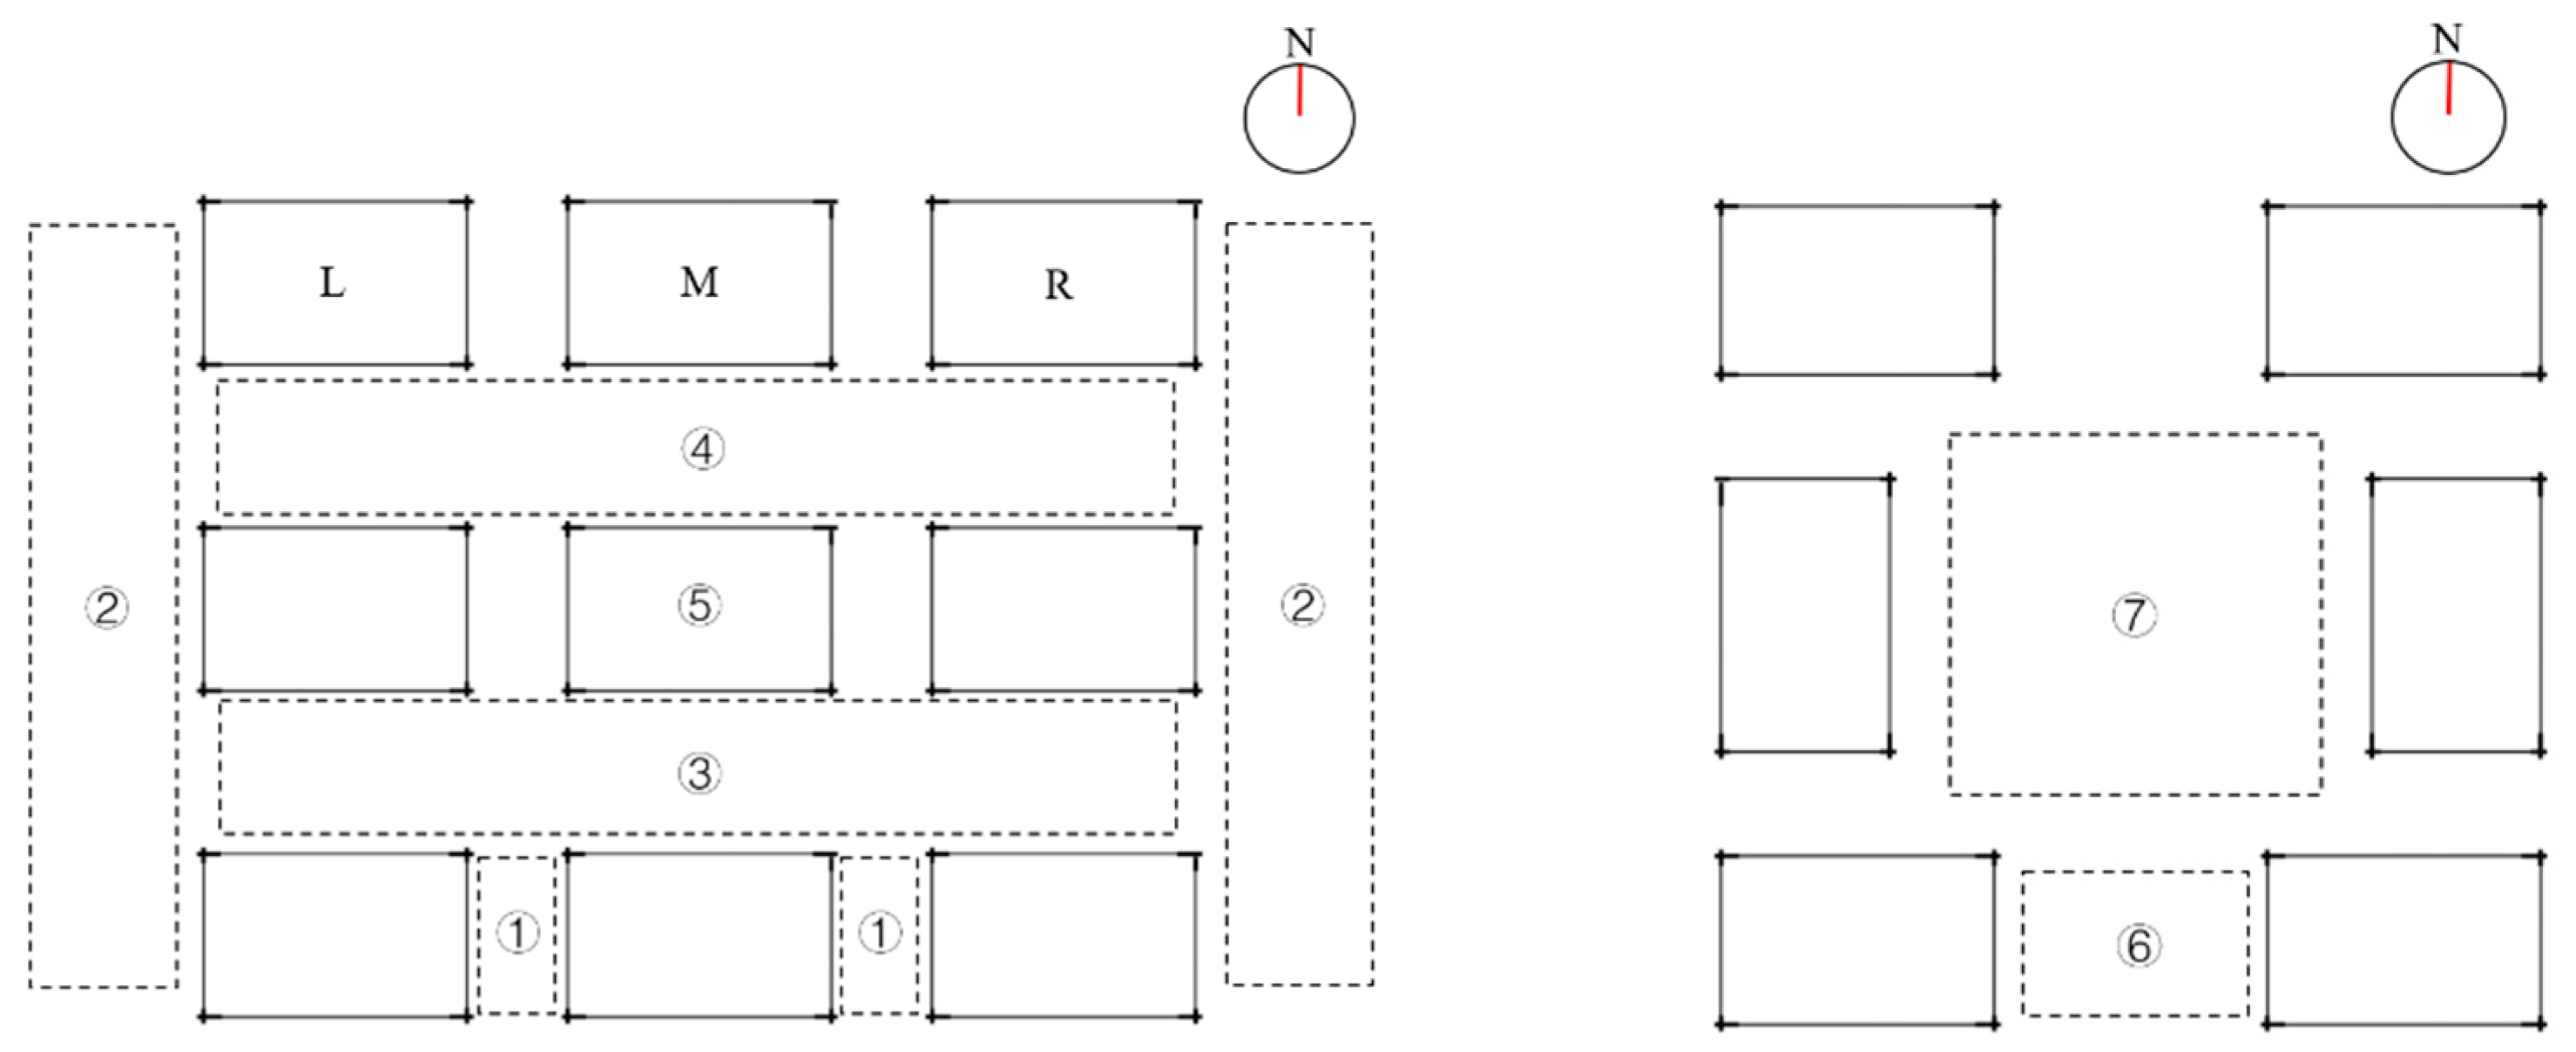
Figure 1. Different zones in aligned and enclosed layouts.
Sustainability 15 06742 g001
Figure 2. Velocity points chosen in the layout.
Sustainability 15 06742 g002
Figure 3. Building layout.
Sustainability 15 06742 g003
Figure 4. Velocity-measured points.
Sustainability 15 06742 g004
Figure 5. Computational domain.
Sustainability 15 06742 g005
Figure 6. Computational grid.
Sustainability 15 06742 g006
Figure 7. Inflow velocity.
Sustainability 15 06742 g007
Figure 8. Inflow turbulence energy dissipation rate.
Sustainability 15 06742 g008
Figure 9. Comparison of wind speed ratios: (a) coarse and basic grids and (b) fine and basic grids.
Sustainability 15 06742 g009
Figure 10. Comparison of wind speed ratios for different turbulence models.
Sustainability 15 06742 g010
Figure 11. Wind speed ratios for different turbulence models at different sites.
Sustainability 15 06742 g011
Figure 12. Comparison of wind speeds for different grids: (a) aligned layout (AM-1) and (b) enclosed layout (EM-1).
Sustainability 15 06742 g012
Figure 13. Velocity in the aligned layout of different building lengths.
Sustainability 15 06742 g013aSustainability 15 06742 g013b
Figure 14. Velocity in the enclosed layout of different building lengths.
Sustainability 15 06742 g014aSustainability 15 06742 g014b
Figure 15. Velocity in the aligned layout of different building heights.
Sustainability 15 06742 g015
Figure 16. Velocity in the enclosed layout of different building heights.
Sustainability 15 06742 g016
Figure 17. Velocity in the non-uniform height layout.
Sustainability 15 06742 g017
Figure 18. Velocity in the aligned layout of different building distances.
Sustainability 15 06742 g018aSustainability 15 06742 g018b
Figure 19. Velocity in the enclosed layout of different building distances.
Sustainability 15 06742 g019aSustainability 15 06742 g019b
Figure 20. Velocity in the staggered layout.
Sustainability 15 06742 g020aSustainability 15 06742 g020b
Figure 21. Velocity in the enclosed and semi-enclosed layouts.
Sustainability 15 06742 g021aSustainability 15 06742 g021b
Table 1. Original building array.
Sustainability 15 06742 i001Building form: 58 × 16 × 24 (36) m (L × D × H)
Building distance: W1 a: 56 (70) m mid-rise (high-rise)
W2 b: 13 m
Sustainability 15 06742 i002Building form: 68 × 22 × 24 (36) m (L × D × H)
Building distance: W3 c: 156 m
W4 d: 156 m
a Normal distance; b lateral distance; c building distance in the north–south direction; d building distance in the west–east direction.
Table 2. Simulation cases.
ContentCaseLHW1W2W3W4Remarks
Building lengthAM-158245613//
AM-335
AH-158367013
AH-235
EH-16836//156156Buildings connected at adjacent boundary
EH-2
EH-398, 40
EH-468, 40, 40
Building heightAM-435247013//Height variation
AH-236
AM-258247013
AH-1 36
AM-524, 27
AM-624, 27, 30
EM-16824//156156
EH-136
EM-56824
EH-636
Building distanceAM-158245613//
AM-270
AM-335245613
AM-470
AM-335245613
AM-723
AH-235367013
AH-323
EM-16824//156156
EM-2128
EM-5156
EM-6128
EM-2156156
EM-3128
Staggered layoutAH-1 //Staggered layout
SH-1
SH-2
AH-2
Enclosed layout and semi-enclosed a layoutEH-1 // Semi-enclosed: opening to the south
EH-5
EH-6opening to the east
EM-1 // Semi-enclosed: opening to the south
EM-4
EM-5opening to the east
a There are no buildings in one direction.
Table 3. MVs for different building lengths.
Longer BuildingShorter BuildingEqual LengthLonger + Shorter BuildingShorter Building
AM-1: 0.80AM-3: 0.69EH-1: 0.88EH-3: 1.02
AH-1: 0.84AH-2: 0.71 EH-4:0.81
Table 4. MVs for different building heights.
Higher BuildingShorter BuildingUniform HeightUnuniform Height
AH-1: 0.84AM-2: 0.77AM-2: 0.77AM-6: 0.80
AH-2: 0.71AM-4: 0.55 AM-7: 0.92
EH-1: 0.88EM-1: 0.77
EH-6: 0.70EM-5: 0.37
Table 5. MVs for different building distances.
Larger Normal DistanceSmaller Normal DistanceLarger Lateral
Distance
Smaller Lateral Distance
AM-2: 0.77AM-1: 0.80AM-7: 0.55AM-3: 0.69
AM-4: 0.55AM-3: 0.69AH-3: 0.63AH-2: 0.71
EM-1: 0.77EM-2: 0.80EM-1: 0.77EM-3: 0.44
Table 6. MVs for aligned and staggered layouts.
Aligned LayoutStaggered LayoutAligned LayoutStaggered Layout
AH-1: 0.84SH-1: 0.77AH-2: 0.71SH-2: 0.63
Table 7. MVs for enclosed and semi-enclosed layouts.
Enclosed LayoutSemi-Enclosed Layout
EH-1: 0.88EH-6: 0.42
EM-1: 0.77EM-5: 0.37
Disclaimer/Publisher’s Note: The statements, opinions and data contained in all publications are solely those of the individual author(s) and contributor(s) and not of MDPI and/or the editor(s). MDPI and/or the editor(s) disclaim responsibility for any injury to people or property resulting from any ideas, methods, instructions or products referred to in the content.