Article

Spatial and Temporal Patterns of Hydropower Development on the Qinghai–Tibet Plateau

1
Institute of Mountain Hazards and Environment, Chinese Academy of Sciences, Chengdu 610041, China
2
University of Chinese Academy of Sciences, Beijing 100049, China
3
Tibet Autonomous Region Meteorological Bureau, Lhasa 850000, China
*
Author to whom correspondence should be addressed.
Sustainability 2023, 15(8), 6688; https://doi.org/10.3390/su15086688
Submission received: 8 March 2023 / Revised: 6 April 2023 / Accepted: 13 April 2023 / Published: 14 April 2023

Abstract

:
The Qinghai–Tibet Plateau is rich in hydropower resources for China, and the development of these has an important impact on the sustainable development of the plateau. However, the research on the pattern and processes of hydropower development on the plateau is still lacking. Using both field investigation and collected data, we evaluated the density and intensity of hydropower development on the Tibetan Plateau over the past 40 years. The spatial and temporal patterns of hydropower development were analyzed by applying exploratory spatial data analysis methods to study the spatial aggregation of hydropower development on the Qinghai–Tibet Plateau since 1980. The results show that: (1) Hydropower development on the Qinghai–Tibet Plateau can be divided into four stages—(i) pre-1980, at the beginning of development, with a small number of power stations and a small installed capacity; (ii) the period from 1980 to 2005, which was dominated by small hydropower developments, and the number of hydropower stations increased seven-fold; (iii) the 2005–2014 period, which saw large-scale cascade development; and (iv) post-2014, when hydropower development mode changed from quantity-led to scale-led. (2) Significant differences in hydropower development areas on the Qinghai–Tibet Plateau regarding the density and intensity of development from east to west are constantly decreasing. (3) The increase in hydropower development density in the past 40 years is mainly due to the increasing aggregation effect of hydropower development absorption in the eastern region (the aggregation effect of western counties has not been shown). (4) While low hydropower development intensity is found in most areas of the Qinghai–Tibet Plateau, attention must be given to river protection problems in the eastern high-intensity areas; failure to do so will increase the aggregation effect of hydropower development aggregation and, ultimately, affect the sustainable development of the regional development of the Qinghai–Tibet Plateau.

1. Introduction

The Qinghai–Tibet Plateau is not only rich in water resources but also highly rich in hydropower resources. The most typical region is Tibet, which has huge potential for hydropower development. The theoretical reserves of hydropower resources reach 210 million kW and the exploitable technology is 140 million kW, accounting for 29% and 24.5%, respectively, of the national totals and ranking first among the regions of China [1]. Hydropower development on the Qinghai–Tibet Plateau is mainly concentrated in the upper reaches of the Yellow River and the Hengduan Mountains. Thirty-two hydropower stations have been built or are under construction on the main stream of the Yellow River, with an annual generating capacity of 104.6 billion KWh [2], while 23 cascade power stations are planned on the main stream of the Lancang River, with a total installed capacity of approximately 32,000 MW and an annual generating capacity of approximately 150 billion KWh [3] The Qinghai–Tibet Plateau accounts for approximately 62% of China’s annual hydropower generation, so hydropower development is crucial to the country’s energy security. However, the Qinghai–Tibet Plateau is also a sensitive area for global change, with the ecological environment extremely fragile [4] and vulnerable to high-intensity hydropower development. The establishment of an environmentally friendly hydropower development mode is, therefore, of great significance for the ecological protection and high-quality exploitation of the Qinghai–Tibet Plateau [5].
At present, the research on hydropower development on the Qinghai–Tibet Plateau has mainly focused on the key development evaluation of rivers or regions [6] and qualitatively describes and quantitatively evaluates the impacts of the river hydrological situation, biodiversity, river ecosystem and secondary disasters brought about by the construction of hydropower stations [7,8,9,10,11,12,13,14]. For riparian, the construction and operation of dams will change the structure and function of river banks by regulating the microclimate [15], and dams contribute much more to this impact than to the meteorological variables [16]. They also lead to the inundation and loss of terrestrial habitat, thereby reducing biodiversity [17]. For the river itself, the constructions and operations of hydropower stations have changed the natural flow of river [18] and directly caused changes in river course morphology and sediment hydrological conditions [19]. Therefore, many scholars have evaluated the sustainability of hydropower development on the Qinghai–Tibet Plateau and the ecological vulnerability caused by it, for example, the emergy analysis method is adopted based on indices such as the emergy yield ratio, environmental loading ratio and ecosystem index for sustainability to calculate the beneficial contribution of the dam to the regional social system and environmental pressure, as well as sustainability of the river ecosystem. [20,21,22], or to analyze the comprehensive impact of hydropower development, and it was proposed to strengthen the preliminary research and environmental aspects of hydropower development [9]. Some scholars have studied the hydropower development modes and took the Jinsha River as an example to summarize that hydropower could reduce development costs, build water conservancy, support social forces, encourage private investment and promote the rapid and benign evolution of hydropower [23].
While these studies promote the understanding of certain phases of hydropower development on the Qinghai–Tibet Plateau, they do not fully reflect the processes and regional differences of the overall situation. This study analyzes these processes to evaluate the density and intensity of hydropower development on the Qinghai–Tibet Plateau and clarifies the spatial and temporal patterns of hydropower development. This research, thus, has certain reference value for the ecological protection of the sustainable development of the plateau.

2. Materials and Methods

2.1. Study Area

The Qinghai–Tibet Plateau is located in the southwest of China, including Qinghai and Tibet Provinces, Sichuan Ganzi and Aba, four Tibetan autonomous prefectures in Yunnan and Gannan in Gansu. The land area is 225,104 km2, accounting for 23.4% of the national total area [24] (Figure 1). With an average altitude above 4000 m, it is the highest plateau in the world and is known as the “third pole” of the earth. As for the climate characteristics, the annual precipitation is 415.3 mm, the average annual temperature is 4.85 °C, and the annual sunshine hours range from 2500 to 3200 h, leading to strong solar radiation and sufficient heat and light. [25]. The plateau is the birthplace of many Asian rivers, including the Yangtze and Yellow Rivers. It has steep terrain and a relative height difference of 4000 m [26], with the huge drop producing rich water energy.
According to the national administrative divisions in 2018, the study area (Figure 1) has a total of 251 district- and county-level administrative units. The hydropower development assessment is based on the 251 districts and counties included in the Qinghai–Tibet Plateau.

2.2. Evaluation Indicators

We selected five time periods for evaluation: the 1980s, 1990s, 2000s, early 2010 and 2018. This study refers to the existing hydropower development evaluation method [23,27,28] and uses two indices of hydropower development density and hydropower development intensity. The calculation method is as follows:
(1)
Hydropower development density:
D = a L
D is the density of hydropower development, a is the total number of hydropower stations on a river in a county, and L is the length of the river in the county in km. The data were obtained from the national 1:250,000 tertiary water basin data set by county statistics.
(2)
Strength of hydropower development:
I = i = 1 n c i A
I is the development strength of hydropower in the county in MW/km2, c i is the installed capacity of the number-i th hydropower station in the county in kW, and A is the county area in km2.

2.3. Evaluation Index Classification

According to the relevant research, we divided the hydropower development intensity and hydropower development density into five grades. For example, in Table 1, Dadu River Basin is one of the areas with a relatively concentrated hydropower cascade development, ranking the fourth in China in terms of development density, for which there are many related studies [27,29,30]. To facilitate the analysis and comparison, the values of development density and development intensity of the Sichuan section of the Dadu River were calculated using the same evaluation method given in Table 1 as a reference [27]. In Table 1, “Grade I.”, “Grade II.”, “Grade III.”, “Grade IV.” and “Grade V.” refer to the levels of hydropower development density and hydropower development intensity in various districts and counties of the Qinghai–Tibet Plateau, and the value range represents the hydropower development density value and hydropower development intensity value.

2.4. Exploratory Spatial Data Analysis

Exploratory spatial data analysis (ESDA) refers to the research method whereby initial data do not take any prior theory or hypothesis but the spatial correlation measure is the core; thus, general statistical methods effect data visualization via the characteristics of spatial data connections, clustering and other heterogeneity correlation analyses [31,32]. ESDA can reflect the correlation degree of a certain geographical phenomenon or a certain attribute with the same phenomenon or attribute on the adjacent region unit, and can provide a measure of the degree of aggregation in a certain spatial region. It generally includes two aspects: one is global spatial autocorrelation, which reflects the spatial correlation of the observed value from the whole [33]; the other is local spatial autocorrelation, which is used to analyze spatial heterogeneity manifested by spatial data in local subregions.
Using spatial autocorrelation (Moran’s I) and cluster and outlier analysis (Anselin Local Moran’s I) tools in ArcGIS, we analyzed and calculated the hydropower development density and intensity index of 251 district and county administrative units on the Qinghai–Tibet Plateau. This provided a visual presentation of the results of the aggregated state distribution of the data through ArcGIS, enabling effective judgement of spatial correlation in the hydropower development pattern among the district and county administrative units.

2.4.1. Global Spatial Autocorrelation

The global Moran index (Global Moran’s I) statistic can be used to detect the spatial correlation and independence of variable values between adjacent regions in the overall region and is a commonly used metric of global spatial autocorrelation [34]. Its expression is:
I = i = 1 n j 1 n w i j x i x ¯ x j x ¯ S 2 i = 1 n j = 1 n w i j
where S 2 = 1 n i = 1 n x i x ¯ 2 , x ¯ = 1 n i = 1 n x i , n indicates the number of district and county administrative units, x i ( x j ) is the hydropower development intensity or hydropower development density index of district county i or j, and w i j represents the spatial weight matrix, which is the most basic and important part of data spatial analysis. It is mainly the expression of the spatial geographical dependence between subjects and other regions. The geospatial structure is expressed in mathematical form, with a variety of rules, and the appropriate spatial weight matrix can be constructed according to the actual requirements [35].
For the w i j of proximity rule: when districts i and j are adjacent, then w i j = 1; when districts i and j are not adjacent, w i j = 0.
Global Moran’s I has values between −1 and 1. When Moran’s I  =  0, the variable values are spatially independent. There is no spatial autocorrelation, hence, variable values are randomly arranged in space, in discrete and distributed states. When Moran’s I  >  0, it represents a positive spatial autocorrelation of variable values in space; that is, the adjacent regions of those indicating high variable values also have higher variable values, or regions with low variable values are adjacent to regions with low variable values. The closer the value is to 1, the stronger the positive spatial autocorrelation. When Moran’s I  <  0, it suggests that there is a negative spatial autocorrelation of the variable values in space and presents a spatial dispersion pattern; that is, the regions with low variable values are adjacent to the regions with high variable values, or regions with higher variable values are adjacent to regions with lower variable values. The closer the value is to −1, the stronger the negative spatial autocorrelation [36]. In addition, a significance test is required, with the standardized Z statistic [37] and the expression:
Z = 1 E I S D I
where E I is the theoretical mean, and S D I is the theoretical standard variance.

2.4.2. Local Spatial Autocorrelation

Global Moran’s I is a general measure index. Although it can illustrate the average degree of spatial difference between all regions and surrounding areas and can reveal the overall dependence of attributes, it, however, ignores the potential local imbalance. Therefore, the local Moran’s Ii (LISA index) statistics are introduced to consider local spatial autocorrelation. We mainly map local indicators of spatial association (LISA) to explore the correlation and degree of variable values between a certain region and other surrounding regions in the whole region [38].
The formula for the local Moran’s Ii is:
I = x i x ¯ S 2 j = 1 n w i j x j x ¯ , i j
The range of local Moran’s Ii value is not limited between −1 and 1. Under a certain significance level, when local Moran’s Ii value  >  0, it indicates that the variable value of county i and surrounding adjacent counties is high–high (HH) or low–low (LL), The high–high (HH) clustering state refers to the gathering of high-density development areas around the high hydropower development density area or the spatial agglomeration of the high-intensity development area and another high-intensity hydropower development area, and the low–low (LL) clustering refers to the low hydropower development density area surrounded by a group of low-density development zones, or the low-intensity development area and another low-intensity hydropower development area are spatially clustered. When local Moran’s Ii value is  <  0, it indicates that the variable value of county i and the variable value of surrounding adjacent districts are high, showing high and low (HL) aggregation. High–low (HL) agglomeration refers to a high hydropower development density (or high-intensity hydropower development) area and county with low hydropower development density, or the variable value of county i is low compared with the variable value of surrounding adjacent counties, showing low and high (LH) aggregation [36]. Low–high (LH) agglomeration refers to a low hydropower development density (or low-intensity hydropower development) area around which high hydropower development density (or high-intensity hydropower development) districts and counties are distributed. The results were finally visualized with the LISA cluster plots.

2.5. Data

With the support of the second comprehensive scientific investigation project on the Qinghai–Tibet Plateau, China has conducted several field investigations to collect the relevant data from hydropower stations, including dam height, installed capacity, production time and so on. These data were supplemented by information from relevant sources about hydropower development, including the China Hydropower Yearbook [39], the Law of the People’s Republic of China (Basin) Water Resources review results (2003) [40], the Law of the People’s Republic of China (Province) Hydropower Resources review results (2003) [41], plateau basin planning for the Qinghai–Tibet plateau involving the provinces and cities and statistical bulletins [42,43], as well as reports on “the Yangtze river economic belt small hydropower rectification” and “rural hydropower responsibility double subject.”. etc. [44].

3. Results and Analysis

3.1. Hydropower Development Process

3.1.1. Number of Hydropower Stations

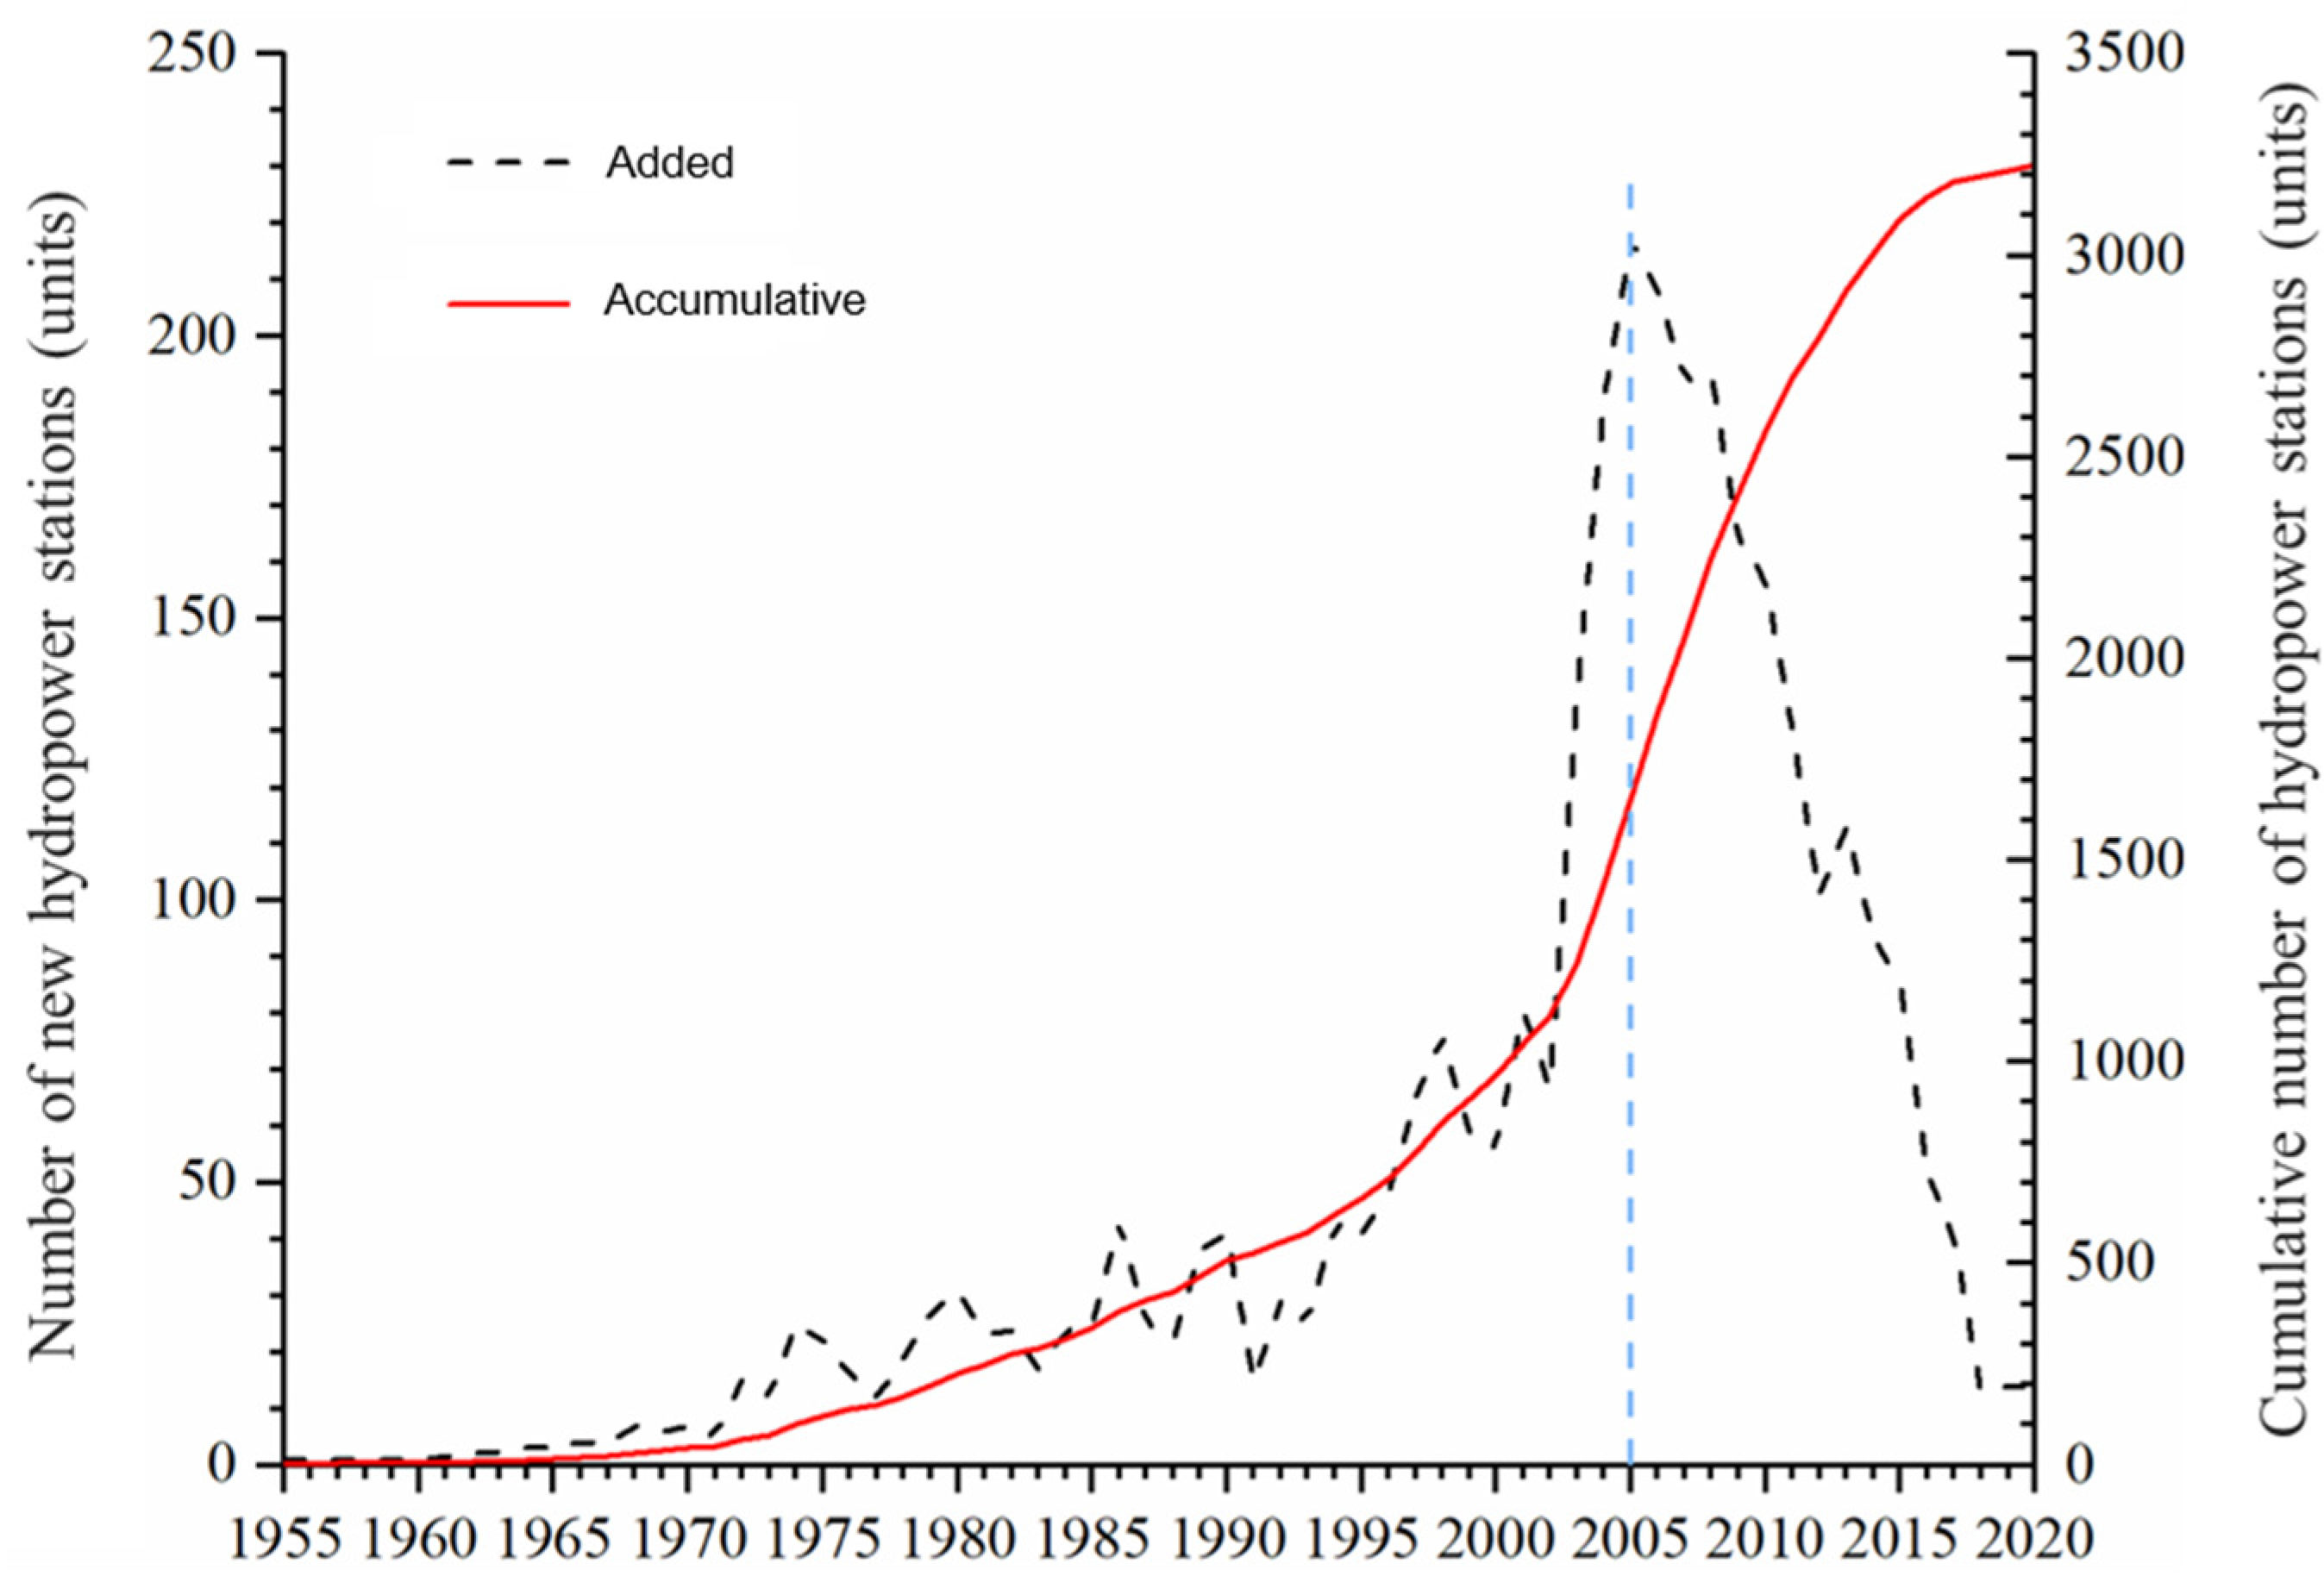
The history of hydropower development in the Qinghai–Tibet Plateau, as shown in Figure 2, can be traced via the number of hydropower stations. The figure shows that the number of hydropower stations in 1970 increased steadily until 2000, when 218 hydropower stations were put into operation; then, from 2000 to 2010, a total of 1672 hydropower stations were recorded. After 2005, the number of new hydropower stations built each year decreased significantly.

3.1.2. Installed Hydropower Capacity

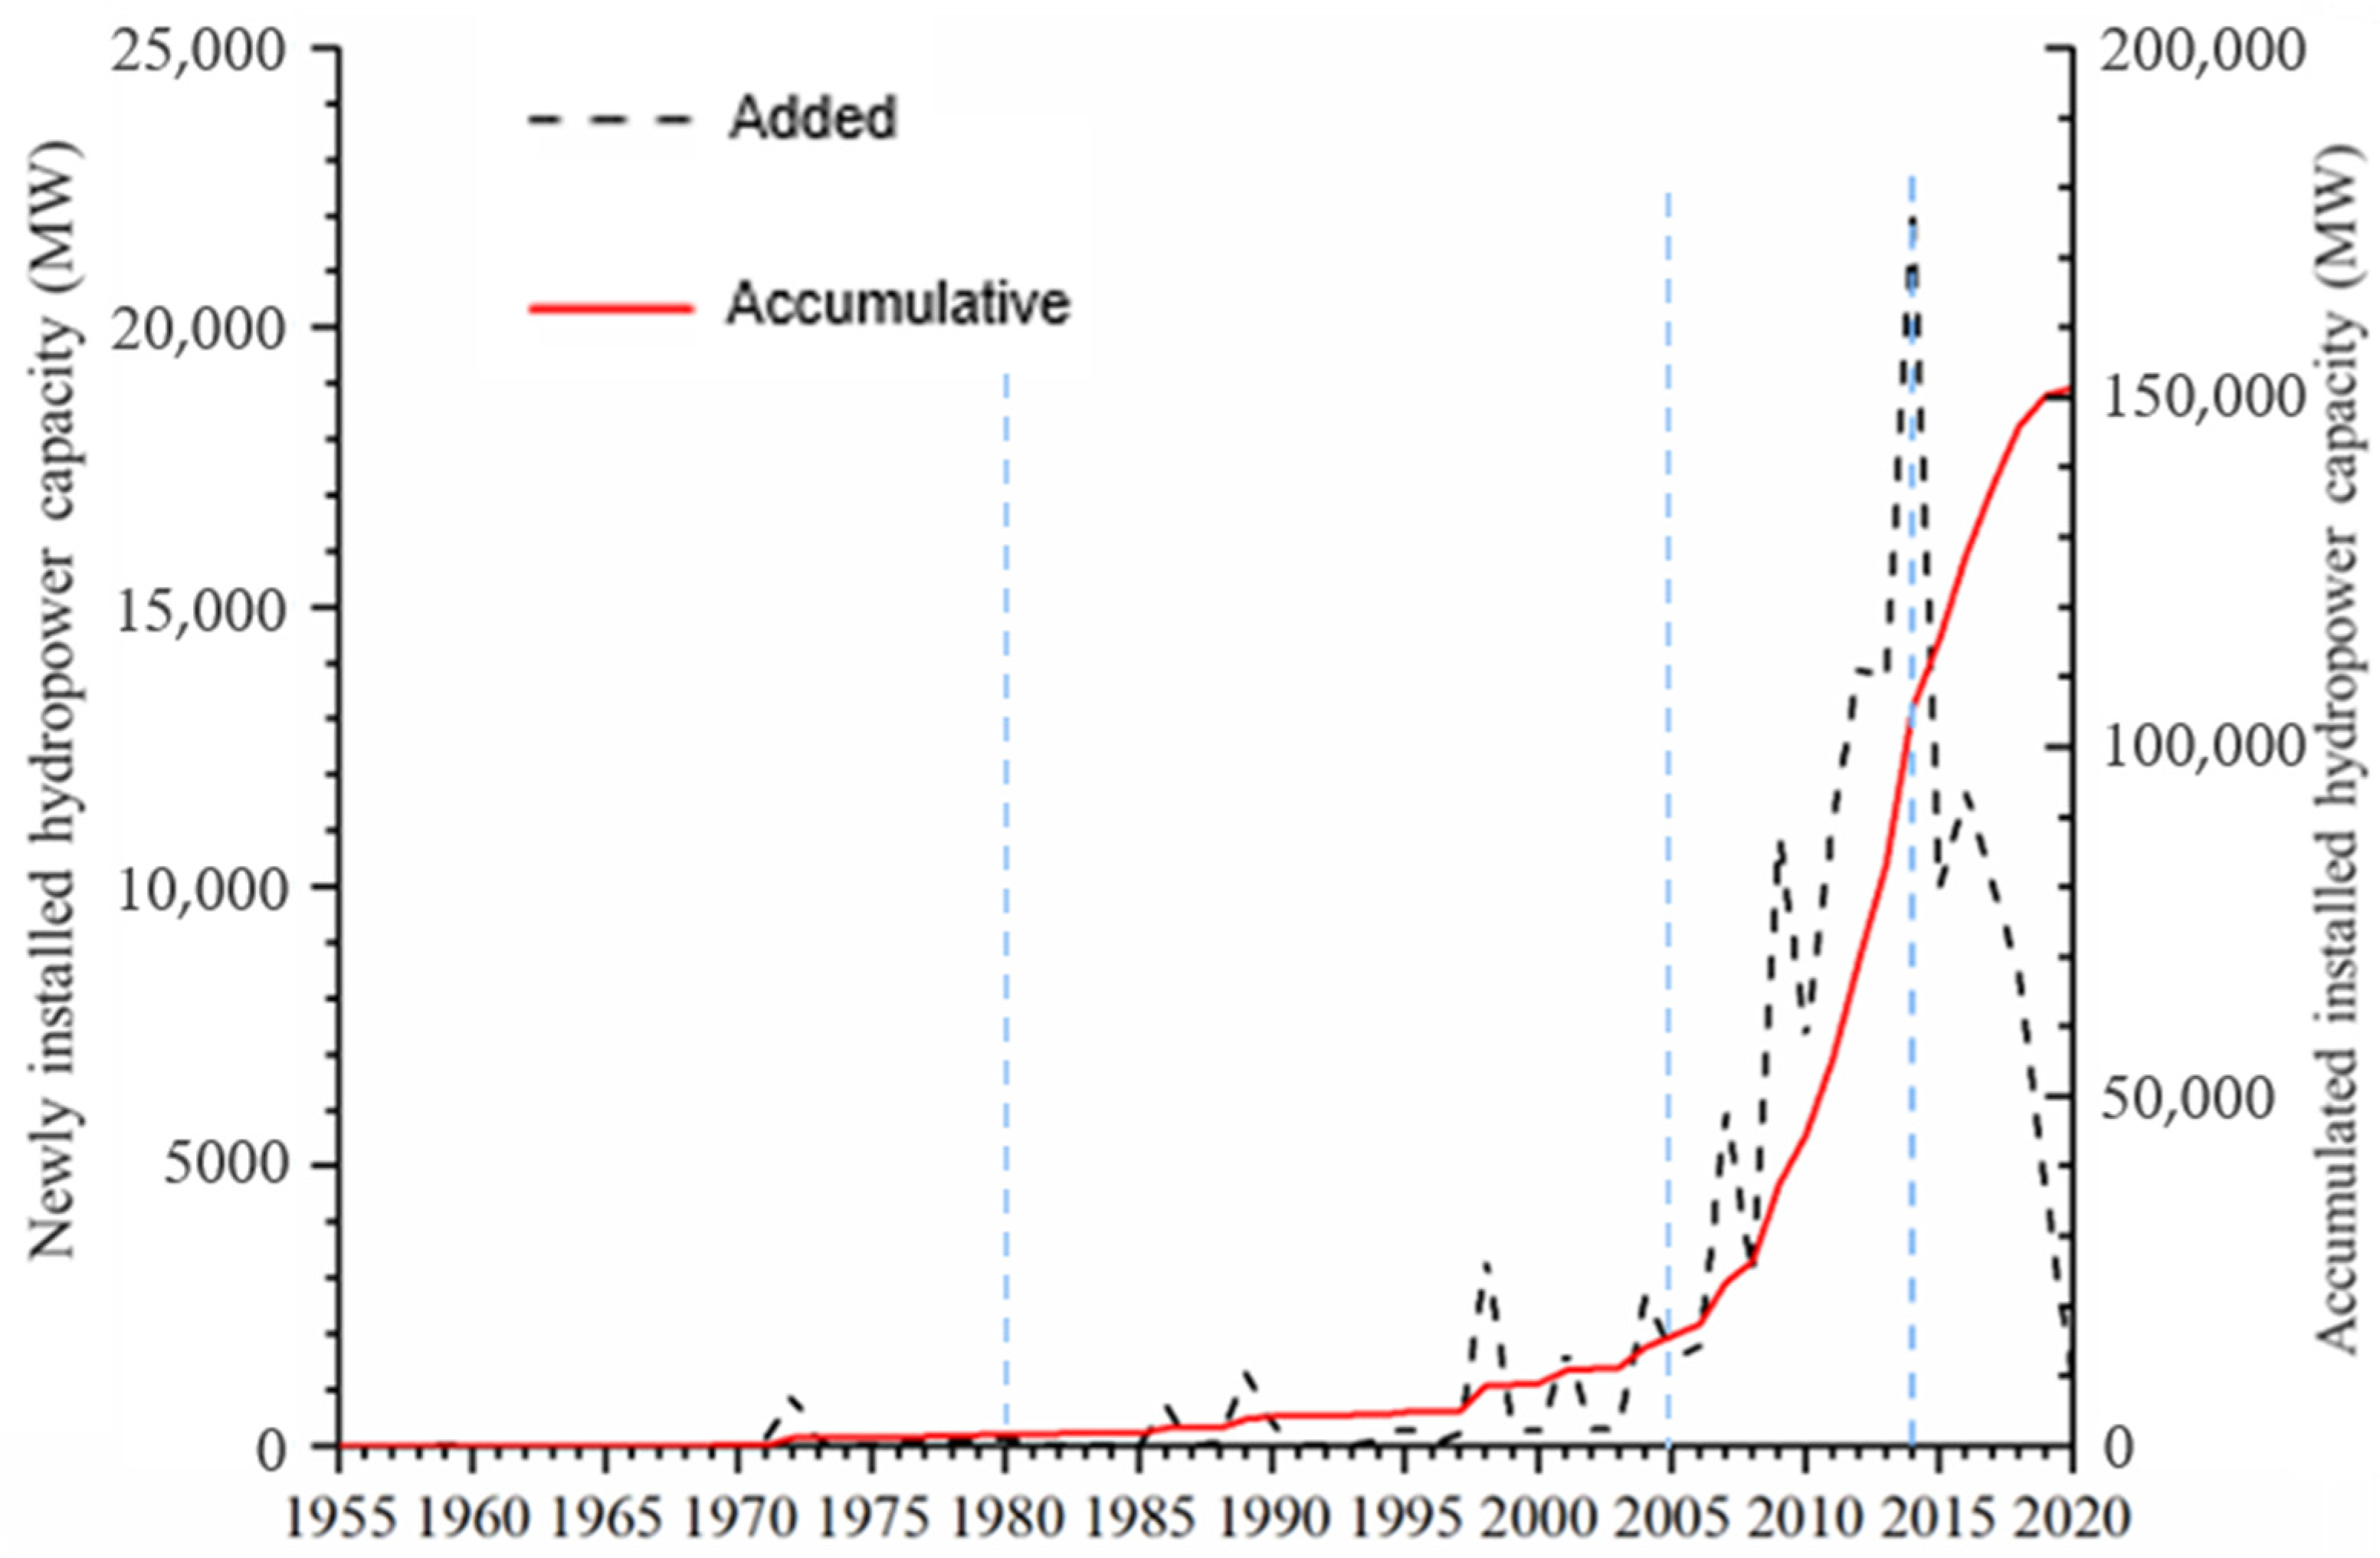
The cumulative installed hydropower capacity increased gradually from around 1980 (Figure 3). This slow growth changed after 2005, and the cumulative installed capacity of hydropower stations increased exponentially between 2005 and 2014, with the total reaching at least 84,564.9 MW. The new installed capacity has seen multiple peaks at different times, in 1972, 1986, 1989, 2004, 2007, 2009, 2012, 2014 and 2016. These represent large- and medium-sized hydropower stations in the Qinghai–Tibet Plateau in these years—for example, the Gongzui hydropower station (700 MW, 1972); Yuzixi Grade I hydropower station (160 MW, 1972); the Pugou, Laxiwa, Xiaowan, Shawan and other hydropower stations in 2009. In 2013, the first unit of Longkaikou hydropower station, Ahai hydropower station, Ludila hydropower station and Jinping I hydropower station generated electricity, and in 2016, the first unit of the 3000 MW Guanyinyan hydropower station in Huaping County generated electricity. The annual installation of hydropower capacity reached the maximum in 2014 when 97 hydropower plants with a combined capacity of 17,735 MW were installed. The annual installed capacity declined significantly after 2014.

3.1.3. Hydropower Development Stage

The four stages of hydropower development can be identified according to the ratio of newly installed hydropower capacity to the number of newly installed hydropower stations. As shown in Figure 4, the first stage was before 1980, when the number of new power stations was fewer. This stage includes the important year of 1972—although the number of hydropower station that year was not many (15 hydropower stations), the total installed capacity reached 924.5 MW, with Gong Mouth hydropower station (700 MW, Yi autonomous county) and Yuzixi Level hydropower station (160 MW, Wenchuan county) successively put into production. The second stage was from 1980 to 2005: the ratio of installed capacity remained the same—the 2005 ratio was only 1.3 times that of 1980—but the number of new hydropower stations increased from 31 hydropower stations to 217 hydropower stations, with a large number of hydropower stations put into production during this period, resulting in a total of 1461 hydropower stations with a total installed capacity of at least 204,768.9 MW. The third stage was from 2005 to 2014, when the ratio of newly installed hydropower capacity to the number of new hydropower stations increased substantially, indicating that large-scale cascade development began in this year. In the fourth stage, after 2014, the ratio of newly installed hydropower capacity to the number of new hydropower stations is still rising, exceeding the number of new hydropower stations, indicating that more and more large-scale hydropower stations are being put into operation.

3.2. Density and Intensity of Hydropower Development

3.2.1. Hydropower Development Density

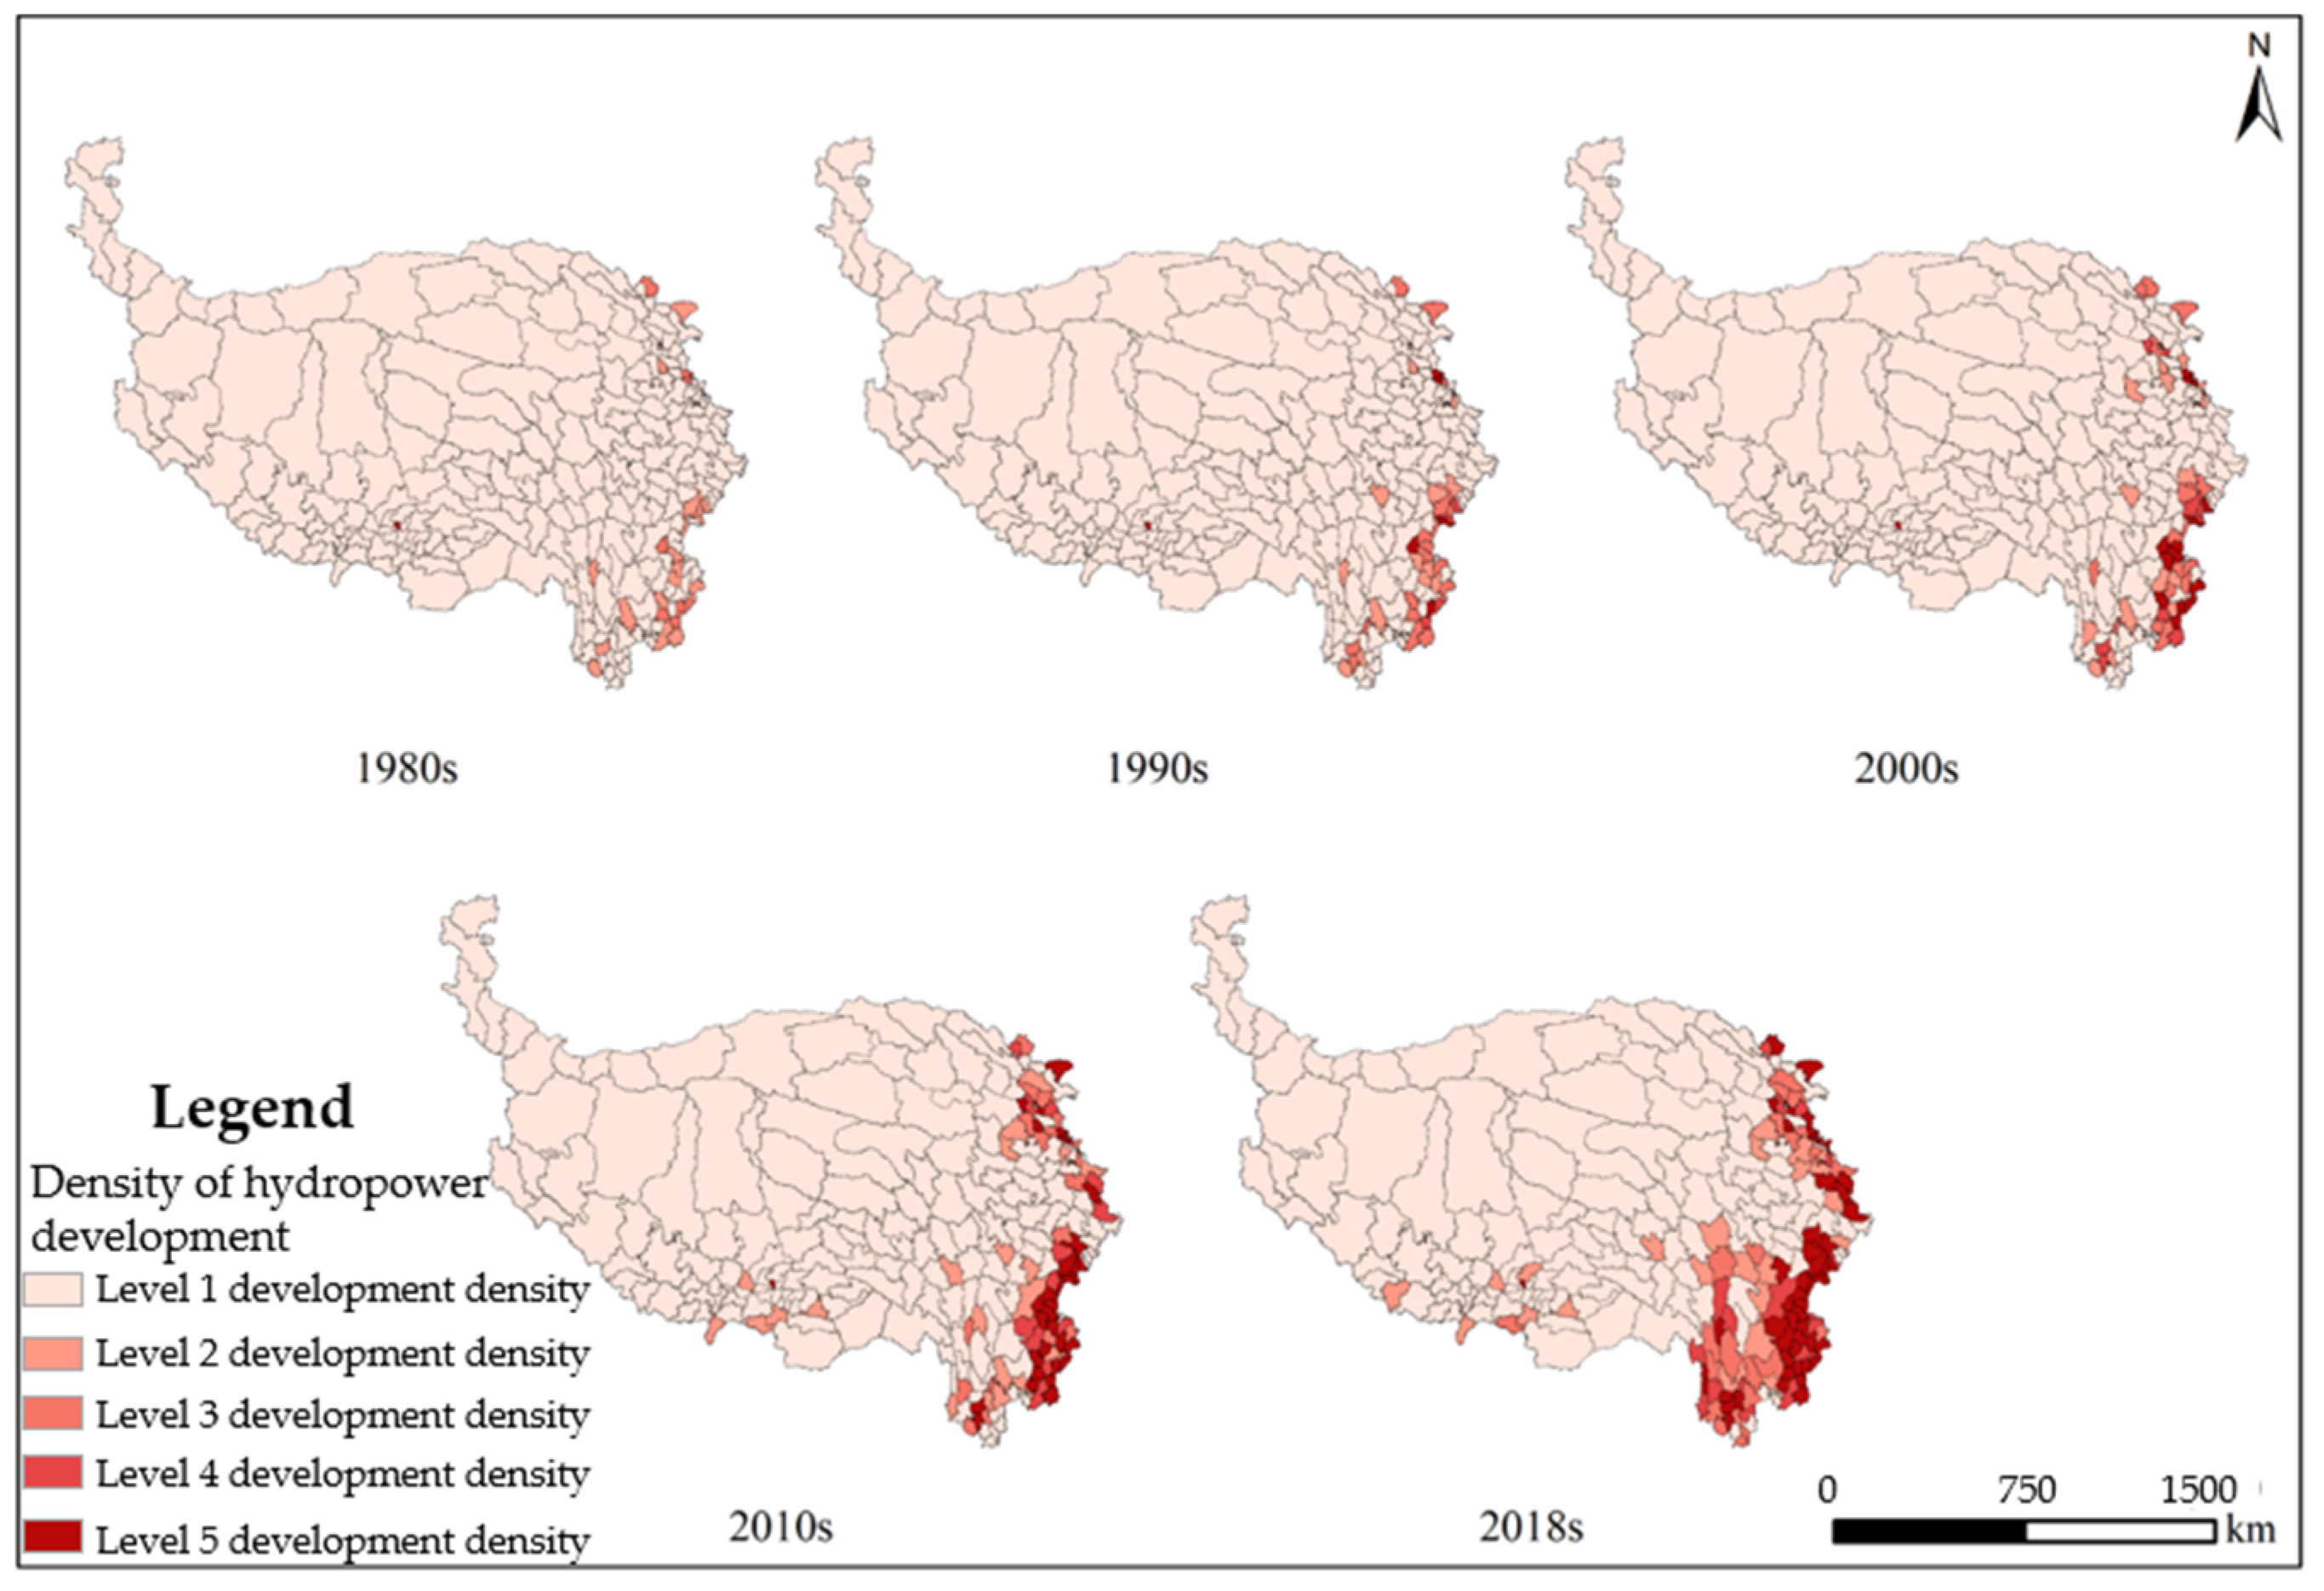
As shown in Figure 5, the density of hydropower development on the Qinghai–Tibet Plateau reflects well the scope of hydropower development, covering almost the whole Qinghai–Tibet Plateau area and ranging from sporadic distribution to concentrated areas with rich hydropower resources. The average density of hydropower development in the five ages shown was 0.001, 0.002, 0.0.004, 0.008 and 0.013, and the average density increased by 13.1 times; the standard deviation was 0.006, 0.007, 0.0.017, 0.023 and 0.030, which indicates the increasing difference in density values in different districts and counties. The density of hydropower development has increased significantly since 2000, with a trend of continuing development in the Tibetan Plateau areas. In particular, the density of hydropower development in some districts and counties in Sichuan and Yunnan is continually increasing. The districts and counties with high hydropower development density are mainly distributed in the areas with concentrated population and on the eastern edge of the Qinghai–Tibet Plateau.

3.2.2. Strength of Hydropower Development

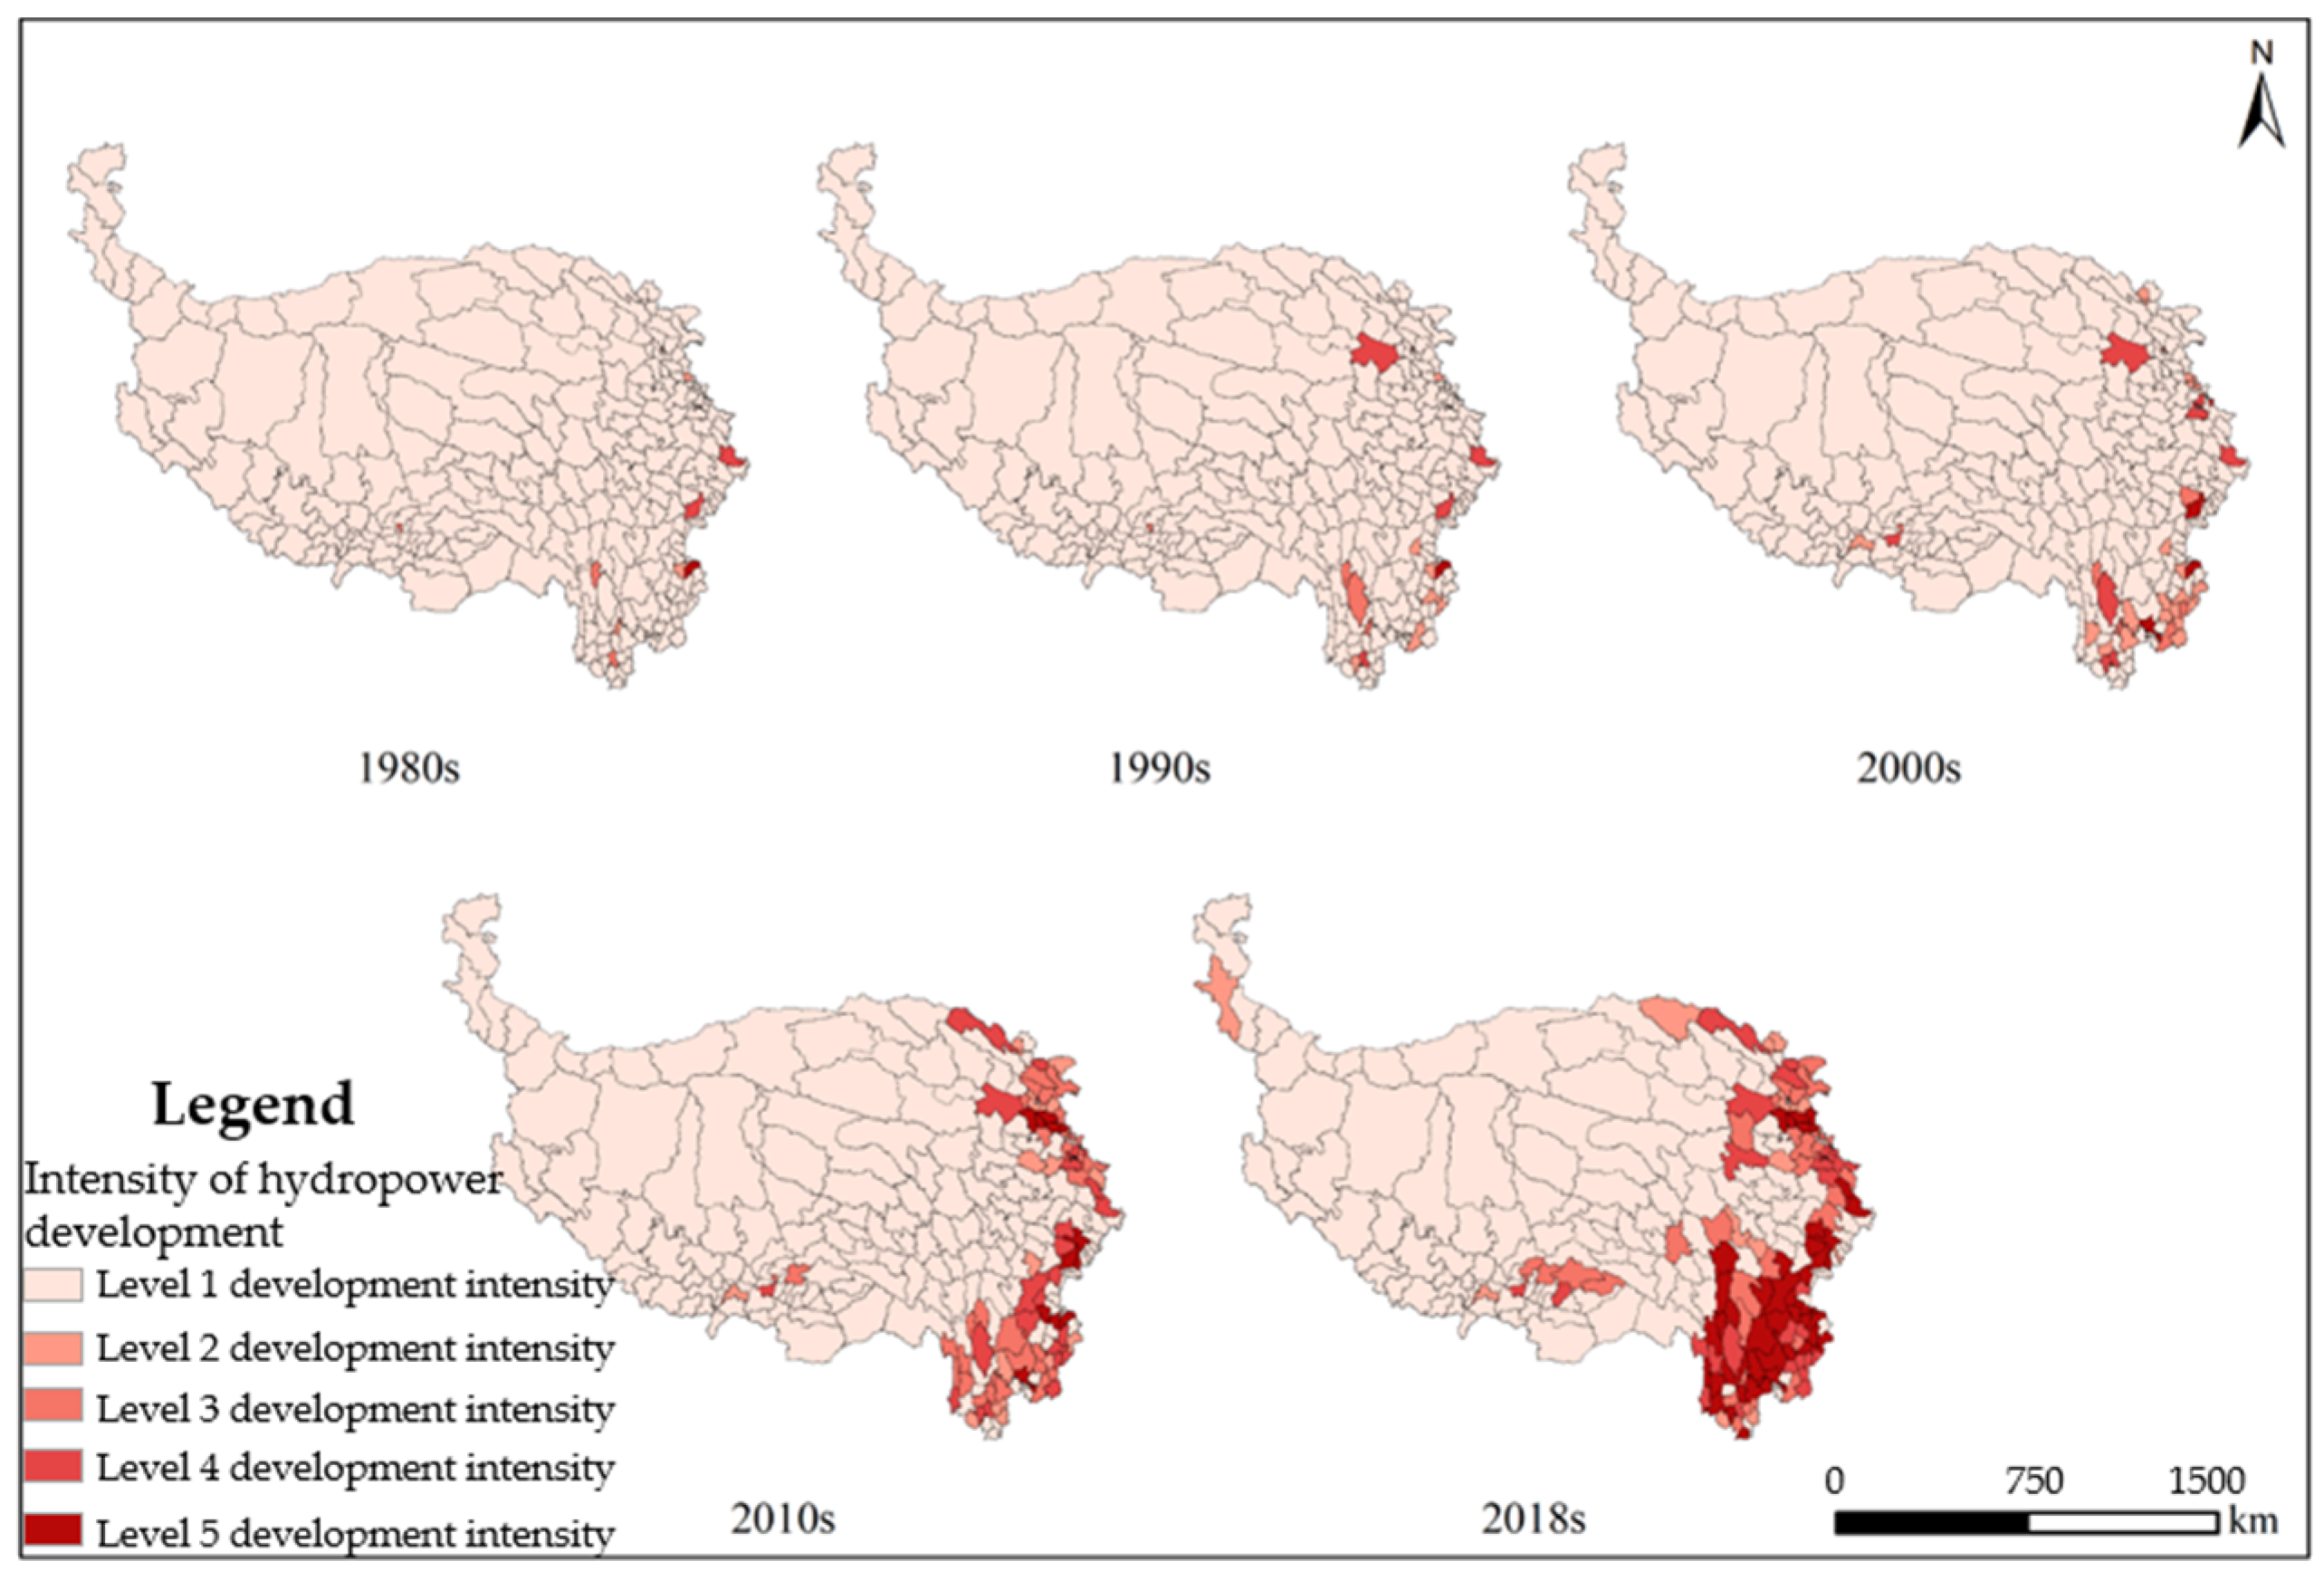
As shown in Figure 6, hydropower development on the Qinghai–Tibet Plateau was mainly concentrated in the eastern margin from 2000 and later. With the advancement of time, the development gradually expanded to the center of the plateau, but the spatial difference of the development intensity was obvious. The average intensity of hydropower development in the five ages shown was 0.002, 0.004, 0.010, 0.046 and 0.172, and the mean intensity increased by 69.4 times; the standard deviation was 0.020, 0.0203, 0.068, 0.195 and 0.509, with increasing difference between different districts and counties. The intensity of hydropower development increased significantly after 2000, and the intensity of high-intensity districts and county development before 2010 continued to increase after 2010.

3.3. Spatial Analysis of Hydropower Development Pattern

3.3.1. In the Past 40 Years, the Spatial Distribution and Clustering of Hydropower Development Has Been Further Enhanced

The global Moran’s I index of hydropower development density and intensity in the 1980s to 2018 was calculated using ArcGIS software with the results shown in Table 2. The calculation results show that the development density and intensity were the largest according to the global Moran’s I index in 2018, at 0.3113 and 0.1489, respectively, and these results passed the 0.01 significance level test. This shows that there is a significant positive spatial correlation between hydropower development in all districts and counties of the Qinghai–Tibet Plateau. The districts and counties with a large density and intensity of hydropower development also have a large hydropower development scale and installed capacity, and vice versa, and the spatial distribution of hydropower development shows obvious spatial agglomeration characteristics.
In terms of time evolution, the spatial autocorrelation of the density distribution of hydropower development density continuously expanded between the 1980s and 2018. During the whole study period, the global Moran’s I estimates were all positive, except in 2000 when the I value slightly decreased, and values showed a trend of increasing, and all were significant. This shows that, since the 1980s, the county concentrations on the Tibetan Plateau have undergone similar hydropower development density spatial distributions; that is, low hydropower development density where the surrounding border county development density is lower or high development density where the surrounding adjacent city county development density is higher. With the passage of time, this trend is still strengthening. However, the spatial difference of hydropower development intensity varied greatly from the 1980s to 2000s while the difference gradually narrowed, and in 2010, it began to show a gathering trend.
From the distribution of the hydropower stations and Moran’s I index values from the 1980s to 2018 in Sichuan County, the east and Pengzhou, it can be seen that the increasing density of hydropower development on the Qinghai–Tibet Plateau concentrated in the Liangshan Yi autonomous prefecture of Sichuan Province and around the eastern edge of the plateau, with the hydropower development density concentrated in the mid-west of the region. It is the continuous narrowing of the internal spatial differences between these two regions that makes the Moran’s I value of hydropower development on the Qinghai–Tibet Plateau expand.

3.3.2. Obvious Aggregation Effect in the Eastern Margin Area

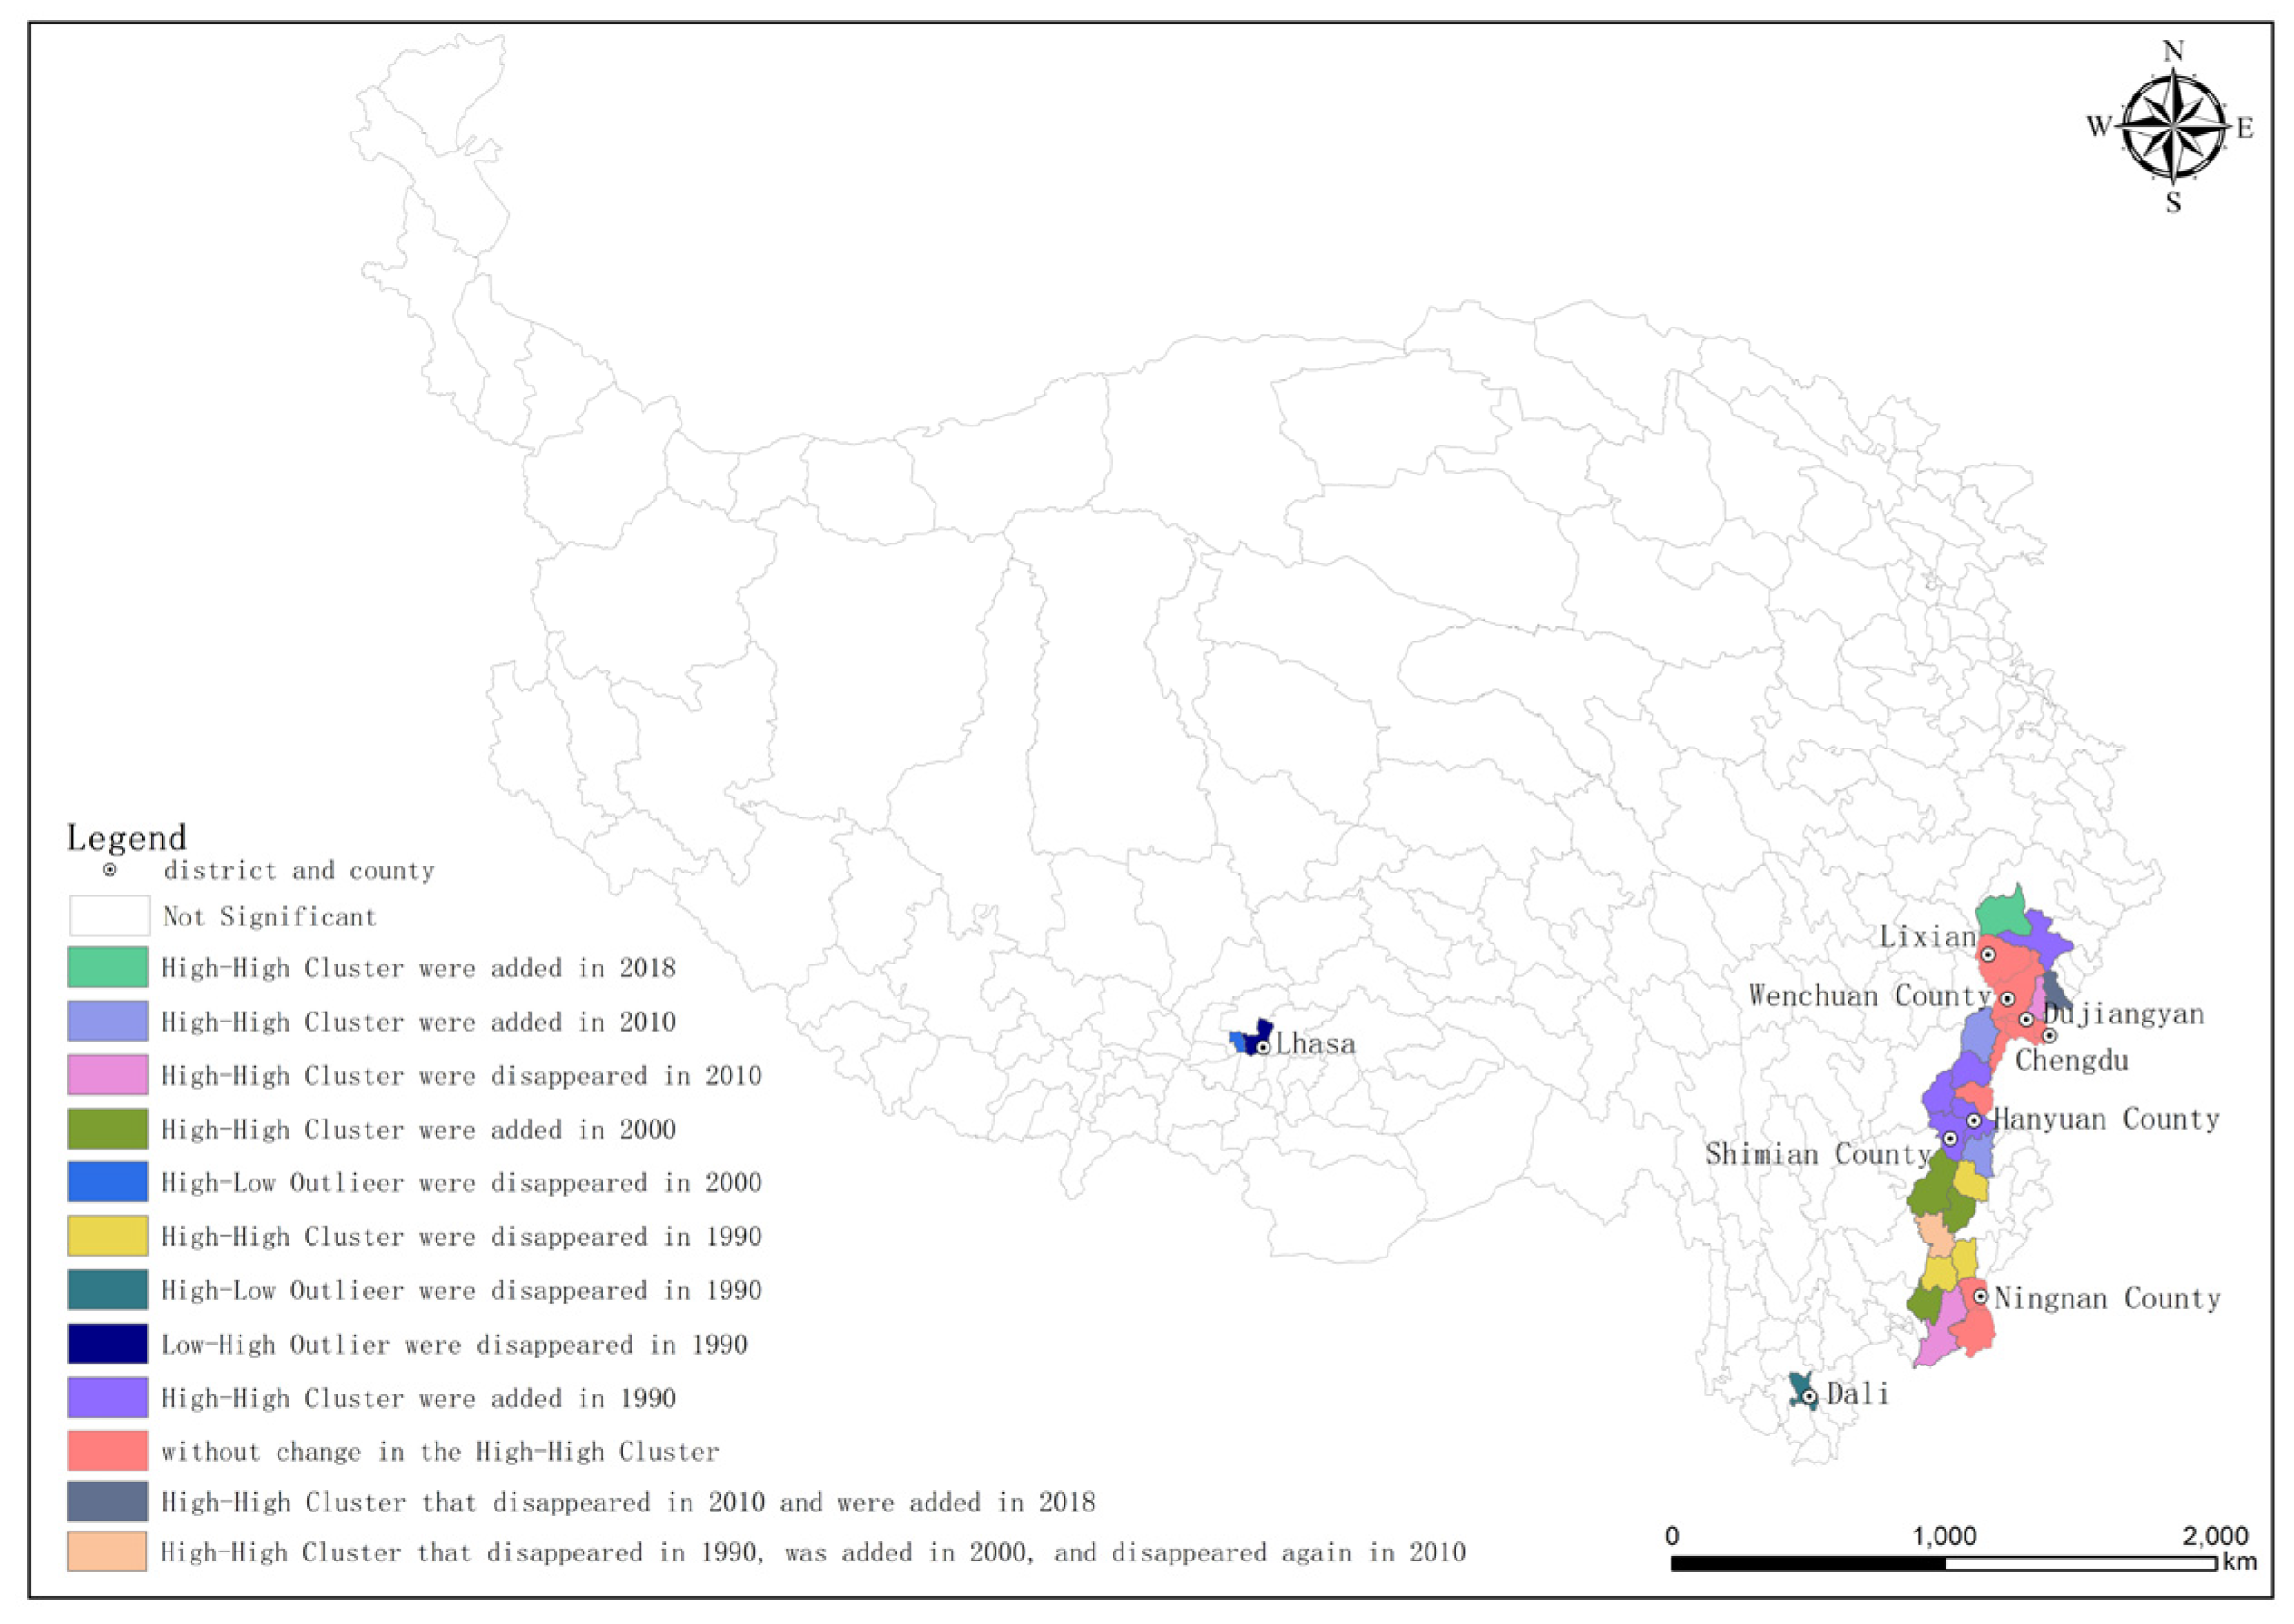
The results of the LISA cluster map (Figure 7) show the hydropower development density of each district on the Qinghai–Tibet Plateau from the 1980s to 2018: the hydropower development density on the eastern edge of the Qinghai–Tibet Plateau is large, and the difference between the surrounding districts and counties is small, showing the characteristics of hydropower development agglomeration, and the hydropower development density shows a “high-high” positive correlation. In particular, Lixian, Wenchuan County, Dujiangyan and Ningnan County in Sichuan Province have been stable in a “High-High Cluster” for nearly 40 years. These districts and counties have a concentrated population, large river drop, rich hydropower resources, perfect service facilities and convenient transportation, which makes the scale of regional hydropower development very large. Under the action of the diffusion effect, the scale of hydropower development in the neighboring districts and counties is also relatively high, such as Hanyuan County and Shimian County, and such administrative units have a strong spatial correlation with the surrounding districts and counties.
From the 1980s to the 1990s, there were also “high-low” districts and counties around Lhasa. The scale of “high” hydropower development was large, but the scale of the surrounding counties was small, and it was actually a “hot spot” in the spatial distribution of local hydropower development.
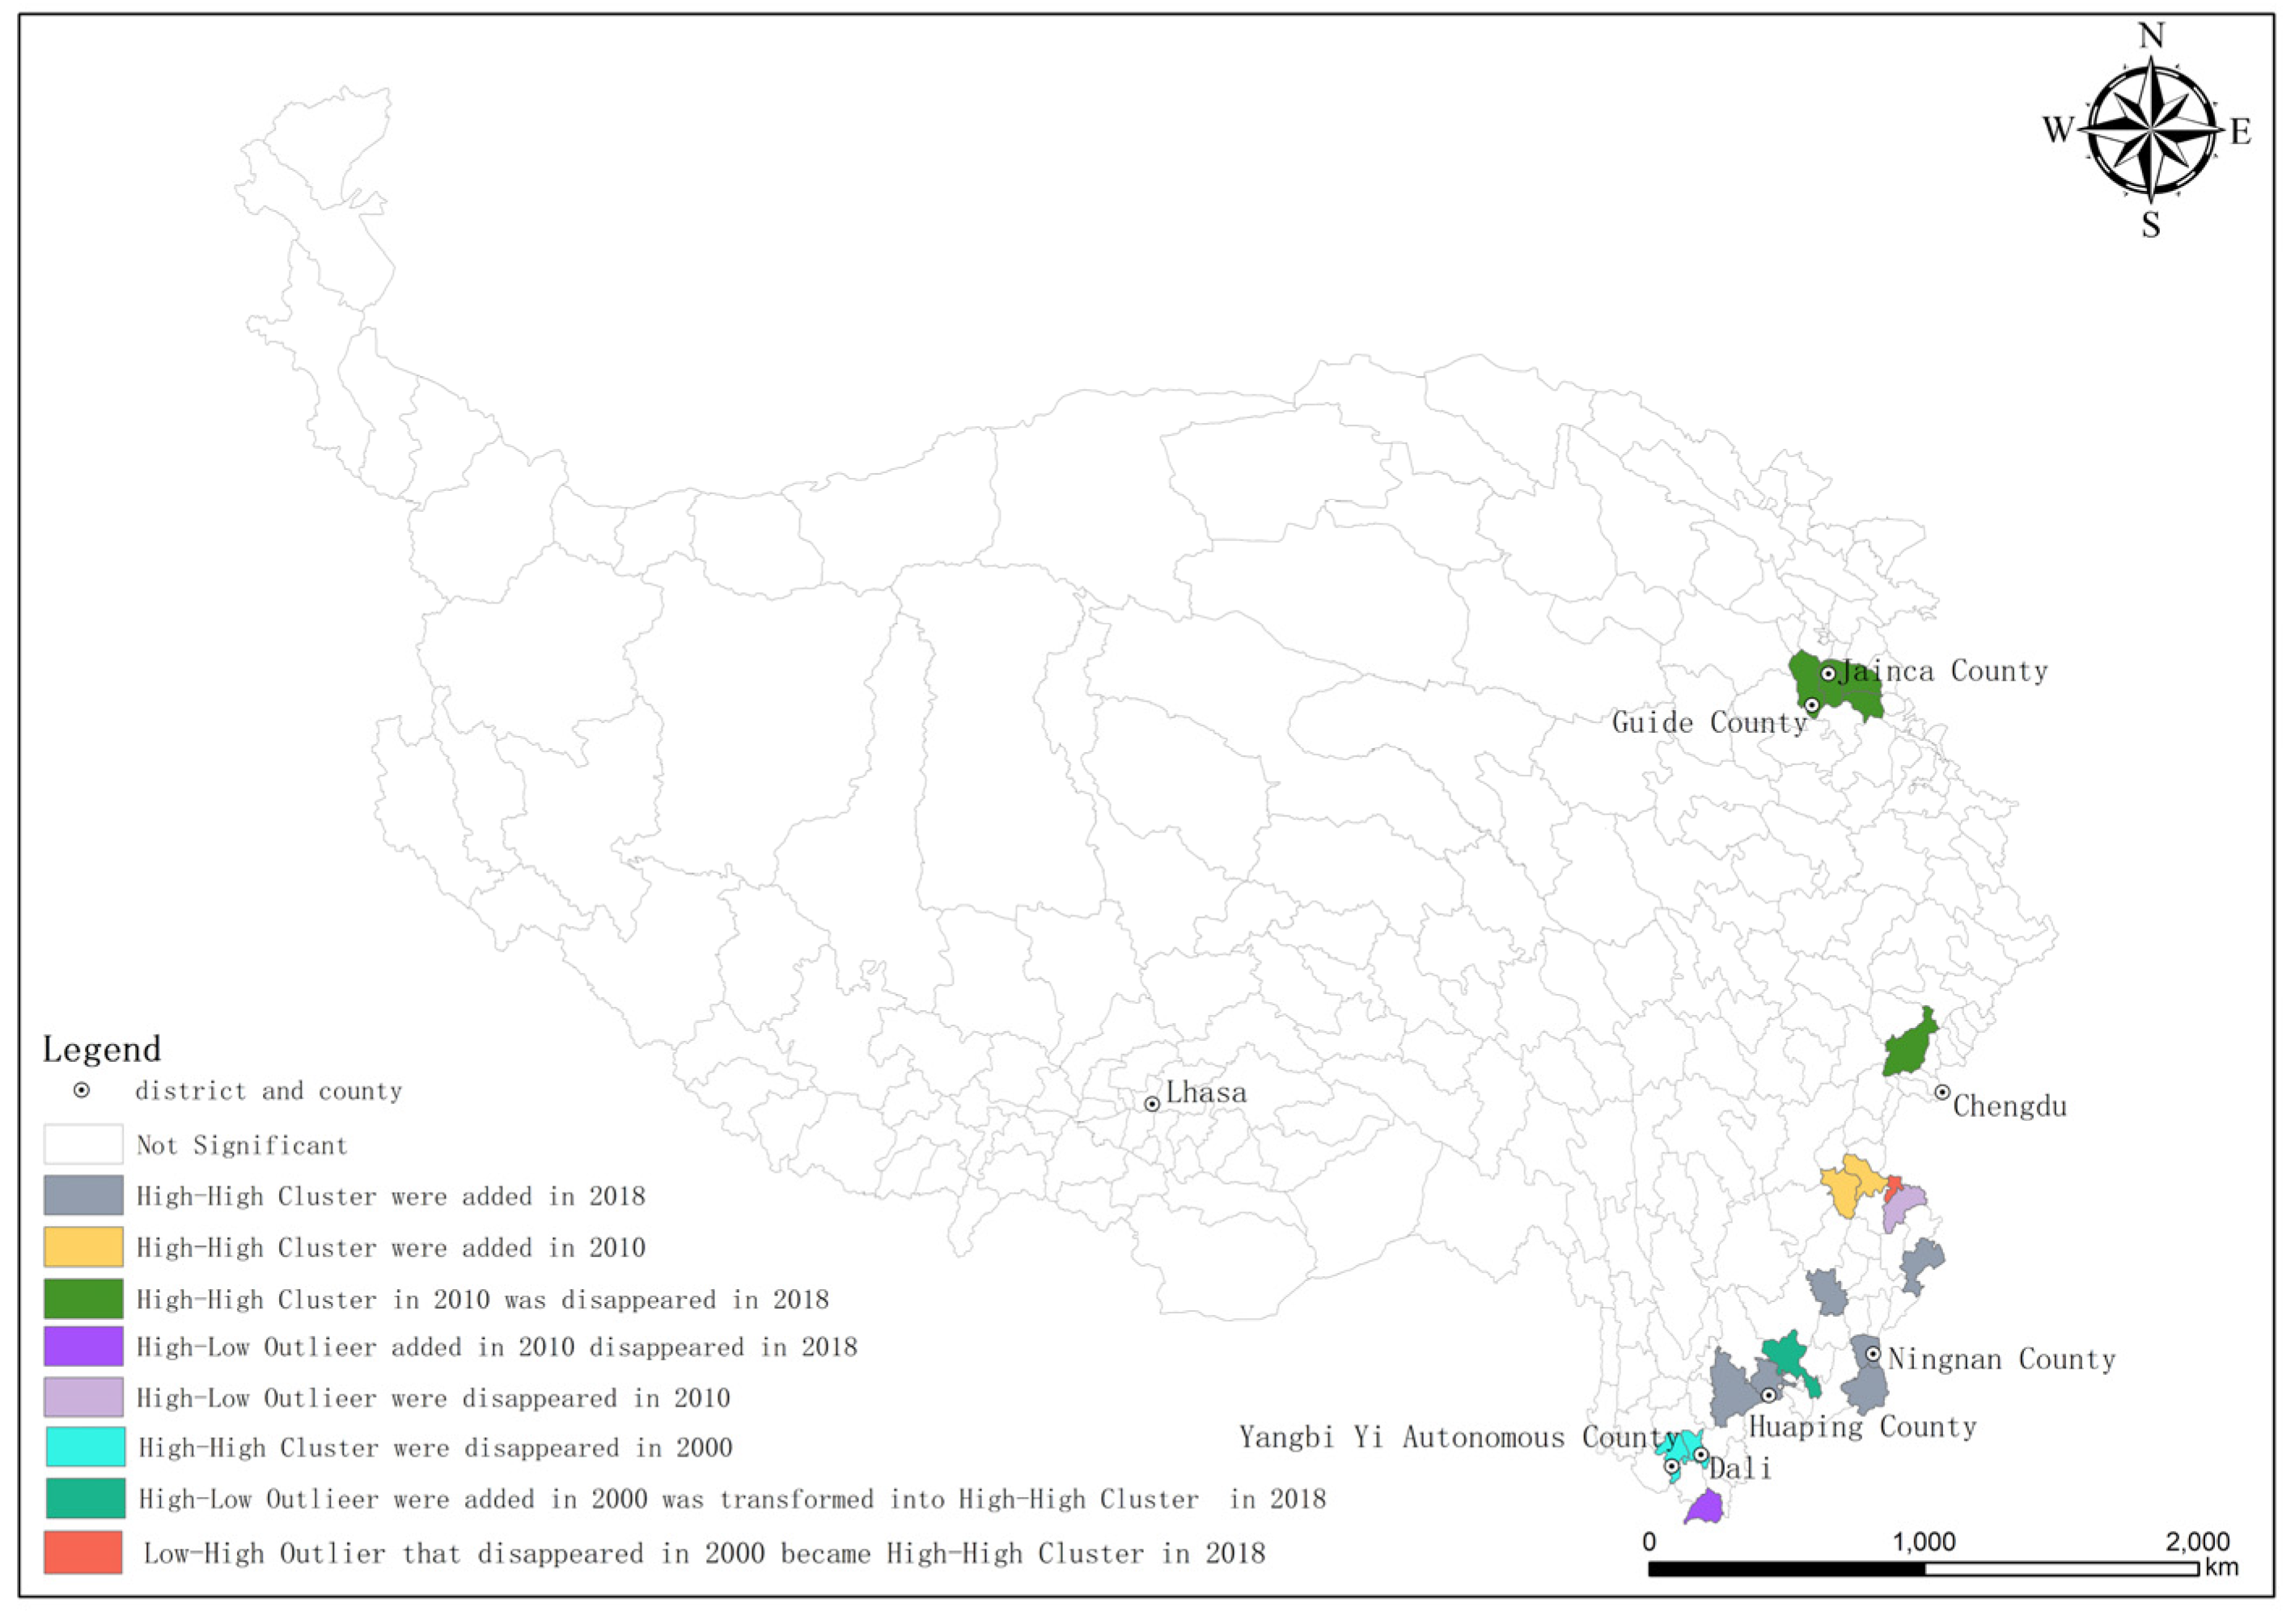
From the 1980s to 2000, the spatial intensity of hydropower development on the Tibetan Plateau was different. In 2000, the high aggregation effect in Yangbi Yi Autonomous County and Dali in the southern Tibetan Plateau disappeared. In 2010, “high” cluster areas were formed in the eastern edge of the Tibetan Plateau and around Guide County and Jainca County in the northeast, but the aggregation effect was not obvious; in the southeast, the hydropower development intensity was high in Ningnan County, Sichuan Province and Huaping County, Yunnan Province, and the hydropower stations with large installed capacity began to concentrate in the surrounding areas (Figure 8).

4. Discussion

4.1. Scientific Method

The spatial patterns of hydropower development intensity and density are basically the same, which proves that both indicators can be used to evaluate hydropower development. Installed capacity and annual power generation are globally usually used to evaluate the degree of hydropower development, but the installed capacity is difficult to reflect the actual situation of hydropower development, and the annual power generation, lagging and change with the flow rate, is difficult to obtain. Hence, some scholars use the flow rate, and the flow of hydrological indicators has often been used to measure the influence of hydropower development. For example, Wang Miaolin [45] characterized the influence of cascade hydropower development through the change in flow rate, water temperature and ecological flow guarantee degree, and some scholars such as K. Napalasawang et al. [46] established the correlation between hydrological elements such as temperature, rainfall and runoff to evaluate the potential of hydropower development. All these studies evaluate the hydropower development of rivers in other aspects such as the river ecological environment, while this study directly quantifies the spatial and temporal situation of hydropower development on the Qinghai–Tibet Plateau based on the two indicators of hydropower development density and intensity, introduced by hydropower installed capacity, which can more directly reflect the hydropower development itself.

4.2. Policy Implication

Regional differences in hydropower development are very large. The high development density/intensity districts are mainly distributed in the eastern margin of the Qinghai–Tibet Plateau, and the development degree is close to or even exceeds the “Dadu River Sichuan Section”, which belongs to high density/high intensity development [11]. However, for most districts and counties on the plateau, the density and intensity of hydropower development are not large; for example, the development intensity of Pulan County in 2000 was only 0.002, and the development density was only 0.0021. Another characteristic of hydropower development on the Qinghai–Tibet Plateau is that the rivers with a high degree of development are located in the outflow area [47], which has a large relationship with the topographic drop. At the same time, the outflow area is also closer to the mainland, and the demand for electricity is large, becoming a priority development zone.
In future hydropower development, we should pay attention to the improvement in utilization efficiency of water resources and to river ecological health. Hydropower development on the Qinghai–Tibet Plateau will continue for some time in the future. For example, the development of the upper reaches of the Jinsha River is planned by 2030, and the hydropower development of the Yarlung Zangbo River in Tibet will continue until 2035. However, the current development intensity of Tibet Autonomous Region is not high, and the development of the lower reaches of the Yarlung Zangbo River will inevitably lead to the increase in hydropower development intensity in this region. We need to attach great importance to the comprehensive impact of hydropower development. Since hydropower development on the Qinghai–Tibet Plateau is limited by the natural environment, economic and technical conditions, the spatial pattern of hydropower development finds difficulty achieving balanced development in the whole region. Therefore, it is necessary to appropriately reduce hydropower generation in high-intensity development zones, such as mitigating the impact of water diversion and power generation on the ecological environment and making good use of wind, solar and other clean energy sources. Furthermore, the power generation scale of hydropower, wind power and solar energy should be rationally planned in a proper proportion according to the resources characteristics, complementary characteristics and the economy of different clean energy sources. Relying on the surplus transmission capacity and peak adjustment capacity of the hydropower transmission channel and the network of the Tibet electric power grid and the external district electric power grid, the external transmission of wind energy and solar energy can be realized. The local government can also enhance the promotion of electrical support among regions. Under the overall layout of the national energy development strategy, the policymakers can build a comprehensive clean energy base, actively participate in the national energy and power balance system to disperse the power generation demand of the high-intensity development zones in the region, and explore the establishment of energy cooperation relations with neighboring countries under the initiative of “the Belt and Road” so as to reduce our own power generation pressure.
In addition, the new hydropower development of the Qinghai–Tibet Plateau has entered a deceleration period, and the development of hydropower resources in the future will pay more attention to the protection of the river ecosystem [9]. After the clean-up and rectification of small hydropower systems in the Yangtze River Economic Belt in 2018, the density of hydropower development in the Yangtze River Basin will be reduced; but attention should be paid to the restoration and monitoring of the river ecosystem. The local government can make better use of the abundant clean energy within this area in light of local conditions and open up a new resource exploration development path emphasizing green and renewable energy to build a beautiful Tibet and strengthen the shield of national ecological security.

4.3. Limitations and Prospects

The spatial pattern of hydropower development is the result of many factors, among which is the spatial and temporal distribution of water resources; in other words, the theoretical reserves of hydropower resources in this area, is the basis of exploration, the technical exploitable amount is the objective condition, and the economic exploitable amount is the decisive factor, all of which are common indicators for quantifying hydropower resources. First, the distribution of water resources on the Qinghai–Tibet Plateau is, relatively, clustering in the east and the south compared to the north and the west. The theoretical reserves of water energy resources are approximately 299 million kW. Precipitation is the main source of surface runoff in the region, which has a gradual decline trend from the south to the northwest, determining the basic pattern of hydropower development on the Qinghai–Tibet Plateau. In detail, the basic pattern of hydropower development in this region is concentrated in the eastern margin area with water resources rather than the arid western region.
Second, the Qinghai–Tibet Plateau elevation is higher in the northwest. The natural characteristics in the western part are dominated by a complete plateau topography, wide-spread lakes and frequent seismic and volcanic activities, while the eastern part is dominated by north–south trend mountains, rich vegetation, few lakes and developed water systems. Therefore, the natural conditions in the western part are more complex, leading to a smaller technological exploitability than that in the eastern part. At present, the exploitable capacity of hydropower resources in Tibet is approximately 250 million kW, with huge exploration potential, but it is mainly concentrated in the Lancang, Jinsha, Dadu, Minjiang and other major rivers in the southeast.
Finally, the pattern of hydropower development is mainly driven by economic factors. To be more specific, the demand for hydropower resources and the distance from the power market are the two main determinants. Due to the limitations of natural conditions in this region, production and living activities are concentrated in the south and east in this area. Additionally, the relatively small amount of population on the Qinghai–Tibet Plateau leads to the small power energy demand scale, and power energy resources are mainly consumed outside the area. As a result, hydropower resources in the southeast of Tibet are used to meet the “West-east power transmission” policy, which determines the basic pattern of high-intensity development in the southeast. In addition, the distance from the location of hydropower station to the electric power market is also a factor that cannot be ignored in the distribution of hydropower development. For example, the Min River in the eastern margin is close to Chengdu city, indicating a lower cost of transportation and a lower difficulty of transmission, which makes it becomes the key river in the hydropower development. Although our country has improved the transmission ability and capability through a lot of research, the distance from the resource origins to the markets and accessibilities remain leading prerequisites of the power grid construction.
Therefore, the spatial and temporal pattern of hydropower development on the Qinghai–Tibet Plateau is driven by the comprehensive influence of geographical environment, economy, history, technology and other factors. However, due to the data limitation, this study only discusses the distribution form of hydropower development without in-depth analysis of the influencing factors. In addition, the high density/intensity districts and counties identified by the institute need to comprehensively check and scientifically evaluate the prominent ecological environment problems in the development of small hydropower systems, while some districts and counties still have a large amount of hydropower resources to be developed. The future development process should be orderly to reduce the negative impact on the ecological environment as much as possible.

5. Conclusions

(1)
We analyzed the evolution of hydropower development on the Qinghai–Tibet Plateau and found that, in the past 40 years, hydropower development has been growing continuously, and that the time around 2005 was a key period of “quantity growth”, while 2014 was a key period of “installed capacity growth”. Hydropower development on the Qinghai–Tibet Plateau has made a leap from quantitative development to qualitative development.
(2)
We evaluated the density and intensity of hydropower development on the Qinghai–Tibet Plateau in the past 40 years and found that the development in this region is mainly concentrated in the eastern margin, and the degree of hydropower development in most other regions is still very low. The hydropower development on the Qinghai–Tibet Plateau will continue for a period of time in the future, which will lead to a significant increase in the intensity in some regions. Such development needs to pay great attention to the ecological environment protection in these regions, and the pattern of hydropower development on the plateau should be optimized on the whole.
(3)
From the perspective of global space autocorrelation, the distribution of the Qinghai–Tibet Plateau hydropower development shows high space autocorrelation, and the high density and high intensity areas of hydropower development are clustered in the east and south, and the global space autocorrelation index shows that it will continue to strengthen over time; this means a high hydropower development scale when the adjacent counties’ development scale is high, and vice versa. The implication of this conclusion is that the imbalance of hydropower development on the Qinghai–Tibet Plateau is increasing. If we do not pay attention to this phenomenon and effectively adjust the regional policies, the agglomeration of hydropower distribution in the eastern regions will become more obvious, which will lead to the reduction of water resources in the concentrated areas and serious damage to the ecological environment. Limited by natural, economic, technological and other factors, hydropower development in the western part of the Qinghai–Tibet Plateau is difficult to improve, making it impossible to maintain equilibrium on the Qinghai–Tibet Plateau. Therefore, it is necessary to appropriately reduce hydropower generation in high-intensity development zones, mitigating the impact of water diversion and power generation on the ecological environment. Considering that the Qinghai–Tibet Plateau is rich in wind and solar energy resources. The technical exploitable amount of wind energy resource was 1.02 billion kw, accounting for 26% of the national total. The total annual radiation amount of solar energy is 0.5–1 times that of the plain area at the same latitude. Moreover, the investment cost and operation cost of wind and solar energy are lower than the construction cost of hydropower development, and the pollution to river ecological environment is less than that of hydropower development. Therefore, we can make good use of wind, solar and other clean energy sources to realize better development of clean energy. However, there are random and uncontrollable defects in wind power generation and photovoltaic power generation, and electric power transportation is difficult. Therefore, it is still necessary to ensure the leading roles of hydropower development. Then, according to the actual situation in the region, photovoltaic power generation and wind power generation will be proportionally allocated [48,49]. The “Power Sky Road” Qinghai–Tibet Network project and the ultra-high-voltage transmission line project will be utilized to realize external transmission of electric power.
(4)
From the perspective of local space autocorrelation, “high” clusters are mainly concentrated in the eastern region of the Qinghai–Tibet Plateau, and “low-high” clusters and “high-low” clusters gradually decreased after 2000. This shows that the Qinghai–Tibet Plateau hydropower development aggregation effect is emerging, and the concentration of hydropower stations is on the increase, while the “hot spot” effect of hydropower development distribution is weakening. An important implication of this conclusion is that if the development level of the eastern margin region is further expanded, more hydropower stations will concentrate here in future. The most likely result is the further expansion of the development scale, which leads to the adverse development of the regional environment, and the unreasonable development will eventually lead to regional disharmony.

Author Contributions

Conceptualization, C.Q.; methodology, C.Q. and B.F.; formal analysis, C.Q.; data curation, X.Z., D.D., C.B. and R.B.; writing—original draft preparation, C.Q.; writing—review and editing, B.F.; visualization, C.Q.; supervision, B.F.; project administration, B.F.; funding acquisition, B.F. All authors have read and agreed to the published version of the manuscript.

Funding

This research was funded by the central government and various state departments “The second comprehensive scientific investigation of the Qinghai–Tibet Plateau”, grant number 2019QZKK0307, National Natural Science Foundation of China “Ecosystem service flow based on cascade processes”, grant number 32071664.

Institutional Review Board Statement

Not applicable.

Informed Consent Statement

Not applicable.

Data Availability Statement

The data used in the study are available from the corresponding author upon request.

Conflicts of Interest

The authors declare no conflict of interest.

References

  1. Lao, C.Y. A Study on Regional Economic Impact of Hydropower Development in Tibet. Financ. Mind. 2016, 1, 86–97, 138. (In Chinese) [Google Scholar]
  2. Xie, J.Y.; Tang, W.J.; Yang, Y.H. Fish assemblage changes over half a century in the Yellow River, China. Ecol. Evol. 2018, 8, 4173–4182. [Google Scholar] [CrossRef]
  3. Yuan, B.; Guo, M.; Wu, W.; Zhou, X.; Xie, S. Geochemical Fractions and Release Characteristics of Nitrogen in Sediments Along Deep-Water Cascade Reservoirs of the Lancang River. Environ. Eng. Sci. 2022, 39, 364–378. [Google Scholar] [CrossRef]
  4. Xia, M.; Jia, K.; Zhao, W.; Liu, S.; Wei, X.; Wang, B. Spatio-temporal changes of ecological vulnerability across the Qinghai-Tibetan Plateau. Ecol. Indic. 2021, 123, 107274. [Google Scholar] [CrossRef]
  5. Zhang, L.; Pang, M.; Wang, C.; Ulgiati, S. Environmental sustainability of small hydropower schemes in Tibet: An emergy-based comparative analysis. J. Clean. Prod. 2016, 135, 97–104. [Google Scholar] [CrossRef] [Green Version]
  6. Qiao, H.; Huang, Z.; Chen, W.; Zhang, C.; Ou, C.; Zhang, S. Development of small hydropower in China 1990–2015: Province-domain patterns of temporal-spatial evolution. J. Renew. Sustain. Energy 2019, 11, 055903. [Google Scholar] [CrossRef]
  7. Yang, Y.j.; Zhang, C.D. Key Aspects of the Future Hydropower Development in China. Hydropower New Energy 2021, 35, 1–7. (In Chinese) [Google Scholar]
  8. Chen, S.; Chen, B.; Su, M. An estimation of ecological risk after dam construction in LRGR, China: Changes on heavy metal pollution and plant distribution. Procedia Environ. Sci. 2011, 5, 153–159. [Google Scholar] [CrossRef] [Green Version]
  9. Qian, G.L. Hydropower Development and Environmental Protection in Tibet Autonomous Region. Water Power 2019, 45, 6–10, 34. (In Chinese) [Google Scholar]
  10. Mu, Y.; Xu, P.; Fu, B.; Li, M. Impact of Hydropower Development in Upper Reaches of Minjiang River on Flow Reducing of River Reaches. Yangtze River 2015, 46, 67–71. (In Chinese) [Google Scholar]
  11. Li, Z.X.; Lv, L.L.; Li, P. Evaluation of Impact of Hydropower Exploitation on River Ecological Environment in Tibet. J. Hohai Univ. (Nat. Sci.) 2014, 42, 200–204. (In Chinese) [Google Scholar]
  12. Guo, C.; Ma, G.; Xiao, H.; Zhou, W.; Chen, H.; Zhou, Z.; Cheng, X. Displacement Back Analysis of Reservoir Landslide Based on Multi-Source Monitoring Data: A Case Study of the Cheyiping Landslide in the Lancang River Basin, China. Remote Sens. 2022, 14, 2683. [Google Scholar] [CrossRef]
  13. Xing, Y.; Bai, J.; Li, H.; Liu, B.; Zhao, Y. Species diversity of fishes in the Dingqu River Basin, tributary of the upper Yangtze River, China. Biodivers. Data J. 2021, 9, e76669. [Google Scholar] [CrossRef]
  14. Zhai, H.; Hu, B.; Luo, X.; Qiu, L.; Tang, W.; Jiang, M. Spatial and temporal changes in runoff and sediment loads of the Lancang River over the last 50 years. Agric. Water Manag. 2016, 174, 74–81. [Google Scholar] [CrossRef]
  15. Li, J.; Dong, S.; Yang, Z.; Peng, M.; Liu, S.; Li, X. Effects of cascade hydropower dams on the structure and distribution of riparian and upland vegetation along the middle-lower Lancang-Mekong River. For. Ecol. Manag. 2012, 284, 251–259. [Google Scholar] [CrossRef]
  16. Liu, Y.; Lu, H.; Tian, P.; Qiu, L. Evaluating the effects of dams and meteorological variables on riparian vegetation NDVI in the Tibetan Plateau. Sci. Total. Environ. 2022, 831, 154933. [Google Scholar] [CrossRef] [PubMed]
  17. Li, T.; Huang, X.; Jiang, X.; Wang, X. Assessment of ecosystem health of the Yellow River with fish index of biotic integrity. Hydrobiologia 2018, 814, 31–43. [Google Scholar] [CrossRef]
  18. Su, T.; Wang, S.; Mei, Y.; Shao, W. Comparison of channel geometry changes in Inner Mongolian reach of the Yellow River before and after joint operation of large upstream reservoirs. J. Geogr. Sci. 2015, 25, 930–942. [Google Scholar] [CrossRef] [Green Version]
  19. Guo, X.; Zhu, X.; Yang, Z.; Ma, J.; Xiao, S.; Ji, D.; Liu, D. Impacts of cascade reservoirs on the longitudinal variability of fine sediment characteristics: A case study of the Lancang and Nu Rivers. J. Hydrol. 2020, 581, 124343. [Google Scholar] [CrossRef]
  20. Chen, J.; Mei, Y.; Ben, Y.; Hu, T. Emergy-based sustainability evaluation of two hydropower projects on the Tibetan Plateau. Ecol. Eng. 2020, 150, 105838. [Google Scholar] [CrossRef]
  21. Chen, L.; Huang, K.; Zhou, J.; Duan, H.-F.; Zhang, J.; Wang, D.; Qiu, H. Multiple-risk assessment of water supply, hydropower and environment nexus in the water resources system. J. Clean. Prod. 2020, 268, 122057. [Google Scholar] [CrossRef]
  22. Cui, B.; Hu, B.; Zhai, H. Employing three ratio indices for ecological effect assessment of Manwan Dam construction in the Lancang River, China. River Res. Appl. 2011, 27, 1000–1022. [Google Scholar] [CrossRef]
  23. Tang, J.Y.; Shi, Z.R. Research on the Hydropower Development Ideas of Jinsha River. China Water Resour. 2004, 16, 33–34. (In Chinese) [Google Scholar]
  24. Deng, C.; Zhang, W. Spatial distribution pattern of degree–day factors of glaciers on the Qinghai–Tibetan Plateau. Environ. Monit. Assess. 2018, 190, 475. [Google Scholar] [CrossRef] [PubMed]
  25. Liang, L.; Li, L.; Liu, C.; Cuo, L. Climate change in the Tibetan Plateau Three Rivers Source Region: 1960-2009. Int. J. Clim. 2013, 33, 2900–2916. [Google Scholar] [CrossRef]
  26. Ren, Z.; Jiang, Z.; Cai, Q. Longitudinal patterns of periphyton biomass in Qinghai–Tibetan Plateau streams: An indicator of pasture degradation? Quat. Int. 2013, 313–314, 92–99. [Google Scholar] [CrossRef]
  27. Li, M.; Fu, B.; Wang, Y.K.; Peng, P.H.; Yan, K. Characteristics and Spatial Patterns of Hydropower Development in the upper Minjiang River Basin. Resour. Environ. Yangtze Basin. 2015, 24, 74–80. (In Chinese) [Google Scholar]
  28. Ptak, T.; Crootof, A.; Harlan, T.; Kelly, S. Critically evaluating the purported global “boom” in small hydropower development through spatial and temporal analysis. Renew. Sustain. Energy Rev. 2022, 163, 112490. [Google Scholar] [CrossRef]
  29. Zhou, X.; Fan, S.Y.; Sun, H.; Tang, L.; Ma, F.W. Practices of environmental protection, technological innovation, economic promotion and social equity in hydropower development: A case study of cascade hydropower exploitation in China’s Dadu River basin. Clean. Technol. Envir. 2021, 23, 2827–2841. [Google Scholar] [CrossRef]
  30. Gao, J.; Yao, F.M.; Lei, X.H.; Wang, J.X.; Ma, F.P. Study on water quality evaluation and water quality distribution characteristics of main stream of Daduhe River under the background of cascade hydropower development. Water Resour. Hydropower Eng. 2021, 52, 133–145. (In Chinese) [Google Scholar]
  31. Laurent, T.; Ruiz-Gazen, A.; Thomas-Agnan, C. GeoXp: An R Package for Exploratory Spatial Data Analysis. J. Stat. Softw. 2012, 47, 1–23. [Google Scholar] [CrossRef] [Green Version]
  32. Dall’erba, S. Distribution of regional income and regional funds in Europe 1989–1999: An exploratory spatial data analysis. Ann. Reg. Sci. 2005, 39, 121–148. [Google Scholar] [CrossRef] [Green Version]
  33. Kong, H. Surface Domain Spatial Autocorrelation Analysis of per Unit Area Yield of Grain. IOP Conf. Ser. Mater. Sci. Eng. 2018, 381, 012037. [Google Scholar] [CrossRef]
  34. Moran, P.A.P. The Interpretation of Statistical Maps. J. R. Stat. Soc. Ser. B Methodol. 1948, 10, 243–251. [Google Scholar] [CrossRef]
  35. Patricia, A.E.; Astorkiza, I. From Exploratory Data Analysis to Exploratory Spatial Data Analysis. Math. Stat. 2020, 8, 82–86. [Google Scholar]
  36. MacIndoe, H.; Oakley, D. Encouraging a Spatial Perspective in Third Sector Studies: Exploratory Spatial Data Analysis and Spatial Regression Analysis. Volunt. Int. J. Volunt. Nonprofit Organ. 2023, 34, 64–75. [Google Scholar] [CrossRef]
  37. Arthur, G. Cliff, A.D. and Ord, J.K. 1973: Spatial autocorrelation. london: Pion. Prog. Hum. Geoc. 1995, 19, 245–249. [Google Scholar]
  38. Anselin, L. Local indicator of spatial assocation-LISA. Geogr. Anal. 1995, 27, 93–115. [Google Scholar] [CrossRef]
  39. Editorial Board of China Hydropower Yearbook. China Hydropower Yearbook; China Electric Power Press: Beijing, China, 2006. (In Chinese)
  40. General Administration of Hydropower Construction, Ministry of Electric Power Industry, The Law of the People’s Republic of China (Basin) Water Resources Review Results (2003); Ministry of Electric Power Industry: Beijing, China, 2003. (In Chinese)
  41. General Administration of Hydropower Construction, Ministry of Electric Power Industry, The Law of the People’s Republic of China (Province) Hydropower Resources Review Results (2003); Ministry of Electric Power Industry: Beijing, China, 2003. (In Chinese)
  42. Editorial Department of Tibet Yearbook. Tibet Yearbook; Tibet People’s Publishing House: Lhasa, China, 2000. (In Chinese)
  43. Compilation Committee of the English Edition of the Sichuan Yearbook. In Sichuan Yearbook (English Version); Chongqing CEC Electronic Audio and Video Publishing Co., Ltd.: Chongqing, China, 2015.
  44. Jiao, L. Second Comprehensive Scientific Expedition to the Qinghai-Tibet Plateau; China Forestry Publishing House: Beijing, China, 2020; Volume 319. (In Chinese) [Google Scholar]
  45. Wang, M.L. Preliminary Assessment of River Health for Hydropower Development in the Hengjiang River Basin. In Proceedings of the Water Ecology (7th) China Water Ecological Conference 2019, Enshi, China; 2019; pp. 168–172. (In Chinese). [Google Scholar]
  46. Napalasawang, K.; Mi, B.Y.; Chen, X. Assessment of hydrological elements for hydropower development in southern Laos. Water Resour. Hydropower Express Rep. 2016, 37, 25–28. (In Chinese) [Google Scholar]
  47. Cao, J.T.; Qin, D.h.; Kang, E.S.; Li, Y.Y. Runoff changes of major rivers in the outflow area of the Qinghai-Tibet Plateau. Sci. Notif. 2005, 21, 2403–2408. (In Chinese) [Google Scholar]
  48. Zhang, Y.; Lian, J.; Ma, C.; Yang, Y.; Pang, X.; Wang, L. Optimal sizing of the grid-connected hybrid system integrating hydropower, photovoltaic, and wind considering cascade reservoir connection and photovoltaic-wind complementarity. J. Clean. Prod. 2020, 274, 123100. [Google Scholar] [CrossRef]
  49. Zhang, Y.; Ma, C.; Yang, Y.; Pang, X.; Lian, J.; Wang, X. Capacity configuration and economic evaluation of a power system integrating hydropower, solar, and wind. Energy 2022, 259, 125012. [Google Scholar] [CrossRef]
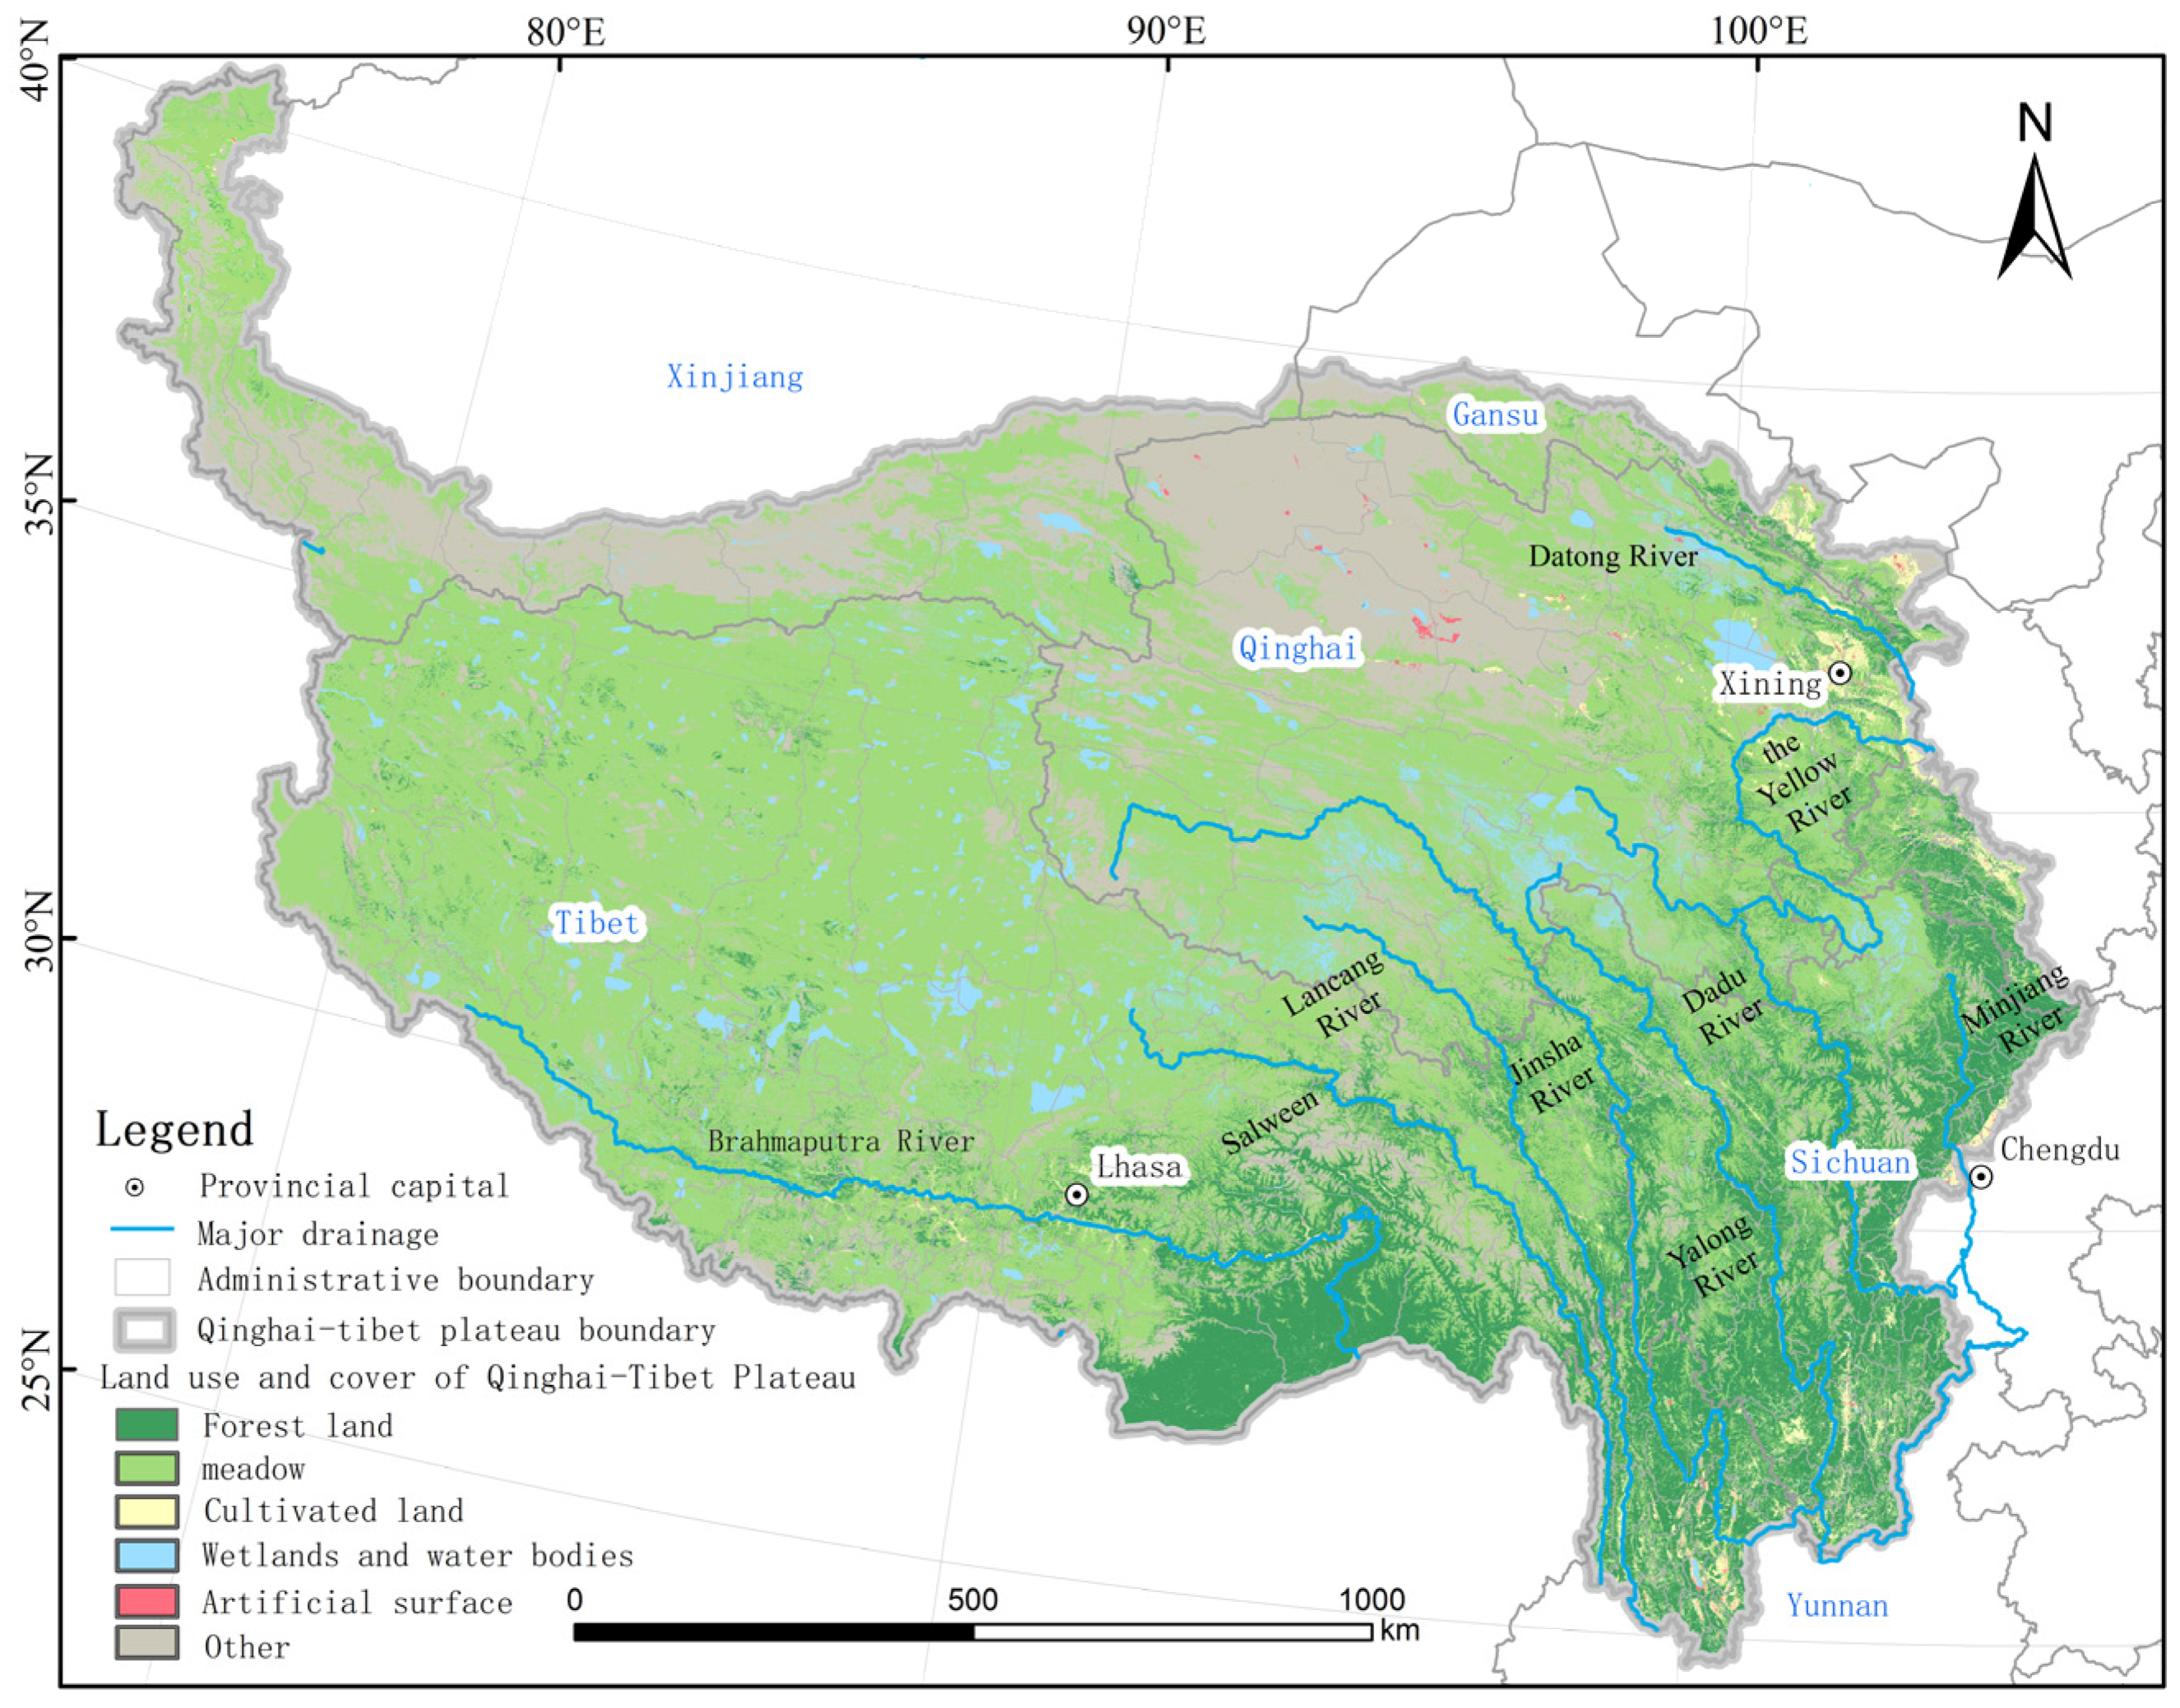
Figure 1. Location of study area and land use/land cover.
Sustainability 15 06688 g001
Figure 2. Change in the number of new hydropower stations.
Sustainability 15 06688 g002
Figure 3. Installed hydropower capacity on the Qinghai–Tibet Plateau.
Sustainability 15 06688 g003
Figure 4. Ratio of newly added hydropower installed capacity to the number of newly added hydropower stations.
Sustainability 15 06688 g004
Figure 5. Hydropower development density on the Qinghai–Tibet Plateau in different years.
Sustainability 15 06688 g005
Figure 6. Hydropower development intensity on the Qinghai–Tibet Plateau in different years.
Sustainability 15 06688 g006
Figure 7. Spatial correlation types of hydropower development density on the Tibetan Plateau from the 1980s to 2018.
Sustainability 15 06688 g007
Figure 8. Spatial correlation types of hydropower development intensity on the Tibetan Plateau from the 1980s to 2018.
Sustainability 15 06688 g008
Table 1. Value range of different levels of hydropower development intensity and density.
Evaluating IndicatorⅠ LevelⅡ LevelⅢ LevelⅣ LevelⅤ LevelReference Value (Sichuan Section of Dadu River)
I (MW km−2)0–0.0040.004–0.0100.010–0.0460.046–0.172>0.1720.24
D (seat/km)0–0.0020.002–0.0040.004–0.0080.008–0.013>0.0130.034
Note: all values are for the entire Qinghai–Tibet Plateau study area.
Table 2. Moran’s I and test index Z of hydropower development on the Qinghai–Tibet Plateau from the 1980s to 2018.
IndexTime1980s1990s2000s20102018
Development densityI0.10330.29090.24760.28360.3113
Z3.58249.45778.963410.222310.9906
P0.00030.00000.00000.00000.0000
Development intensityI−0.0054−0.0008−0.01000.07200.1489
Z−0.07080.1347−0.36932.65455.2061
P0.94350.89280.71150.00790.0000
Disclaimer/Publisher’s Note: The statements, opinions and data contained in all publications are solely those of the individual author(s) and contributor(s) and not of MDPI and/or the editor(s). MDPI and/or the editor(s) disclaim responsibility for any injury to people or property resulting from any ideas, methods, instructions or products referred to in the content.