Article

Impact of Paddy Field Reservoirs on Flood Management in a Large River Basin of Japan

1
Institute of Industrial Science, The University of Tokyo, Tokyo 153-8505, Japan
2
Faculty of Engineering, Kyoto University of Advanced Science, Kyoto 615-0096, Japan
3
Graduate School of Frontier Sciences, The University of Tokyo, Tokyo 277-0882, Japan
4
Center for Climate Change Adaptation, National Institute for Environmental Studies, Tsukuba 305-8506, Japan
*
Author to whom correspondence should be addressed.
Sustainability 2023, 15(8), 6604; https://doi.org/10.3390/su15086604
Submission received: 23 February 2023 / Revised: 30 March 2023 / Accepted: 11 April 2023 / Published: 13 April 2023

Abstract

:
The flood retention capacity of paddy fields is well-recognized in Japan, and all the existing flood control practices via paddy field management achieve reductions in peak flood discharge. However, the previous studies have not assessed the flood management potential of paddy fields in a large river basin with average paddy coverage, and the existing hydrological models are not quite suitable for simulating river discharge from closed-drainage paddy reservoir storage. We herein attempt to improve the watershed-scale version of global hydrological model H08 to simulate a reduction in the peak discharge from paddy reservoirs in the Abukuma River basin of Japan. The NSE and R2 index showed fair reliability of the H08 model during the calibration and validation stages. The simulated results from the improved model show 11% and 6% peak reductions in high paddy coverage areas for a normal year (2018) and a major typhoon year (2019), respectively. The peak-reduction percentage increased with decreasing rainfall, depending on the overflow from the paddy reservoirs. The results indicate that the paddy reservoir is not highly effective in a large river with less than 20% paddy coverage, but the peak discharge reduction capacity shows that paddy reservoirs can make some contribution when used in combination with dam operation.

1. Introduction

Although natural disasters cannot be controlled, it is crucial that their impact be mitigated to the greatest extent possible, with sustainable measures in every sector. Efficient disaster management is essential for a country such as Japan, with a history of major natural disasters occurring almost every year. Since the 1980s, historical paradigm shifts in Japan’s disaster management approach have made it more holistic and robust, by including both green and gray infrastructural measures [1,2]. Green infrastructure is expected to make an additional contribution to disaster prevention along with the conventional gray infrastructure, but with lower construction and maintenance costs [3]. Among the various types of green infrastructure, the paddy field is well recognized in several Asian countries for its flood mitigation potential [4,5,6,7,8]. In Japan as well, the flood retention potential of paddy fields has been well reported. One strategic flood control technology termed kasumitei was adopted in the 1500s by transferring flood water into paddy fields located adjacent to a levee system, and this approach was found to reduce flood inundation damage [9,10]. The most common strategy in Japan at present, the paddy field dam (PFD) strategy, was pioneered in Murakami City of Niigata prefecture in 2002 with the installation of runoff control devices for slower drainage of stored rainwater from paddy fields [11]. In the following years, other parts of Niigata prefecture and Hyogo and Nara prefectures implemented PFD with three types of runoff control structures—namely, the orifice, weir, and free drain systems—and showed that all three approaches achieved reductions in the peak river discharge [12,13,14,15,16,17].
Though the existing PFD technique has been shown to significantly improve flood management, most of the studies assessing the impact of PFD have either been conducted on smaller river basins or portions of basins with ≥40% paddy field coverage, and the peak reduction percentage was reported to be 30–40%. This number indicates that the paddy dam strategy is highly effective in areas with higher paddy field coverage. However, for many large river basin areas in Japan, paddy field coverage is less than 20% on average, and therefore, it is very important to evaluate the effect of paddy fields on flood management in such areas. Moreover, because large rivers experience more damage from riverine floods during major natural disasters, it is crucial to investigate the role of paddy fields in reducing flood discharge from these rivers. To simulate the effect of paddy fields on the reduction of flood discharge, a hydrological model can play a crucial role.
In Japan, a study [18] reported the use of an integrated transfer function model and a hydraulic model to assess the flood mitigation impact of tank-irrigated paddy field areas in Shiga prefecture but only described measurement of the mitigation effect in the irrigation tanks. Some researchers [19] developed a flood prevention index through an exponential curve-fitting and runoff model to describe the improvement of the flood prevention capacity using paddy fields in the Tone River basin but did not use any actual measurement of the inundation–mitigation effect. After the PFD technique came into practice, researchers [20] developed a combination of a runoff calculation model, a river flow analysis model, and an inundation flow analysis model to determine the flood peak reduction from orifice drainage outlets, while more recently, some researchers [16] used a numerical model to analyze the effect of a weir-type outlet on flood mitigation. However, simulation studies on PFD are difficult to replicate on a large watershed scale due to their meticulous nature and detailed river flow analysis process. Apart from the PFD technique, the movement of stored rainwater from paddy fields to drainage outlets was modeled with a new runoff model [21] in Ishikawa prefecture, and the peak runoff ratio was used in combination with unit discharge to determine the potential flood discharge associated with changes in land use. However, the study did not measure the actual flood discharge generated from the paddy field runoff into the river channel. Other researchers [22] used a modified version of the hydrological model SWAT (termed SWAT-paddy) in a lake basin of Chiba prefecture and reported the successful incorporation of the daily change of impounded water in paddy fields into the model’s water balance calculation, but they pointed out the difficulty of gathering enough field data to satisfy the model’s data requirements for a larger-scale watershed study.
All the hydrological simulation models used in previous studies [16,17,18,19,20,21,22] have been proven to be unsuitable for various reasons. A new hydrological model is thus needed to assess the effectiveness of closed-drainage paddy reservoirs for reducing flood discharge of major river basins of Japan. Therefore, in this study, we attempted to improve the H08 model [23,24] and evaluate the effectiveness of paddy reservoirs in reducing flood discharge. H08 is well known and widely applied for global-scale simulations, and a number of studies have used H08 to conduct watershed-scale simulations as well, including an analysis of the impact of the reservoir operation on the Chao-Phraya River, Thailand [25,26], an assessment of climate change impact on the Ganges–Brahmaputra–Meghna basin, Bangladesh [27], and performance analysis of the finer resolution model in the Kyushu region, Japan [28]. However, the current H08 model does not have the storage function to measure runoff generated from a paddy reservoir, which is why this model has not been used previously for this purpose. Therefore, in this study, we developed the H08 by adding additional storage capacity within existing paddy embankments (usually 20–25 cm in height) to the model’s runoff simulation formula. Specifically, the model simulates runoff from paddy reservoirs and subsequent river discharge after closing the drainage outlets from October to December, when the paddy cultivation season comes to an end. The advantage of using the improved H08 model is that it has fewer input data requirements compared to some existing hydrological models, such as SWAT-paddy, and the water storage capacity within the paddy reservoirs can be easily modified based on the embankment height to simulate the reduction of the peak discharge. In this study, we examined whether the paddy reservoir of the Abukuma River basin (one of Japan’s large river basins, located in Fukushima prefecture) would be effective during normal times and during major disasters, and whether it would have a positive impact on the flood management plans for the Abukuma River basin. This study was a novel attempt to investigate the effect of paddy reservoir practice in terms of different event magnitudes, using an improved watershed-scale version of the hydrological model H08 in a large river with average paddy coverage.

2. Materials and Methods
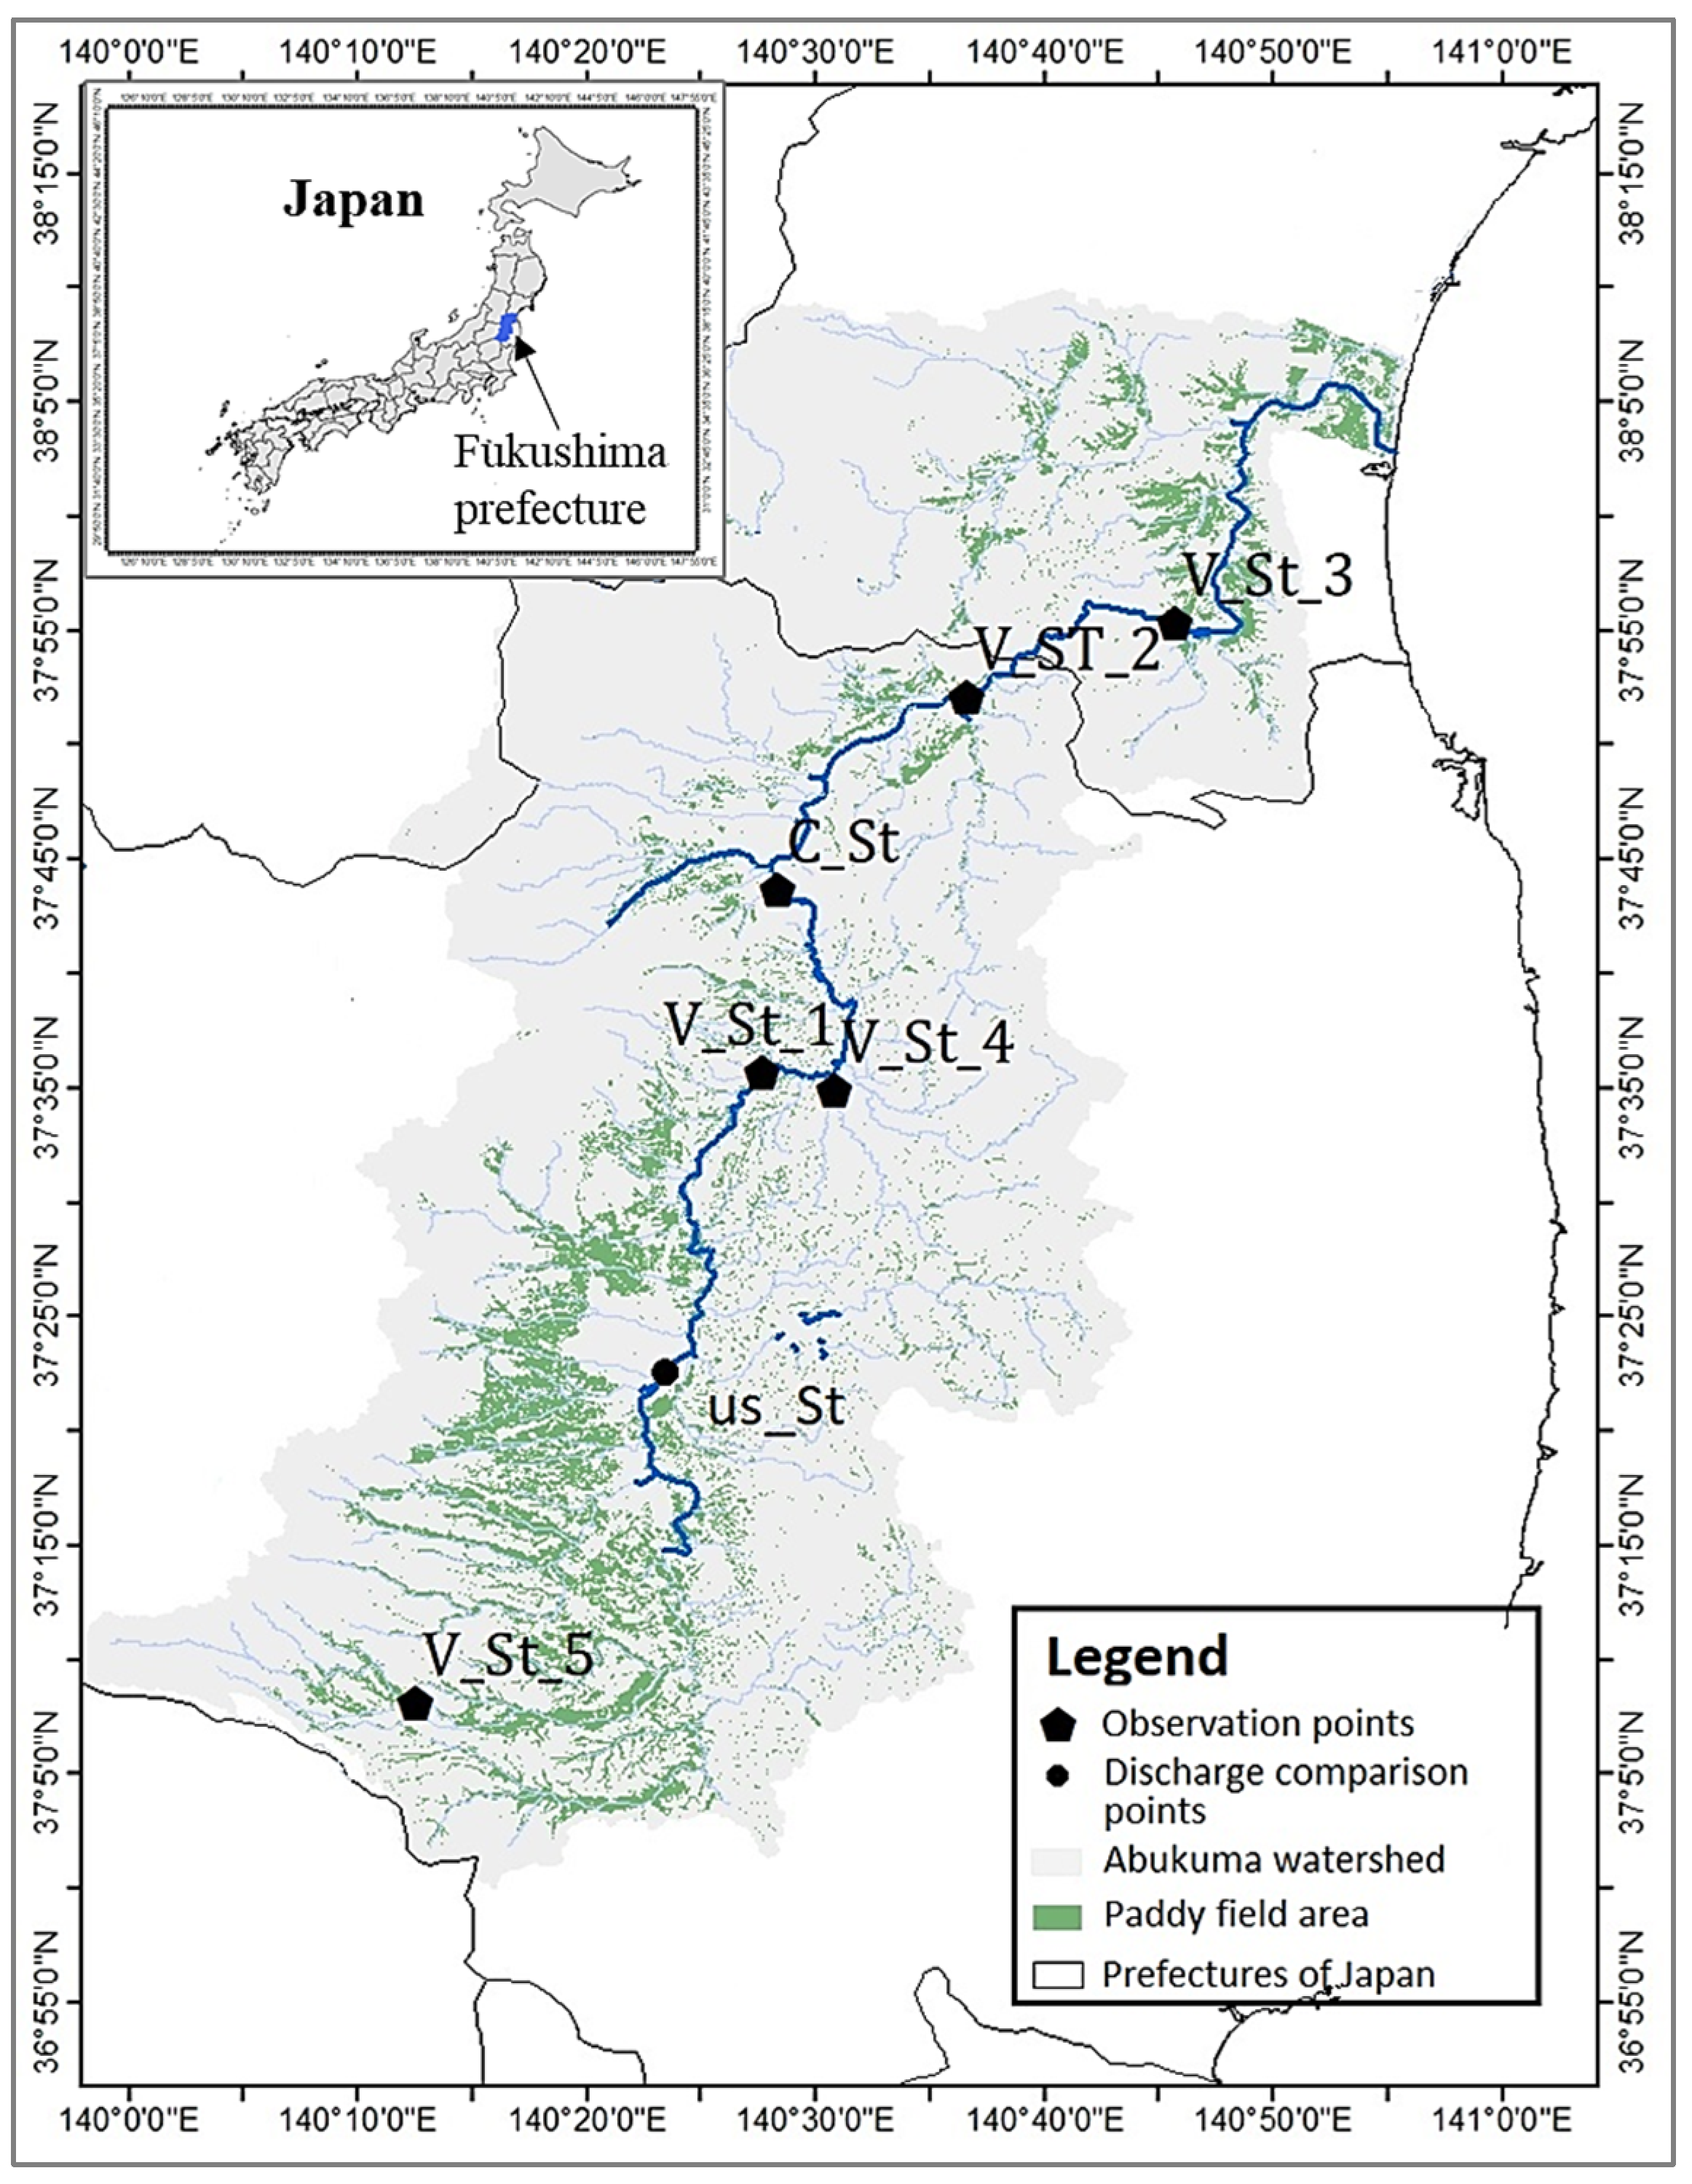
In this study, all simulations were performed for 2018 and 2019 to compare a normal flood year and an extreme event. The year 2019 was selected because the Super Typhoon Hagibis that year caused record-breaking rainfall and severe inundation in six major river basins of Japan, including the Abukuma River basin. The methodological framework of the study is summarized in Figure 1.

2.1. Study Area

The Abukuma River basin is situated in the Tohoku region of Japan. This is the second-longest river in this basin region, which runs through several prefectures [29]. The area of the river basin is 5400 km2 according to the Ministry of Land, Infrastructure, Transport and Tourism (MLIT), and the main river channel is 239 km in length. The mean annual flow of Abukuma is 112 m3/s, and the average annual rainfall is 1100 mm in the plains and 1200–1500 mm in the mountains [30]. Paddy field covers 12.4% of the river’s watershed areas, and most of these fields are close to the main river channel, which indicates their fair potential to store rainwater and contribute to discharge reduction. This large river experienced severe damage in the recent Super Typhoon Hagibis, which occurred on 12 October 2019 and resulted in more than 600 mm of cumulative rainfall in 3 days, a record discharge of 6020 m3/s in the Fukushima observatory, and subsequent flood inundation, with embankment breaching in many parts of the river basin. It is very crucial to assess whether the rainwater storage capacity of paddy fields would be effective in reducing river discharge during such a major disaster. For this reason, the Abukuma basin was selected as a study area for this research. Figure 2 shows the study area, with the main river channel, paddy field area, and observation points marked in the river watershed for model calibration and validation, which are referred to in the sections below.

2.2. Hydrological Model H08

H08 is a global hydrological and water resources model developed by [23,24] and named after the developer’s paper (Hanasaki 2008). The model comprises six modules that represent the interaction of natural and anthropogenic processes affecting the global water balance. These modules are as follows: land surface hydrology, river routing, crop growth, reservoir operation, environmental flow requirement estimate, and anthropogenic water withdrawal [23]. For this study, the first two modules were used for the simulation of total runoff and river discharge.

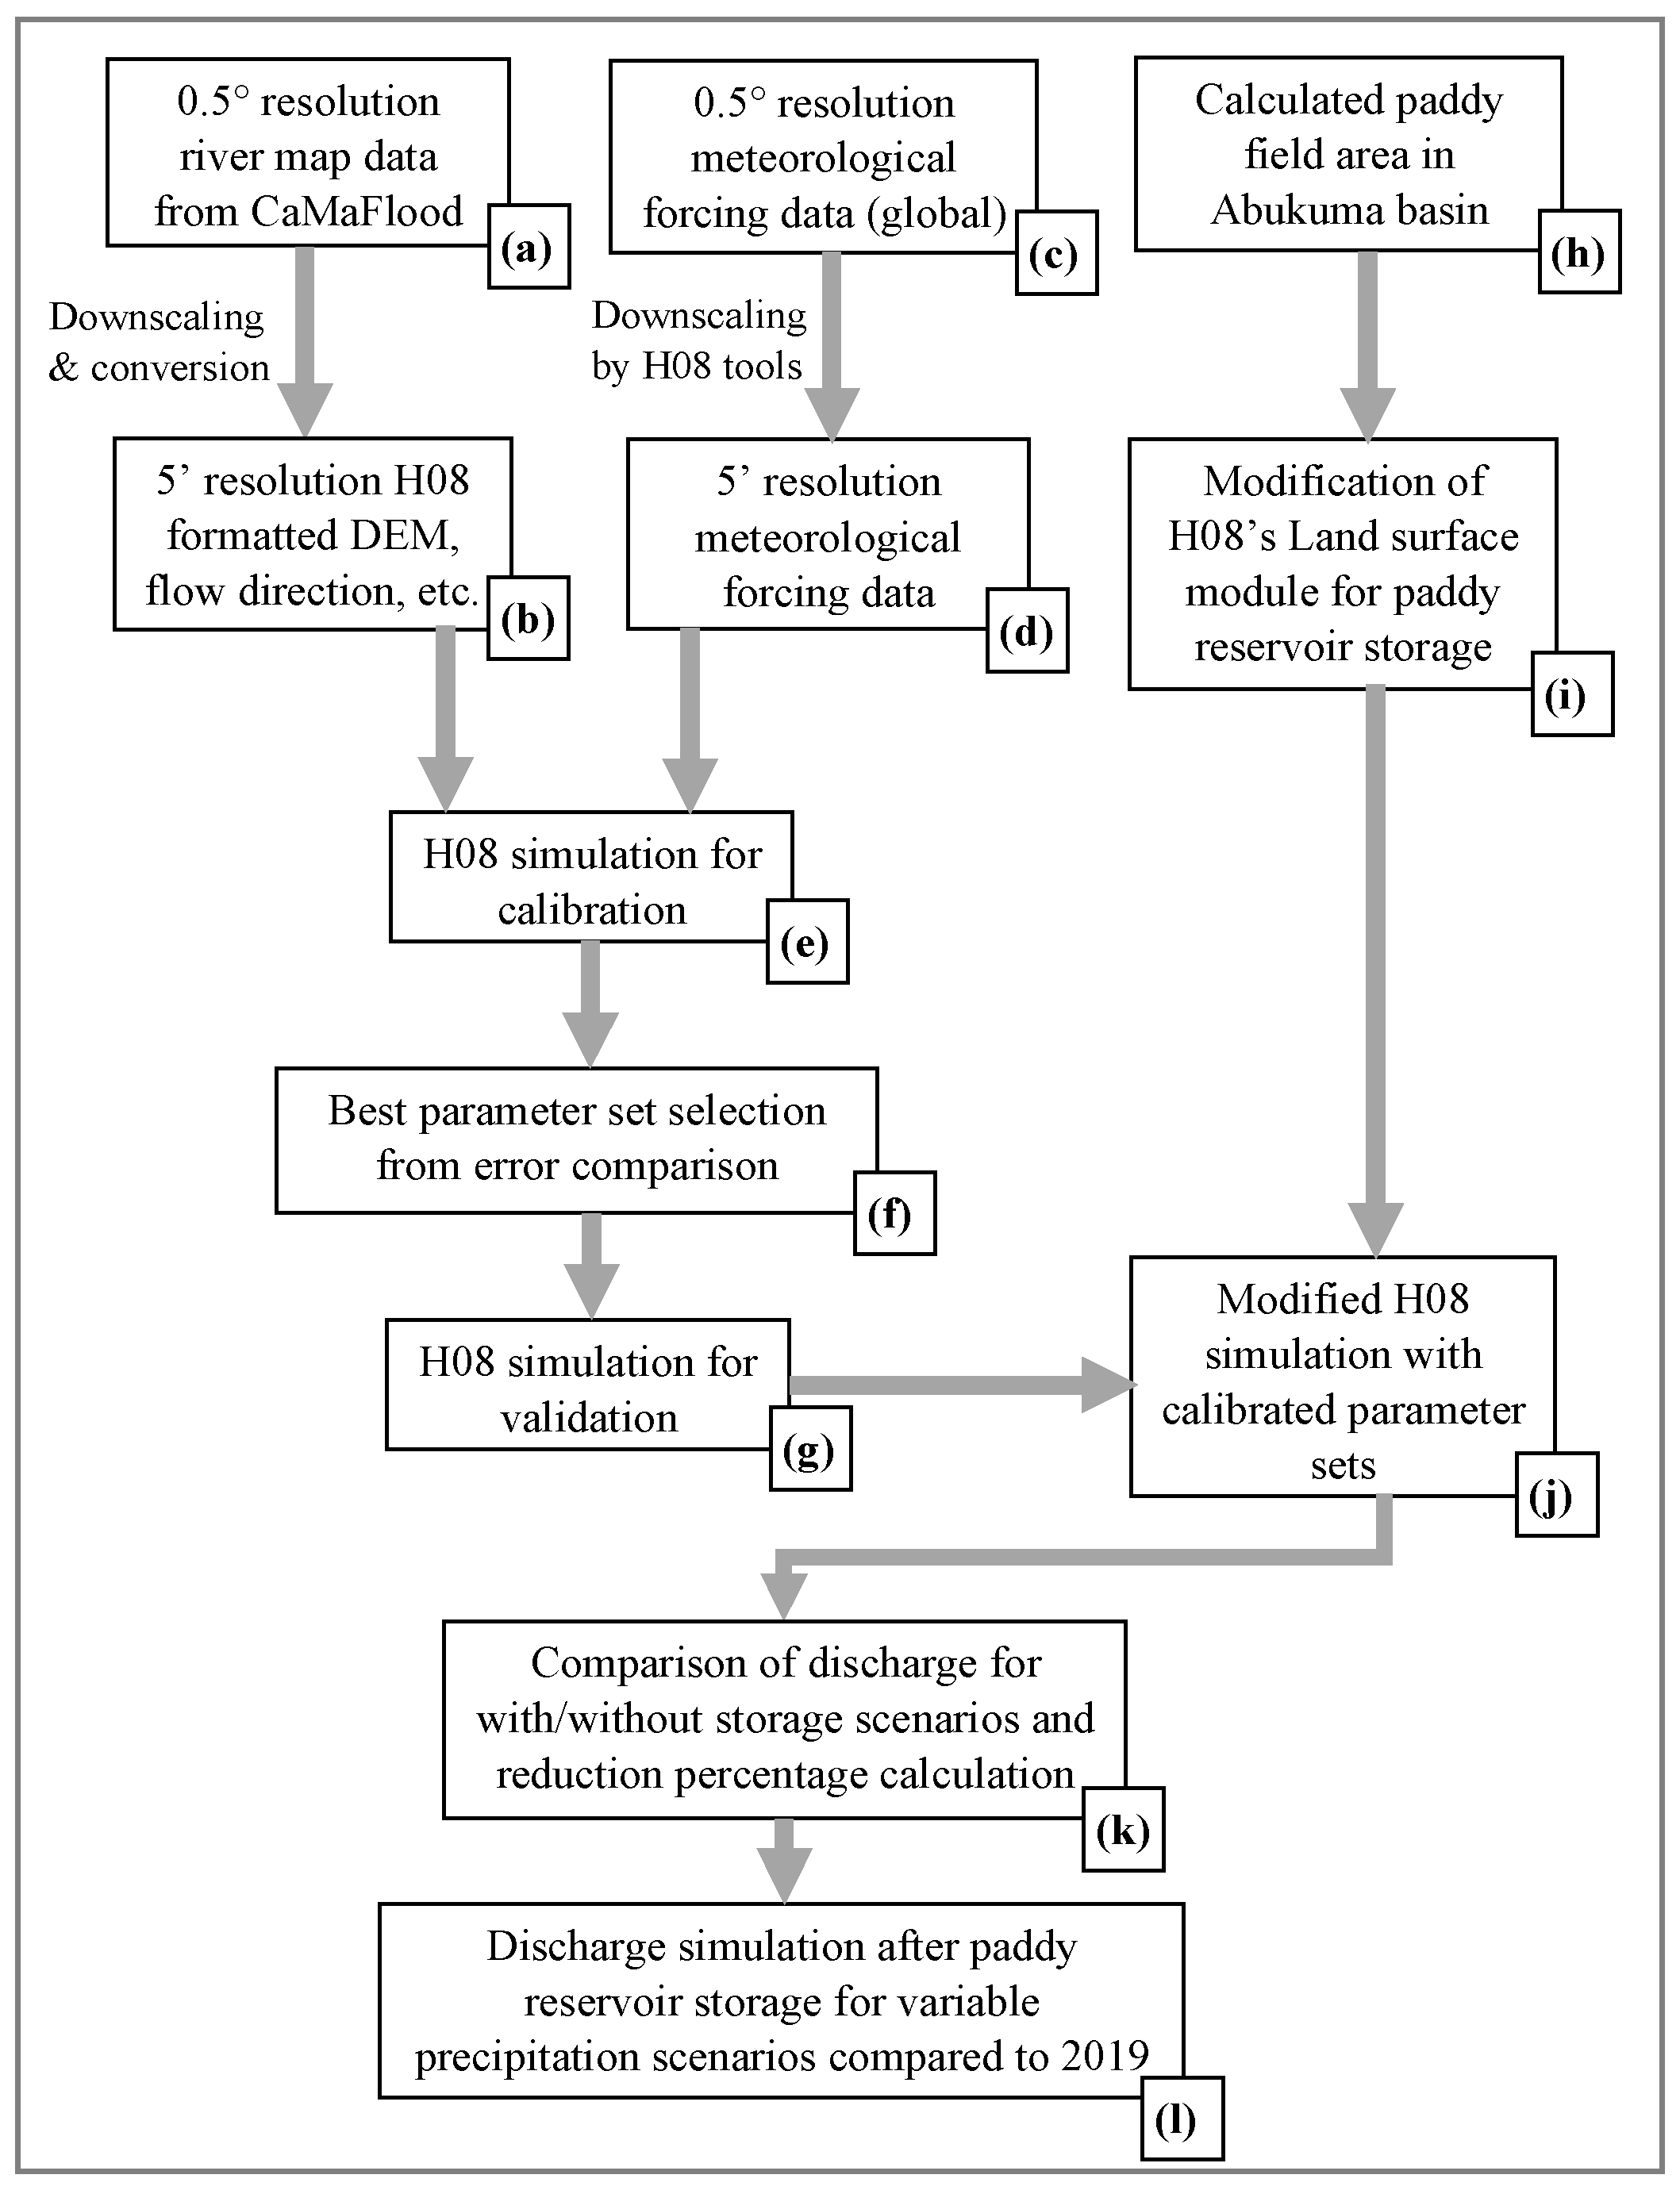
2.2.1. Creating Map Data

To simulate runoff and river discharge by the land surface module and river module of H08, the first created input data were ‘map’ data for the spatial domain of the Abukuma River. For the purpose of this research, the whole basin area, covering all the tributaries of Abukuma, was considered, and the total area (a 2° by 2° window, 38–39° north latitude and 139–141° east longitude) was subdivided into 576 rectangular grids of 5′ × 5′ resolution (9.25 km × 9.25 km for each grid at the equator) for a basin-scale simulation of H08. A global river network map created using the river-routing model CaMaFlood was used for the simulation process [31,32], and a downscaling process was used to generate a 5 arc-min resolution river network map of the study area, and then the map data were converted into an H08-supported binary format (steps (a) and (b) in Figure 1).

2.2.2. Preparing Meteorological Data

This section refers to steps (c) and (d) of Figure 1. For the purposes of simulation in the H08 model, nine meteorological variables were used as the input. These meteorological datasets are a hybrid of ground-observation-based data and temporally high-resolution reanalysis data. For 2018, data were collected from the WATCH Forcing Data (WFD) by making use of the ERA-Interim reanalysis data [33]. The meteorological data were generated on a global scale at daily intervals with a 0.5° × 0.5° resolution grid, which was downscaled to the study area grid size and a 5-min resolution. For 2019, however, reanalysis data from the JAXA simulation system called Today’s Earth were used, and the JRA-55 experiment (baseline scenario) was selected. Table 1 lists all the required input data for the simulation process of the H08 model, with their sources.

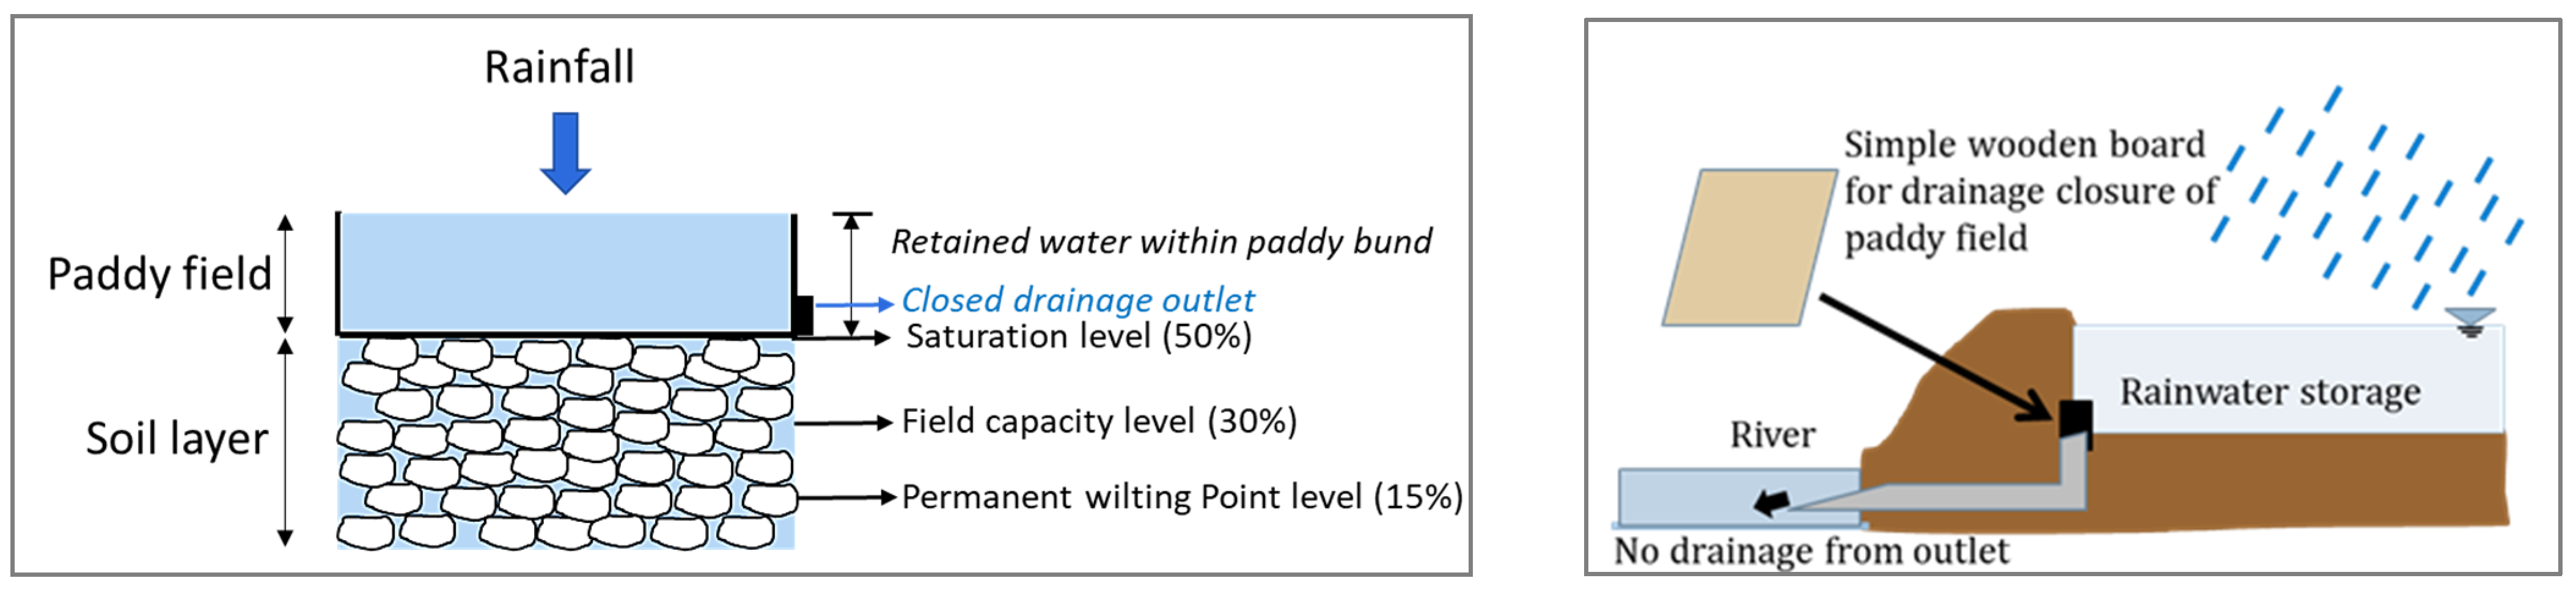
2.2.3. Land Surface Process Module

Using the above-mentioned input data, this module was used to calculate the water and energy balance on the land surface at a daily scale, where the computation was based on the principles of the “bucket” model [34]. The calculation process was modified from the original bucket model: the sub-surface runoff calculation was included in the process of the total runoff generation, and thus, the modified model was named the “leaky bucket” model [35]. This principle considers the continuous soil moisture, where the sub-surface runoff can be considered equivalent to soil percolation [23]. Evaporation was calculated using other formulae, and the soil heat balance (calculated using albedo) was also involved. However, along with all the basic parameterization schemes, the calculation methods for the surface and sub-surface runoff from H08 were mainly used for this research. Base flow determination using the surface and subsurface runoff and groundwater recharge parameters led to the total runoff, which was used in the next module of H08.

2.2.4. River Module

The river module of the H08 model is based on the concept of the Total Runoff Integrating Pathways model (TRIP) [36,37]. This module used the total runoff as the input data, along with the river network from the digital river map of the CaMaFlood model. Accumulating the runoff, this module generated discharge, which was used for the model calibration (step (e) of Figure 1), and also for the comparison of two scenarios, where one was the control scenario, with no storage of water within the paddy field, and the other was a scenario in which rainwater was stored in the exiting paddy embankment.

2.3. Model Calibration and Validation

The land-surface process module sub-model has four adjustable parameters. Two of these, the soil depth (SD) and bulk transfer coefficient (CD), are sensitive to surface runoff. The other two are the time constant for the daily maximum sub-surface runoff (τ) and the shape parameter, which sets the relationship between the sub-surface flow and soil moisture (Ɣ), and these are sensitive to sub-surface runoff [25]. Therefore, these parameters were selected for calibration purposes in this study, as shown in step (f) of Figure 1. Four values were selected from the plausible range of these parameters, and different variations of these values were used to check the model performance by assessing the Nash–Sutcliffe Efficiency (NSE) [38] in simulating river discharge for the year 2018, considering 2018 as a base year. Error calculation was conducted through a comparison between simulated daily and monthly river discharge and point-based observation records, which were collected from the MLIT database. The best set of values was selected, which showed the lowest error and closest simulation of river discharge compared to the observed values. A similar process has been used to calibrate the H08 model in several previous studies [25,26,28]. The calibrated parameter sets were validated in five other locations in the middle stream and downstream sections of the river basin (step (g) in Figure 1), under the assumption that the soil conditions and other characteristics were similar across the total watershed. The NSE values were checked to assess the effectiveness of the model in the Abukuma basin. Another performance analysis index, the coefficient of determination, also known as R2, was checked at the calibration and validation stations to check the reliability of the model as well.

2.4. Paddy Reservoir Impact Assessment through Model Improvement

In calculating the runoff, the soil moisture makes a major contribution, and this parameter played a significant role in our present methodology for determining the impact of a paddy reservoir strategy. In the current H08 model, it is assumed that the soil moisture must exceed the field capacity level in order to generate overflow and runoff. The field capacity (FC) and permanent wilting point (PWP) levels of the soil are 30% and 15% saturation of the soil pore volume, respectively. However, when the drainage outlets of the paddy fields are closed, the field functions like a reservoir. Stored water within this reservoir increases the soil moisture content until it reaches the saturation level, which is 50% of the pore volume since half of the soil layer volume is filled with soil particles and biomass [35]. Figure 3 demonstrates the concept of water retention in H08 in a paddy reservoir, along with the schematic diagram of the proposed paddy reservoir through the drainage outlet closure.
In a default scenario when there is no water storage in the field, the following relation will hold: volumetric soil moisture content = the soil depth × moisture difference between the field capacity and the permanent wilting point. However, in a saturated soil scenario, the moisture content will be calculated from the difference in the moisture between the saturation (50%) and the permanent wilting point (15%), according to the conceptual understanding. Therefore, the surface and sub-surface runoff calculations, which are driven by the soil moisture content, will be modified for the new condition in the case with paddy reservoirs. Additionally, more water storage is available over the ground within the paddy field embankment. This will also contribute to the moisture-holding capacity and subsequent runoff calculation. To summarize, additional water storage is available for the rainfall to be stored, and runoff will only occur when the storage capacity is fulfilled and overflow occurs from the paddy reservoir. Thus, the storage capacity now becomes: {soil depth × (50% − 15%)} + paddy field embankment height.
Using a global-scale study with the H08 model [39] as a reference, it was assumed that the paddy field is present in a simulation grid cell as a medium-sized reservoir. Based on the location of paddy fields in the river basin, the percentage of areal coverage in each grid cell was calculated, and the total runoff from each grid cell was determined from both the paddy field and the non-paddy area. To calculate the percentage of paddy field (step (h) in Figure 1), the river basin area was measured from the basin area shape file, and the paddy field area was calculated from the land use data. The land surface module of H08 was modified by calculating the soil moisture and additional capacity (step (i) in Figure 1). Then, the total runoff and river discharge were simulated for the case of water storage within the paddy reservoirs and compared to the default scenario of no paddy reservoir discharge to determine the peak reduction during the period from October to December (steps (j) and (k) in Figure 1). This simulation and comparison were performed for several different geographical locations of the river basin, in the upstream, middle stream, and downstream sections. Then, the total runoff and discharge were also simulated for five different precipitation amounts, which were created from several percentages of rainfall from 2019′s Typhoon Hagibis (step (l) in Figure 1). The peak discharge reductions for these scenarios were calculated by comparing the “with” and “without” paddy field scenarios.

3. Results

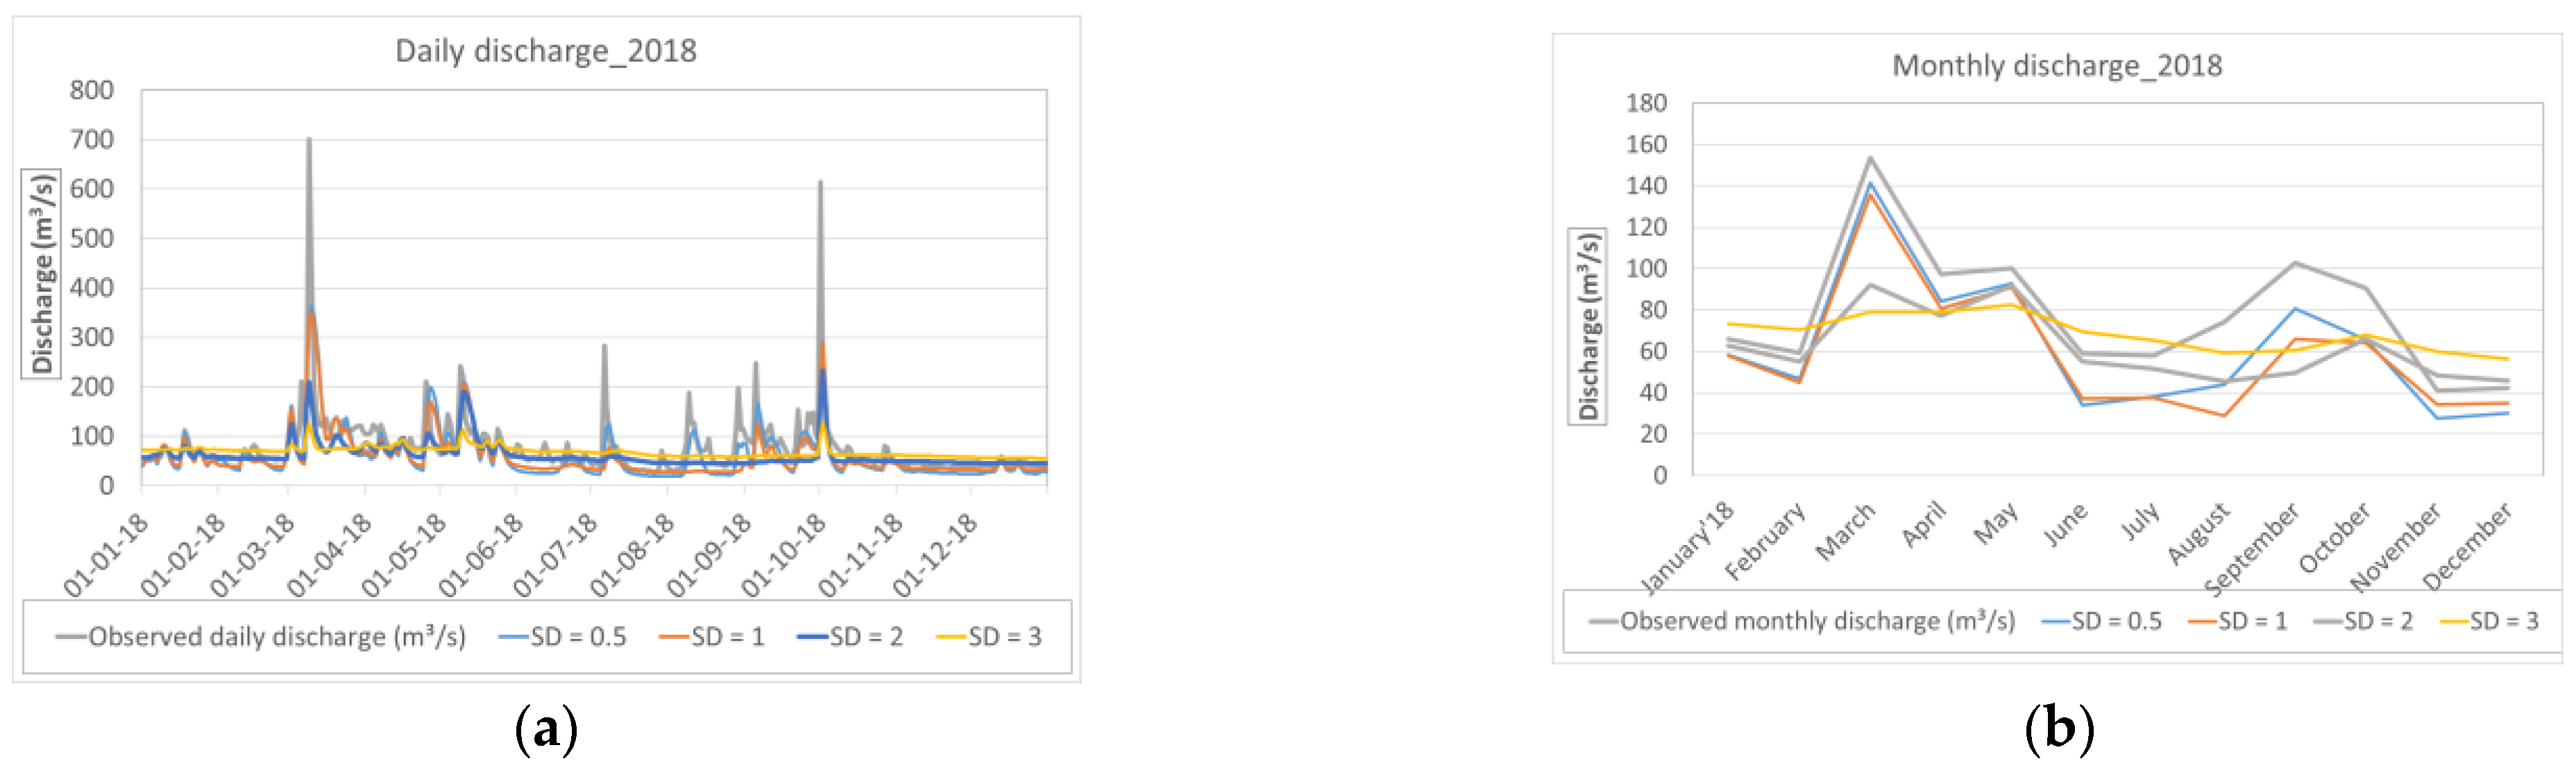
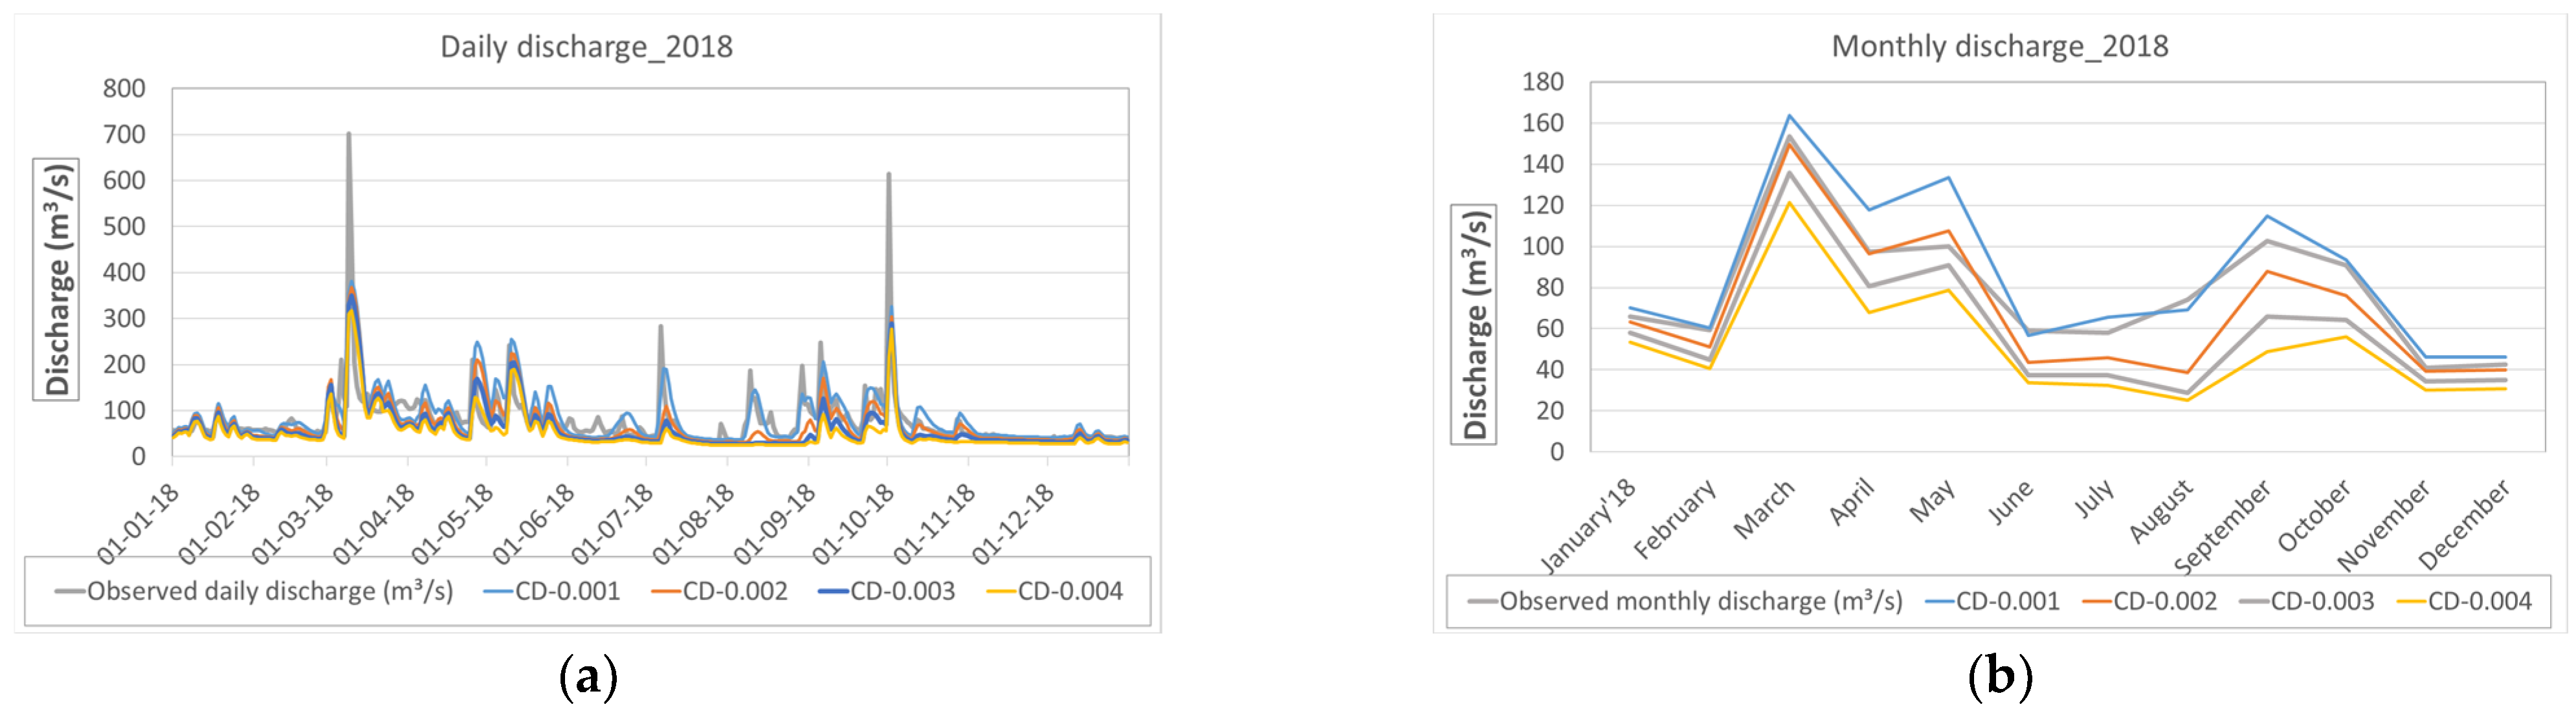
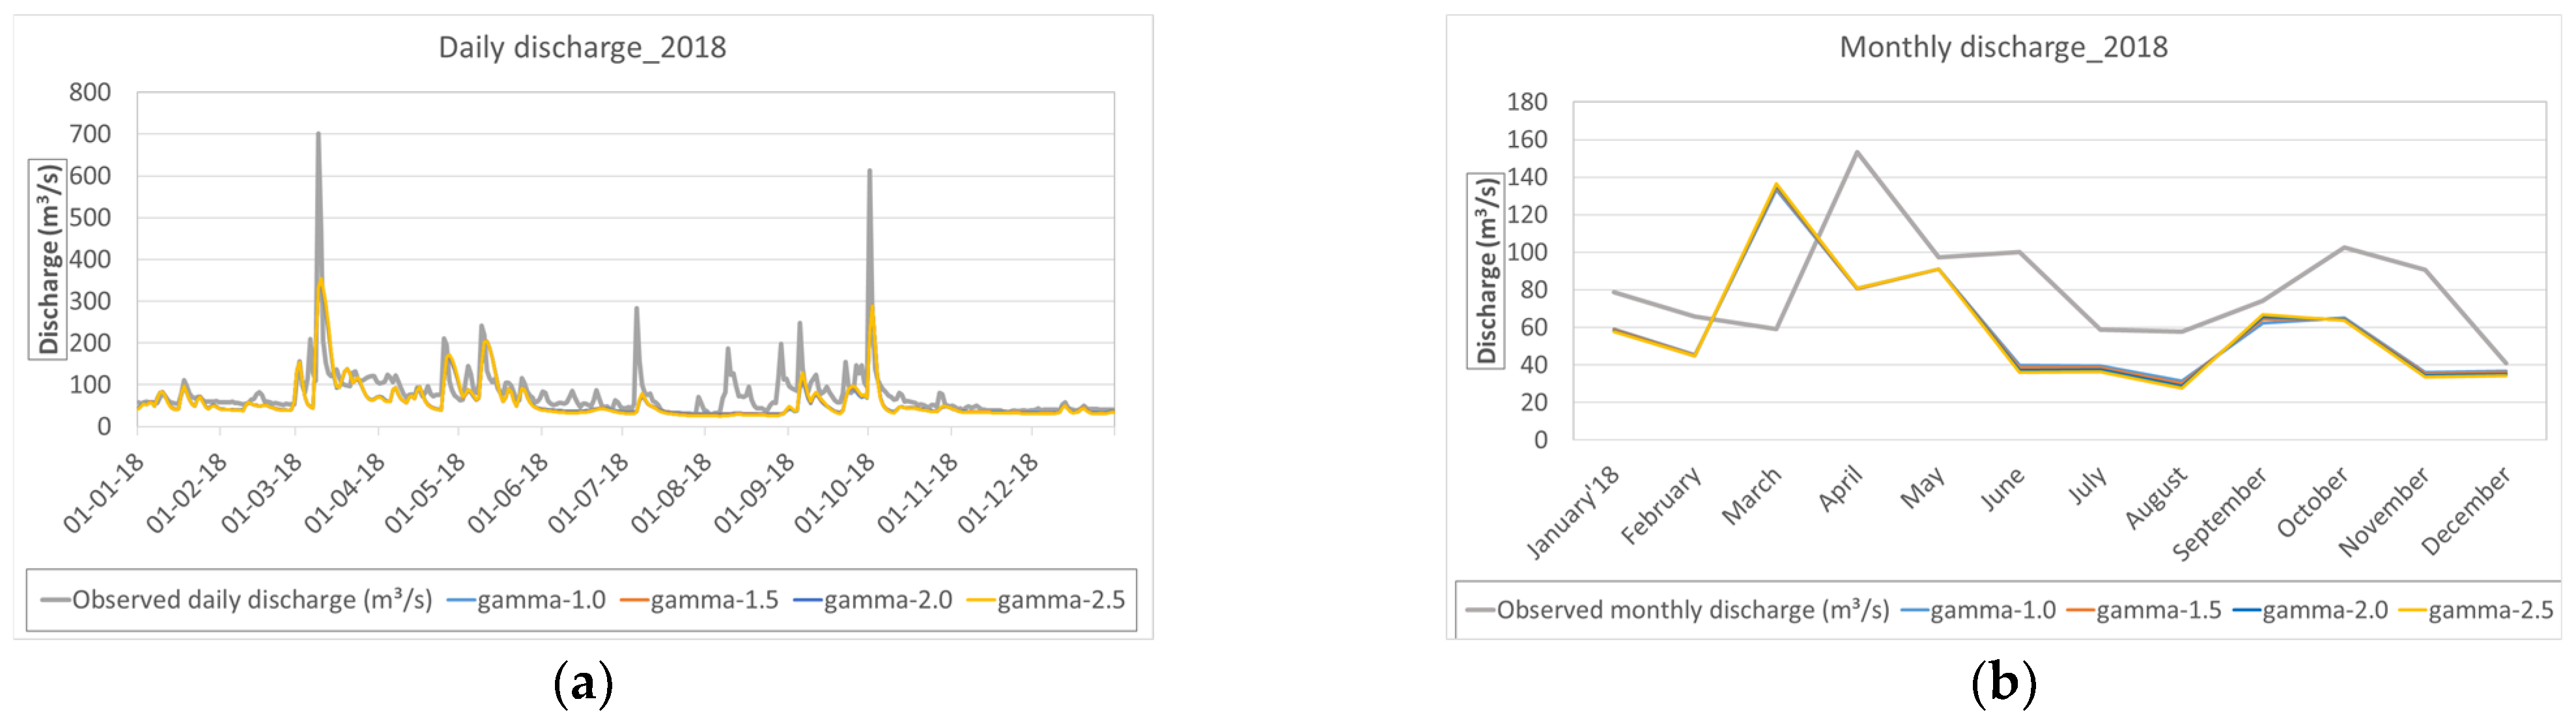
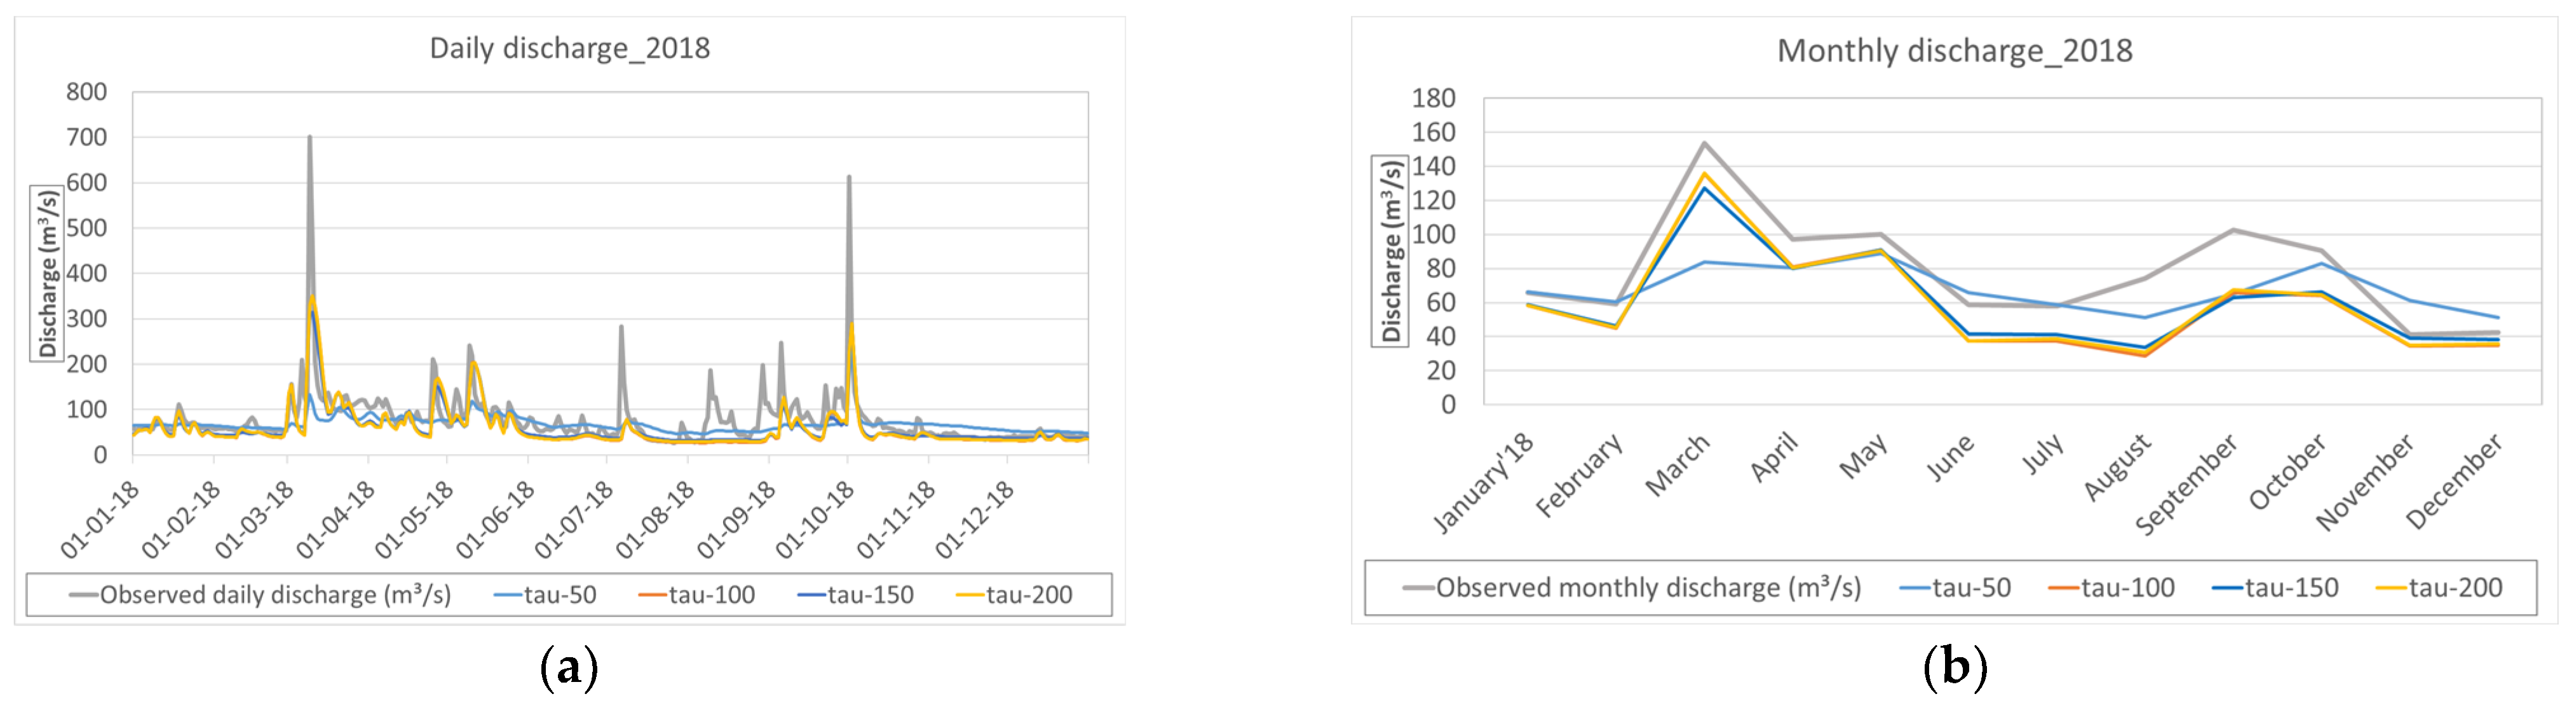
3.1. Calibration Parameter Sensitivity Analysis

The best parameter values showing the lowest NSE values are listed below in Table 2, with their trial ranges.
Changing the value of each calibration parameter of H08 resulted in different behaviors and sensitivity, based on the observations of the simulated discharge. In the earlier part of 2018, increasing the soil depth (SD) decreased the surface runoff but increased the sub-surface runoff, finally resulting in a lower total runoff, while a largely opposite trend was observed during the latter part of the year. However, lowering the SD value resulted in better sensitivity and improved calibration. In the case of CD, a higher value caused increased evaporation and lower surface runoff, but the effect on the total runoff was small. In the case of changes to the values of τ and Ɣ, the impact was not clear from a visual inspection of the simulated discharge, so for these parameters, the best value was selected based on the NSE errors. Although the combined impact of changes to these parameters was complex, the SD was found to make the main contribution to controlling the sharpness of the discharge hydrograph. The changes to the simulated daily discharge for 2018 elicited by changing the value of each parameter are displayed in Appendix B (Figure A1, Figure A2, Figure A3 and Figure A4). It is important to note that this research was conducted for 2018, a year in which these hydrological parameters provided a certain set of values with low error percentages. In the case of a longer simulation period and larger study area with more observation data, these parameters could be vetted more rigorously for better calibration of the H08 model.

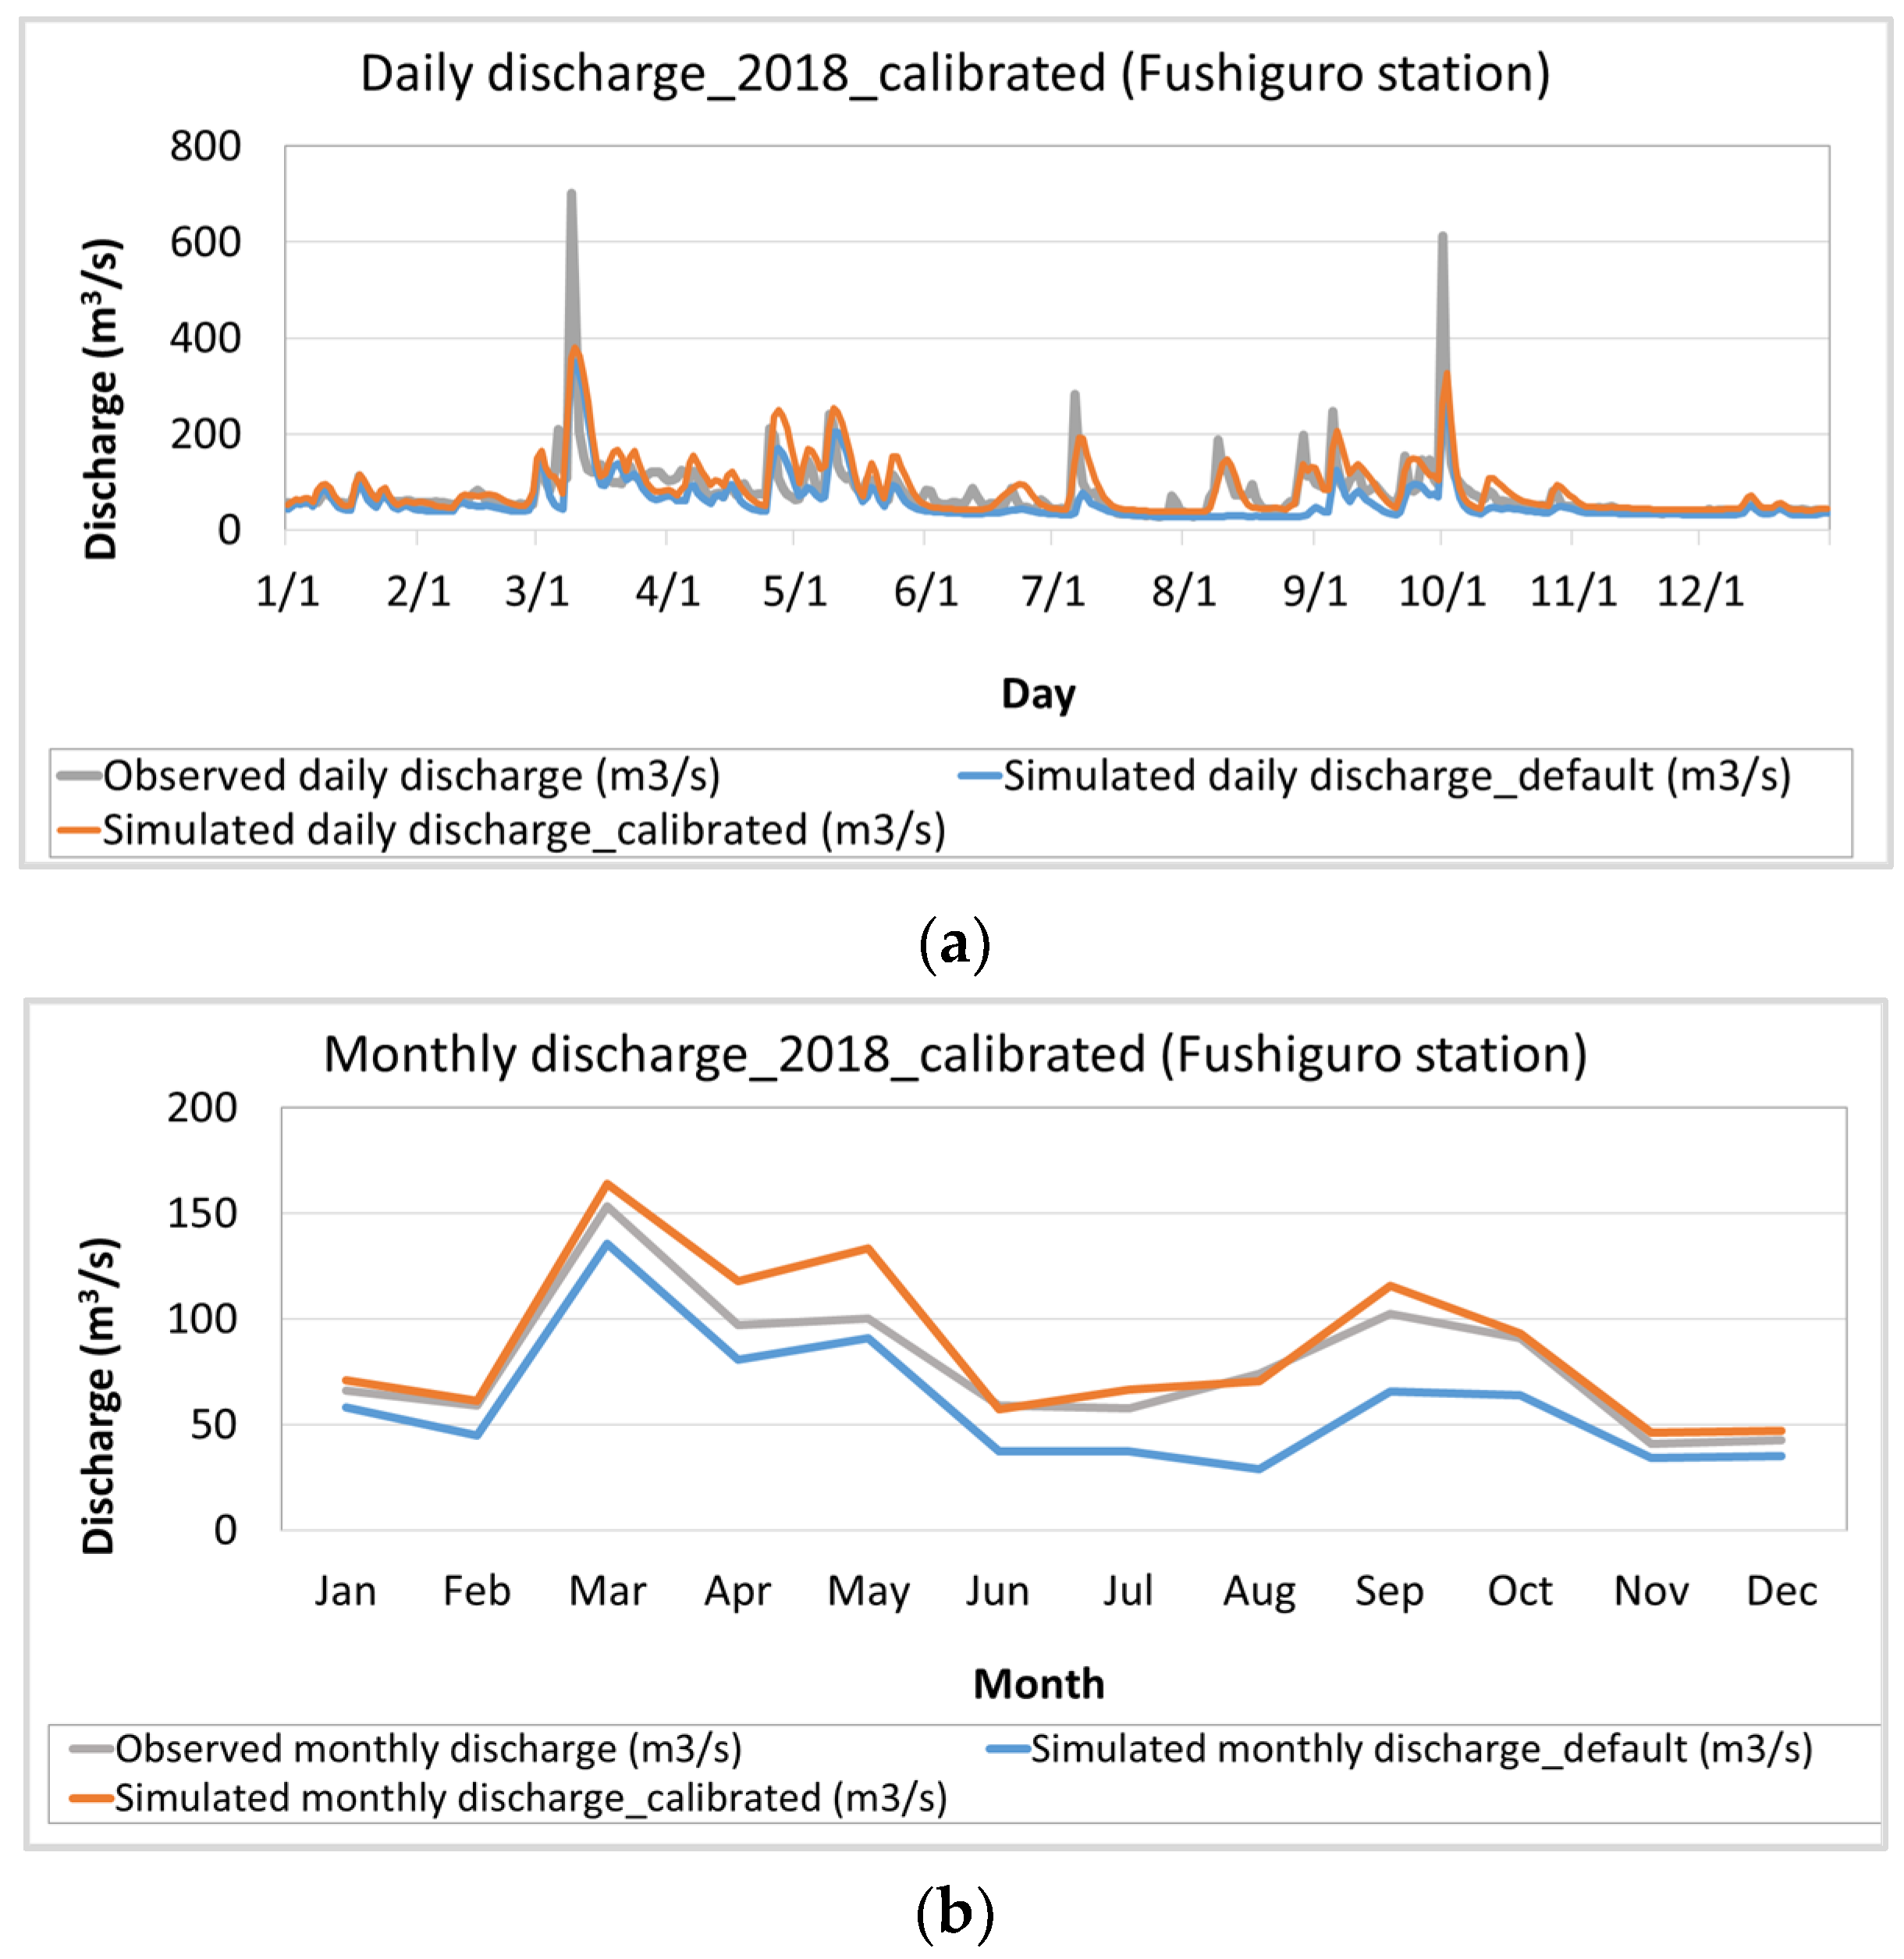
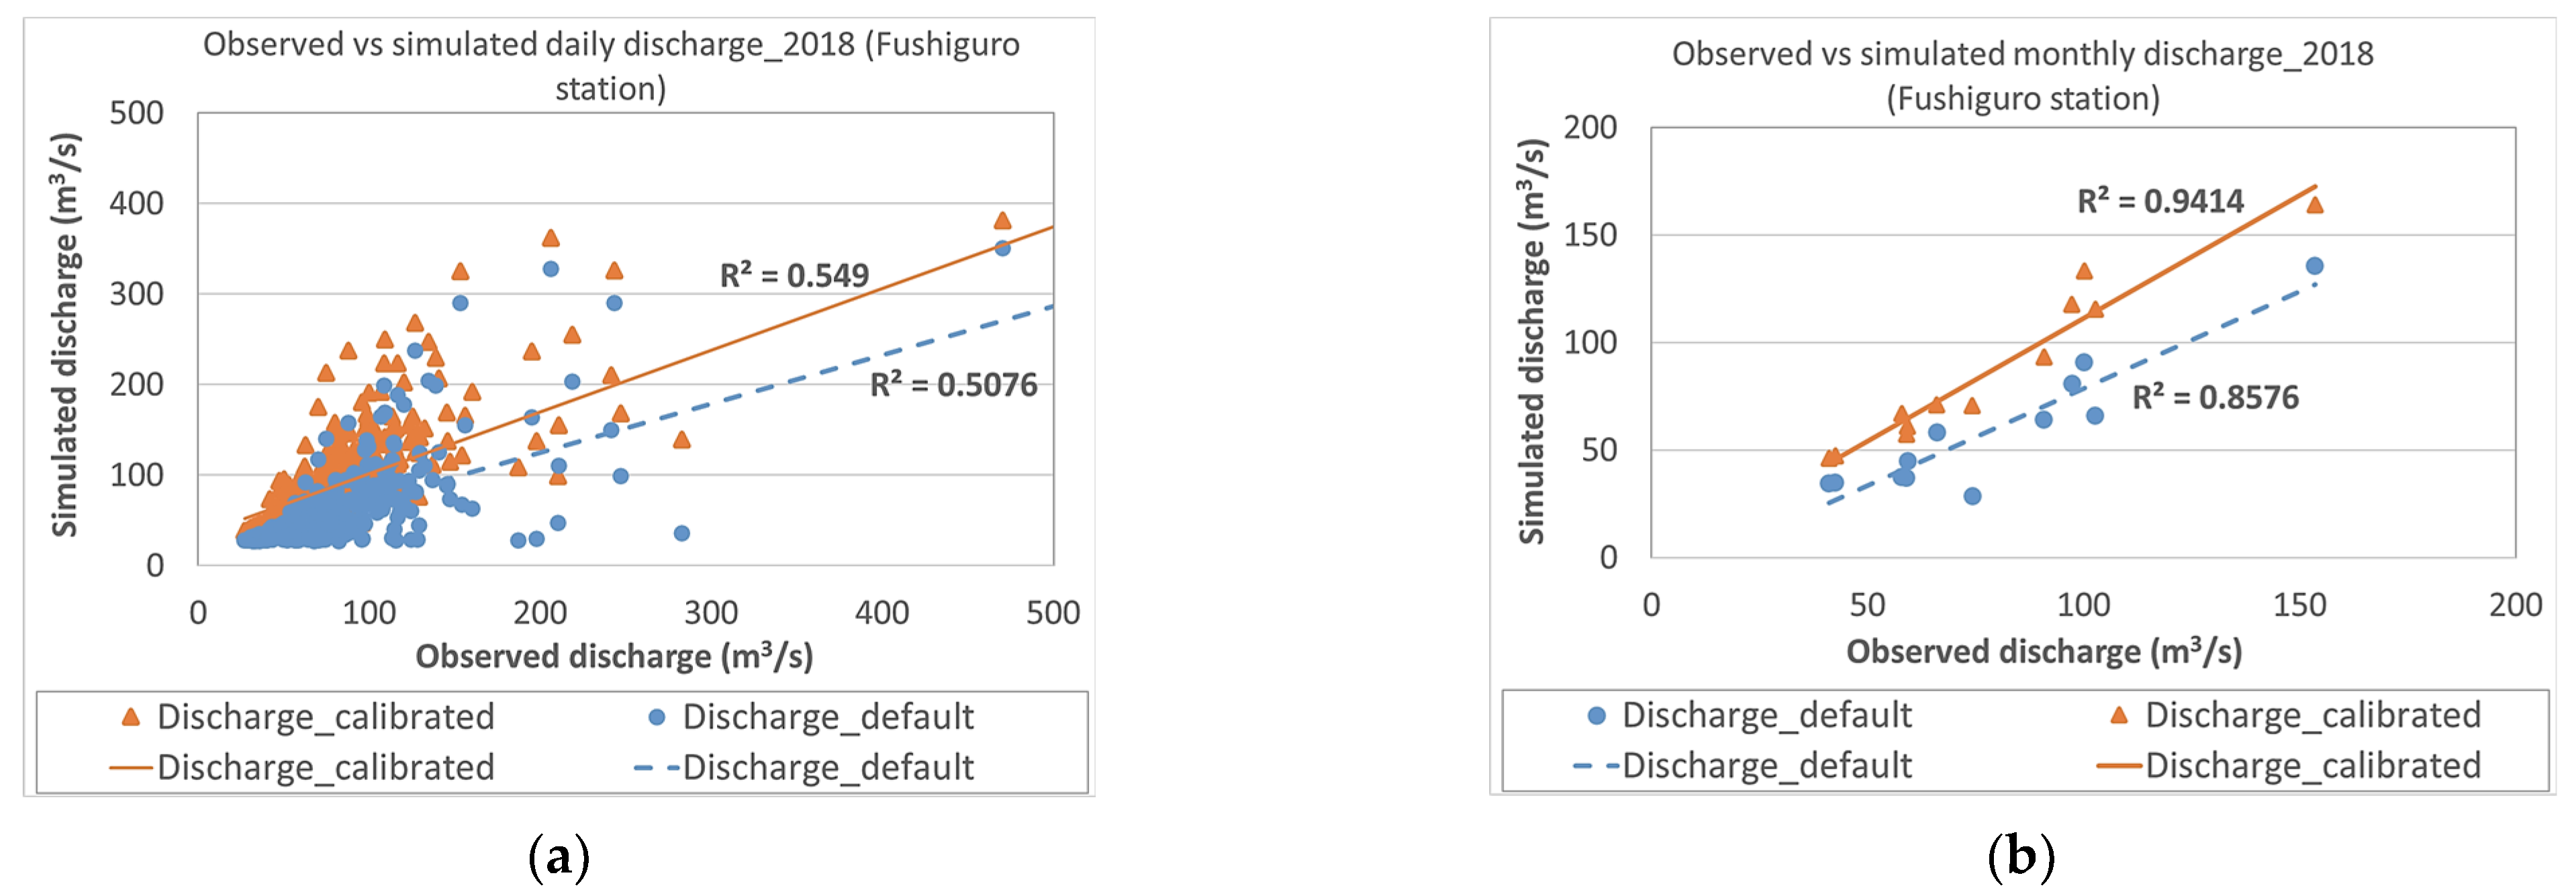
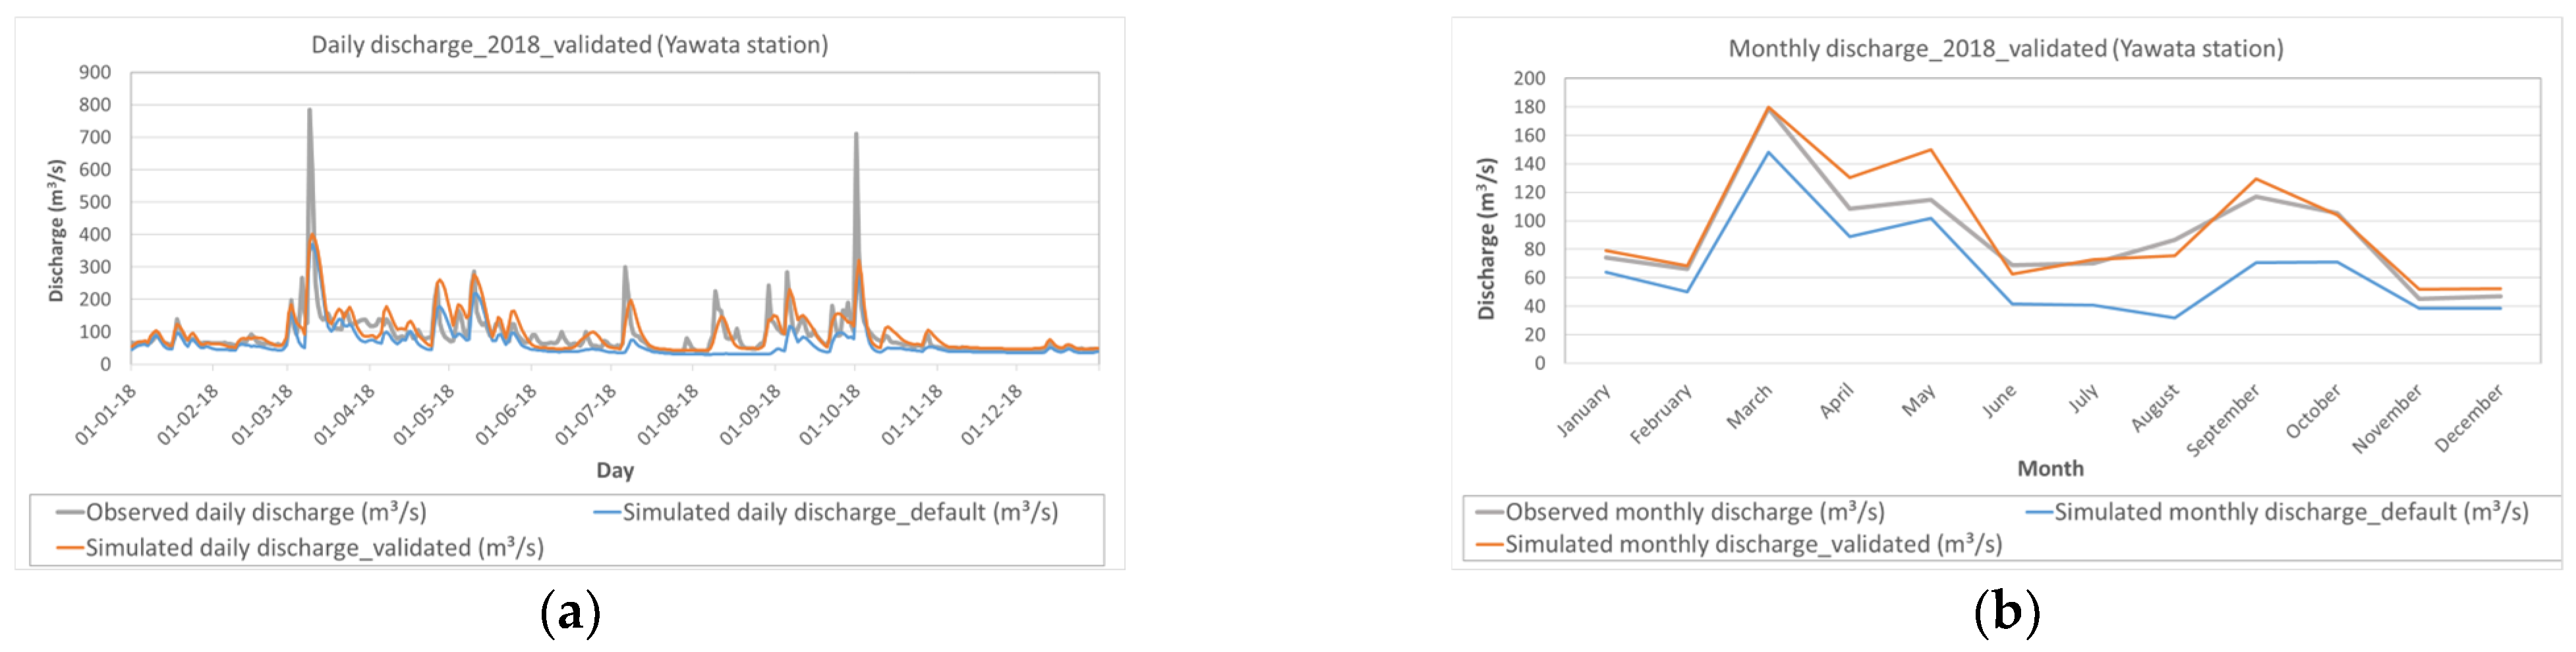
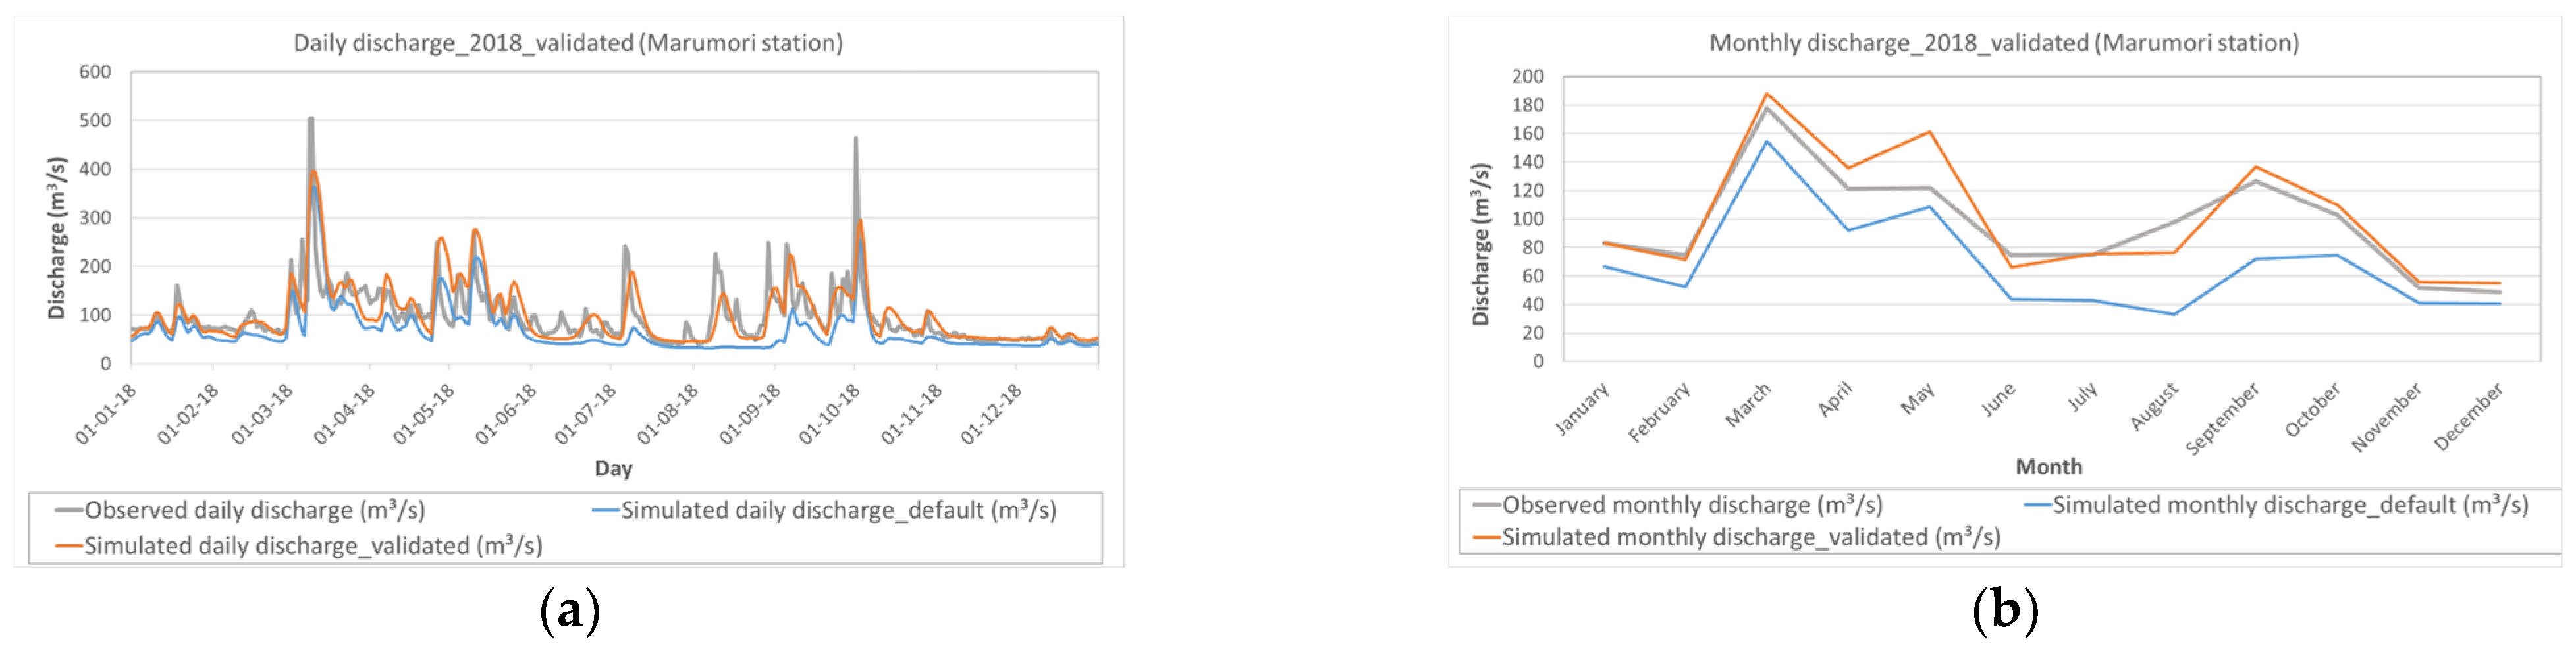
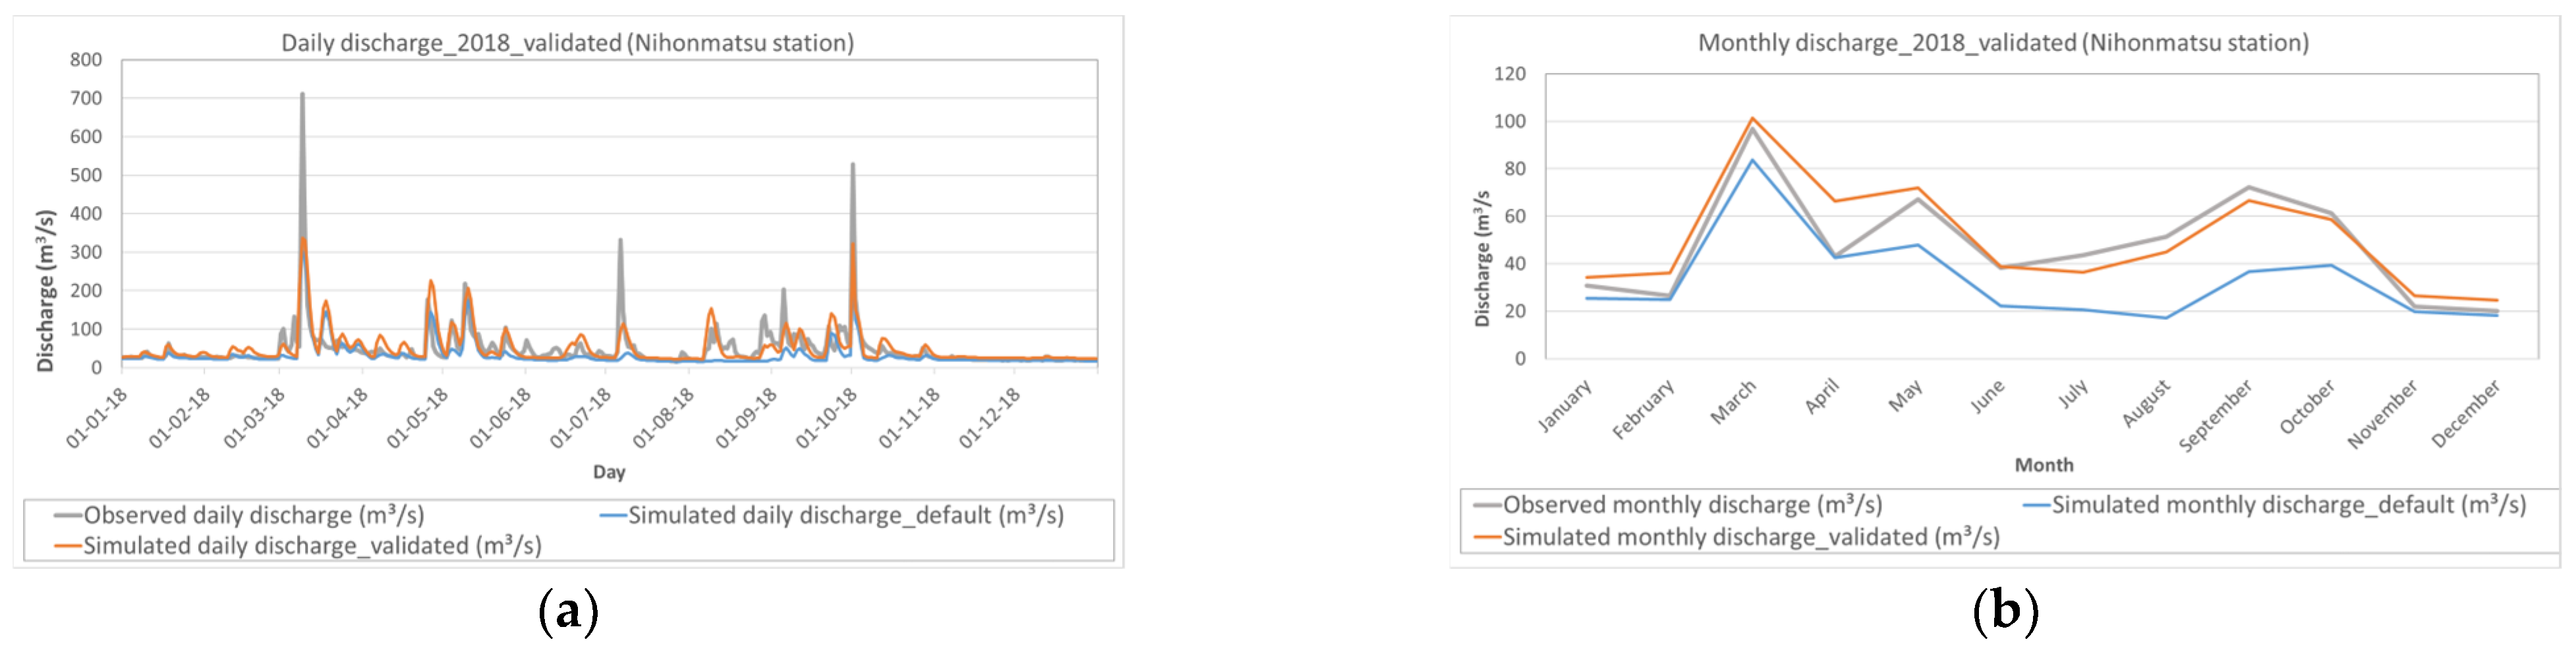
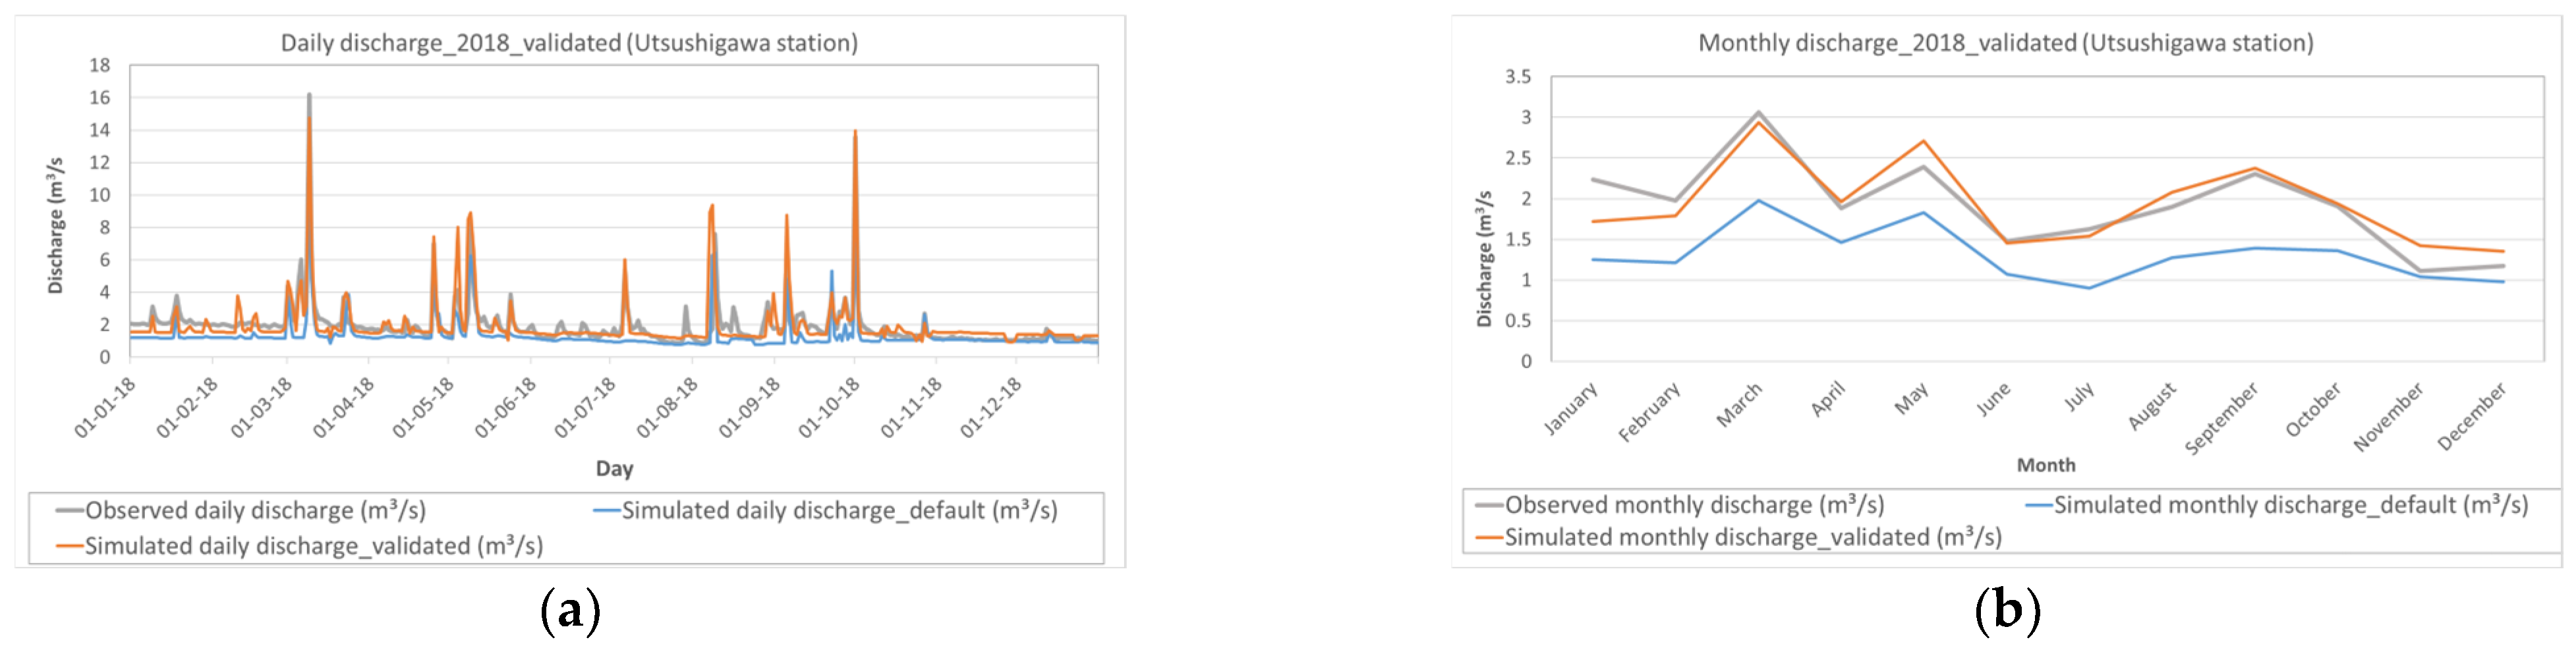
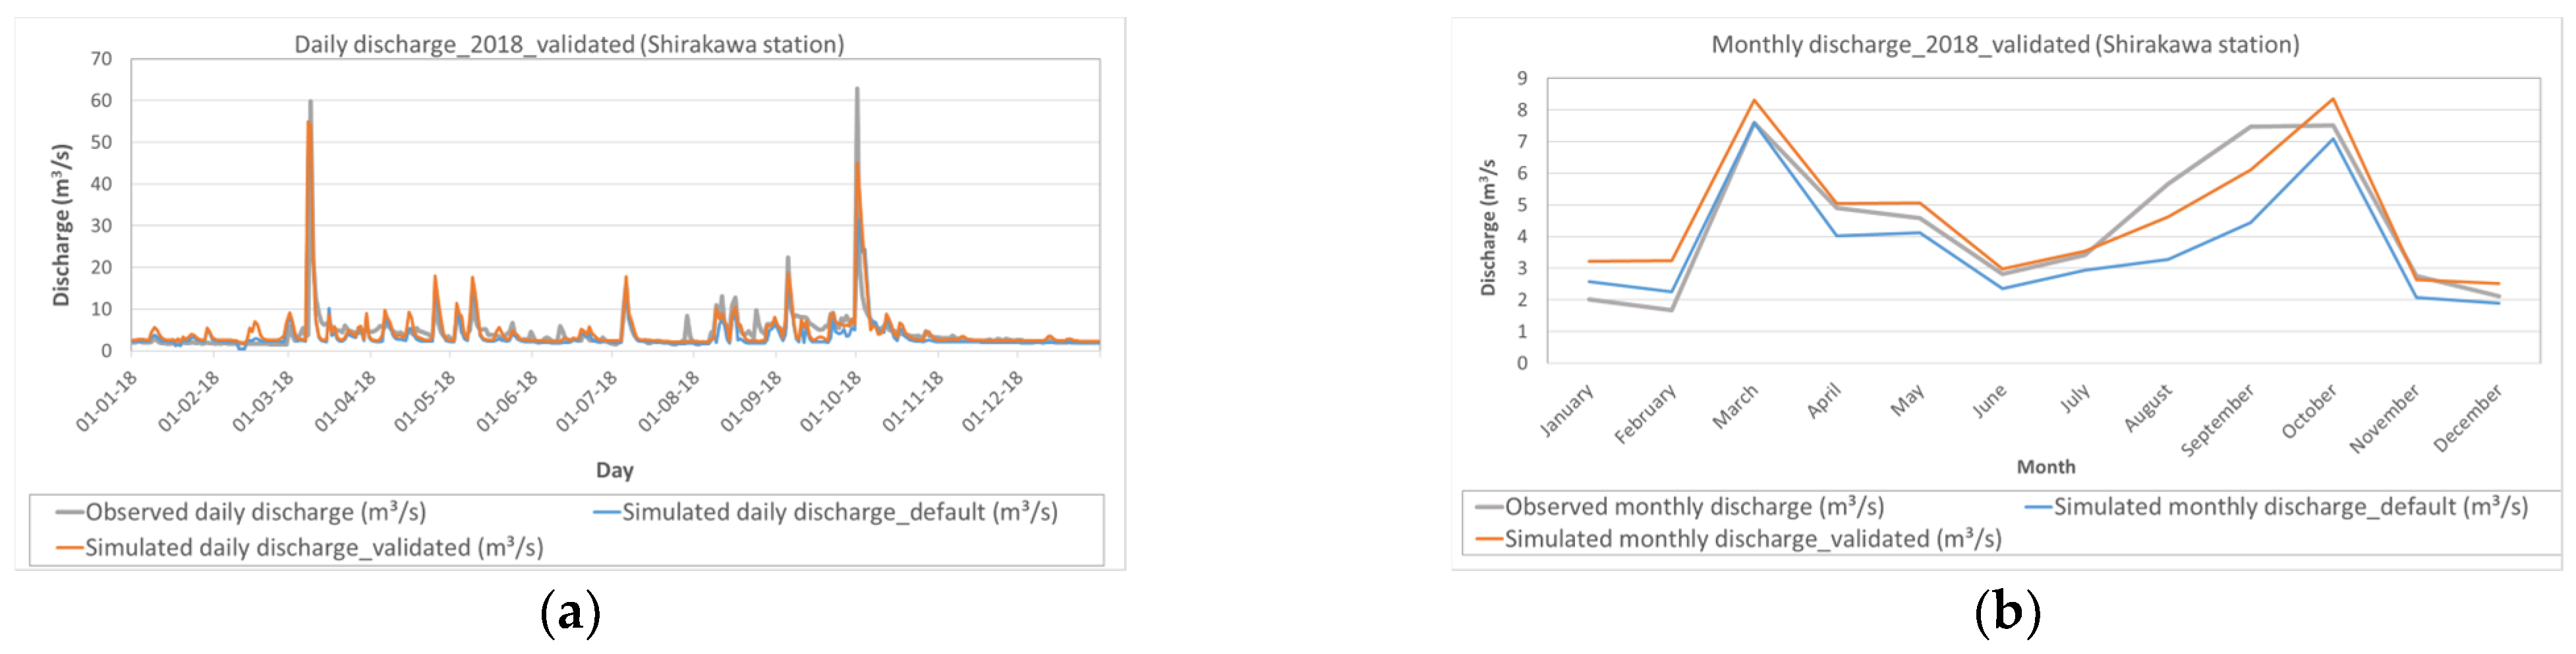
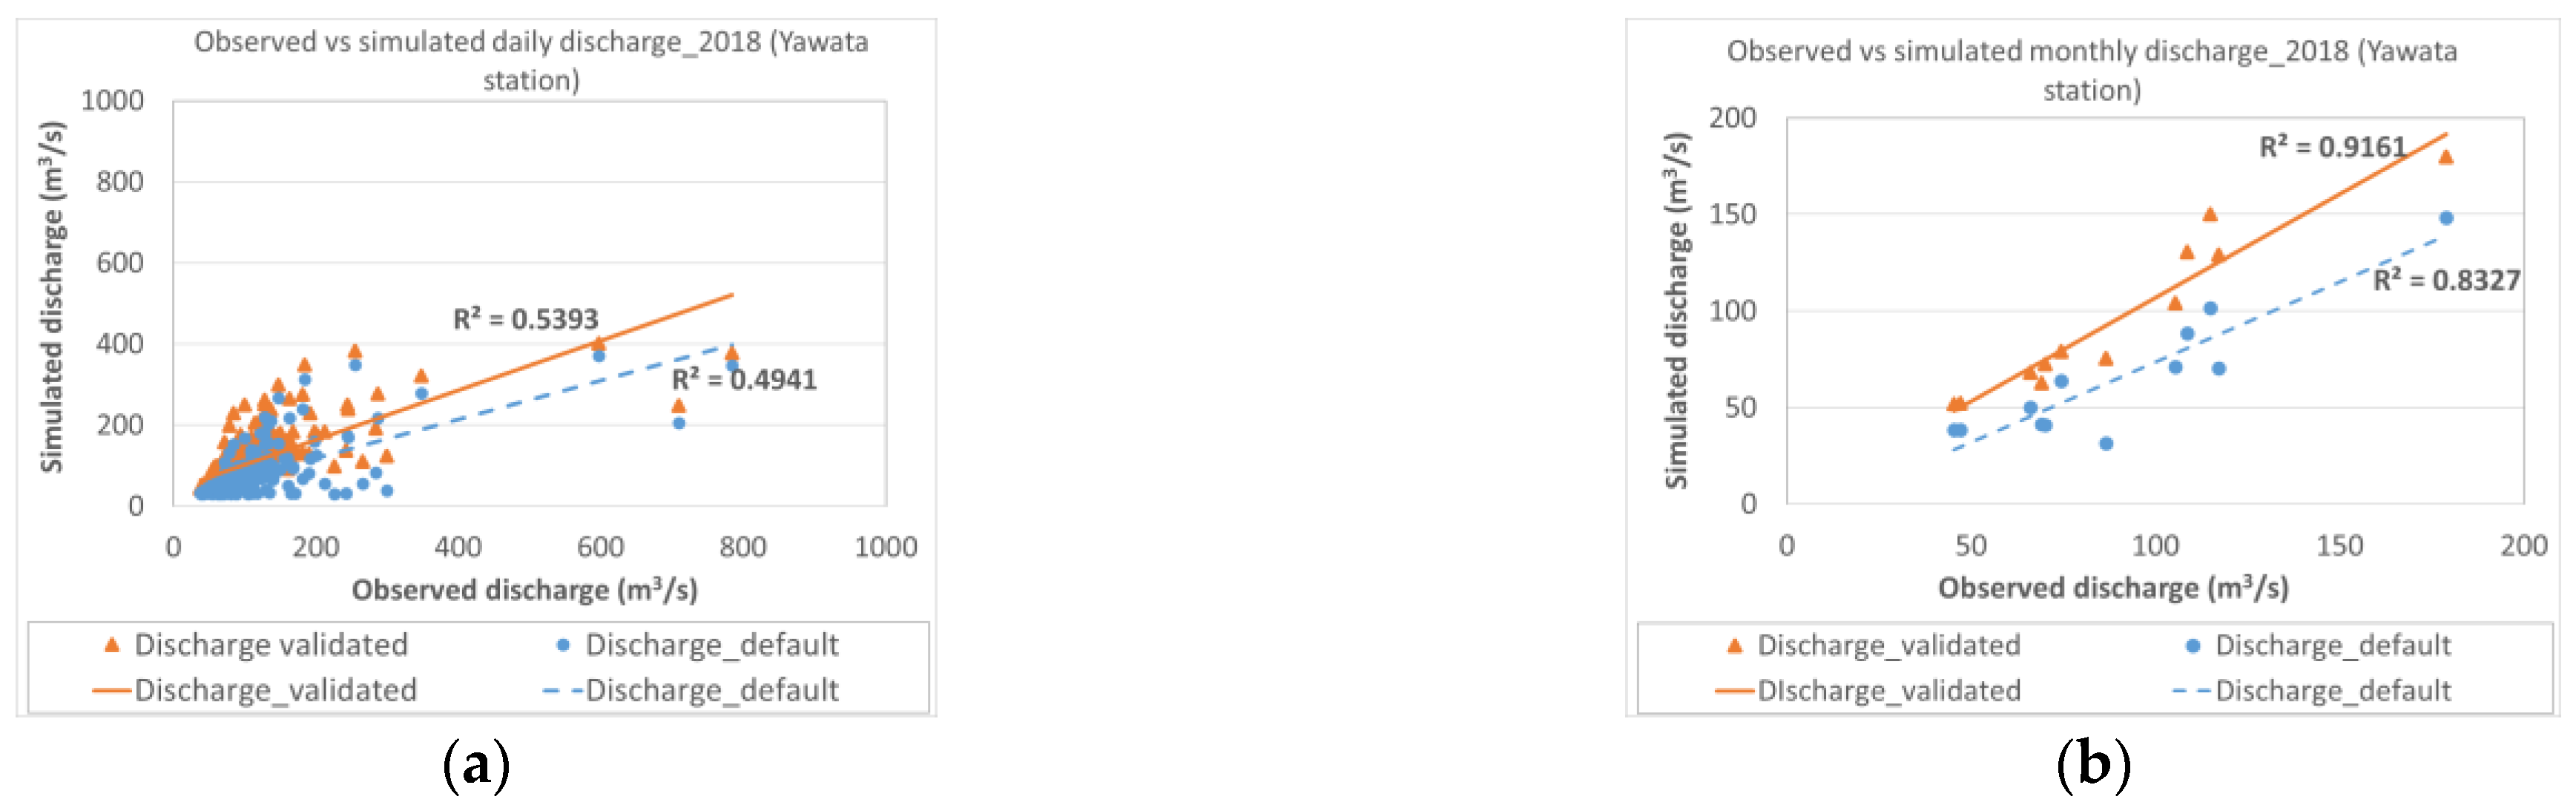
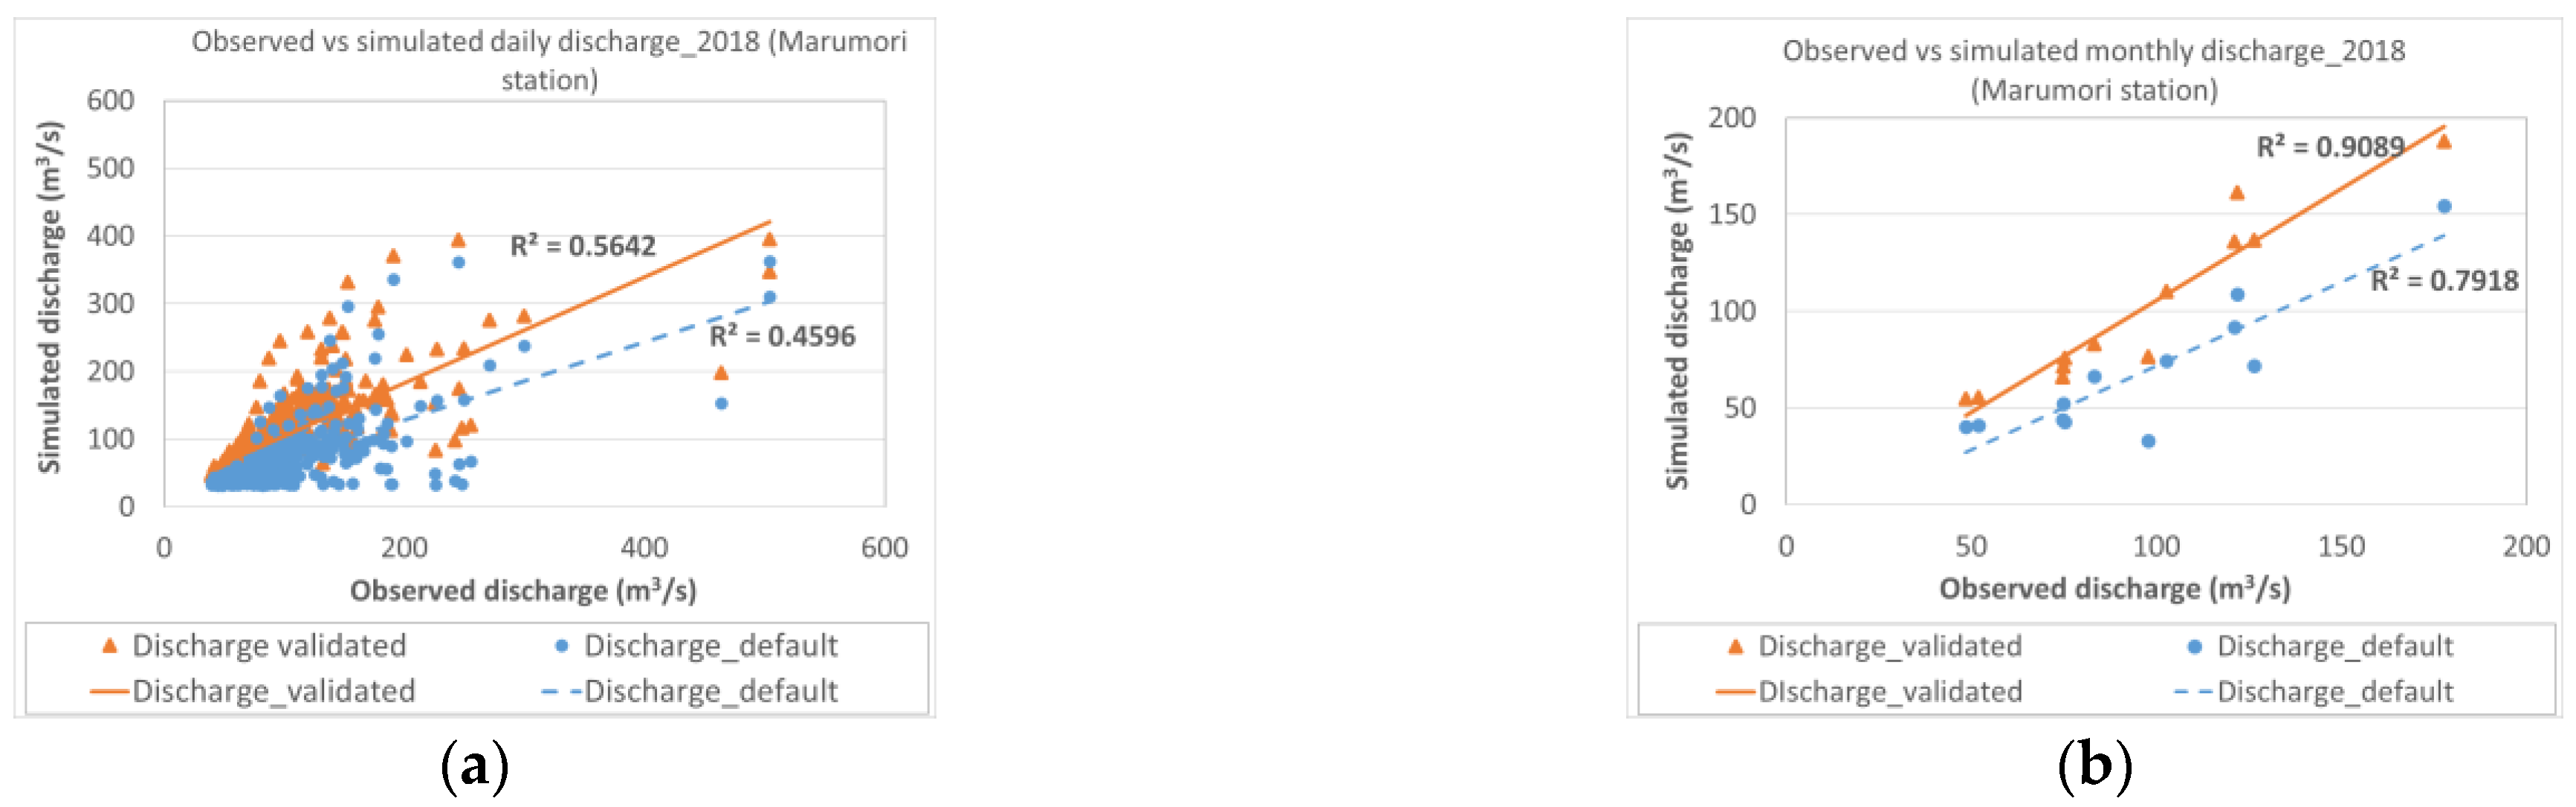
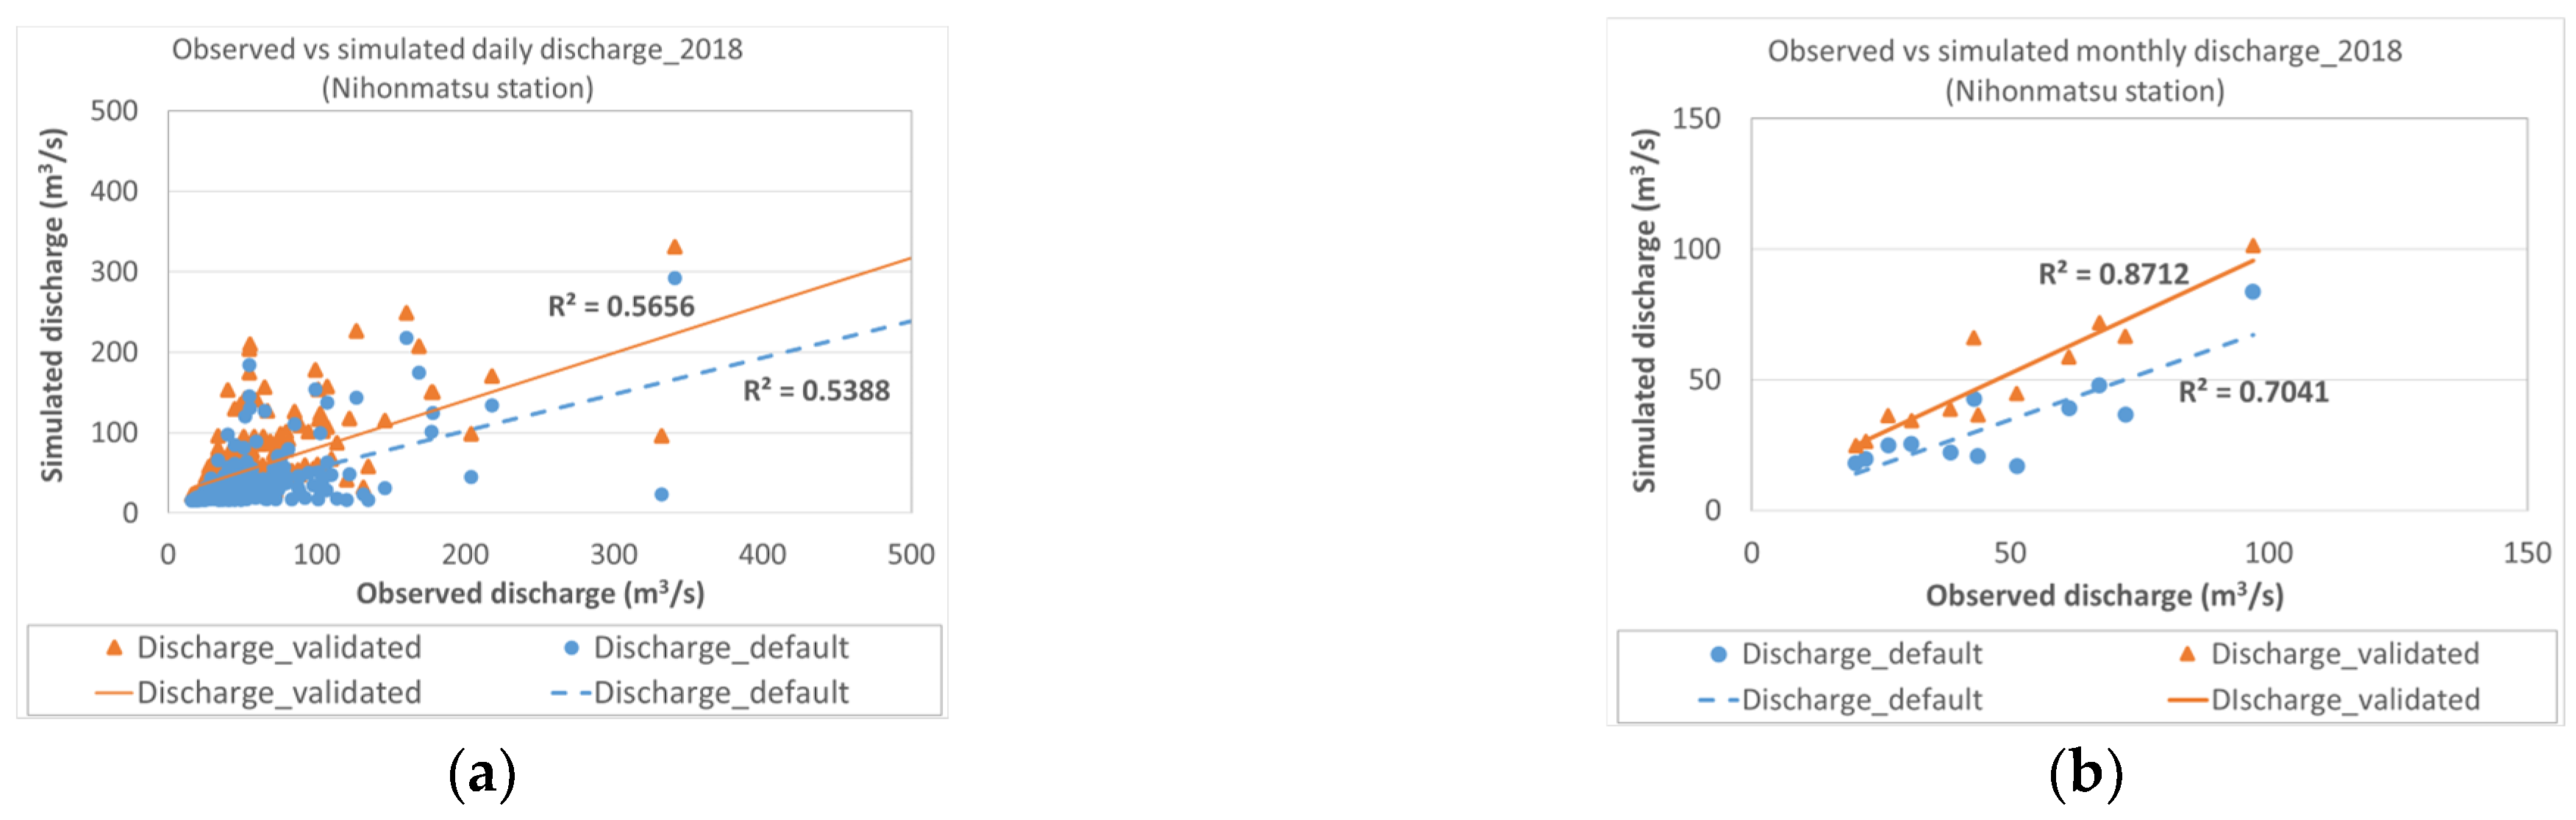
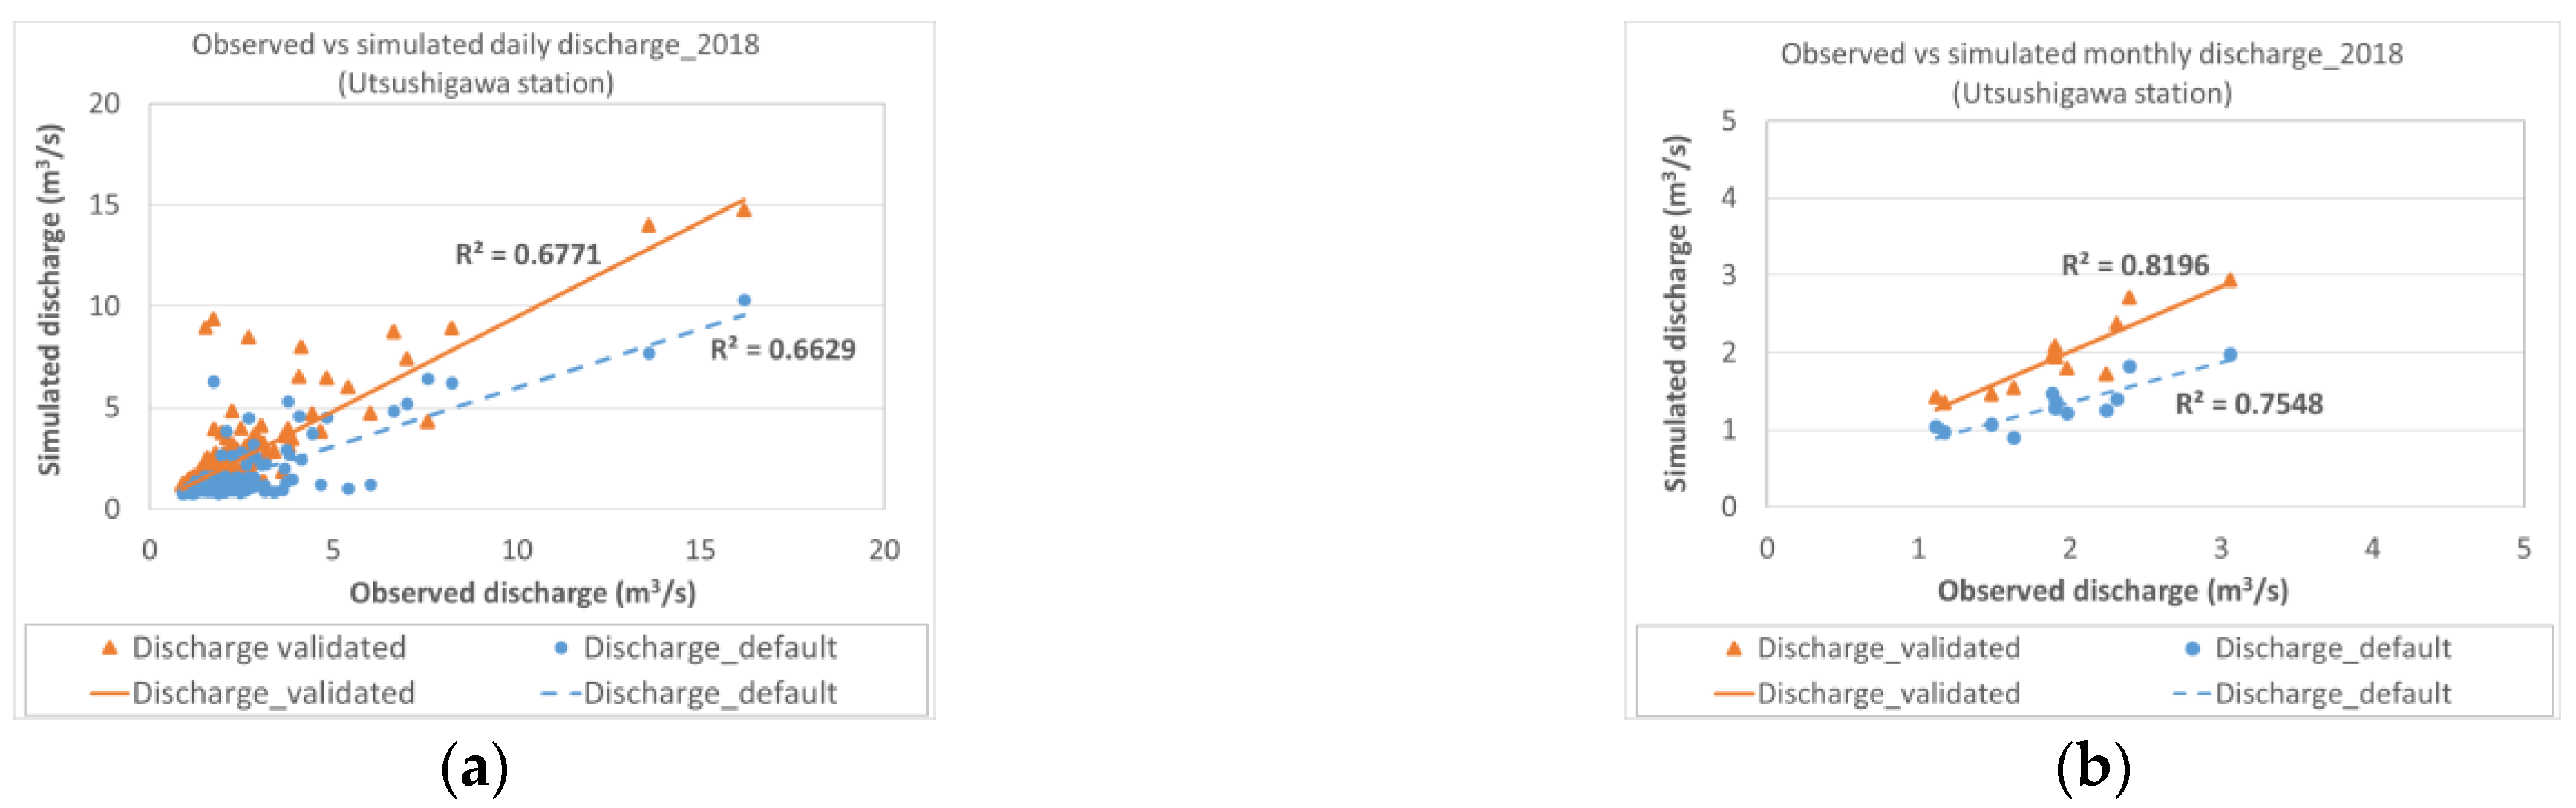
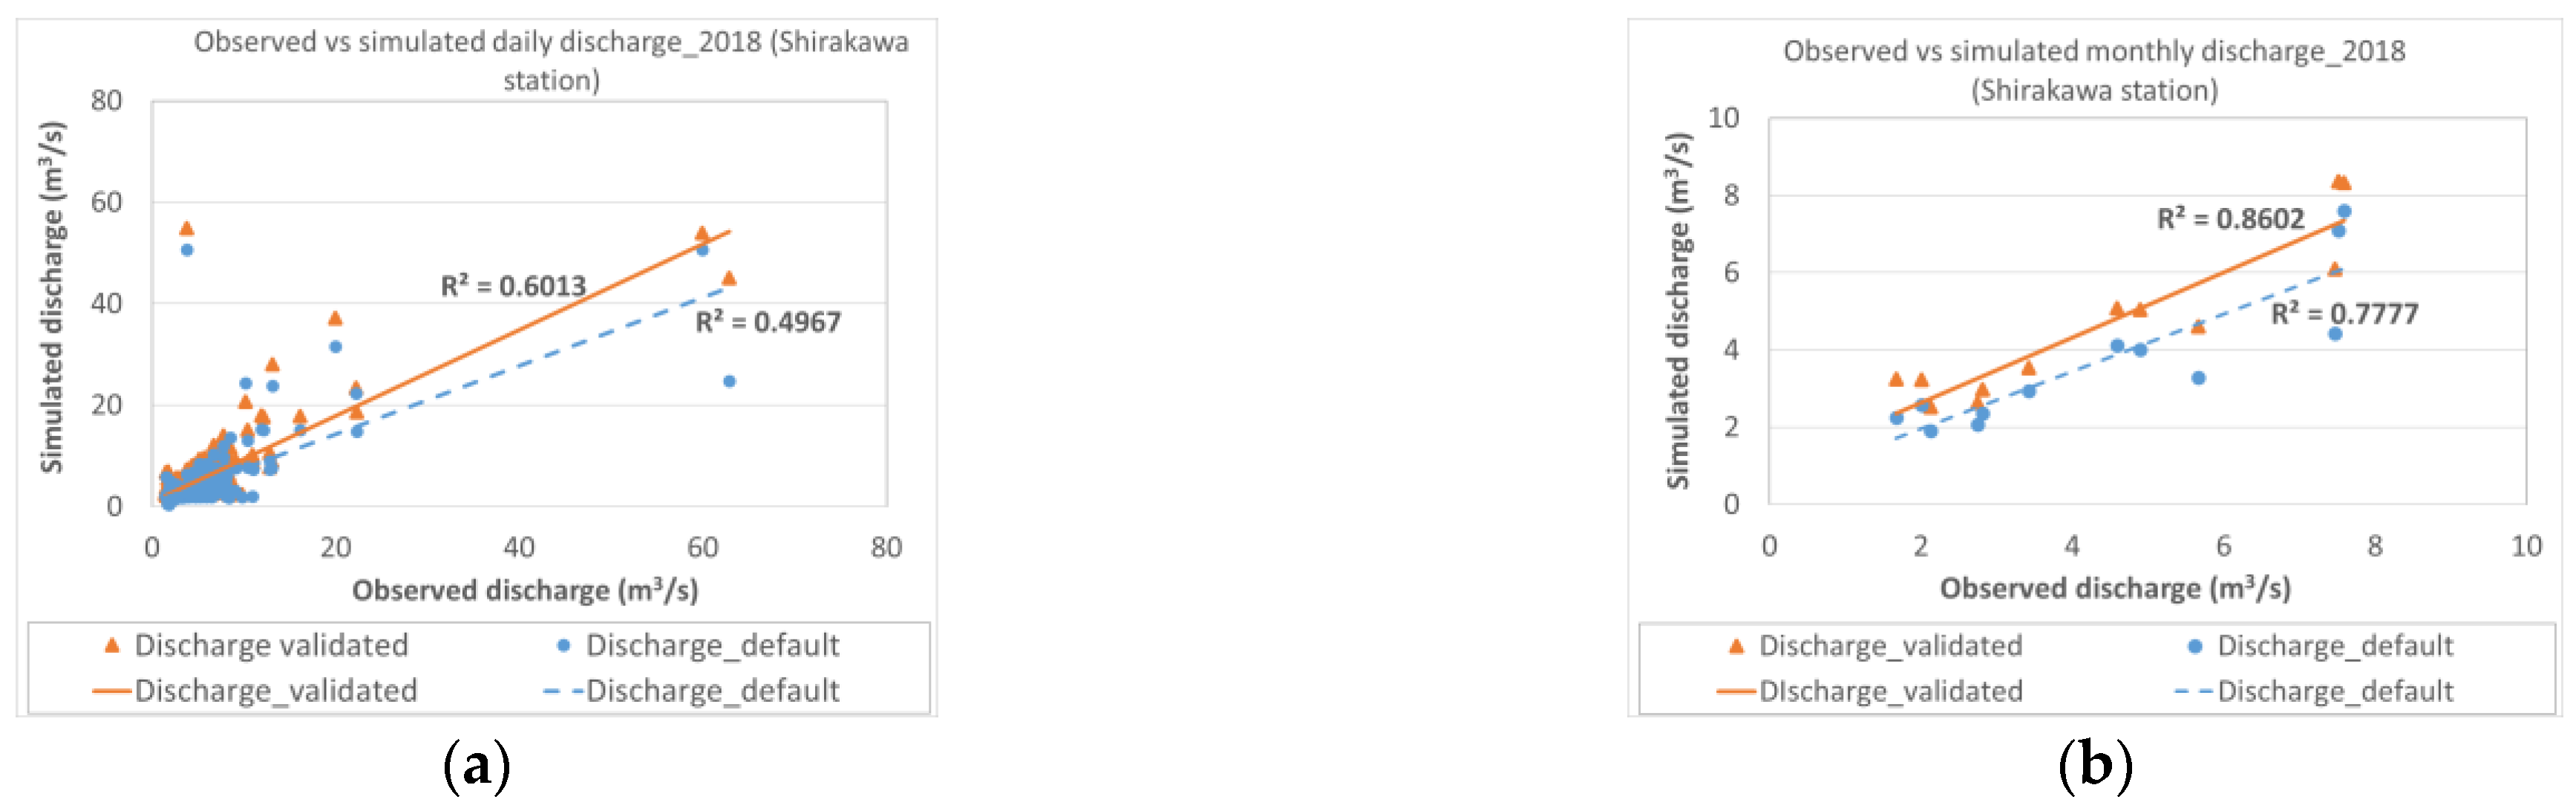
3.2. Model Performance in Calibration and Validation

After analyzing the error values, the following parameter combination was selected from among the 27 simulations: CD = 0.001 and τ = 200. A model calibration point was selected in the upstream section of the watershed, at Fushiguro Station (see Figure 2). Figure 4 shows the daily and monthly hydrographs simulated with the selected parameter values. By assessing the NSE on both a daily and a monthly scale, a considerable reduction in error was observed, as summarized in Table 3.
The model performance in simulating the observed discharge was also evaluated based on the R2 index. Figure 5 shows the scatterplots of the observed and simulated discharge at the daily and monthly temporal scales, and the improvement in the R2 index is summarized in Table 4.
For validation purposes, five other observation stations (see Figure 2) were selected in the midstream and downstream sections of the river watershed, and also in the branch river in the upstream section, where the error values were checked for daily and monthly scales. These hydrographs are provided in Appendix B (Figure A5, Figure A6, Figure A7, Figure A8 and Figure A9), while Table 5 shows the error performance improvement for the validation points. The R2 indices were also checked for these validation stations and are summarized in Table 6. Scatterplots for these stations are provided in Appendix B (Figure A10, Figure A11, Figure A12, Figure A13 and Figure A14). Similar to the model calibration, validation was conducted using the meteorological data of the year 2018.
The calibration of the H08 model yielded “satisfactory” performance in the daily-scale simulation and “good” performance in the monthly-scale simulation based on the standard NSE threshold [40] (0.5 < NSE ≤ 0.7 for “satisfactory” performance, and 0.7 < NSE ≤ 0.8 for “good” performance). Similar results were observed for the validation locations as well, as described in Table 5. In terms of the R2 index, the calibration and validation both yielded “satisfactory” performances in the daily-scale and “very good” performances in the monthly-scale simulations based on the standard threshold for the R2 in watershed-scale flow analysis [40] (0.5 < R2 < 0.7 for “satisfactory” performance, and R2 > 0.85 for “very good” performance). Both statistical parameters were used for the performance analysis of the watershed-scale H08 model [26,27,28], and these indices indicate that the model performed fairly after the adjustment of the calibration parameters. This calibrated and validated model was then used together with the modified runoff calculation method to simulate discharge under different water storage scenarios.
The temporal variation of simulated discharge on a daily scale was found not to capture the fluctuation of the observed values properly, whereas, on a monthly scale, the trend seemed to be closer to the observed values. The discrepancy could also be observed from the higher error values in the daily scale compared to the monthly one and a lower value of the R2 index. This difference could be explained by the fact that surface runoff is set to be generated only after exceeding the field capacity level (30% saturation) according to Equations (A2) and (A3) of the default H08 model (see Appendix A for details of the default H08 model). However, this may not be the case in reality, as during a heavy rainfall scenario, the infiltration can be a delayed process, during which the excess water can become surface runoff and travel towards the river, which can finally result in high discharge. Such a detailed hydrological process may not yet be properly captured by the H08 model simulated discharge, which could lead to greater discrepancies in the daily-scale compared to the monthly-scale simulation [25]. Moreover, in the case of global-scale studies, many uncertainties, including uncertainties in the meteorological forcing data, can be incorporated easily, as the scale of the dataset corresponds with the model resolution. However, when the global-scale data are downscaled to data for a single watershed, it becomes more difficult to simulate and reproduce the correct values on the smaller (daily) temporal scale. Model simulation results can be further improved through the bias correction of input forcing data; however, this type of correction was outside the purview of this research because it requires the analysis of statistical time series data for many observation points in the study area, which is a tedious process. Therefore, the focus was placed on assessing the impact of the paddy reservoir strategy in the study area through the hydrological analysis of the H08 model.

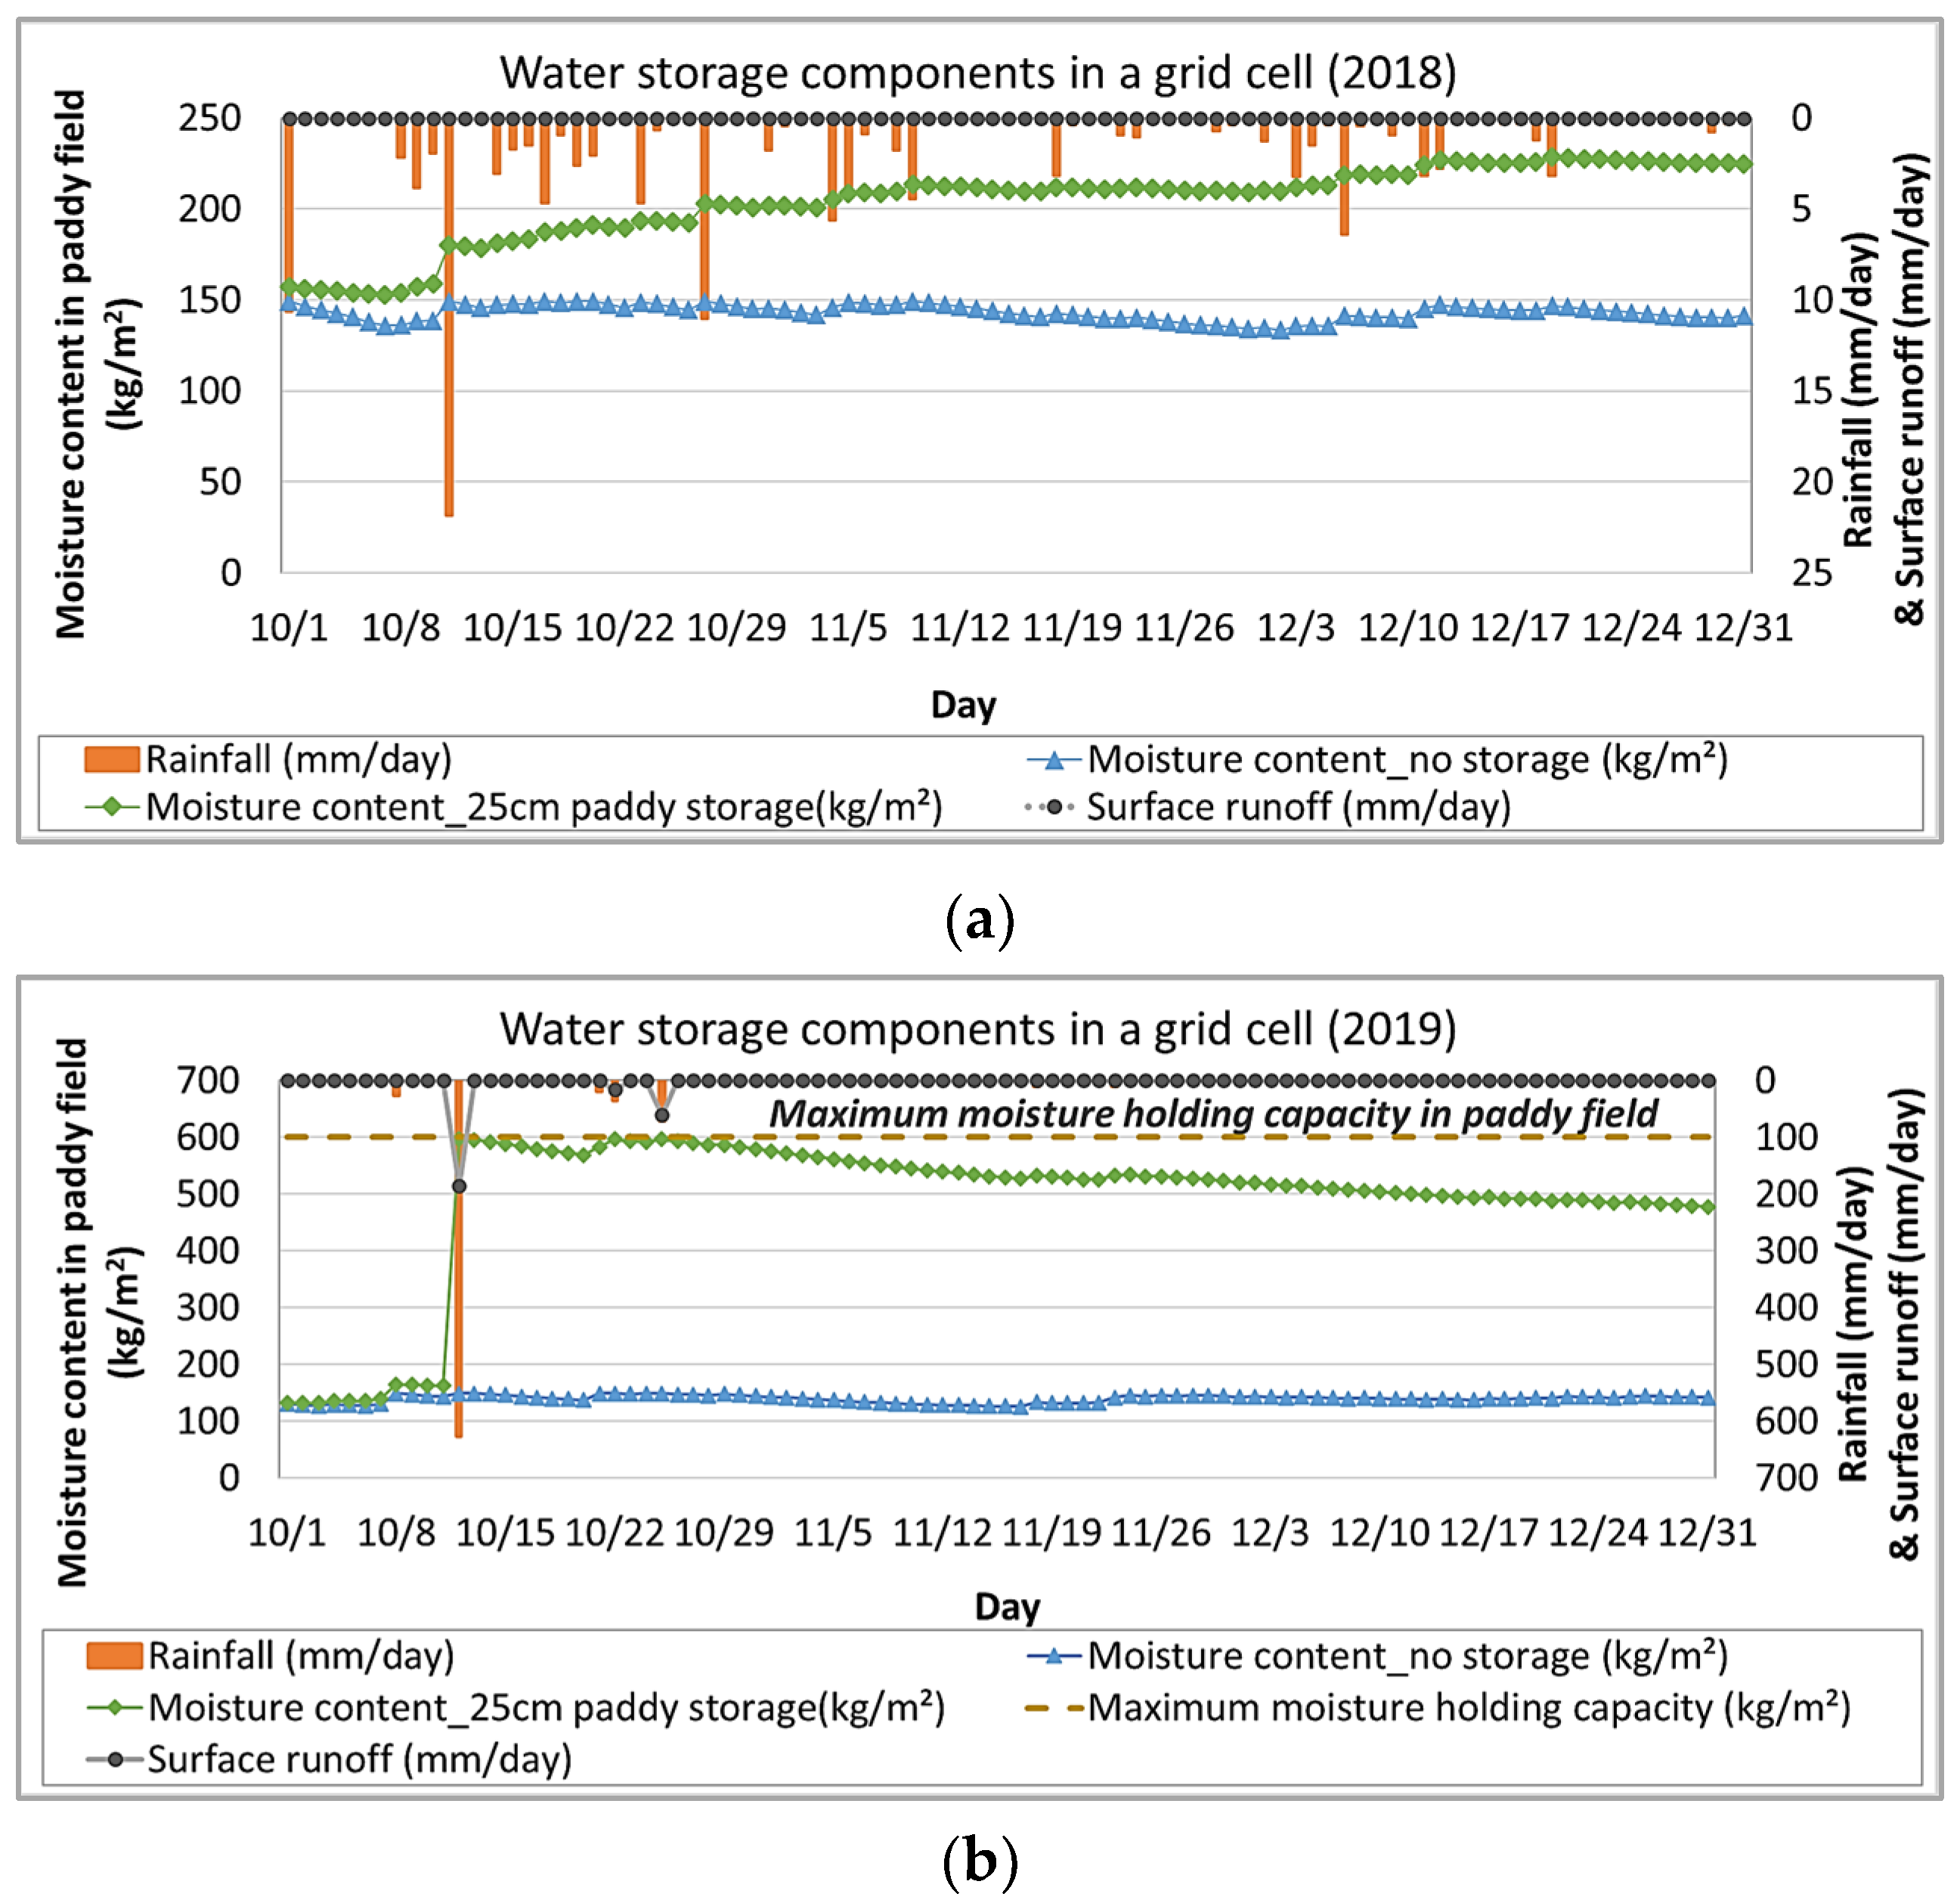
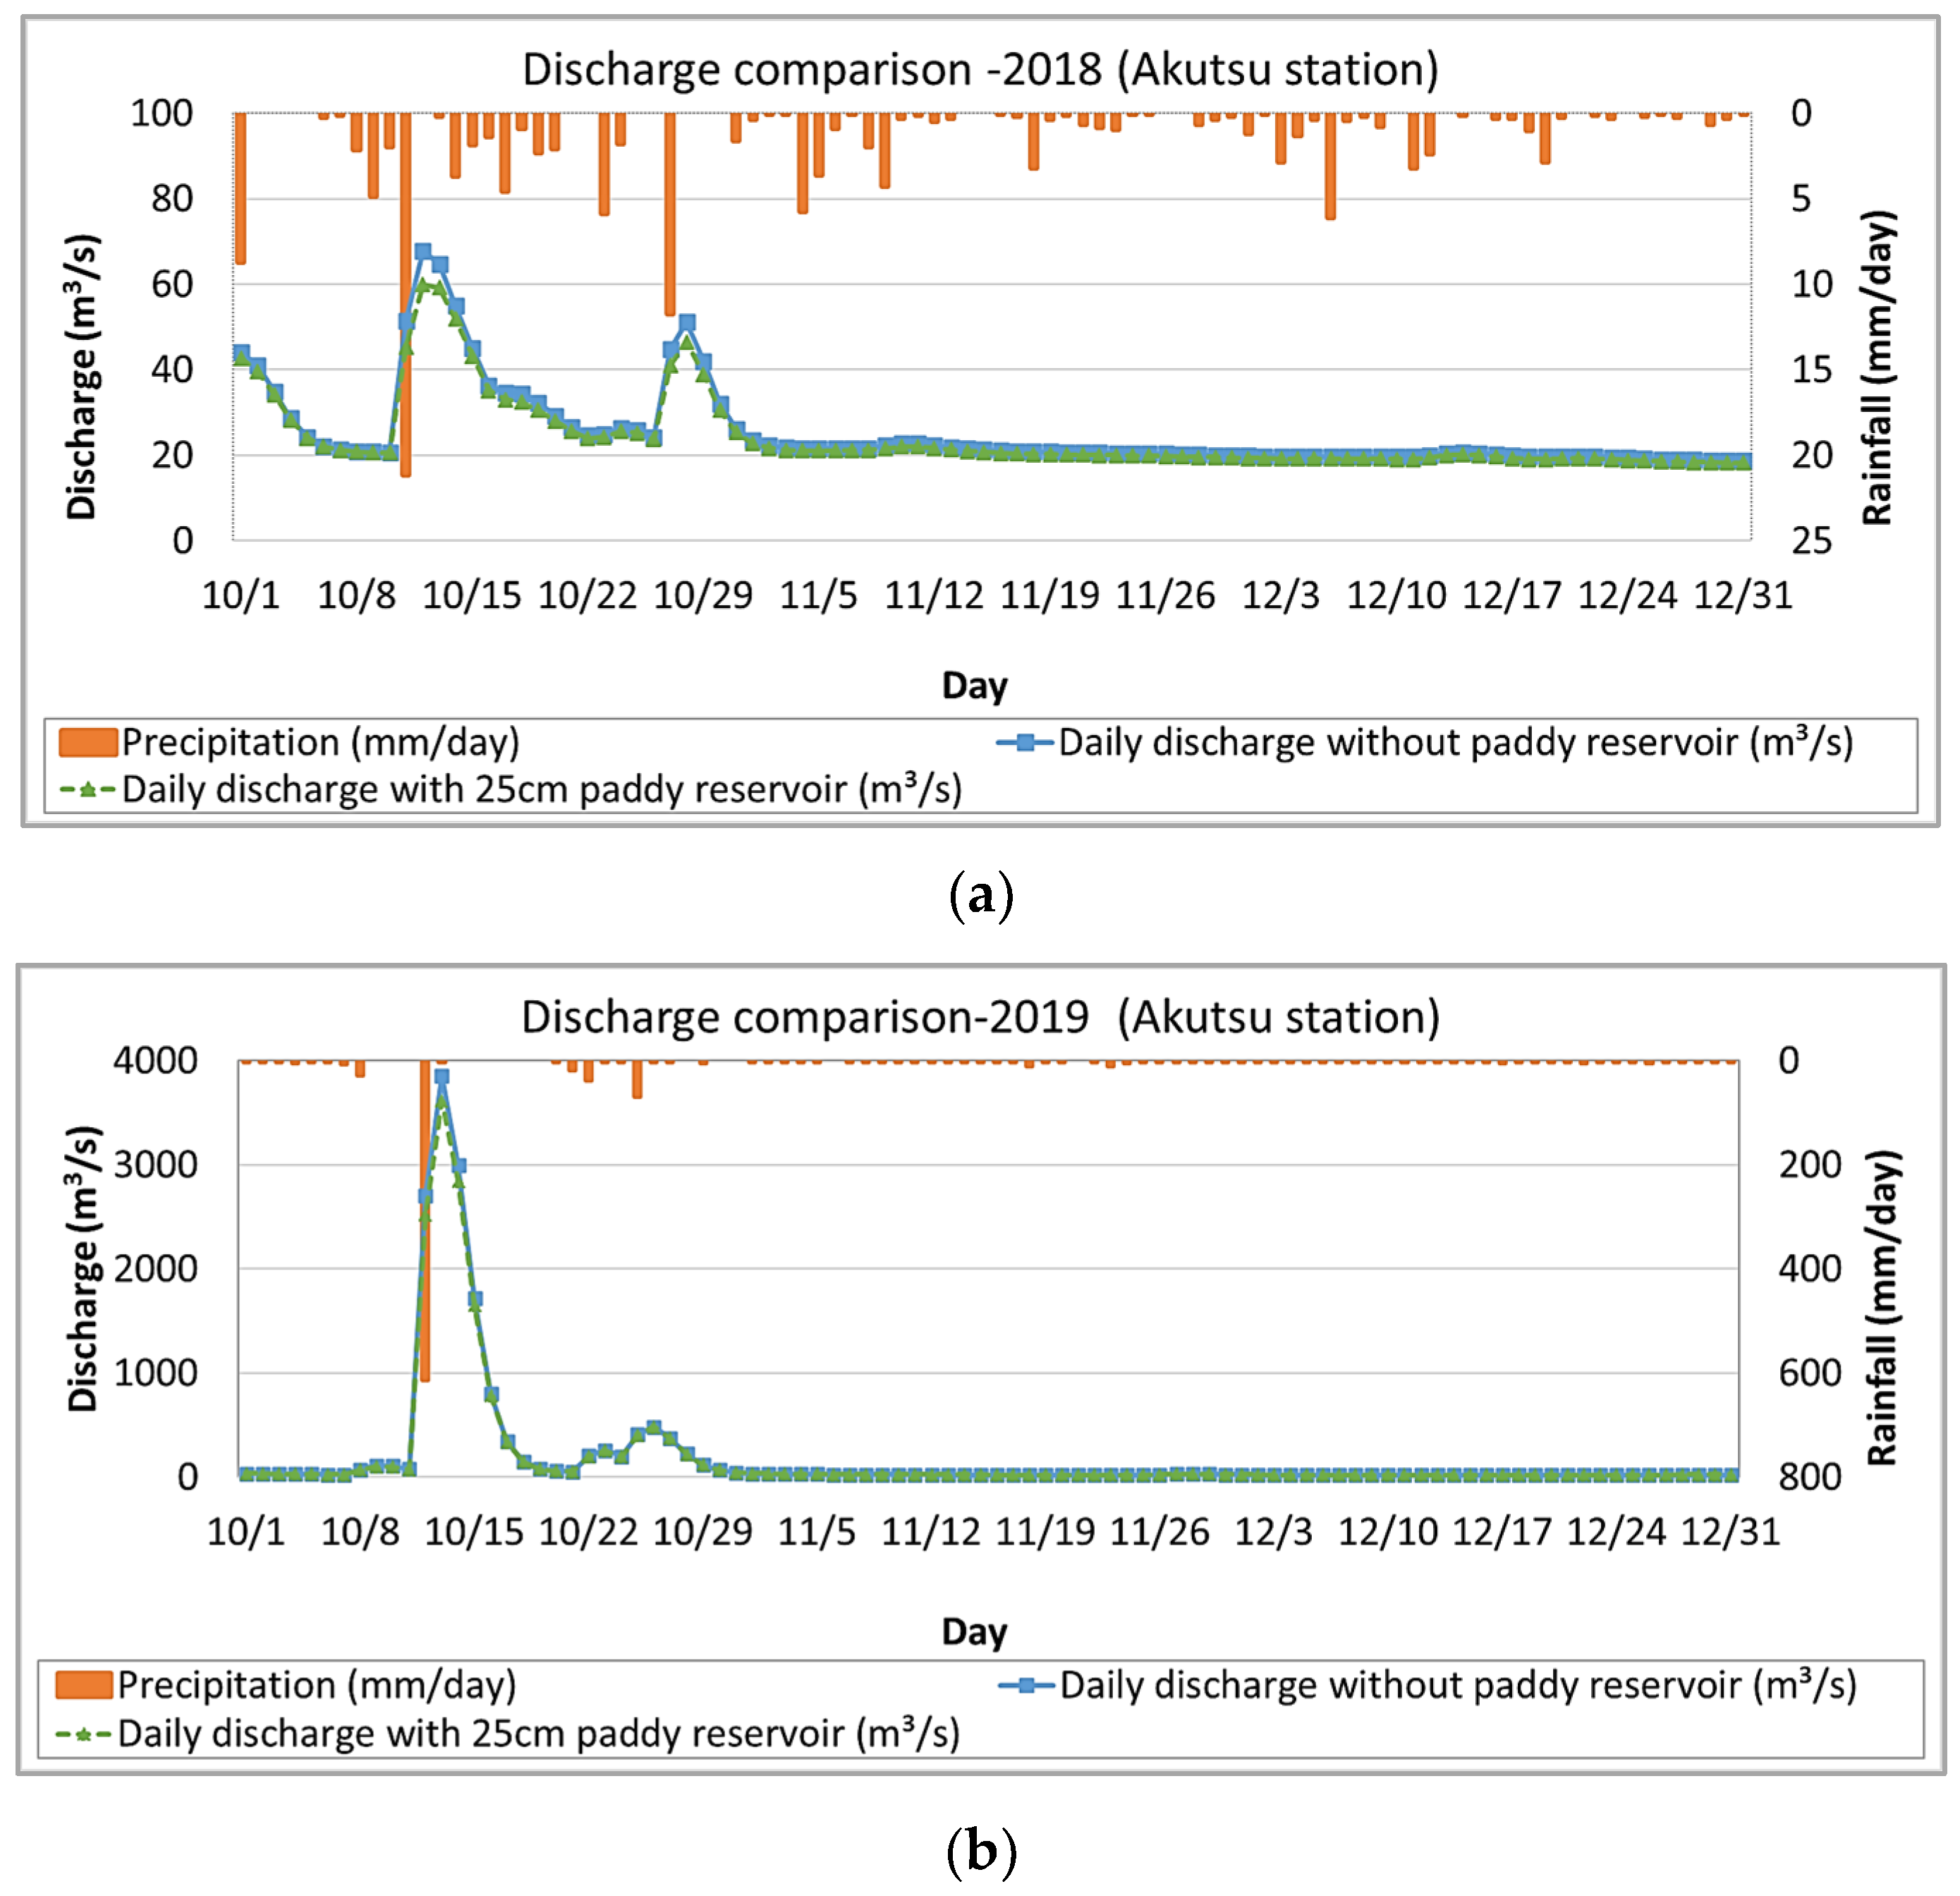
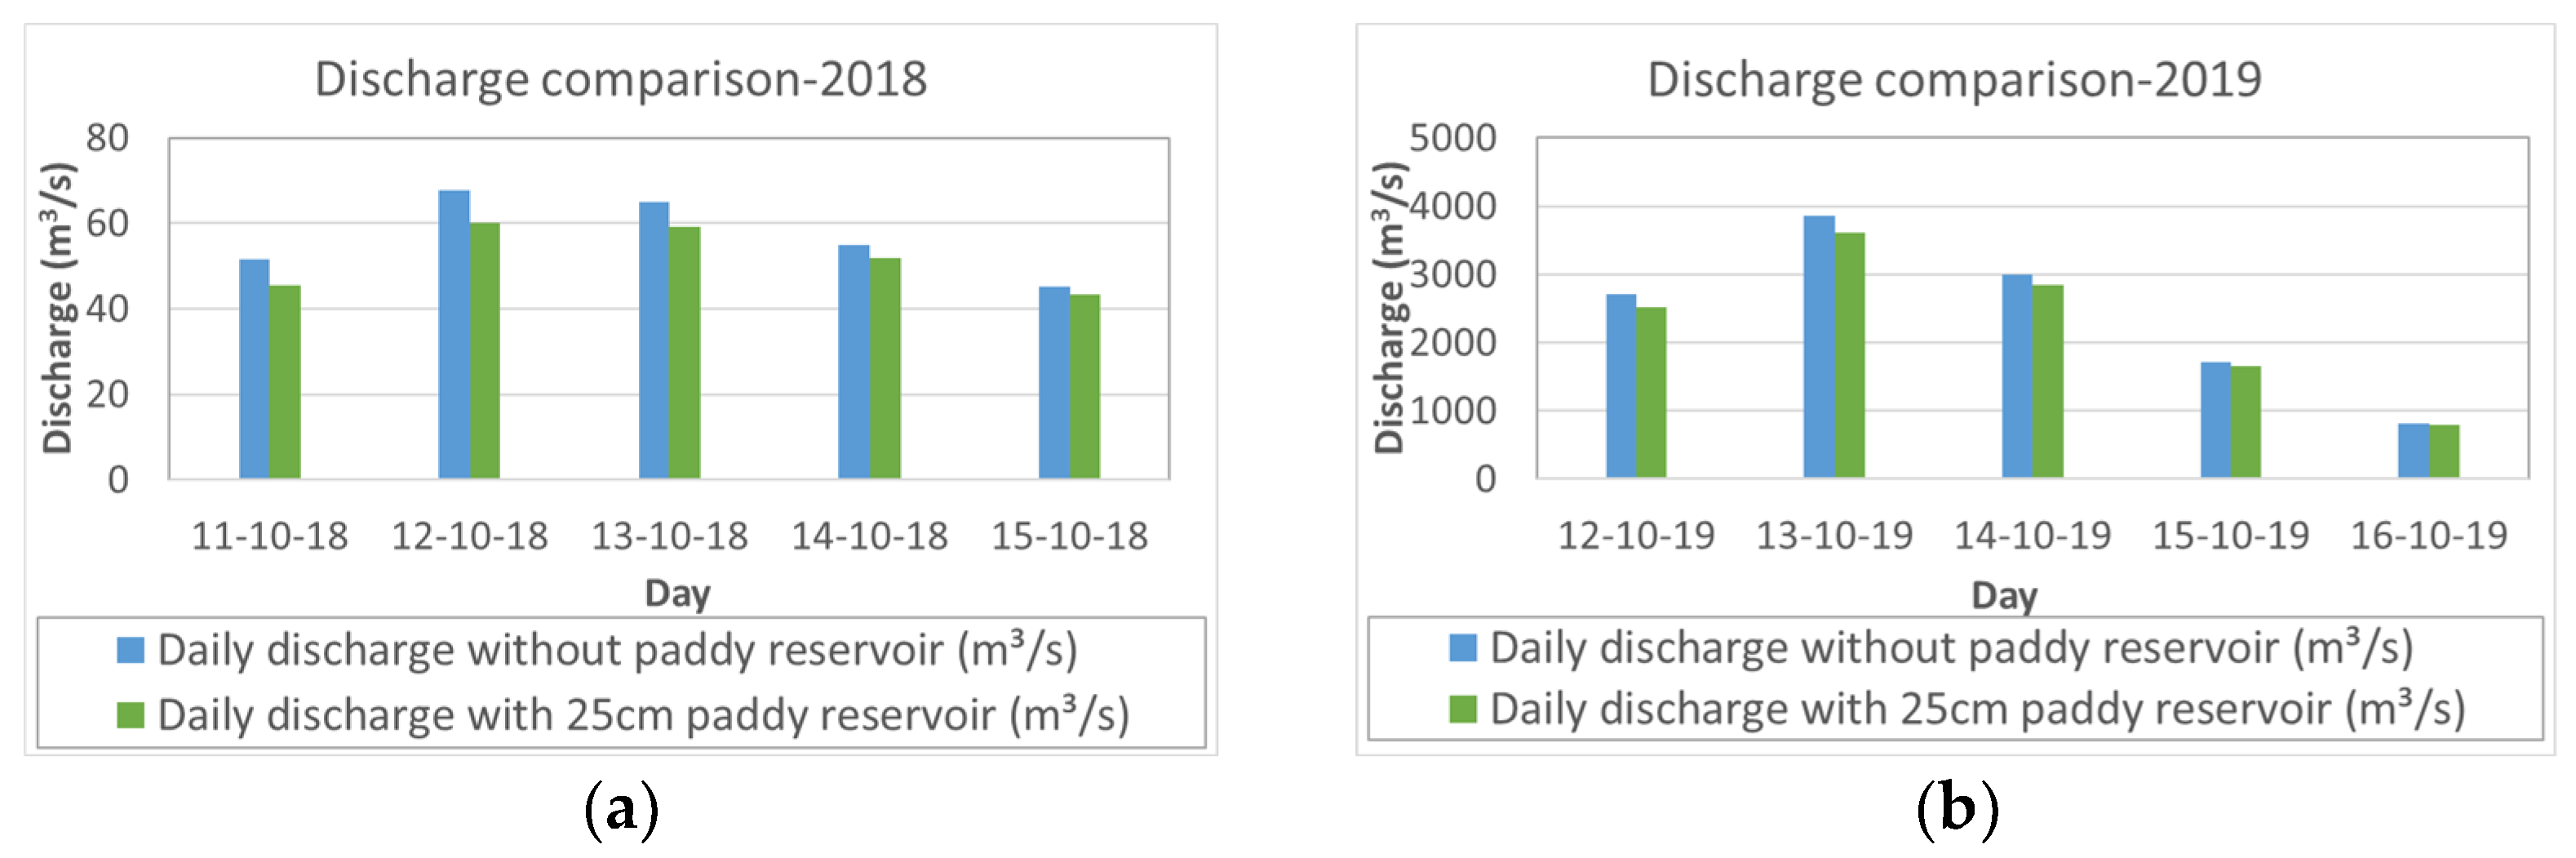
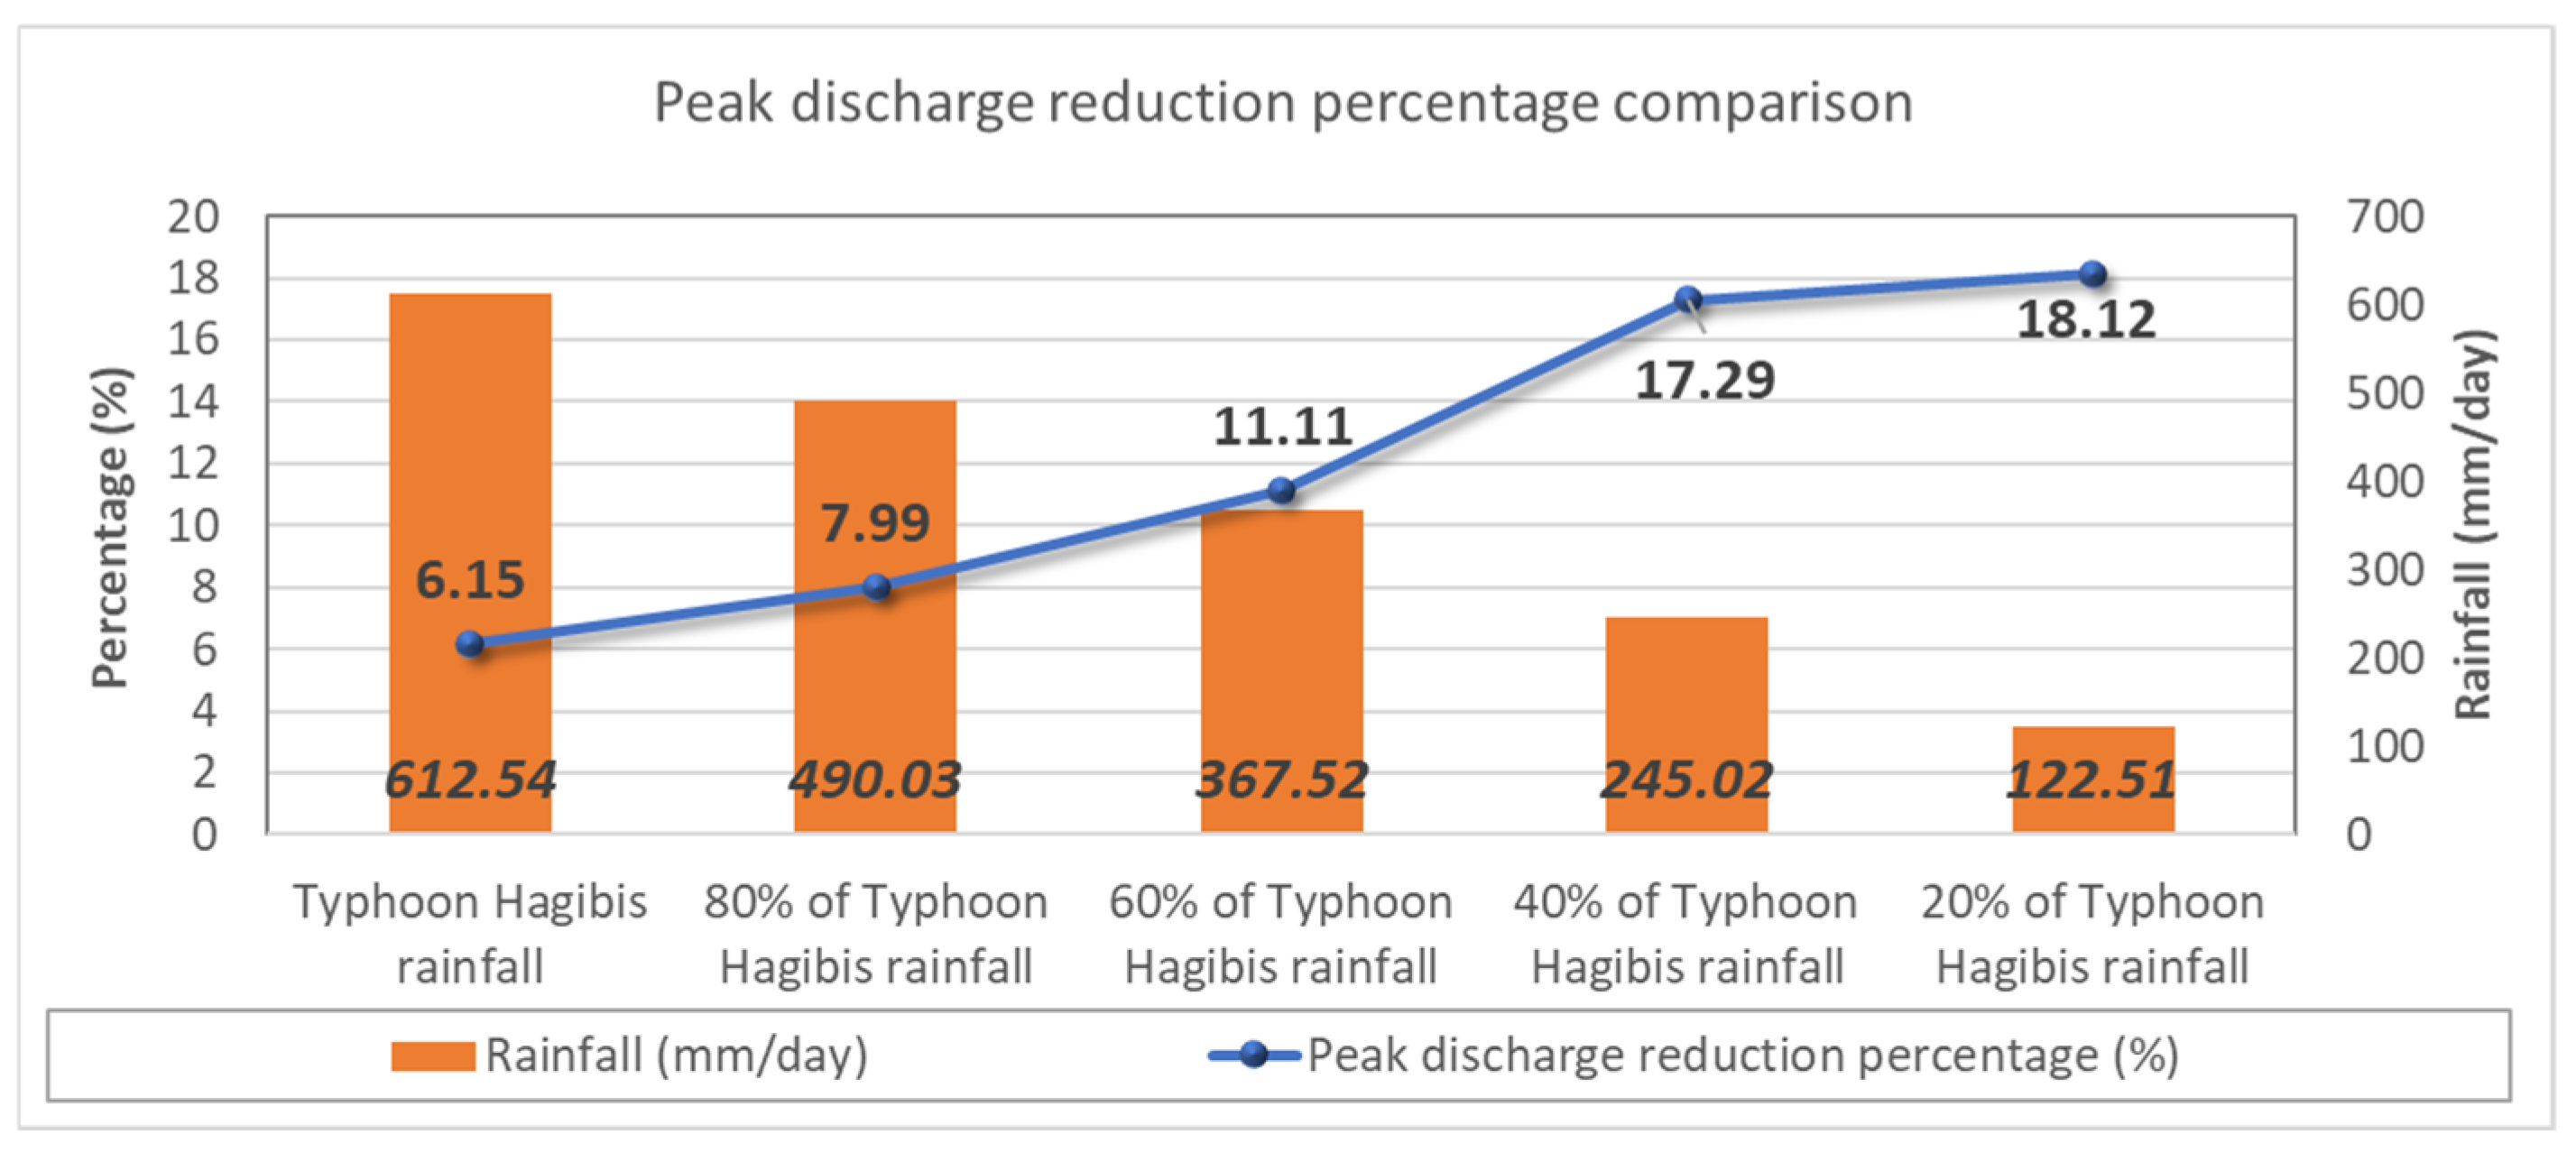
3.3. Effect of the Paddy Reservoir Strategy on Discharge Reduction

Using the newly added function of water storage within the paddy field embankments in H08, runoff from a paddy field after water storage was simulated, followed by daily discharge in the river channel. Because water storage within the paddy reservoir is primarily affected by changes in the moisture content within the paddy field, a comparison of the moisture levels between the two scenarios is shown in Figure 6, along with the rainfall and surface runoff.
In the case of 2018, Figure 6 shows that the moisture content under a no-storage scenario remained close to 150 kg/m2, which was the moisture storage capacity of soil under general conditions. However, when the drainage outlet was closed, the moisture-holding capacity was calculated as follows:
maximum moisture-holding capacity = [{soil depth × (saturation − permanent wilting point)} + storage capacity of 25 cm embankment] × density of water
= [{1 m × (50% − 15%)} + 0.25 m] × 1000 kg/m3 = 600 kg/m2
During October–December 2018, a few small rainfall events occurred, which increased the moisture content from the normal moisture level of the soil layer, but the content still remained much lower than the maximum holding capacity. A modified runoff calculation formula of the H08 model was used to calculate surface runoff when the moisture content exceeded the capacity and overflow occurred from the paddy field. Because there was no major rainfall in 2018, no surface runoff was generated from the paddy field, as can be seen from the zero-value line of surface runoff in Figure 6. This indicates that from October to December 2018, all of the stored water remained within the paddy reservoir for this duration.
On 12 October 2019, there was a major typhoon that generated 650 mm of rainfall, which caused a sharp increase in the moisture content. Because the amount of water exceeded the maximum moisture holding capacity, overflow from the paddy reservoir occurred. This is represented by the line for surface runoff in Figure 6. After 12 October, a few more days of rainfall events caused the moisture content to exceed the maximum capacity, as it was already high due to the typhoon rainfall. This caused a few more days of overflow from the paddy reservoir, generating surface runoff. For all other days, the surface runoff in Figure 6 was zero, meaning that all the water remained inside the paddy reservoir. The changes in the moisture content between the “paddy reservoir storage” and the “no storage” scenarios thus explain how the water storage within the paddy reservoir was calculated by the improved H08 model and how it affected the runoff. Each grid cell containing paddy fields generated this modified runoff from water storage, while the non-paddy area generated runoff in a conventional manner. This combined runoff traveled to the river channel, and river discharge was simulated based on the total runoff calculated from the land surface module of the H08 model. Figure 7 shows a discharge hydrograph for 2018 and 2019 under the “with” and “without” paddy reservoir scenarios. The location of the discharge hydrograph of this figure is in the region upstream of the Abukuma watershed, at observation station Akutsu (see Figure 2). This point was selected because it is close to a significant coverage area of paddy field, and the impact of the paddy reservoir storage could be assessed properly.
For both 2018 and 2019, the largest peak discharge reduction times are displayed in a separate figure with bar charts, as shown in Figure 8, where differences in the discharge values between the “with” and “without” paddy reservoir scenarios can be clearly observed.
For 2018, the peak river discharge reduction percentage was found to be 11.2% on 12 October, (the day with the largest peak during the October–December session), and therefore, this day had the largest reduction percentage (highlighted in Figure 8). This reduction indicates that when the outlet of the paddy field was kept closed in all model grid cells, and all the rainwater was stored within the embankment (as no runoff can be seen in Figure 6), the river discharge was about 11% less than when the outlet remained open and water freely drained towards the river. For 2019, the peak discharge reduction percentage was found to be 6.2% and occurred on 13 October, which was the day after Super Typhoon Hagibis. Because of the heavy rainfall and overflow of water from the paddy reservoirs (as seen in Figure 6), the peak discharge reduction was lower in 2019. However, this percentage was found at a location upstream of the river basin at observation station Akutsu (see Figure 2), and paddy field coverage was high in the areas adjacent to this location. In the midstream section of the river channel at Fushiguro station (see Figure 2), the discharge reduction percentages were 2% and 3% for 2018 and 2019, respectively, and a similar situation was observed in the downstream section as well, at Ejiri station (see Figure 2). In these two cases, the surrounding paddy field coverage is lower than in the case of Akutsu station, which is why the impact on the discharge reduction was lower. This indicates that peak discharge reduction depends on the distribution and location of the paddy fields in a river basin, and the upstream area appears to be a more effective region for applying a paddy reservoir strategy since the paddy field area percentage is much higher in this section than in the other parts of the river basin.
The year 2018 was a normal flood year, with precipitation during the October–December period reaching a maximum of 22 mm/day, while precipitation in 2019 was extremely high. Super Typhoon Hagibis was a 300-year return period event that caused very high rainfall intensity [41], reaching up to 650 mm on the typhoon’s landfall, and thus reducing the storage potential of the paddy reservoir. To test how a paddy reservoir might perform in terms of different precipitation amounts and under events of smaller magnitudes than Typhoon Hagibis, the precipitation from Typhoon Hagibis was reduced to create five hypothetical scenarios, and the peak flood reduction was determined for each of these cases. The precipitation scenarios consisted of five different rainfall amounts: 100%, 80%, 60%, 40%, and 20% of the rainfall from Typhoon Hagibis. Table 7 shows a summary of the peak discharge values for the “with” and “without” paddy storage scenarios corresponding to the different precipitation percentages, while Figure 9 shows how the amount of discharge reduction was represented as a percentage for these scenarios, along with their corresponding rainfall amount. Table 8 shows the relationship between the rainfall amount and maximum moisture-holding capacity of the paddy field leading to overflow of the paddy reservoir for each scenario. For this analysis, the simulation results for the Akutsu observation station (see Figure 2) in the upstream area of the river basin were selected as before.
The peak discharge reduction percentages from the comparison of the two scenarios are shown in Table 7 and Figure 9. The figure shows that with reduced precipitation, the peak reduction became increasingly significant, and the reduction percentage followed an increasing trend. In Table 8, it can be observed that for the 100% (i.e., Typhoon Hagibis) and 80% rainfall scenarios, the peak rainfall caused the moisture content of the paddy reservoir to exceed the holding capacity. This led to overflow and resulted in a smaller peak reduction percentage. For the 60% rainfall scenario, the amount of rainfall still remained high, but the total moisture content remained within the moisture-holding capacity of the paddy reservoir. However, for the first three scenarios, the amount of moisture remained close to the holding capacity, which caused a low percentage of peak reduction, and a flatter increasing trend with decreasing rainfall. When the rainfall amount decreased further, the moisture content remained well within the storage capacity of the paddy reservoir, as can be observed in Table 8. Therefore, the peak reduction percentage appeared to increase sharply, as seen by the comparison of the 60% and 40% Hagibis-rainfall scenarios. As this amount of rainfall did not cause any overflow or subsequent surface runoff, the peak discharge became lower, thus leading to an 18% peak discharge reduction compared to the “no paddy storage” scenario. This analysis points towards the importance of the rainfall amount in determining the potential for overflow from the paddy reservoir and its effectiveness.

4. Discussion

By using the improved H08 model, simulated river discharge from the Abukuma River under a paddy reservoir storage condition indicates that paddy reservoirs can provide an 11% peak reduction during a normal event and a 6% peak reduction during a major disaster. This reduction percentage is much lower than the simulated peak reduction values (about 30–40%) achieved by using the paddy field dam strategy in previous studies [11,12], which were conducted in river basins with more than 40% paddy field coverage. This might suggest that the effectiveness of paddy fields in flood management has been overestimated, and in particular, paddy fields may not be as efficient in large rivers when paddy coverage is less than 20%. Therefore, during a major disaster event, such as Typhoon Hagibis, the peak reduction percentage was very low (6%). However, the peak reduction percentage increased with decreasing precipitation, as shown in Figure 9, and the reduction percentage depended on whether the peak rainfall caused the moisture level within the paddy reservoir to exceed the maximum holding capacity of 600 kg/m2. Therefore, the maximum moisture-holding capacity is an important factor in the performance analysis of the paddy reservoir, and the inclusion of paddy reservoir storage in the improved H08 model allowed us to simulate the moisture content corresponding to the rainfall amount, which led to a determination of the overflow/surface runoff and subsequent river discharge.
The simulated discharge data under a paddy reservoir storage strategy shows that during a 300-year return period typhoon event, the use of paddy reservoirs with closed drainage can realize a 237 m3/s reduction in peak discharge (Table 7). This value itself may seem quite small when compared to the peak flood discharge of the Abukuma River, which is 7000 m3/s. However, according to the Abukuma River basin management plan, a 1200 m3/s peak discharge reduction is targeted by dam operation, which can reduce the peak flood discharge from 7000 m3/s to 5800 m3/s. The use of paddy reservoirs thus achieves about one-fourth of the peak reduction contribution by dam operation, although even a reduction of this size would be important when combined with the existing infrastructure. This is an important contribution to the Abukuma River flood management plan from a non-structural flood management strategy, which can be achieved with very low maintenance costs and an existing land type. This indicates that paddy reservoirs can have some positive effects on flood management on a major river, such as Abukuma, even during a major disaster, and practicing this strategy in the field could improve flood management when combined with existing structural measures.

5. Conclusions

In this study, we reviewed the previous studies regarding the impact of paddy fields on flood management and identified some limitations, including the absence of the impact assessment of large rivers with low paddy field coverage and limitations of the current hydrological models to satisfy the purpose of the proposed study. To address these issues, we improved the H08 model and conducted a watershed-scale simulation of peak discharge reduction within paddy reservoirs with closed drainage in the Abukuma River basin. The simulated results from the calibrated and validated H08 model with the newly added water storage capacity within paddy reservoirs show peak discharge reductions of 11.2% for 2018 and 6.2% for 2019 in the upstream section of the river basin with higher paddy field coverage, while the midstream and downstream sections (with low paddy coverage) show around 2% and 3% peak reductions for 2018 and 2019, respectively. This indicates that our improved H08 model can fairly assess the changes in daily river discharge due to paddy reservoir storage, and the peak reduction percentage data indicate that a paddy reservoir will be more effective during a normal event than during a major typhoon event. Moreover, in a major river basin with less than 20% paddy field coverage, the contribution of a paddy reservoir to flood peak reduction will not be very high. Higher peak rainfall causes overflow from the paddy reservoir, which can be understood from the maximum moisture-holding capacity of a paddy reservoir within a 25 cm embankment. However, a lower precipitation amount decreased the chance of overflow from a paddy reservoir, thereby increasing the peak reduction percentage. Even if a 6% peak reduction was observed during a major typhoon, the resulting 237 m3/s reduction in simulated discharge would still be expected to make an additional contribution to the river’s flood management plan in combination with dam operation, and it would do so without major construction or maintenance costs. Therefore, practicing a paddy reservoir strategy in the Abukuma River basin would have some positive effects when applied in combination with structural measures.
This study could be further improved by using better meteorological data to increase the model’s performance, as well as through a simulation in a finer spatial resolution than 5-arc min. Moreover, different drainage outlet control strategies can be investigated in other large river basin areas to point out higher potentials of paddy reservoirs in flood management. Furthermore, combining the research outcomes with the ICT technology can implement the easier and more frequent operation of paddy reservoirs for successful flood management. If this strategy were to be successfully adopted with the support of farmers and land owners, and a working public–private partnership between the end users and the implementing government organization was developed, then our present scientific analysis could be translated into practical application in major river basin areas of Japan and in other countries with similar geographical settings and large areas of available paddy fields.

Author Contributions

Research conceptualization and methodology development, D.S.; design and development of the model, N.H.; application of the model and analysis of simulation results, D.S., K.O. and H.K.; original draft preparation of the manuscript, D.S.; manuscript editing and revision, D.S., N.H., K.O. and K.Y. All authors have read and agreed to the published version of the manuscript.

Funding

This research was partly supported by the University of Tokyo, Department of Civil Engineering.

Institutional Review Board Statement

Not applicable.

Informed Consent Statement

Not applicable.

Data Availability Statement

The data presented in this study are available on request from the corresponding author. The data are not publicly available due to the reason that this research is a part of an academic study which has not been completed yet.

Conflicts of Interest

The authors declare no conflict of interest.

Appendix A

The equation for calculating “soil–water balance” in the “Land Surface Process Module” of the H08 model is as follows:
dW dt = Rainf + Snowf + Q sm E   Q s Q sb
where W = soil water content [kg/m2], Rainf = rainfall [kg/m2/s], Snowf = snowfall [kg/m2/s], Qsm = snow melt rate [kg/m2/s], E = evaporation [kg/m2/s], Qs = surface runoff [kg/m2/s] and Qsb = subsurface runoff [kg/m2/s].
Surface   runoff ,   Q s = W W f 0   W f < W W   W f
and   sub - surface   runoff ,   Q sb = W f τ   W W f Ɣ
where Wf = moisture content at the field capacity of the soil.

Appendix B

Behavior pattern of simulated discharge from calibration parameter changes:
Figure A1. Discharge response to soil depth (SD) change for (a) daily scale and (b) monthly scale.
Sustainability 15 06604 g0a1
Figure A2. Discharge response to bulk transfer coefficient (CD) change for (a) daily scale and (b) monthly scale.
Sustainability 15 06604 g0a2
Figure A3. Discharge response to shape parameter (Ɣ) change for (a) daily scale and (b) monthly scale.
Sustainability 15 06604 g0a3
Figure A4. Discharge response to time constant (τ) change for (a) daily scale and (b) monthly scale.
Sustainability 15 06604 g0a4
Discharge hydrograph in model validation points:
Figure A5. Discharge hydrograph of validation station: Yawata for (a) daily scale and (b) monthly scale.
Sustainability 15 06604 g0a5
Figure A6. Discharge hydrograph of validation station: Marumori for (a) daily scale and (b) monthly scale.
Sustainability 15 06604 g0a6
Figure A7. Discharge hydrograph of validation station: Nihonmatsu for (a) daily scale and (b) monthly scale.
Sustainability 15 06604 g0a7
Figure A8. Discharge hydrograph of validation station: Utsushigawa for (a) daily scale and (b) monthly scale.
Sustainability 15 06604 g0a8
Figure A9. Discharge hydrograph of validation station: Shirakawa for (a) daily scale and (b) monthly scale.
Sustainability 15 06604 g0a9
Figure A10. Scatterplots comparing the simulated and observed discharge at validation station: Yawata for (a) daily scale and (b) monthly scale.
Sustainability 15 06604 g0a10
Figure A11. Scatterplots comparing the simulated and observed discharge at validation station: Marumori for (a) daily scale and (b) monthly scale.
Sustainability 15 06604 g0a11
Figure A12. Scatterplots comparing the simulated and observed discharge at validation station: Nihonmatsu for (a) daily scale and (b) monthly scale.
Sustainability 15 06604 g0a12
Figure A13. Scatterplots comparing the simulated and observed discharge at validation station: Utsushigawa for (a) daily scale and (b) monthly scale.
Sustainability 15 06604 g0a13
Figure A14. Scatterplots comparing the simulated and observed discharge at validation station: Shirakawa for (a) daily scale and (b) monthly scale.
Sustainability 15 06604 g0a14

References

  1. Nakamura, S.; Oki, T. Paradigm shifts on flood risk management in Japan: Detecting triggers of design flood revisions in the modern era. Water Resour. Res. 2018, 54, 5504–5515. [Google Scholar] [CrossRef]
  2. Fan, J.; Huang, G. Evaluation of flood risk management in Japan through a recent case. Sustainability 2020, 12, 5357. [Google Scholar] [CrossRef]
  3. Nakamura, F.; Ishiyama, N.; Yamanaki, S.; Higa, M.; Akasaka, T.; Kobayashi, Y.; Ono, S.; Fuke, N.; Kitazawa, M.; Morimoto, J.; et al. Adaptation to climate change and conservation of biodiversity using green infrastructure, Innovative Approaches in River Management and Restoration. Wiley Online Libr. 2020, 36, 921–933. [Google Scholar] [CrossRef]
  4. Hai, P.T.; Masumoto, T.; Shimizu, K. Evaluation of flood regulation Role of paddies in the lower Mekong River basin using a 2D flood simulation model. Annu. J. Hydraul. Eng. JSCE 2006, 50, 73–78. [Google Scholar] [CrossRef]
  5. Sujono, J. Flood reduction function of paddy rice fields under different water saving irrigation techniques. J. Water Resour. Prot. 2010, 2, 555–559. [Google Scholar] [CrossRef] [Green Version]
  6. Kim, J.O.; Lee, S.H.; Jang, K.S. Efforts to improve biodiversity in paddy field ecosystem of South Korea. Reintroduction 2011, 1, 25–30. [Google Scholar]
  7. Hao, L.; Sun, G.; Liu, Y.; Wan, J.; Qin, M.; Qian, H.; Liu, C.; Zheng, J.; John, R.; Fan, P.; et al. Urbanization dramatically altered the water balances of a paddy field-dominated basin in southern China. Hydrol. Earth Syst. Sci. 2015, 19, 3319–3331. [Google Scholar] [CrossRef] [Green Version]
  8. Sari, P.; Legono, D.; Sujono, J. Performance of retarding basin in flood disaster risk mitigation in Welang River, East Java Province, Indonesia. J. Civ. Eng. Forum 2018, 4, 109–121. [Google Scholar] [CrossRef] [Green Version]
  9. Furuta, N.; Shimatani, Y. Integrating ecological perspectives into engineering practices—Perspectives and lessons from Japan. Int. J. Disaster Risk Reduct. 2018, 32, 87–94. [Google Scholar] [CrossRef]
  10. Yamada, Y.; Taki, K.; Yoshida, T.; Ichinose, T. An economic value for ecosystem-based disaster risk reduction using paddy fields in the kasumitei open levee system. Paddy Water Environ. 2022, 20, 215–226. [Google Scholar] [CrossRef]
  11. Yoshikawa, N.; Nagao, N.; Misawa, S. Watershed scale evaluation of flood mitigation function of paddy fields installed with runoff control devices. Proc. Agric. Rural Eng. Soc. 2009, 77, 273–280. [Google Scholar] [CrossRef]
  12. Miyazu, S.; Yoshikawa, N.; Abe, S.; Misawa, S. Economic evaluation of paddy field dam in the case of polder area. J. Jpn. Soc. Civ. Eng. 2013, 69, I_1531–I_1536. [Google Scholar] [CrossRef] [Green Version]
  13. Yoshikawa, N. Can paddy fields mitigate disasters? Possible use and technical aspects of the paddy field dam. In Socio-Ecological Restoration in Paddy-Dominated Landscapes; Nishikawa, U., Miyashita, T., Eds.; Springer: Tokyo, Japan, 2014; pp. 197–210. [Google Scholar] [CrossRef]
  14. Oishi, T.; Nakano, R.; Matsuno, Y. Perception and valuation of Paddy Field Dam functions by rural communities: A CVM approach. Paddy Water Environ. 2019, 17, 383–390. [Google Scholar] [CrossRef]
  15. Chai, Y.; Touge, Y.; Shi, K.; Kazama, S. Evaluating potential flood mitigation effect of paddy field dam for typhoon no. 19 in 2019 in the Naruse river basin. J. Jpn. Soc. Civ. Eng. 2020, 76, 295–303. [Google Scholar] [CrossRef]
  16. Kobayashi, K.; Kono, Y.; Kimura, T.; Tanakamaru, H. Estimation of paddy field dam effect on flood mitigation focusing on Suse region of Hyogo, Japan. Hydrol. Res. Lett. 2021, 15, 64–70. [Google Scholar] [CrossRef]
  17. Hatcho, N.; Yamasaki, K.; Hirofumi, O.; Kimura, M.; Matsuno, Y. Estimation of the function of a paddy field for reduction of flood risk. In Sustainability of Water Resources; Yadav, B., Mohanty, M.P., Pandey, A., Singh, V.P., Singh, R.D., Eds.; Water Science and Technology Library; Springer: Cham, Switzerland, 2022; Volume 116. [Google Scholar] [CrossRef]
  18. Unami, K.; Kawachi, T. Systematic assessment of flood mitigation in a tank irrigated paddy fields area. Paddy Water Environ. 2005, 3, 191–199. [Google Scholar] [CrossRef]
  19. Masumoto, T.; Yoshida, T.; Kubota, T. An index for evaluating the flood-prevention function of paddies. Paddy Water Environ. 2006, 4, 205–210. [Google Scholar] [CrossRef]
  20. Yoshikawa, N.; Miyazu, S.; Yasuda, H.; Misawa, S. Development of inundation analysis model for low-lying agricultural reservoir. J. Jpn. Soc. Civ. Eng. Ser. B1 2011, 67, 991–996. [Google Scholar] [CrossRef] [Green Version]
  21. Segawa, M.; Maruyama, T.; Takase, K. Estimation of unit flood discharge for various land use types with a focus on urbanization. Open J. Mod. Hydrol. 2016, 6, 195–211. [Google Scholar] [CrossRef] [Green Version]
  22. Tsuchiya, R.; Kato, T.; Jeong, J.; Arnold, J.G. Development of SWAT-paddy for simulating lowland paddy fields. Sustainability 2018, 10, 3246. [Google Scholar] [CrossRef] [Green Version]
  23. Hanasaki, N.; Kanae, S.; Oki, T.; Masuda, K.; Motoya, K.; Shirakawa, N.; Shen, Y.; Tanaka, K. An integrated model for the assessment of global water resources—Part 1: Model description and input meteorological forcing. Hydrol. Earth Syst. Sci. 2008, 12, 1007–1025. [Google Scholar] [CrossRef] [Green Version]
  24. Hanasaki, N.; Kanae, S.; Oki, T.; Masuda, K.; Motoya, K.; Shirakawa, N.; Shen, Y.; Tanaka, K. An integrated model for the assessment of global water resources—Part 2: Applications and assessments. Hydrol. Earth Syst. Sci. 2008, 12, 1027–1037. [Google Scholar] [CrossRef] [Green Version]
  25. Hanasaki, N.; Saito, Y.; Chaiyasaen, C.; Champathong, A.; Ekkawatpanit, C.; Saphaokham, S.; Sukhapunnaphan, T.; Sumdin, S.; Thongduang, J. A quasi-real-time hydrological simulation of the Chao Phraya River using meteorological data from the Thai Meteorological Department Automatic Weather Stations. Hydrol. Res. Lett. 2014, 8, 9–14. [Google Scholar] [CrossRef] [Green Version]
  26. Mateo, C.M.; Hanasaki, N.; Komori, D.; Tanaka, K.; Kiguchi, M.; Champathong, A.; Sukhapunnaphan, T.; Yamazaki, D.; Oki, T. Assessing the impacts of reservoir operation to floodplain inundation by combining hydrological, reservoir management, and hydrodynamic models. Water Resour. Res. 2014, 50, 7245–7266. [Google Scholar] [CrossRef]
  27. Masood, M.; Yeh, P.J.-F.; Hanasaki, N.; Takeuchi, K. Model study of the impacts of future climate change on the hydrology of Ganges-Brahmaputra-Meghna Basin. Hydrol. Earth Sci. 2015, 19, 747–770. [Google Scholar] [CrossRef] [Green Version]
  28. Hanasaki, N.; Matsuda, H.; Fujiwara, M.; Hirabayashi, Y.; Seto, S.; Kanae, S.; Oki, T. Toward hyper-resolution global hydrological models including human activities: Application to Kyushu Island, Japan. Hydrol. Earth. Syst. Sci. 2022, 26, 1953–1975. [Google Scholar] [CrossRef]
  29. Moriguchi, S.; Matsugi, H.; Ochiai, T.; Yoshikawa, S.; Inagaki, H.; Ueno, S.; Suzuki, M.; Tobita, Y.; Chida, T.; Takahashi, K.; et al. Survey report on damage caused by 2019 Typhoon Hagibis in Marumori Town, Miyagi Prefecture, Japan. Soil Found. 2021, 61, 586–599. [Google Scholar] [CrossRef]
  30. Konami, T.; Koga, H.; Kawatsura, A. Role of pre-disaster discussions on preparedness on consensus-making of integrated flood management (IFM) after a flood disaster, based on a case in the Abukuma River Basin, Fukushima, Japan. Int. J. Disaster Risk Reduct. 2021, 53, 102012. [Google Scholar] [CrossRef]
  31. Yamazaki, D.; Oki, T.; Kanae, S. Deriving a global river network map and its sub-grid topographic characteristics from a fine-resolution flow direction map. Hydrol. Earth Syst. Sci. 2009, 13, 2241–2251. [Google Scholar] [CrossRef] [Green Version]
  32. Yamazaki, D.; Kanae, S.; Kim, H.; Oki, T. A physically based description of floodplain inundation dynamics in a global river routing model. Water Resour. Res. 2011, 47, W04501. [Google Scholar] [CrossRef]
  33. Weedon, G.P.; Balsamo, G.; Bellouin, N.; Gomes, S.; Best, M.J.; Viterbo, P. The WFDEI meteorological forcing data set: WATCH Forcing Data methodology applied to ERA-Interim reanalysis data. Water Resour. Res. 2014, 50, 7505–7514. [Google Scholar] [CrossRef] [Green Version]
  34. Manabe, S. The atmospheric circulation and the hydrology of the earth’s surface. Mon. Weather. Rev. 1969, 97, 739–774. [Google Scholar] [CrossRef]
  35. Robock, A.; Vinnikov, K.Y.; Schlosser, A.; Speranskaya, N.A.; Xue, Y. Use of midlatitude soil moisture and meteorological observations to validate soil moisture simulations with biosphere and bucket models. J. Clim. 1995, 8, 15–35. [Google Scholar] [CrossRef]
  36. Oki, T.; Sud, Y.C. Design of total runoff integrating pathways TRIP: A global river channel network. Earth Interact. 1998, 2, 1–37. [Google Scholar] [CrossRef]
  37. Oki, T.; Nishimura, T.; Dirmeyer, P. Assessment of annual runoff from land surface models using Total Runoff Integrating Pathways (TRIP). J. Meteorol. Soc. Jpn. 1999, 77, 235–255. [Google Scholar] [CrossRef] [Green Version]
  38. Nash, J.E.; Sutcliffe, J.V. River flow forecasting through conceptual models. Part I- A discussion of principles. J. Hydrol. 1970, 10, 282–290. [Google Scholar] [CrossRef]
  39. Hanasaki, N.; Inuzuka, T.; Kanae, S.; Oki, T. An estimation of global virtual water flow and sources of water withdrawal for major crops and livestock products using a global hydrological model. J. Hydrol. 2010, 384, 232–244. [Google Scholar] [CrossRef]
  40. Moriasi, D.N.; Gitau, M.W.; Pai, N.; Daggupati, P. Hydrologic and water quality models: Performance measures and evaluation criteria. Trans. ASABE 2015, 58, 1763–1785. [Google Scholar] [CrossRef] [Green Version]
  41. Li, S.; Otto, F.E.L. The role of human-induced climate change in heavy rainfall events such as the one associated with Typhoon Hagibis. Clim. Chang. 2022, 172, 7. [Google Scholar] [CrossRef]
Figure 1. Methodological framework of this research (individual steps are marked with lowercase letters and explained in the sections below).
Sustainability 15 06604 g001
Figure 2. Abukuma River basin with paddy fields and main river channel, model calibration and validation points, discharge comparison points (C_St: Fushiguro, V_St_1: Yawata, V_St_2: Marumori, V_St_3: Nihonmatsu, V_St_4: Utushigawa, V_St_5: Shirakawa, us_St: Akutsu, ds_St: Ejiri).
Sustainability 15 06604 g002
Figure 3. Water retention in the soil layer and over the ground in a paddy field with a closed drainage outlet (H08 model assumption), and no drainage condition from the paddy reservoir upon drainage outlet closure.
Sustainability 15 06604 g003
Figure 4. Calibrated discharge hydrographs on (a) a daily scale and (b) a monthly scale for 2018 at Fushiguro Station.
Sustainability 15 06604 g004
Figure 5. Scatterplots comparing the simulated and observed discharge on (a) a daily scale and (b) a monthly scale for 2018 at Fushiguro Station (blue dashed and orange lines indicate the trend lines for simulated discharge in the default model and the calibrated model simulations, respectively).
Sustainability 15 06604 g005
Figure 6. Rainfall, moisture content within a model grid, and subsequent surface runoff for (a) 2018 and (b) 2019.
Sustainability 15 06604 g006
Figure 7. Simulated daily discharge hydrographs for the paddy reservoir in (a) 2018 and (b) 2019 (at Akutsu station).
Sustainability 15 06604 g007
Figure 8. Largest peak discharge reduction days for (a) 2018 and (b) 2019.
Sustainability 15 06604 g008
Figure 9. Peak discharge reduction percentage during different precipitation scenarios based on Typhoon Hagibis.
Sustainability 15 06604 g009
Table 1. Input data used in this study.
Description of the VariableSource
Digital elevation map (DEM), basin maskGlobal river network map of CaMaFlood (Downscaled from 0.5° to 5-min)
Meteorological data: air temperature, longwave downward radiation, shortwave downward radiation, surface pressure, wind speed, rainfall rate, snowfall rate, specific humidity, and albedoWFD ERA-Interim (2018)
JAXA Today’s Earth (2019)
(Downscaled from 0.5° to 5-min)
Observed river dischargeMLIT database
River basin area (shape file)MLIT database
Land use map (paddy field area)JAXA-EORC HRLULC (30 m resolution)
Table 2. Calibration parameters and range of values for assessment.
ParameterRange SelectedBest Value
SD0.5–3.0 m0.5 m
CD0.001–0.0040.001
Ɣ1.0–2.51.0
τ50–200 days200 days
Table 3. Improvement in simulation errors.
Model DefaultAfter Calibration
NSE (daily)0.410.50
NSE (monthly)0.460.82
Table 4. Improvement in the coefficient of determination index (R2).
Model DefaultAfter Calibration
R2 (daily)0.510.55
R2 (monthly)0.860.94
Table 5. Simulation errors in model validation locations.
NSE (Daily)NSE (Monthly)
Model DefaultValidationModel DefaultValidation
Yawata0.380.520.350.86
Marumori0.210.470.150.82
Nihonmatsu0.460.560.260.85
Utushigawa0.440.580.590.82
Shirakawa0.420.500.680.85
Table 6. The coefficients of the determination indices (R2) for the model validation locations.
R2 (Daily)R2 (Monthly)
Model DefaultValidationModel DefaultValidation
Yawata0.490.540.830.92
Marumori0.460.560.790.91
Nihonmatsu0.540.570.700.87
Utushigawa0.660.680.750.82
Shirakawa0.500.600.780.86
Table 7. Peak discharge for different precipitation scenarios compared to 2019.
Peak Discharge
(m3/s)
Typhoon Hagibis Rainfall80% of Hagibis Rainfall60% of Hagibis Rainfall40% of Hagibis Rainfall20% of Hagibis Rainfall
Without paddy reservoir3853.003061.862239.841329.29174.37
With paddy reservoir3616.002817.111990.921099.50142.78
Discharge reduction 237.00244.75248.92229.7931.59
Reduction percentage (%)6.157.9911.1117.2918.12
Table 8. Relationship of rainfall, moisture holding capacity, and peak discharge.
Typhoon Hagibis Rainfall80% of Hagibis Rainfall60% of Hagibis Rainfall40% of Hagibis Rainfall20% of Hagibis Rainfall
Previous day moisture content (kg/m2)~150~150~150~150~150
Peak rainfall (mm)612.54490.03367.52245.02122.51
Total moisture (kg/m2)762.54640.03517.52395.02272.51
Overflow condition from paddy reservoir>600 kg/m2
Overflow
>600 kg/m2
Overflow
<600 kg/m2
No overflow
<600 kg/m2
No overflow
<600 kg/m2
No overflow
Disclaimer/Publisher’s Note: The statements, opinions and data contained in all publications are solely those of the individual author(s) and contributor(s) and not of MDPI and/or the editor(s). MDPI and/or the editor(s) disclaim responsibility for any injury to people or property resulting from any ideas, methods, instructions or products referred to in the content.

